clifton corridor transit initiative project development and nepa new … · clifton corridor...
TRANSCRIPT
Clifton Corridor Transit Initiative
Project Development and NEPA
New Starts Assessment
Phase 1
Environmental Review and Alternative Refinement
Prepared for:
Metropolitan Atlanta Rapid Transit Authority
Prepared by: AECOM/JACOBS-JJG Joint Venture
Atlanta, GA
September 2013
Clifton Corridor Transit Initiative Project Development and NEPA Phase 1 Environmental Review and Alternative Refinement
New Starts Assessment
Clifton Corridor Transit Initiative i September 2013
Table of Contents
1.0 INTRODUCTION ........................................................................................................................ 1
1.1 New Starts Criteria and Project Evaluation Process ........................................................ 1
1.1.1 Project Justification Criteria ............................................................................................ 1 1.1.2 Local Financial Commitment ........................................................................................... 2 1.1.3 Overall Project Rating ..................................................................................................... 3
1.2 Study Area Description ........................................................................................................ 3
2.0 LOCALLY PREFERRED ALTERNATIVE (LPA) ...................................................................... 4
3.0 EVALUATION CRITERIA (PHASE I) ........................................................................................ 5
3.1 Mobility Improvements ......................................................................................................... 5
3.1.1 Travel Demand Model ..................................................................................................... 5 3.1.2 Networks ......................................................................................................................... 5 3.1.3 Mobility Measure ............................................................................................................. 6
3.2 Cost Effectiveness ................................................................................................................ 7
3.3 Land Use and Economic Development .............................................................................. 9
3.3.1 Land Use ......................................................................................................................... 9 3.3.2 Economic Development ................................................................................................ 18
4.0 EVALUATION INPUTS ............................................................................................................ 29
4.1 O&M Assumptions/Productions ....................................................................................... 29
4.1.1 Methodology .................................................................................................................. 29 4.1.2 LRT Operating Assumptions ......................................................................................... 30 4.1.3 O&M Cost Items and Supply Variables ........................................................................ 30 4.1.4 Productivity Ratios and Unit Costs................................................................................ 31 4.1.5 O&M Cost Model Results .............................................................................................. 31
4.2 Key Performance Data ....................................................................................................... 34
4.2.1 Bus Service ................................................................................................................... 34 4.2.2. Local Standards ............................................................................................................ 38 4.2.3 Fares ............................................................................................................................. 39
4.3 Station Demand................................................................................................................... 40
4.3.1 Full Alignment Analysis ................................................................................................. 41 4.3.2 Minimum Operable Segment Analysis .......................................................................... 42
Clifton Corridor Transit Initiative Project Development and NEPA Phase 1 Environmental Review and Alternative Refinement
New Starts Assessment
Clifton Corridor Transit Initiative ii September 2013
4.4 Capital Cost and Schedule ................................................................................................ 42
4.4.1 Methodology .................................................................................................................. 43 4.4.2 Assumptions .................................................................................................................. 43 4.4.3 Capital Cost Estimates .................................................................................................. 47 4.4.4 Project Schedule ........................................................................................................... 47
5.0 SUMMARY ............................................................................................................................... 48
List of Tables
Table 3-1: Mobility Improvement Breakpoints ....................................................................................... 6
Table 3-2: Current Year 2010 Mobility Measure.................................................................................... 6
Table 3-3: Horizon Year 2040 Mobility Measure ................................................................................... 7
Table 3-4: Weighted Mobility Measure .................................................................................................. 7
Table 3-5: Cost Effectiveness Breakpoints ............................................................................................ 8
Table 3-6: Annualized Capital and Operating Costs ............................................................................. 8
Table 3-7: Current Year 2010 Cost Effectiveness ................................................................................. 8
Table 3-8: Horizon Year 2040 Cost Effectiveness................................................................................. 9
Table 3-9: Weighted Cost Effectiveness................................................................................................ 9
Table 3-10: Population Density Breakpoints ....................................................................................... 10
Table 3-11: Employment Served by System ....................................................................................... 10
Table 3-12: Existing Land Use Composition ....................................................................................... 15
Table 3-13: CBD Typical Parking Cost per Day Breakpoints .............................................................. 16
Table 3-14: CBD Spaces per Employee .............................................................................................. 16
Table 3-15: Parking Inventory at Major Activity Centers ..................................................................... 17
Table 3-16: Proportion of Legally Binding Affordability Restricted Housing in the Project Corridor Compared to Counties ......................................................................................................................... 17
Table 3-17: Estimated Economic Development Ratings ..................................................................... 18
Table 3-18: Future Land Use Composition .......................................................................................... 24
Clifton Corridor Transit Initiative Project Development and NEPA Phase 1 Environmental Review and Alternative Refinement
New Starts Assessment
Clifton Corridor Transit Initiative iii September 2013
Table 3-19: Estimated Economic Development Ratings ..................................................................... 28
Table 4-1: Clifton Corridor Light Rail Transit Operating Assumptions ................................................ 30
Table 4-2: Units of Service for LRT Alternative ................................................................................... 31
Table 4-3: LPA Annual O & M Cost Estimate (2013 Dollars) .............................................................. 33
Table 4-4: Service Characteristics/Operating Assumptions ................................................................ 34
Table 4-5: Feeder Bus and Emory Shuttle Service ............................................................................. 35
Table 4-6: MARTA Bus Service Characteristics .................................................................................. 37
Table 4-7: Emory Shuttle Service Characteristics*.............................................................................. 38
Table 4-8: Bus Feeder Routes Operating Statistics ............................................................................ 38
Table 4-9: Estimated Emory Shuttle Operating Statistics ................................................................... 38
Table 4-10: Fares Fares current of October 2013 ............................................................................... 40
Table 4-11: Full Alignment Daily Station Boardings ............................................................................ 41
Table 4-12: Study Area Population and Employment ......................................................................... 41
Table 4-13: Full Alignment Daily New Transit System Riders ............................................................. 41
Table 4-14: MOS Station Boardings .................................................................................................... 42
Table 4-15: MOS New Transit System Riders ..................................................................................... 42
Table 4-16: Capital Costs (Millions) ..................................................................................................... 47
Table 4-17: Capital Costs (Main) - LPA Lindbergh Center to Avondale Station ................................. 48
Table 4-18: Proposed DBB Project Schedule ..................................................................................... 50
List of Figures
Figure 2-1: Clifton Corridor Draft LPA and Study Area ......................................................................... 4
Figure 3-1: 2010 Population Density ................................................................................................... 11
Figure 3-2: 2040 Population Density ................................................................................................... 12
Figure 3-3: Projected Employment Growth 2010-2040 ....................................................................... 13
Clifton Corridor Transit Initiative Project Development and NEPA Phase 1 Environmental Review and Alternative Refinement
New Starts Assessment
Clifton Corridor Transit Initiative iv September 2013
Figure 3-4: Existing Land Use.............................................................................................................. 15
Figure 3-5: Future Land Use ................................................................................................................ 24
Figure 3-6: Redevelopment Characteristics ........................................................................................ 27
Clifton Corridor Transit Initiative Project Development and NEPA Phase 1 Environmental Review and Alternative Refinement
New Starts Assessment
Clifton Corridor Transit Initiative 1 September 2013
1.0 INTRODUCTION
The Draft New Starts Assessment Report is designed to provide an overview of the Clifton Corridor Locally Preferred Alternative (LPA) and how it meets the Federal Transit Administration’s (FTA’s) New Starts Moving Ahead for Progress in the 21
st Century (MAP-21) evaluation measures for
mobility improvements, cost effectiveness, land use, and economic development. The evaluation measures are based on the recently released FTA New Starts and Small Starts Evaluation and Rating Process Final Policy Guidance (August 2013).
1
This report also summarizes the MAP-21 New Starts criteria and evaluation process, Clifton Corridor study area, revised LPA, as well as key inputs from Phase 1 of the Clifton Corridor Transit Initiative project. These key inputs include:
Operating and maintenance (O&M) cost assumptions
Key performance data
Station demand
Capital cost and project schedule
A comprehensive New Starts Assessment Report will be prepared during Phase 2 of the Clifton Corridor Transit Initiative project and will include the evaluation of all MAP-21 New Starts measures, including environmental improvements and local financial commitment measures that were not addressed during Phase 1.
1.1 New Starts Criteria and Project Evaluation Process
The overall FTA evaluation process for projects seeking New Starts funding is based on the project’s ability to meet project justification and local financial commitment criteria, as required by MAP-21 and included in the final rule published January 9, 2013. The final policy guidance for the New and Small Starts Evaluation and Rating Process was released by FTA in August 2013 and is the basis of the New Starts criteria and evaluation process discussed in this section.
All proposed New Starts projects are evaluated and rated according to statutory project justification criteria and local financial commitment. The ratings for individual criteria are factored into an overall project rating that affects a project’s ability to advance through project development phases. The criteria and the overall project ranking are discussed below.
1.1.1 Project Justification Criteria
The MAP-21 project justification criteria rated by FTA include:
Mobility improvements: measured by the total number of linked trips using the project,
with a weight of two applied to trips made by transit-dependent riders. The analysis must be prepared for current year and may also be developed for a 10-year or 20-year horizon year.
Environmental improvements: based on the dollar value of the anticipated direct and indirect human health, safety, energy, and air quality benefits divided by the annualized
1 US DOT Federal Transit Administration, New and Small Starts Evaluation and Rating Process, Final Policy
Guidance, August 2013. Accessed at: http://www.fta.dot.gov/documents/NS-SS_Final_PolicyGuidance_August_2013.pdf
Clifton Corridor Transit Initiative Project Development and NEPA Phase 1 Environmental Review and Alternative Refinement
New Starts Assessment
Clifton Corridor Transit Initiative 2 September 2013
capital and operating cost of the project. The analysis must be prepared for current year and may also be developed for a 10-year or 20-year horizon year.
Congestion relief: measures are still being developed by FTA. As a result, FTA will assign a medium rating for congestion relief for all projects until the measure is developed.
Economic development effects: measured by the extent to which a project is likely to induce additional transit-supportive development in the future based on a qualitative analysis of existing local plans and policies to support economic development in the project study area. Plans and polices in place are rated on:
o Growth management
o Transit-supportive current policies
o Supportive zoning near transit
o Tools to implement transit-supportive plans and policies
o Performance of transit-supportive plans and policies
o Potential impact of transit project on regional development
o Plans and policies to maintain or increase affordable housing in corridor
An optional quantitative analysis may also be undertaken; however, a methodology and breakpoints are not currently specified by FTA.
Land use: includes an examination of existing corridor and station area development, development character, pedestrian facilities (including access for persons with disabilities), parking supply, and the proportion of existing legally binding affordability restricted housing within the project corridor to the proportion of legally binding affordability restricted housing in the counties through which the project travels. Ratings are based on:
o Station area (½ mile radius) employment served by the system
o Station area (½ mile radius) average population density (persons/square mile)
o Typical cost of parking per day in the Central Business District (CBD)
o Parking spaces per employee in the CBD
o Proportion of legally binding affordability restricted housing in the ½ mile station areas compared to the proportion in the counties through which the project travels
Pedestrian facilities do not have their own rating; however, the quality of the existing pedestrian facilities may adjust the overall land use rating upwards or downwards, particularly for those projects that are on the margins of ratings. Pedestrian access is important because it impacts the effective population and employment directly served by the system.
Cost-effectiveness: is the annualized capital and O&M cost per trip (total estimated linked
trips using the project) for the project. The analysis must be prepared for current year and
may also be developed for a 10-year or 20-year horizon year.
Under the new final rule, all six project justification measures are weighted equally for the summary
project justification rating.
1.1.2 Local Financial Commitment
FTA is also required to evaluate and rate local financial commitment of the proposed New Starts project. Projects must prepare a financial plan and 20-year cash flow statement. Projects must demonstrate an acceptable degree of financial commitment, including reasonable contingency amounts, stable and dependable capital and operating funding sources, and sufficient local
Clifton Corridor Transit Initiative Project Development and NEPA Phase 1 Environmental Review and Alternative Refinement
New Starts Assessment
Clifton Corridor Transit Initiative 3 September 2013
resources to recapitalize, maintain, and operate the overall existing and proposed public transportation system without a reduction in existing services. The financial plan is rated on:
Current financial condition for both capital and operating of the project sponsor and/or relevant project partners
Commitment of funds for both the capital cost of the project as well as the ongoing system Operating and Maintenance (O&M) costs, which includes an evaluation of the proposed share of total project capital costs from sources other than the Section 5309 New Starts program
Reasonableness of the financial plan, including assumptions, cost estimates, and capacity to withstand funding shortfalls or cost overruns
Under the new final rule, the reliability/capacity rating makes up 50 percent of the summary local financial commitment rating, while current financial condition and commitment of funds ratings respectively account for 25 percent of the summary rating.
1.1.3 Overall Project Rating
Each criterion is rated on a five point scale from low to high; summary project justification and local financial commitment ratings are combined to determine the overall project rating. Future FTA rulemaking will address MAP-21 changes. However, current FTA guidelines allow for a 50 percent weight to the summary project justification rating and 50 percent weight to the summary local financial commitment rating to develop the overall project rating. FTA requires at least a medium rating on both the project justification and local financial commitment in order to obtain a medium or better overall project rating.
1.2 Study Area Description
The Clifton Corridor study area extends between the MARTA Lindbergh Center station and the MARTA Avondale station in Decatur. The broader study area extends as far north as I-85 and south of the MARTA East Line. A more defined corridor for transit improvements centers along the CSX Railroad, Clifton Road, N. Decatur Road and DeKalb Industrial Way. The study area includes employment centers and the City of Decatur in west-central DeKalb County and some of the largest activity centers in metro Atlanta that are without convenient access to the interstate system or MARTA rail connections. These conditions have created high levels of traffic congestion on a severely limited network of roadways. The study area is home to a number of well-established residential communities and several major employers such as Emory University, Emory Healthcare, the Centers for Disease Control and Prevention (CDC), the Veterans Administration Medical Center and Regional Offices, and the DeKalb Medical Center.
Clifton Corridor Transit Initiative Project Development and NEPA Phase 1 Environmental Review and Alternative Refinement
New Starts Assessment
Clifton Corridor Transit Initiative 4 September 2013
2.0 LOCALLY PREFERRED ALTERNATIVE (LPA)
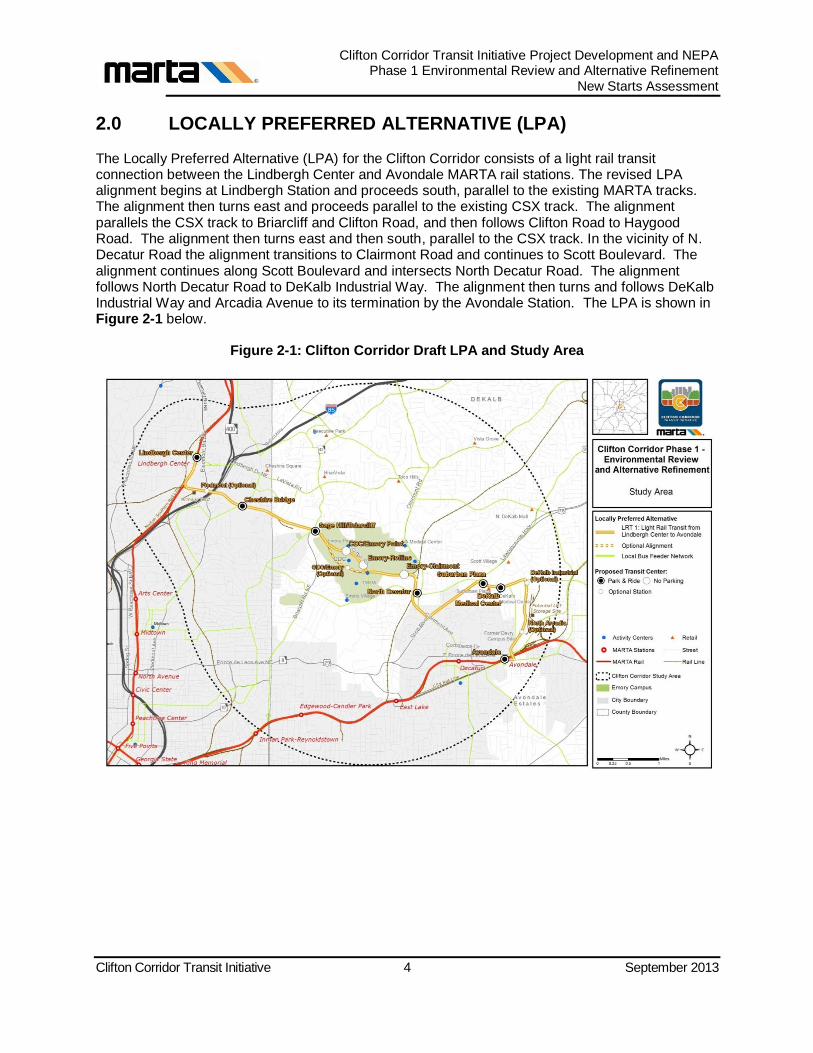
The Locally Preferred Alternative (LPA) for the Clifton Corridor consists of a light rail transit connection between the Lindbergh Center and Avondale MARTA rail stations. The revised LPA alignment begins at Lindbergh Station and proceeds south, parallel to the existing MARTA tracks. The alignment then turns east and proceeds parallel to the existing CSX track. The alignment parallels the CSX track to Briarcliff and Clifton Road, and then follows Clifton Road to Haygood Road. The alignment then turns east and then south, parallel to the CSX track. In the vicinity of N. Decatur Road the alignment transitions to Clairmont Road and continues to Scott Boulevard. The alignment continues along Scott Boulevard and intersects North Decatur Road. The alignment follows North Decatur Road to DeKalb Industrial Way. The alignment then turns and follows DeKalb Industrial Way and Arcadia Avenue to its termination by the Avondale Station. The LPA is shown in Figure 2-1 below.
Figure 2-1: Clifton Corridor Draft LPA and Study Area
Clifton Corridor Transit Initiative Project Development and NEPA Phase 1 Environmental Review and Alternative Refinement
New Starts Assessment
Clifton Corridor Transit Initiative 5 September 2013
3.0 EVALUATION CRITERIA (PHASE I)
The chapter summarizes the information necessary to support the project justification criteria and the results of the LPA evaluation and ratings for mobility improvements, cost effectiveness, land use, and economic development. The ratings are based on FTA’s final policy guidance (August 2013). The ratings for the environmental project justification criteria and the local financial commitment criteria are not included in the report because the analysis for these components was not included in Phase 1. The environmental and local financial commitment criteria will be developed and evaluated as part of Phase 2.
3.1 Mobility Improvements
This section includes discussion of the travel demand model, networks, and an assessment of project justification ratings for mobility improvements utilizing FTA’s final policy guidance.
3.1.1 Travel Demand Model
The regional travel demand model maintained by the Atlanta Regional Commission (ARC) was the basis for analyzing ridership in the Clifton Corridor. The initial forecasts, completed in 2012, for the Clifton Corridor (AA) utilized a model that was developed using a preliminary expansion of the on-board survey and a 2005 base year. The refined traffic analysis zone (TAZ) system in the Clifton Corridor developed during the AA was also utilized for these LPA forecasts. However, the regional travel demand model was updated as part of the GA 400 Alternatives Analysis (AA). These model updates included a mode choice re-calibration to a 2010 base year using the final expanded ARC 2009-2010 Regional On-Board Transit Survey
2. More details of the model updates can be found in
the GA 400 Alternatives Analysis Model Development Report3. Due to the importance of these
updates, the Clifton Corridor forecasts were rerun in 2013 using the revised regional travel demand model. The revised Clifton Corridor LPA forecasts are presented in this section.
3.1.2 Networks
MAP-21 changed several aspects of FTA’s New Starts major capital investment program. Under FTA’s new guidelines, project sponsors are required to forecast ridership in the current year for alternatives; a horizon year forecast is optional. However, if a horizon year forecast is developed, the mobility improvements rating is based on a weighted average that gives 50 percent weight to both the current year and horizon year. FTA proposed this change due to uncertainty associated with assumptions from 10-year or 20-year horizon forecasts. FTA considers a current year forecast a good basis for determining the merits of a project in the opening year while introducing less uncertainty than horizon year forecasts.
The networks utilized for the current year LPA forecasts are based on the year 2010 highway system and 2010 socioeconomic data provided by the ARC
4. Due to service changes implemented by the
regional transit operators since 2009, the transit system network was updated to reflect transit service levels in late 2011/2012. This is by definition the No Build for the current year forecasts and is the underlying system for the build alternatives.
2 ETC, (2010). Regional On-Board Transit Survey, Final Report.
3 MARTA, AECOM/JJG Joint Venture. (2013). GA 400 Corridor Alternatives Analysis Model Development Report.
4 ARC, (2011). Plan 2040 2010 Highway, Transit Networks, and SE Data.

Clifton Corridor Transit Initiative Project Development and NEPA Phase 1 Environmental Review and Alternative Refinement
New Starts Assessment
Clifton Corridor Transit Initiative 6 September 2013
Horizon year forecasts were also developed for the year 20405. The 2040 highway system and 2040
socioeconomic data were provided by the ARC from the Plan2040 Long Range Transportation Plan6
(LRTP). The transit system is also based on the LRTP with the exception that the final LPA from the I-20 AA, a heavy rail extension and bus rapid transit (BRT) on I-20, was updated in the 2040 No Build and carried forward into the Clifton Corridor build alternatives.
3.1.3 Mobility Measure
The mobility measure is calculated as the number of project trips taken by non-transit dependent persons plus the number of project trips taken by transit dependent persons multiplied by a factor of two. Transit dependents, as defined by the ARC model, represent households with no automobile, which is consistent with the national model STOPS (Simplified Trips-on-Project Software) being developed by the FTA. Prior to performing the forecasts, the model was modified to extract transit dependent ridership separately from non-transit dependent ridership. FTA’s final policy guidance for the rating of mobility improvements is provided in Table 3-1.
Table 3-1: Mobility Improvement Breakpoints
Rating Mobility Improvements Estimated Annual Trips
High > 25.0 million
Medium-High 15 million - 24.9 million
Medium 9 million - 14.9 million
Medium-Low 4.5 million - 8.9 million
Low 0 - 4.49 million
The daily and annual current year ridership for the LPA is provided in Table 3-2 and shows that the alternative generated 17,200 project trips per day. The daily project trips were multiplied by a factor of 300 to annualize. When annualized, the LPA resulted in 5.16 million annual project trips. Under FTA’s final policy guidance, the LPA would receive a medium-low rating, if only the current year 2010 forecasts were utilized.
Table 3-2: Current Year 2010 Mobility Measure
Mobility Measure – 2010 LPA
Daily Project Trips by Non-Transit Dependents 8,340
Daily Project Trips by Transit Dependents 4,430
Daily Project Trips* 17,200
Annual Project Trips 5,160,000
Rating Medium-Low
*Non-transit dependent trips plus transit dependent trips multiplied by two.
5 FTA MAP-21 guidance requires a 20 year planning horizon. This will be addressed in Phase 2.
6 ARC, (2011). Plan 2040 2040 Highway, Transit Networks, and SE Data.
Clifton Corridor Transit Initiative Project Development and NEPA Phase 1 Environmental Review and Alternative Refinement
New Starts Assessment
Clifton Corridor Transit Initiative 7 September 2013
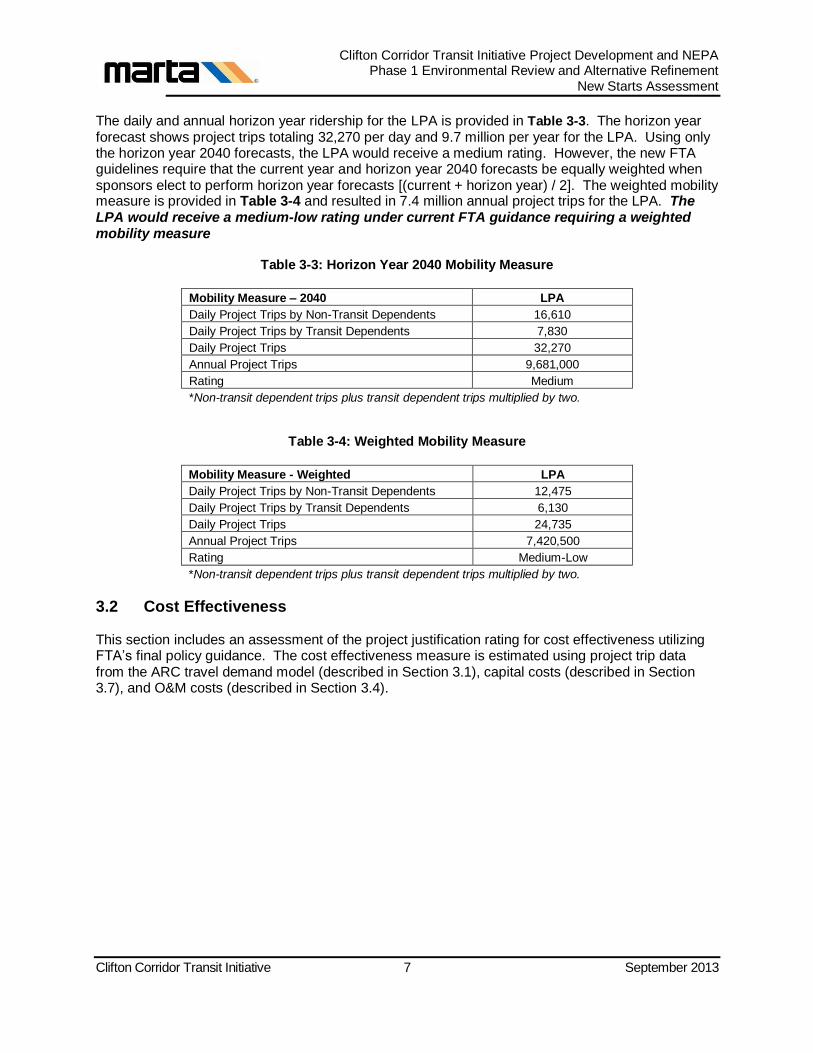
The daily and annual horizon year ridership for the LPA is provided in Table 3-3. The horizon year forecast shows project trips totaling 32,270 per day and 9.7 million per year for the LPA. Using only the horizon year 2040 forecasts, the LPA would receive a medium rating. However, the new FTA guidelines require that the current year and horizon year 2040 forecasts be equally weighted when sponsors elect to perform horizon year forecasts [(current + horizon year) / 2]. The weighted mobility measure is provided in Table 3-4 and resulted in 7.4 million annual project trips for the LPA. The LPA would receive a medium-low rating under current FTA guidance requiring a weighted mobility measure
Table 3-3: Horizon Year 2040 Mobility Measure
Mobility Measure – 2040 LPA
Daily Project Trips by Non-Transit Dependents 16,610
Daily Project Trips by Transit Dependents 7,830
Daily Project Trips 32,270
Annual Project Trips 9,681,000
Rating Medium
*Non-transit dependent trips plus transit dependent trips multiplied by two.
Table 3-4: Weighted Mobility Measure
Mobility Measure - Weighted LPA
Daily Project Trips by Non-Transit Dependents 12,475
Daily Project Trips by Transit Dependents 6,130
Daily Project Trips 24,735
Annual Project Trips 7,420,500
Rating Medium-Low
*Non-transit dependent trips plus transit dependent trips multiplied by two.
3.2 Cost Effectiveness
This section includes an assessment of the project justification rating for cost effectiveness utilizing FTA’s final policy guidance. The cost effectiveness measure is estimated using project trip data from the ARC travel demand model (described in Section 3.1), capital costs (described in Section 3.7), and O&M costs (described in Section 3.4).
Clifton Corridor Transit Initiative Project Development and NEPA Phase 1 Environmental Review and Alternative Refinement
New Starts Assessment
Clifton Corridor Transit Initiative 8 September 2013
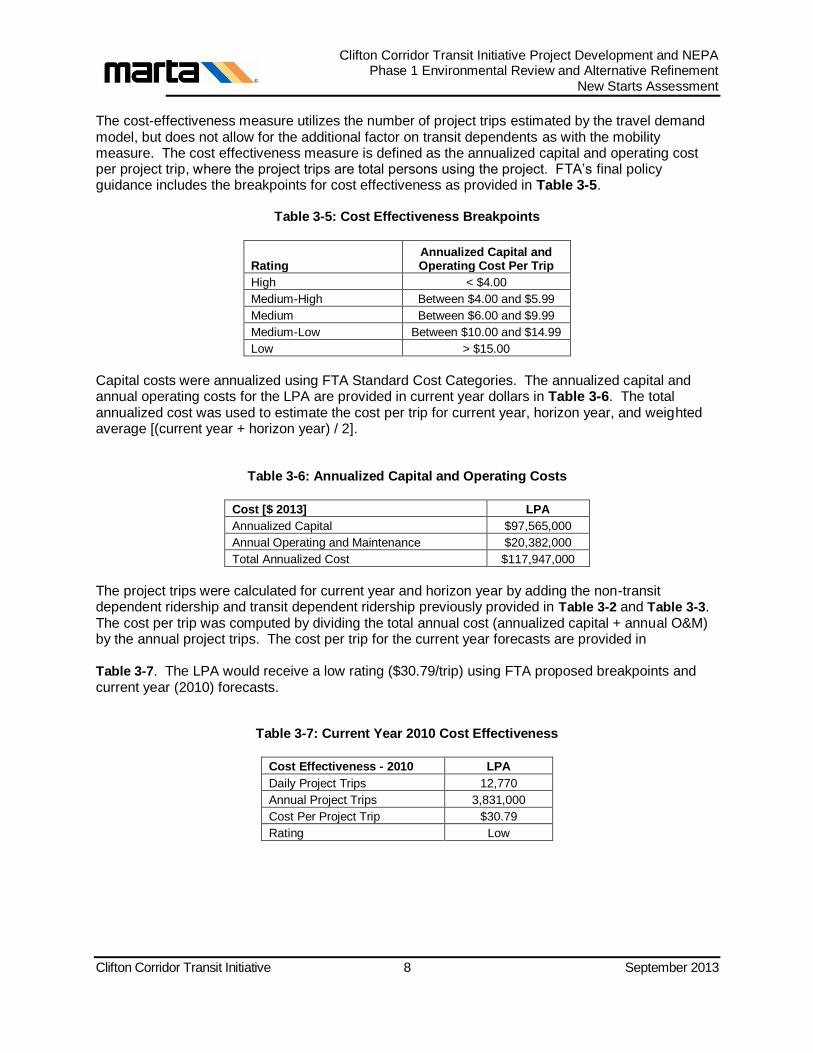
The cost-effectiveness measure utilizes the number of project trips estimated by the travel demand model, but does not allow for the additional factor on transit dependents as with the mobility measure. The cost effectiveness measure is defined as the annualized capital and operating cost per project trip, where the project trips are total persons using the project. FTA’s final policy guidance includes the breakpoints for cost effectiveness as provided in Table 3-5.
Table 3-5: Cost Effectiveness Breakpoints
Rating Annualized Capital and Operating Cost Per Trip
High < $4.00
Medium-High Between $4.00 and $5.99
Medium Between $6.00 and $9.99
Medium-Low Between $10.00 and $14.99
Low > $15.00
Capital costs were annualized using FTA Standard Cost Categories. The annualized capital and annual operating costs for the LPA are provided in current year dollars in Table 3-6. The total annualized cost was used to estimate the cost per trip for current year, horizon year, and weighted average [(current year + horizon year) / 2].
Table 3-6: Annualized Capital and Operating Costs
Cost [$ 2013] LPA
Annualized Capital $97,565,000
Annual Operating and Maintenance $20,382,000
Total Annualized Cost $117,947,000
The project trips were calculated for current year and horizon year by adding the non-transit dependent ridership and transit dependent ridership previously provided in Table 3-2 and Table 3-3. The cost per trip was computed by dividing the total annual cost (annualized capital + annual O&M) by the annual project trips. The cost per trip for the current year forecasts are provided in
Table 3-7. The LPA would receive a low rating ($30.79/trip) using FTA proposed breakpoints and current year (2010) forecasts.
Table 3-7: Current Year 2010 Cost Effectiveness
Cost Effectiveness - 2010 LPA
Daily Project Trips 12,770
Annual Project Trips 3,831,000
Cost Per Project Trip $30.79
Rating Low
Clifton Corridor Transit Initiative Project Development and NEPA Phase 1 Environmental Review and Alternative Refinement
New Starts Assessment
Clifton Corridor Transit Initiative 9 September 2013
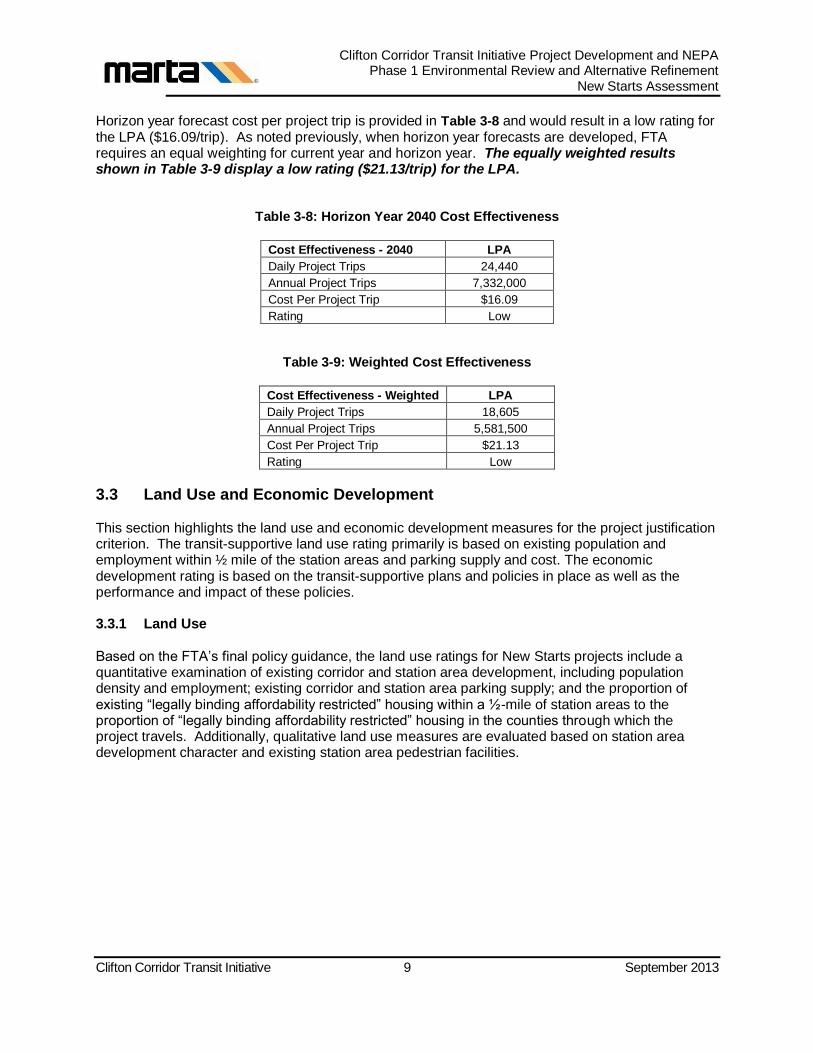
Horizon year forecast cost per project trip is provided in Table 3-8 and would result in a low rating for the LPA ($16.09/trip). As noted previously, when horizon year forecasts are developed, FTA requires an equal weighting for current year and horizon year. The equally weighted results shown in Table 3-9 display a low rating ($21.13/trip) for the LPA.
Table 3-8: Horizon Year 2040 Cost Effectiveness
Cost Effectiveness - 2040 LPA
Daily Project Trips 24,440
Annual Project Trips 7,332,000
Cost Per Project Trip $16.09
Rating Low
Table 3-9: Weighted Cost Effectiveness
Cost Effectiveness - Weighted LPA
Daily Project Trips 18,605
Annual Project Trips 5,581,500
Cost Per Project Trip $21.13
Rating Low
3.3 Land Use and Economic Development
This section highlights the land use and economic development measures for the project justification criterion. The transit-supportive land use rating primarily is based on existing population and employment within ½ mile of the station areas and parking supply and cost. The economic development rating is based on the transit-supportive plans and policies in place as well as the performance and impact of these policies.
3.3.1 Land Use
Based on the FTA’s final policy guidance, the land use ratings for New Starts projects include a quantitative examination of existing corridor and station area development, including population density and employment; existing corridor and station area parking supply; and the proportion of existing “legally binding affordability restricted” housing within a ½-mile of station areas to the proportion of “legally binding affordability restricted” housing in the counties through which the project travels. Additionally, qualitative land use measures are evaluated based on station area development character and existing station area pedestrian facilities.

Clifton Corridor Transit Initiative Project Development and NEPA Phase 1 Environmental Review and Alternative Refinement
New Starts Assessment
Clifton Corridor Transit Initiative 10 September 2013
Station Area Development
A primary consideration for land use is the quantity of development that exists in the project corridor today as measured by the average population density (persons per square mile) within a ½-mile radius of the stations and total employment served by the project. FTA’s final policy guidance includes the breakpoints for population density as well as employment as summarized in Table 3-10 and Table 3-11.
Table 3-10: Population Density Breakpoints
Rating Average Population
Density (persons/mile2)
High > 15,000
Medium-High 9,600 – 15,000
Medium 5,760 – 9,599
Medium-Low 2,561 – 5,759
Low < 2,560
Table 3-11: Employment Served by System
Rating Employment Served by
System
High > 220,000
Medium-High 140,000 – 219,999
Medium 70,000 – 139,999
Medium-Low 40,000 – 69,999
Low < 40,000
Population density in the study area is increasing. According to ARC projections, the 2010 study area population density was 6.5 persons per acre (4,160 persons per square mile), and is projected to be 8.8 persons per acre (5,632 persons per square mile) by 2040. The LPA would receive a medium-low rating for existing study area population density based on the FTA breakpoints. However, the FTA breakpoints are for the ½-mile station area and not the study area. The actual station area population density rating will be defined as part of Phase 2.
As illustrated in
Figure 3-1, the transit-oriented development (TOD) area immediately surrounding the Lindbergh
Center Station has the highest population density in the study area, with over 20 persons per acre (12,800 persons per square mile). Other areas with densities of 10 to 20 persons per acre (6,400 to 12,800 persons per square mile) are distant from the alignment corridor; these include Buford Highway, near the Edgewood/Candler Park Station, and the Virginia-Highland neighborhood. By 2040, the area surrounding Lindbergh Center TOD is still expected to have the highest population density (Figure 3-2). In 2040, the areas at the periphery of the study area near I-85 North, GA 400
and along the BeltLine and MARTA Blue Line are expected to support 10 to 20 persons per acre (6,400 to 12,800 persons per square mile). The increase in population density indicates, in general, that the study area environment is becoming increasingly supportive of transit.

Clifton Corridor Transit Initiative Project Development and NEPA Phase 1 Environmental Review and Alternative Refinement
New Starts Assessment
Clifton Corridor Transit Initiative 11 September 2013
Figure 3-1: 2010 Population Density

Clifton Corridor Transit Initiative Project Development and NEPA Phase 1 Environmental Review and Alternative Refinement
New Starts Assessment
Clifton Corridor Transit Initiative 12 September 2013
Figure 3-2: 2040 Population Density
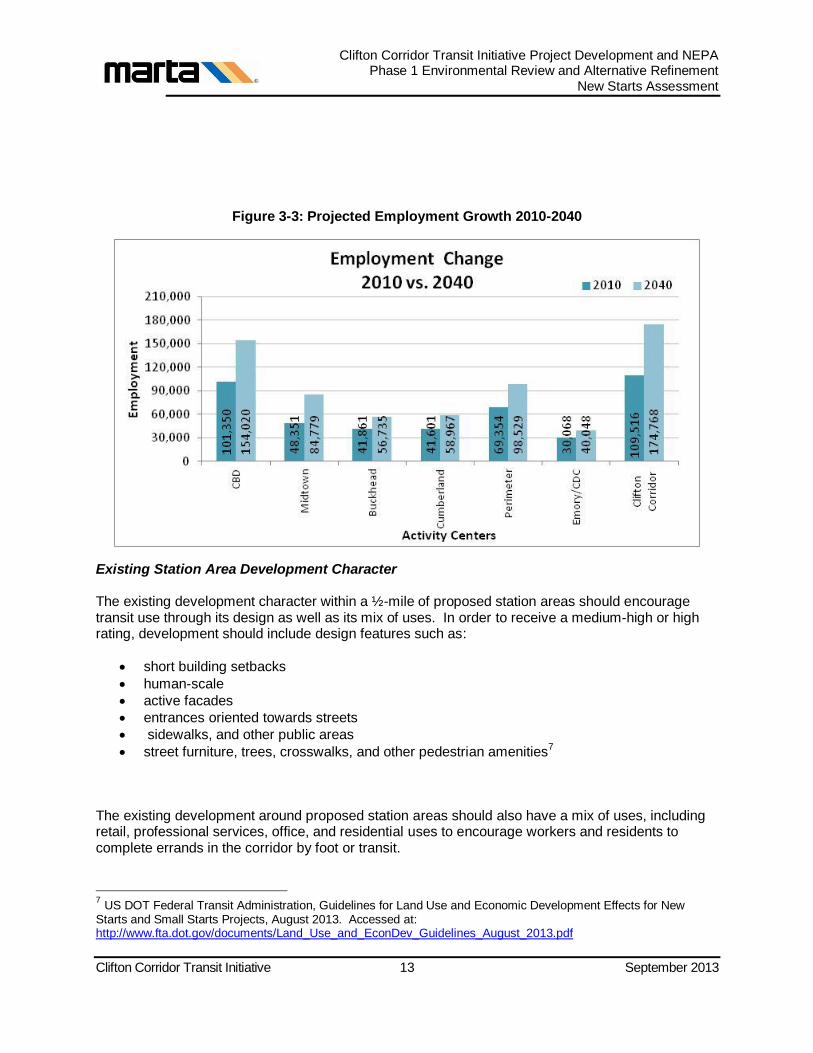
The study area is projected to experience a significantly greater rate of employment growth than population growth over the next 30 years, with 60 percent job growth from 109,516 to 174,768. The LPA would receive a medium rating for existing study area employment (109,516) based on FTA breakpoints, assuming that all employment in the study area is accessible by the project. This preliminary rating will be updated as part of Phase 2 as station locations and surrounding areas are refined.
When compared to other regional activity/employment centers, the study area projected employment growth is comparable to that of the Atlanta downtown central business district (CBD) and much higher than other regional activity centers (
Figure 3-3). Employment growth varies within the study area. Areas with the highest projected
growth span from Emory University south to the MARTA Blue Line and surround the MARTA Red/Gold Line and Piedmont Road. These areas, in addition to nodal areas surrounding Executive Park, North Druid Hills Road at Clairmont Road and Decatur, are expected to support from 50 to 100 percent more employment growth by 2040.
Clifton Corridor Transit Initiative Project Development and NEPA Phase 1 Environmental Review and Alternative Refinement
New Starts Assessment
Clifton Corridor Transit Initiative 13 September 2013
Figure 3-3: Projected Employment Growth 2010-2040
Existing Station Area Development Character
The existing development character within a ½-mile of proposed station areas should encourage transit use through its design as well as its mix of uses. In order to receive a medium-high or high rating, development should include design features such as:
short building setbacks
human-scale
active facades
entrances oriented towards streets
sidewalks, and other public areas
street furniture, trees, crosswalks, and other pedestrian amenities7
The existing development around proposed station areas should also have a mix of uses, including retail, professional services, office, and residential uses to encourage workers and residents to complete errands in the corridor by foot or transit.
7 US DOT Federal Transit Administration, Guidelines for Land Use and Economic Development Effects for New
Starts and Small Starts Projects, August 2013. Accessed at: http://www.fta.dot.gov/documents/Land_Use_and_EconDev_Guidelines_August_2013.pdf
Clifton Corridor Transit Initiative Project Development and NEPA Phase 1 Environmental Review and Alternative Refinement
New Starts Assessment
Clifton Corridor Transit Initiative 14 September 2013
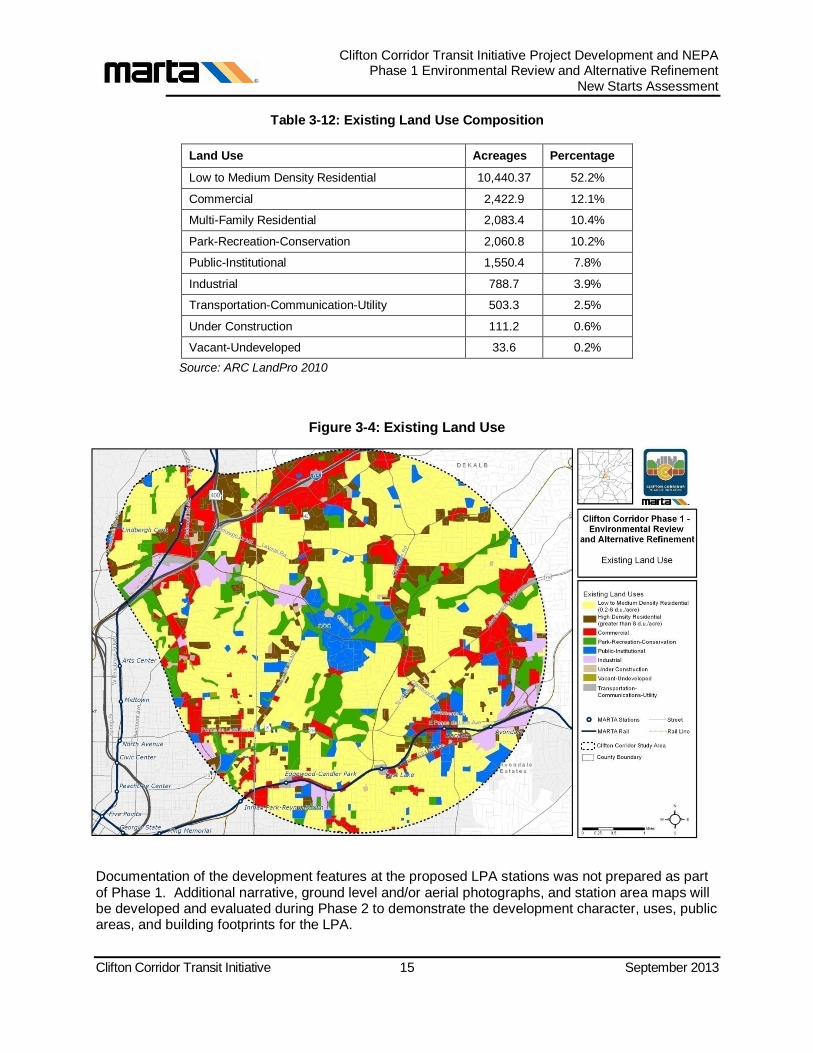
Due to the highly developed nature of the Clifton Corridor study area and suppression of the real estate market due to the recent economic recession, land uses have remained stable in recent years. An analysis of existing land uses in the study area shows the most prominent land use to be low to medium-density residential (52.2 percent). High-density residential, commercial, multi-family residential, park-recreation-conservation, and public-institutional land uses also comprise significant portions. Conversely, industrial, transportation-communication-utilities (TCU), under construction, and undeveloped land uses comprise a small portion, with a combined total of less than eight percent. A map of existing land uses is provided in Figure 3-4 and the acreage composition of existing land uses within the study area is presented in Table 3-12. Existing land use data is taken from the most recent data set available from the ARC, LandPro 2010.
Clifton Corridor Transit Initiative Project Development and NEPA Phase 1 Environmental Review and Alternative Refinement
New Starts Assessment
Clifton Corridor Transit Initiative 15 September 2013
Table 3-12: Existing Land Use Composition
Land Use Acreages Percentage
Low to Medium Density Residential 10,440.37 52.2%
Commercial 2,422.9 12.1%
Multi-Family Residential 2,083.4 10.4%
Park-Recreation-Conservation 2,060.8 10.2%
Public-Institutional 1,550.4 7.8%
Industrial 788.7 3.9%
Transportation-Communication-Utility 503.3 2.5%
Under Construction 111.2 0.6%
Vacant-Undeveloped 33.6 0.2%
Source: ARC LandPro 2010
Figure 3-4: Existing Land Use
Documentation of the development features at the proposed LPA stations was not prepared as part of Phase 1. Additional narrative, ground level and/or aerial photographs, and station area maps will be developed and evaluated during Phase 2 to demonstrate the development character, uses, public areas, and building footprints for the LPA.
Clifton Corridor Transit Initiative Project Development and NEPA Phase 1 Environmental Review and Alternative Refinement
New Starts Assessment
Clifton Corridor Transit Initiative 16 September 2013
Existing Pedestrian Facilities
Existing pedestrian facilities within the proposed station areas should provide direct routes, continuous sidewalks, clearly marked pedestrian crossings with signalization on higher volume streets, and adequate lighting. In addition, existing facilities should provide access for persons with disabilities, including curb cuts and ramps. Additional narrative and documentation of pedestrian and ADA facilities for the LPA will be developed and evaluated during Phase 2.
Parking Supply
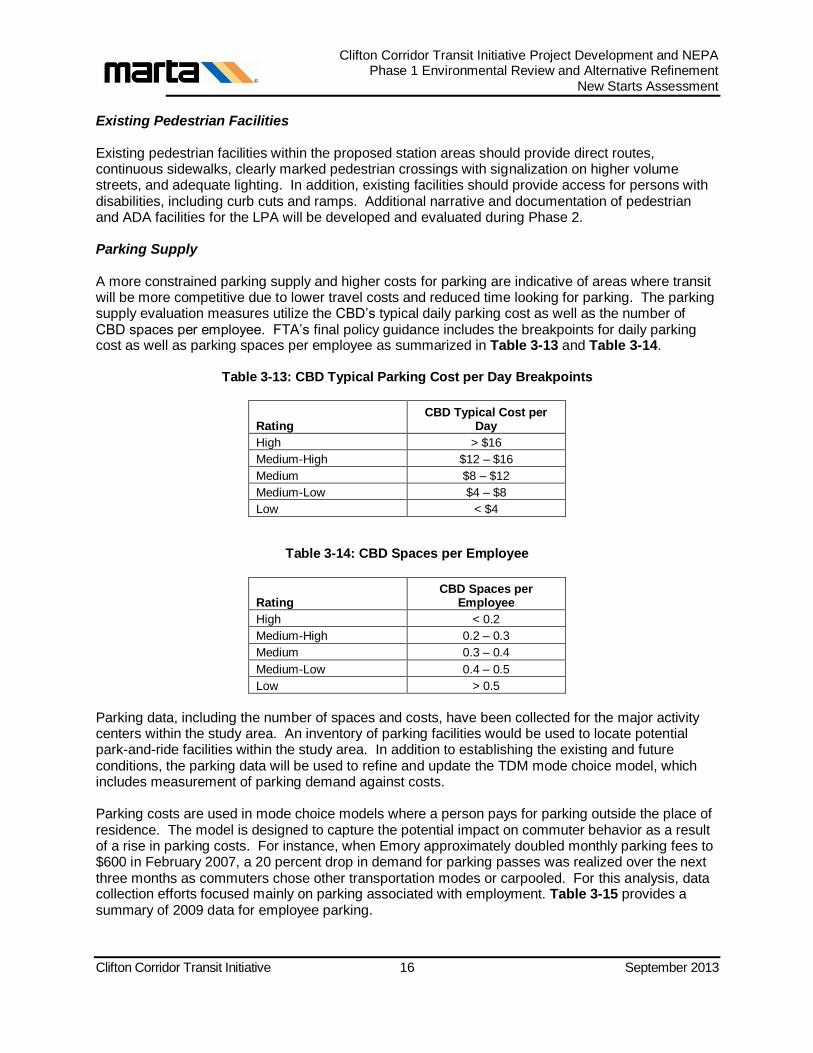
A more constrained parking supply and higher costs for parking are indicative of areas where transit will be more competitive due to lower travel costs and reduced time looking for parking. The parking supply evaluation measures utilize the CBD’s typical daily parking cost as well as the number of CBD spaces per employee. FTA’s final policy guidance includes the breakpoints for daily parking cost as well as parking spaces per employee as summarized in Table 3-13 and Table 3-14.
Table 3-13: CBD Typical Parking Cost per Day Breakpoints
Rating CBD Typical Cost per
Day
High > $16
Medium-High $12 – $16
Medium $8 – $12
Medium-Low $4 – $8
Low < $4
Table 3-14: CBD Spaces per Employee
Rating CBD Spaces per
Employee
High < 0.2
Medium-High 0.2 – 0.3
Medium 0.3 – 0.4
Medium-Low 0.4 – 0.5
Low > 0.5
Parking data, including the number of spaces and costs, have been collected for the major activity centers within the study area. An inventory of parking facilities would be used to locate potential park-and-ride facilities within the study area. In addition to establishing the existing and future conditions, the parking data will be used to refine and update the TDM mode choice model, which includes measurement of parking demand against costs.
Parking costs are used in mode choice models where a person pays for parking outside the place of residence. The model is designed to capture the potential impact on commuter behavior as a result of a rise in parking costs. For instance, when Emory approximately doubled monthly parking fees to $600 in February 2007, a 20 percent drop in demand for parking passes was realized over the next three months as commuters chose other transportation modes or carpooled. For this analysis, data collection efforts focused mainly on parking associated with employment. Table 3-15 provides a summary of 2009 data for employee parking.

Clifton Corridor Transit Initiative Project Development and NEPA Phase 1 Environmental Review and Alternative Refinement
New Starts Assessment
Clifton Corridor Transit Initiative 17 September 2013
Table 3-15: Parking Inventory at Major Activity Centers
Activity Center Parking Parking Costs
Emory University
and Hospital
16,558
University Faculty/Staff: Permit - $630/year
Students: Permit - $654/year
Healthcare Employees: Permit - $66/year for Lowergate deck
(Healthcare pays parking for employee parking)
2,124 Visitors: $2 per hour; more than 4 hrs. - $10 per day
CDC 3,300 Free Parking for employees and visitors
Lindbergh AT&T 2,331 Employees: $30 monthly pass
2,900 Visitors: Free daily parking and $8 per day for long-term parking
Downtown Decatur 8,885 Daily costs for employees and visitors ranges from Free to $11
Source: MARTA, Decatur, CDC, Emory
Based on the parking available and the estimated daily cost of each space, the average daily parking cost for the major activity centers in the LPA is approximately $2.74. The LPA would receive a low rating for daily parking costs for the major activity centers. An additional rating for the number of CBD spaces per employee was not calculated because the parking space numbers are for the major activity centers within the study area, while employment data is for the entire study area. This rating will be defined as part of Phase 2.
Legally Binding Affordable Restricted Housing in Project Corridor Compared to Counties
The affordable housing measure utilizes data on legally binding affordability restricted units8 to
renters with incomes below 60 percent of the area median income (AMI) and/or owners with incomes below AMI. This is a new metric for the land use rating and the FTA final policy guidance breakpoints are summarized in Table 3-16.
Table 3-16: Proportion of Legally Binding Affordability Restricted Housing in the Project Corridor
Compared to Counties
Rating
Proportion of Project Corridor Affordable Housing to Counties
High ≥ 2.50
Medium-High 2.25 – 2.49
Medium 1.50 – 2.24
Medium-Low 1.10 – 1.49
Low < 1.10
FTA recommends that the data for this measure be developed in cooperation with area housing agencies, as they are likely the best source of data for local, state, and federal affordable housing programs. For data that is obtained from local housing agencies, the head(s) of the local agencies must certify the data used. Additionally some federal statistics may be available in the National
8 As defined on page 29 of the FTA Final Policy Guidance (August 2013): “A legally binding affordability restriction is
a lien, deed of trust or other legal instrument attached to a property and/or housing structure that restricts the cost of housing units to be affordable to households at specified income levels for a defined period of time and requires that households at these income level occupy these units. This definition includes but is not limited to, state or federally supported public housing, and housing owned by organizations dedicated to providing affordable housing.”
Clifton Corridor Transit Initiative Project Development and NEPA Phase 1 Environmental Review and Alternative Refinement
New Starts Assessment
Clifton Corridor Transit Initiative 18 September 2013
Housing Preservation Database (http://www.preservationdatabase.org/). The data needed to calculate this measure and its associated rating will be defined and evaluated as part of Phase 2.
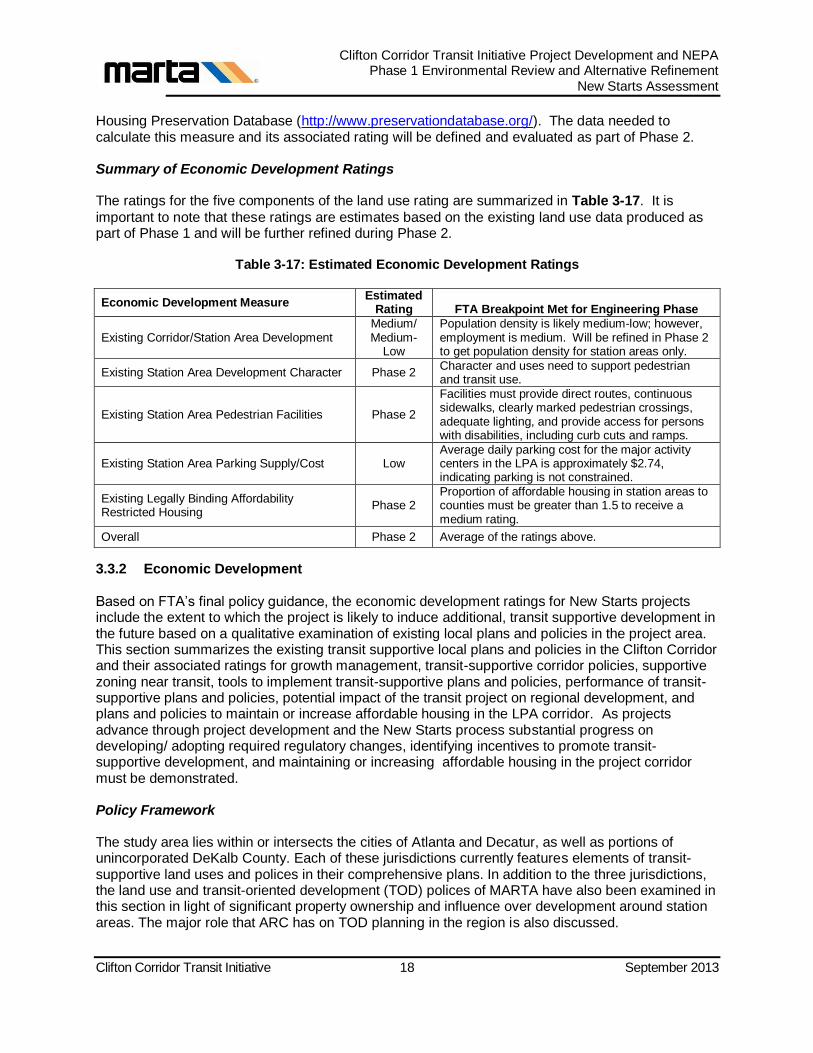
Summary of Economic Development Ratings
The ratings for the five components of the land use rating are summarized in Table 3-17. It is
important to note that these ratings are estimates based on the existing land use data produced as part of Phase 1 and will be further refined during Phase 2.
Table 3-17: Estimated Economic Development Ratings
Economic Development Measure Estimated
Rating FTA Breakpoint Met for Engineering Phase
Existing Corridor/Station Area Development Medium/ Medium-
Low
Population density is likely medium-low; however, employment is medium. Will be refined in Phase 2 to get population density for station areas only.
Existing Station Area Development Character Phase 2 Character and uses need to support pedestrian and transit use.
Existing Station Area Pedestrian Facilities Phase 2
Facilities must provide direct routes, continuous sidewalks, clearly marked pedestrian crossings, adequate lighting, and provide access for persons with disabilities, including curb cuts and ramps.
Existing Station Area Parking Supply/Cost Low Average daily parking cost for the major activity centers in the LPA is approximately $2.74, indicating parking is not constrained.
Existing Legally Binding Affordability Restricted Housing
Phase 2 Proportion of affordable housing in station areas to counties must be greater than 1.5 to receive a medium rating.
Overall Phase 2 Average of the ratings above.
3.3.2 Economic Development
Based on FTA’s final policy guidance, the economic development ratings for New Starts projects include the extent to which the project is likely to induce additional, transit supportive development in the future based on a qualitative examination of existing local plans and policies in the project area. This section summarizes the existing transit supportive local plans and policies in the Clifton Corridor and their associated ratings for growth management, transit-supportive corridor policies, supportive zoning near transit, tools to implement transit-supportive plans and policies, performance of transit-supportive plans and policies, potential impact of the transit project on regional development, and plans and policies to maintain or increase affordable housing in the LPA corridor. As projects advance through project development and the New Starts process substantial progress on developing/ adopting required regulatory changes, identifying incentives to promote transit-supportive development, and maintaining or increasing affordable housing in the project corridor must be demonstrated.
Policy Framework
The study area lies within or intersects the cities of Atlanta and Decatur, as well as portions of unincorporated DeKalb County. Each of these jurisdictions currently features elements of transit-supportive land uses and polices in their comprehensive plans. In addition to the three jurisdictions, the land use and transit-oriented development (TOD) polices of MARTA have also been examined in this section in light of significant property ownership and influence over development around station areas. The major role that ARC has on TOD planning in the region is also discussed.

Clifton Corridor Transit Initiative Project Development and NEPA Phase 1 Environmental Review and Alternative Refinement
New Starts Assessment
Clifton Corridor Transit Initiative 19 September 2013
When examining the policy framework of the three jurisdictions the following factors were studied to gauge transit support:
Community goals, policies, implementation strategies, and short-term action items
supporting transit found within a jurisdiction’s comprehensive plan
Transit-supportive land uses (mixed-use and higher-density residential – nine units per acre
or greater) shown on the jurisdiction’s future land use or future development map
Support for and experience with TOD (defined as moderate to high density mixed-use
development designed with a pedestrian focus within one-quarter mile of transit
stops/stations)
DeKalb County: DeKalb County Comprehensive Plan 2005-2025
DeKalb County represents nearly three quarters (74 percent) of the of the land area in the study area. As a result, the policies, regulations, and decisions of the county will have a significant impact on future transit in the study area.
The County has adopted transit supportive polices and strategies in its most recent comprehensive plan update (The DeKalb County Comprehensive Plan 2005-2025). Some examples of these include policies encouraging the strengthening of “pedestrian linkages between residential areas and MARTA stations” and supporting the “expanded use and improvement of the current MARTA system including express bus service routes, additional park-and-ride lots, and cross-town links.” Some specific strategies that were identified include: constructing new sidewalks in areas served by MARTA; working with MARTA to expand service hours and locations; and working with MARTA to increase ridership by linking station improvements with surrounding community improvements.
In addition to these policies and strategies, the Comprehensive Plan contains a Future Development Map that establishes appropriate future land uses in the study area. The Future Development Map serves as the official guide for decision-makers for rezoning and development procedures. It divides the county into specific character areas. Each character area corresponds to appropriate land uses, implementation measures, and design criteria described in the plan.
The Future Development Map shows a mixed-use “Town Center” character area for the Clifton Road area. The Town Center classification permits a wide variety of land uses, including high-density residential and high-intensity commercial. Residential densities up to 60 units per acre are permitted in this category. The map also shows the mixed-use “Neighborhood Center” character area at major intersections throughout the study area. The Neighborhood Center is a smaller scale activity center, with less intense development than Town Centers. It permits residential densities of up to 24 units per acre. A large portion of the study area is shown as either the “Suburban” or “Traditional Neighborhood” character area. These character areas permit low to medium residential densities. Up to eight units per acre is permitted for the Suburban character area and up to 12 units per acre is allowed within the Traditional Neighborhood category.
The combination of high-density mixed-use and higher-density residential future land uses (permitting 12 units per acre and above) represent 28 percent of the study area within DeKalb County. This suggests the Future Development Map supports development at sufficient densities to support premium transit service in numerous locations.

Clifton Corridor Transit Initiative Project Development and NEPA Phase 1 Environmental Review and Alternative Refinement
New Starts Assessment
Clifton Corridor Transit Initiative 20 September 2013
The Comprehensive Plan policies are also highly supportive of TOD. TOD has been identified as a land use strategy to be actively pursued and encouraged in appropriate locations. The plan encourages continuing coordination with MARTA to ensure future transit routes and stops are incorporated and reflected in the county’s future land use plans.
DeKalb County has been a strong advocate for TOD, actively planning for this at transit stations within the county. The county has spear-headed numerous ARC Livable Centers Initiative (LCI) planning studies for MARTA station areas, including Avondale, Brookhaven, Kensington and the three Perimeter Center area stations (Medical Center, Dunwoody, Sandy Springs). These studies have all recommended TOD for these areas. The county has carried these recommendations over into their land use plans. The plan shows high-density mixed-use future land uses in station areas, with the expressed intent of promoting TOD in these locations.
City of Atlanta: 2011 Comprehensive Development Plan
The City of Atlanta is the second largest component of the study area, comprising 27 percent of the total land area. Like DeKalb County, the City of Atlanta also features transit supportive policies and implementation strategies within its comprehensive plan.
The City of Atlanta 2011 Comprehensive Development Plan (CDP) continues many of the transit-supportive policies included in the previous plan update in 2008. The 2011 plan encourages nodal high-density mixed use development around MARTA stations. Policies encourage the use of alternative modes in every community. The plan establishes character areas around proposed and existing stations including Lindbergh Center, Piedmont Road, and Cheshire Bridge Road.
The Town Center character area is planned for the Lindbergh Center station area. This character area identifies transit-supportive land uses, including high-density, multi-story, mixed-use and multi-family residential as appropriate land uses in these areas. Policies include increasing transit options and maintaining a pedestrian scale and character within new developments. Encouraging complete streets and integrating alternative modes of transportation, including mass transit is another policy within this area. Improving sidewalk connectivity and access to transit is identified as an implementation strategy to be pursued within Town Centers.
The CDP identifies the proposed LPA station areas of Piedmont and Cheshire Bridge as Intown Corridor character areas. Policies in these areas include encouraging revitalization and redevelopment, and promoting dense pedestrian-oriented development at activity nodes and major intersections. Encouraging complete streets that integrate alternative modes of transportation, including public transportation is another policy identified for these areas. Streetscape improvements along these corridors have been identified as an implementation strategy within these areas.
City of Decatur
Land within the City of Decatur is the third largest component of the study area, comprising of ten percent of the total. Decatur has a reputation as a progressive city employing innovative smart-growth planning practices. When the MARTA line was constructed in the 1970s, downtown Decatur was in need of significant reinvestment and rehabilitation. Since then the city has been successful in creating a vibrant and compact, high-density, mixed-use environment around the Decatur Station. As a result it has become a good model for station areas throughout the MARTA system. In addition to written policies and strategies, the city has actively planned and achieved TOD in station areas. In 2005, the city undertook an ambitious redesign and reconfiguration of the Decatur Station to better connect it with the surrounding environment. Visual and physical barriers were removed, improving

Clifton Corridor Transit Initiative Project Development and NEPA Phase 1 Environmental Review and Alternative Refinement
New Starts Assessment
Clifton Corridor Transit Initiative 21 September 2013
pedestrian flow in and around the station. The aesthetics were also improved making the station more inviting to users.
2005 Comprehensive Plan Update: Within Decatur’s 2005 Comprehensive Plan Update, the city establishes land use policies and strategies supportive of transit and TOD. The city touts a “strong commitment to high-density, transit-oriented mixed-use development close to the downtown Decatur and Avondale MARTA rail stations.” A major goal is to increase transit ridership over the twenty-year planning period. To do this, the city encourages the co-location of mixed-use and high-density residential development with transit facilities. Decatur recognizes near 100 percent build-out conditions within the city limits, with growth limited to redevelopment and infill. The land use element and maps direct new growth in the form of mixed-use and medium- to high-density residential development to areas in close proximity to MARTA stations.
2010 Strategic Plan for the City of Decatur: The 2010 Strategic Plan for the City of Decatur includes support for new forms of transit, including a local trolley system. This trolley system is designed to connect downtown Decatur, Oakhurst, Emory University, Agnes Scott College, and DeKalb Farmers Market. Support was also included for an expansion of the Emory Cliff bus system or a small, electric-bus circulator system similar to that in Chattanooga.
Avondale MARTA Station TOD Plans: In 2002, the City conducted a LCI study for the Avondale MARTA Station promoting the development of TOD on a 6-acre site south of the station. Since then, several attempts to develop this site have faltered due to delays and economic conditions. More recently in January 2013, a TOD Market Assessment Study was prepared by Bleakly Advisory Group which identified Avondale Station as one of five sites best positioned for new development.
According to the TOD Study, an immediate TOD opportunity exists at the Avondale Station area for a mixed-use development on the south MARTA parking lot that could include 300 residential units with small-scale retail and structured parking to serve MARTA and new development. It is noted that municipal involvement, such as a Tax Allocation District (TAD), could be used to induce further development in this area. MARTA and the city’s development authority are currently negotiating an inter-governmental agreement to jointly develop this project.
MARTA – Transit Oriented Development
MARTA has engaged in significant TOD planning efforts over the years with the success of the Lindbergh City Center mixed-use development on MARTA-owned land around Lindbergh Center Station. More recently, MARTA has been laying the groundwork for its TOD program during the recession in order to prepare for the next real estate development cycle. The Authority has completed comprehensive plans for all 38 MARTA stations and is currently working on a short-term plan for future TOD projects.
MARTA defines TOD as moderate- to high-density mixed-use development designed with a pedestrian focus within one-quarter mile of transit stops/stations. To create its TOD Guidelines, MARTA reviewed the best practices of ten other North American transit systems, examining the influence they have had on developing TOD in station areas. These guidelines emphasize pedestrian access, a rich mix of land uses, public spaces, and proper parking design. The MARTA Board adopted the TOD Guidelines in November 2010.

Clifton Corridor Transit Initiative Project Development and NEPA Phase 1 Environmental Review and Alternative Refinement
New Starts Assessment
Clifton Corridor Transit Initiative 22 September 2013
MARTA’s TOD strategic goals derived from the Guidelines include the following:
Generate greater transit ridership through clustering mixed-use development around the stations and along corridors
Promote a sustainable, affordable and growing future for the people of Metro Atlanta
Generate a return on MARTA’s transit investment through enhanced passenger revenues, greater federal support, and development on MARTA property
MARTA’s TOD Guidelines provide the roadmap necessary for TOD to occur at the appropriate scale for the station types identified in the document.
In 2012, MARTA’s TOD and Real Estate Office identified potential TOD priorities and projects that were suitable for short and long term opportunities. A joint development/TOD work program recommended a potential request for proposal (RFP) release timeframe for 10 MARTA station sites based on their readiness for TOD.
As previously mentioned, the Avondale Station area has been identified by MARTA as one of three stations with top priority for TOD development. MARTA has recently issued a RFP for a consultant to work to advance TOD at Avondale, along with King Memorial and Chamblee Stations. This action by the MARTA Board could clear the way for construction in 2013. Opportunities at Avondale Station include annexation by the City of Decatur, a MARTA/City of Decatur partnership, and an in-depth LCI study. Challenges at Avondale Station include its use as an active bus intermodal station and replacement parking that will be required. Other infrastructure needs that will require solutions include poor pedestrian access, watershed improvements, and a lack of public spaces.
MARTA, in conjunction with the ARC and representatives from the development community, recently engaged in a ‘Development Day’ conference held in March 2013. The goal of this conference was to present the Authority’s TOD Program that highlighted development opportunities at selected MARTA stations. MARTA policies were presented relating to joint development, procurement and the RFP process required for the development of existing MARTA property. The event attracted about 250 residential and commercial developers, architects, engineers, local officials and the general public.
Atlanta Regional Commission
The ARC has had a strong role in encouraging TOD development throughout the region, in particular through its Livable Centers Initiative (LCI) program, which utilizes federal transportation monies to fund planning studies designed to integrate land use and transportation planning in small areas.
It can be argued the ARC’s LCI program has had the most significant impact on promoting TOD planning in the region, more so than any other program, organization, or municipality. LCI studies have resulted in master plans for at least 11 MARTA station areas including the Brookhaven, Kensington and Avondale stations. These studies have resulted in numerous jurisdictions changing land use policies to support TOD in these areas. The LCI program can be explored to fund the creation of station area master plans. In fact, in February 2013, DeKalb County was awarded the Medline Regional Activity Center LCI study grant. The study will focus on the area around DeKalb Medical Center and will evaluate ways to redevelop currently underutilized and vacant properties, including Suburban Plaza and other TOD opportunities and station location options identified within the study area. The project team will coordinate with DeKalb County regarding key decisions and assumptions concerning land use and development trends that would affect land use and development plans surrounding the proposed station areas of Suburban Plaza and DeKalb Medical Center. Details of other LCI studies that have been conducted in the study area can be found in

Clifton Corridor Transit Initiative Project Development and NEPA Phase 1 Environmental Review and Alternative Refinement
New Starts Assessment
Clifton Corridor Transit Initiative 23 September 2013
Reviews of Previous Studies section in the Clifton Corridor Existing Conditions Report and Environmental Resources Technical Report.
The LCI program provides a funding source to develop station area plans for jurisdictions that may not have the resources or staff available to do so independently. ARC has funded numerous studies in undeveloped areas they determine to be ‘emerging activity centers.’ In light of this, it is likely to assume new station areas would be prime locations for future LCI studies. Given the agency’s strong support for TOD planning and TOD planning experience within the four municipalities it is likely that funding would be approved for these studies.
A market assessment conducted by ARC identified that the TOD market is undersupplied in Atlanta and behind national peers. A TOD suitability study was conducted for all of the MARTA stations, excluding Airport Station. A more detailed analysis was performed on ten station areas, which included identifying redevelopment sites, public incentives, and a real estate market evaluation. The detailed analysis focused on Avondale and Lindbergh Center Stations, which would serve as the terminal stations for the Clifton Corridor light rail project.
This report also identified significant TOD opportunities at Lindbergh Center Station. The Lindbergh Center site offers favorable zoning in addition to access the Buckhead office submarket. Challenges at this station include existing TOD and neighborhood agreements in place, site topography and access. Numerous parcels in the station area have been identified for redevelopment including the parcel just north of MARTA headquarters that could accommodate 200 residential units, +/- 5,000 square feet of commercial. Other parcels include the redevelopment of the MARTA police and storage facility and the proposed ‘Wal-Mart site’ east of Piedmont Avenue.
Future Land Use and Development Plans
This section provides a general overview of planned future land uses within the study area based on recent data collected from DeKalb County, City of Atlanta and City of Decatur. To create a holistic view, future land use categories have been simplified across the jurisdictions to create a consistent classification system. A composite future land use map and the acreages of land use categories are presented in Table 3-18 and Figure 3-5, respectively.
In general, Low to Medium Density Residential comprises the majority of future land uses (52.9 percent) within the study area. This category represents residential land use designations permitting up to eight units per acre. The second most common land use is Mixed Use, which accounts for about 15 percent of future land uses, and Park-Recreation-Conservation, which makes up 11 percent of future land uses. High Density Residential, which contains residential categories that permit up to 12, 18, 29, 64, or an unlimited number of dwelling units per acre, makes up ten percent of future land uses.
Comparison between Existing Land Use and Future Land Use Maps
It is important to note that a direct visual comparison between the Existing and Future Land Use maps may be misleading due to differenences in data sources. Existing land use data was obtained from the ARC LandPro database, while the future land use data was obtained from the respective jurisdictions. The difference is particularly apparent when comparing high-density residential areas. Residential densities shown on the Future Land Use map represent the maximum densities permitted under future land use designations and do not represent inevitable future redevelopment. This is specifically evident in established historic residential areas, such as Druid Hills, that are shown as high-density residential areas on the Future Land Use map. Residential densities greater

Clifton Corridor Transit Initiative Project Development and NEPA Phase 1 Environmental Review and Alternative Refinement
New Starts Assessment
Clifton Corridor Transit Initiative 24 September 2013
than eight units per acre are permitted based upon future land use designations, but given the stable and historic qualities of the neighborhoods redevelopment at higher than existing densities is unlikely.
Table 3-18: Future Land Use Composition
Land Use Acreages Percentage
Low to Medium Density Residential 10,831.5 52.9%
Mixed Use 3,033.7 14.8%
Park-Recreation-Conservation 2,145.0 10.5%
High Density Residential 1,957.8 9.6%
Public-Institutional 962.1 4.7%
Industrial 842.5 4.1%
Commercial 525.2 2.6%
Transportation-Communication-Utility 169.4 0.8%
Figure 3-5: Future Land Use

Clifton Corridor Transit Initiative Project Development and NEPA Phase 1 Environmental Review and Alternative Refinement
New Starts Assessment
Clifton Corridor Transit Initiative 25 September 2013
Analysis of Transit-Supportive Land Uses
Future land uses within the study area have been analyzed and categorized based on their level of transit support, particularly for light rail transit. In order to develop a working definition of transit-supportive future land uses, several sources were consulted. These include research conducted by the ITE
9, Meyer
10, and Pushkarev and Zupan.
11 Among these sources, there is a general consensus
regarding the residential density thresholds required to support various forms of transit. The minimum thresholds needed to support a transit technology such as LRT is determined to be nine units per acre. The use of nine units per acre as a threshold for premium transit support is consistent with FTA New Starts ranking criteria. The FTA uses the population density within one half-mile of proposed transit stations to rank the worthiness of projects to receive federal funding.
Large clusters of office, civic, institutional and retail space can also serve as transit-supportive land uses, provided that they are of adequate size. The minimum square footages of contiguous non-residential space required to support LRT service is determined to be 35-50 million square feet. These thresholds are used in the subsequent discussion of potential transit supportiveness of future land uses within the study area.
Non-Transit Supportive Future Land Uses
Non-transit supportive future land uses comprise the bulk of the study area (67 percent). The vast majority of these areas are Low to Medium-density Residential categories. Parks-Recreation-Conservation, Industrial, and TCU land uses constitute the rest. While parks and recreation areas do generate some degree of transit demand, they often do not attract significant ridership unless they are large regional facilities. Industrial land uses generate employment and a certain amount of transit demand, but in relation to their size they do not generate enough to be considered transit-supportive. TCU land uses in the study area consist exclusively of interstate and railroad right-of-way, which generate little to no transit demand. Non-transit supportive land uses can be found in locations throughout the study area. Due to their insufficient transit-support, they are not preferred locations for transit stations.
Transit-Supportive Future Land Uses
Transit-supportive land uses are High Density Residential and Mixed Use categories, which permit a mixture of multi-family residences, offices, and/or retail. Public-Institutional and Commercial categories are also included as they generate significant transit demand in sufficient concentrations. Transit-supportive land uses are projected to comprise a significant portion (32 percent) of the study area. They can be found in various locations throughout the study area, although three main concentrations are clear. Not surprisingly, the main groupings of TOD are found in the City of Decatur, along the corridors of Briarcliff Road and Clifton Road, including Emory/CDC area, and the TOD surrounding the Lindbergh MARTA Station. These areas have been identified as future light rail station areas, and thus, are well-positioned for additional TOD and redevelopment.
9 Institute of Transportation Engineers. (1989). A Toolbox for Alleviating Congestion. Washington D.C.: ITE
Publication. 10
Meyer, M. (1991) Improved Public Transit. Washington D.C.: EPA Publication. 11
Pushkarev, B. & Zupan, JM. (1977) Public Transportation and Land Use Policy. Bloomington, IN: Indiana University Press
Clifton Corridor Transit Initiative Project Development and NEPA Phase 1 Environmental Review and Alternative Refinement
New Starts Assessment
Clifton Corridor Transit Initiative 26 September 2013
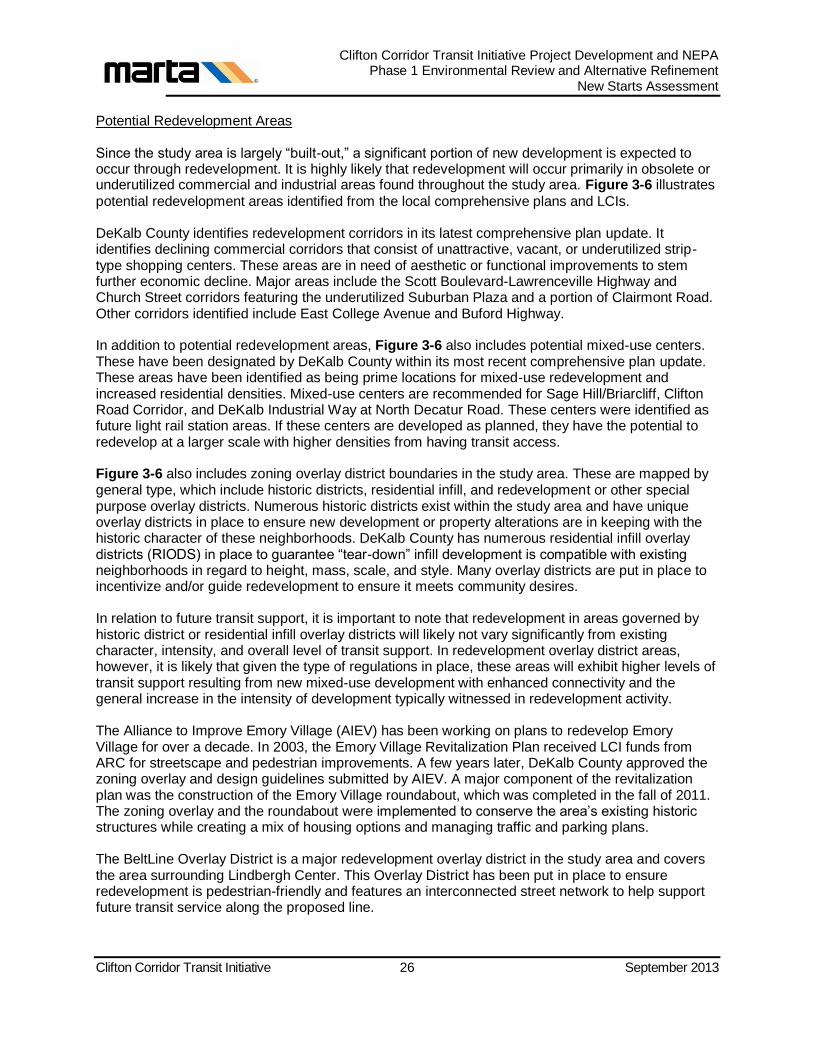
Potential Redevelopment Areas
Since the study area is largely “built-out,” a significant portion of new development is expected to occur through redevelopment. It is highly likely that redevelopment will occur primarily in obsolete or underutilized commercial and industrial areas found throughout the study area. Figure 3-6 illustrates
potential redevelopment areas identified from the local comprehensive plans and LCIs.
DeKalb County identifies redevelopment corridors in its latest comprehensive plan update. It identifies declining commercial corridors that consist of unattractive, vacant, or underutilized strip-type shopping centers. These areas are in need of aesthetic or functional improvements to stem further economic decline. Major areas include the Scott Boulevard-Lawrenceville Highway and Church Street corridors featuring the underutilized Suburban Plaza and a portion of Clairmont Road. Other corridors identified include East College Avenue and Buford Highway.
In addition to potential redevelopment areas, Figure 3-6 also includes potential mixed-use centers. These have been designated by DeKalb County within its most recent comprehensive plan update. These areas have been identified as being prime locations for mixed-use redevelopment and increased residential densities. Mixed-use centers are recommended for Sage Hill/Briarcliff, Clifton Road Corridor, and DeKalb Industrial Way at North Decatur Road. These centers were identified as future light rail station areas. If these centers are developed as planned, they have the potential to redevelop at a larger scale with higher densities from having transit access.
Figure 3-6 also includes zoning overlay district boundaries in the study area. These are mapped by general type, which include historic districts, residential infill, and redevelopment or other special purpose overlay districts. Numerous historic districts exist within the study area and have unique overlay districts in place to ensure new development or property alterations are in keeping with the historic character of these neighborhoods. DeKalb County has numerous residential infill overlay districts (RIODS) in place to guarantee “tear-down” infill development is compatible with existing neighborhoods in regard to height, mass, scale, and style. Many overlay districts are put in place to incentivize and/or guide redevelopment to ensure it meets community desires.
In relation to future transit support, it is important to note that redevelopment in areas governed by historic district or residential infill overlay districts will likely not vary significantly from existing character, intensity, and overall level of transit support. In redevelopment overlay district areas, however, it is likely that given the type of regulations in place, these areas will exhibit higher levels of transit support resulting from new mixed-use development with enhanced connectivity and the general increase in the intensity of development typically witnessed in redevelopment activity.
The Alliance to Improve Emory Village (AIEV) has been working on plans to redevelop Emory Village for over a decade. In 2003, the Emory Village Revitalization Plan received LCI funds from ARC for streetscape and pedestrian improvements. A few years later, DeKalb County approved the zoning overlay and design guidelines submitted by AIEV. A major component of the revitalization plan was the construction of the Emory Village roundabout, which was completed in the fall of 2011. The zoning overlay and the roundabout were implemented to conserve the area’s existing historic structures while creating a mix of housing options and managing traffic and parking plans.
The BeltLine Overlay District is a major redevelopment overlay district in the study area and covers the area surrounding Lindbergh Center. This Overlay District has been put in place to ensure redevelopment is pedestrian-friendly and features an interconnected street network to help support future transit service along the proposed line.

Clifton Corridor Transit Initiative Project Development and NEPA Phase 1 Environmental Review and Alternative Refinement
New Starts Assessment
Clifton Corridor Transit Initiative 27 September 2013
Figure 3-6: Redevelopment Characteristics
Major Development Activity
Due to the recent economic recession and the highly developed nature of the study area there has been little development activity since 2008. A couple of notable exceptions on Clifton Road include the recent Phase 1 build-out of the Emory Point mixed-use development and expansion of the new Emory University Hospital currently under construction.
Emory Point is a major mixed-use development on Clifton Road across from the CDC and adjacent to Emory University. The site was originally planned for development in 2008 and 2009. However, while plans were put on hold following the economic downturn, Phase 1 opened in the fall of 2012 and features 80,000 square feet of retail space and 443 luxury apartments. A future Phase 2 is planned that will include 40,000 square feet of retail and 240 multi-family units.
A new hospital tower is being constructed that will house additional beds and clinical space. It will include 210 beds, operating rooms, diagnostic and treatment spaces, ICU rooms, general medical/surgical rooms, and 400-600 underground parking spaces. Numerous transportation improvements have been made in the vicinity of the expansion to ease congestion that will result from additional volume after the expansion is complete. These improvements include the redesign of Woodruff Circle, the widening of hospital valet lanes, a reconfiguration of the valet area, a raised pedestrian bridge and parking deck improvements. The construction for the new tower is expected to be completed in 2017.
Since 2010, only two additional Developments of Regional Impact (DRIs) have been filed within the entire study area, DeKalb Farmers Market Expansion and the Ponce City Market Redevelopment.
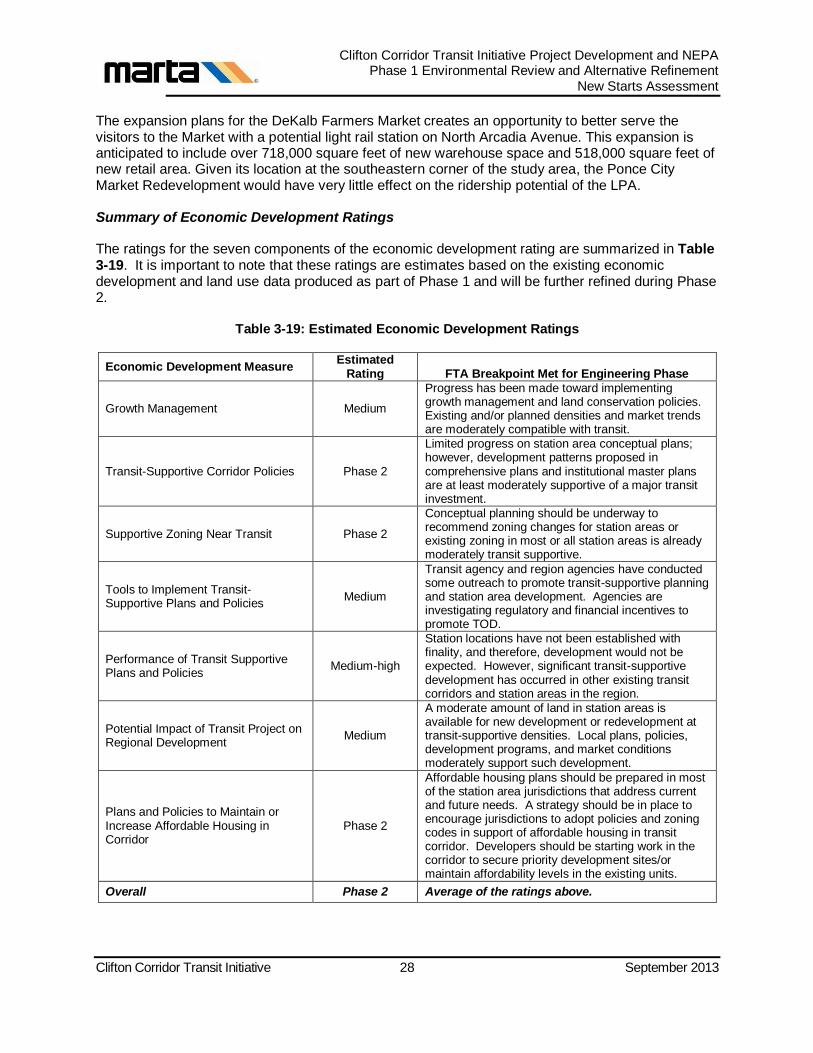
Clifton Corridor Transit Initiative Project Development and NEPA Phase 1 Environmental Review and Alternative Refinement
New Starts Assessment
Clifton Corridor Transit Initiative 28 September 2013
The expansion plans for the DeKalb Farmers Market creates an opportunity to better serve the visitors to the Market with a potential light rail station on North Arcadia Avenue. This expansion is anticipated to include over 718,000 square feet of new warehouse space and 518,000 square feet of new retail area. Given its location at the southeastern corner of the study area, the Ponce City Market Redevelopment would have very little effect on the ridership potential of the LPA.
Summary of Economic Development Ratings
The ratings for the seven components of the economic development rating are summarized in Table 3-19. It is important to note that these ratings are estimates based on the existing economic development and land use data produced as part of Phase 1 and will be further refined during Phase 2.
Table 3-19: Estimated Economic Development Ratings
Economic Development Measure Estimated
Rating FTA Breakpoint Met for Engineering Phase
Growth Management Medium
Progress has been made toward implementing growth management and land conservation policies. Existing and/or planned densities and market trends are moderately compatible with transit.
Transit-Supportive Corridor Policies Phase 2
Limited progress on station area conceptual plans; however, development patterns proposed in comprehensive plans and institutional master plans are at least moderately supportive of a major transit investment.
Supportive Zoning Near Transit Phase 2
Conceptual planning should be underway to recommend zoning changes for station areas or existing zoning in most or all station areas is already moderately transit supportive.
Tools to Implement Transit-Supportive Plans and Policies
Medium
Transit agency and region agencies have conducted some outreach to promote transit-supportive planning and station area development. Agencies are investigating regulatory and financial incentives to promote TOD.
Performance of Transit Supportive Plans and Policies
Medium-high
Station locations have not been established with finality, and therefore, development would not be expected. However, significant transit-supportive development has occurred in other existing transit corridors and station areas in the region.
Potential Impact of Transit Project on Regional Development
Medium
A moderate amount of land in station areas is available for new development or redevelopment at transit-supportive densities. Local plans, policies, development programs, and market conditions moderately support such development.
Plans and Policies to Maintain or Increase Affordable Housing in Corridor
Phase 2
Affordable housing plans should be prepared in most of the station area jurisdictions that address current and future needs. A strategy should be in place to encourage jurisdictions to adopt policies and zoning codes in support of affordable housing in transit corridor. Developers should be starting work in the corridor to secure priority development sites/or maintain affordability levels in the existing units.
Overall Phase 2 Average of the ratings above.
Clifton Corridor Transit Initiative Project Development and NEPA Phase 1 Environmental Review and Alternative Refinement
New Starts Assessment
Clifton Corridor Transit Initiative 29 September 2013
4.0 EVALUATION INPUTS
4.1 O&M Assumptions/Productions
This section documents the operations and maintenance (O&M) cost methodology, assumptions, and estimates related to proposed light rail transit (LRT) Locally Preferred Alternative (LPA) as part of the Clifton Corridor Transit Initiative study. The cost estimates are based on the proposed operating plans for the study.
4.1.1 Methodology
The introduction of light rail transit (LRT) service within Clifton Corridor will result in annual operating and maintenance costs.
The costs of providing light rail service will occur in terms of the following functions:
Vehicle Operations: Annual costs associated with vehicle operations such as rail operators, rail operation supervisor wages, and operator and supervisor fringe benefits
Vehicle Maintenance and Power Consumption: Annual costs associated with maintenance such as mechanics and supervisor wages, vehicle maintenance materials and spare parts, tools, uniforms, and costs associated with traction power
Maintenance of Way: Annual costs associated with right-of-way, such as technicians and supervisors wages, track maintainers, train control and communications equipment, and maintenance materials
Warranty and Parts: Annual costs associated with labor costs for warranty and parts staff
Maintenance of Stations: Annual costs associated with station maintenance, such as graffiti removal, station utilities such as electricity and water, repairs, and materials for stations
General Administration: Costs associated with finance, purchasing, payroll, and human relations
Other Costs: Costs associated with casualty and insurance and revenue collection including the maintenance and servicing of ticket vending machines at stations
Transit Security and Safety: Annual costs associated with the enforcement of safety and security on vehicles and at park-and-ride lots, transit facilities, and garages
For estimating operations and maintenance costs associated with the introduction of LRT, a cost allocation operating and maintenance model was developed to calculate the costs associated with this service.
The O&M cost model assumes that the expenses incurred by a transit system are driven by key supply variables such as annual revenue train hours, total cars, annual revenue car miles, route miles, stations, and annual revenue car hours. For each expense line item a unit cost rate has been determined. Unit rates are estimated by dividing the annual expense for the expense line item by the value of the driving supply variable listed above. To calculate the cost for each line item, the unit cost is multiplied by supply variables and productivity ratios.
For the purpose of developing the cost estimate, the Charlotte Area Transit System’s (CATS) LYNX light rail system was identified as a peer system since LRT in the Clifton corridor is anticipated to be similar in operation and cost structure. The O&M cost categories, productivity ratios, and unit costs used to develop estimates are based on data from MARTA and CATS.
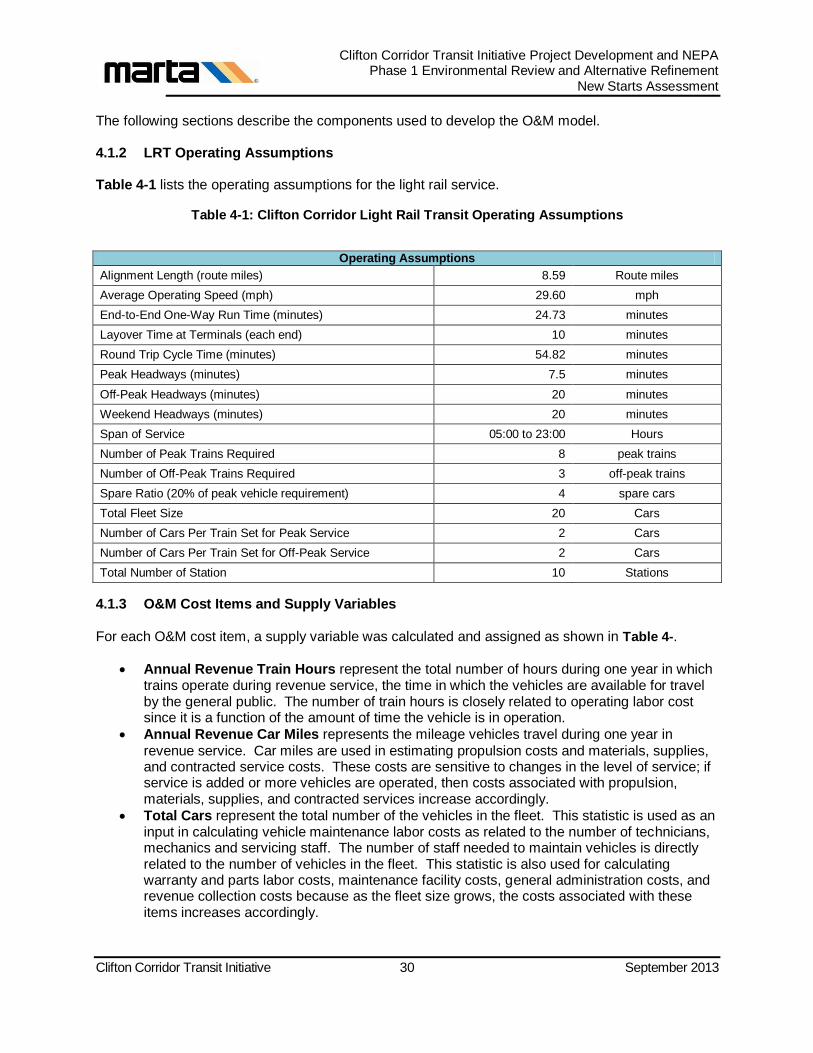
Clifton Corridor Transit Initiative Project Development and NEPA Phase 1 Environmental Review and Alternative Refinement
New Starts Assessment
Clifton Corridor Transit Initiative 30 September 2013
The following sections describe the components used to develop the O&M model.
4.1.2 LRT Operating Assumptions
Table 4-1 lists the operating assumptions for the light rail service.
Table 4-1: Clifton Corridor Light Rail Transit Operating Assumptions
Operating Assumptions
Alignment Length (route miles) 8.59 Route miles
Average Operating Speed (mph) 29.60 mph
End-to-End One-Way Run Time (minutes) 24.73 minutes
Layover Time at Terminals (each end) 10 minutes
Round Trip Cycle Time (minutes) 54.82 minutes
Peak Headways (minutes) 7.5 minutes
Off-Peak Headways (minutes) 20 minutes
Weekend Headways (minutes) 20 minutes
Span of Service 05:00 to 23:00 Hours
Number of Peak Trains Required 8 peak trains
Number of Off-Peak Trains Required 3 off-peak trains
Spare Ratio (20% of peak vehicle requirement) 4 spare cars
Total Fleet Size 20 Cars
Number of Cars Per Train Set for Peak Service 2 Cars
Number of Cars Per Train Set for Off-Peak Service 2 Cars
Total Number of Station 10 Stations
4.1.3 O&M Cost Items and Supply Variables
For each O&M cost item, a supply variable was calculated and assigned as shown in Table 4-.
Annual Revenue Train Hours represent the total number of hours during one year in which trains operate during revenue service, the time in which the vehicles are available for travel by the general public. The number of train hours is closely related to operating labor cost since it is a function of the amount of time the vehicle is in operation.
Annual Revenue Car Miles represents the mileage vehicles travel during one year in
revenue service. Car miles are used in estimating propulsion costs and materials, supplies, and contracted service costs. These costs are sensitive to changes in the level of service; if service is added or more vehicles are operated, then costs associated with propulsion, materials, supplies, and contracted services increase accordingly.
Total Cars represent the total number of the vehicles in the fleet. This statistic is used as an input in calculating vehicle maintenance labor costs as related to the number of technicians, mechanics and servicing staff. The number of staff needed to maintain vehicles is directly related to the number of vehicles in the fleet. This statistic is also used for calculating warranty and parts labor costs, maintenance facility costs, general administration costs, and revenue collection costs because as the fleet size grows, the costs associated with these items increases accordingly.
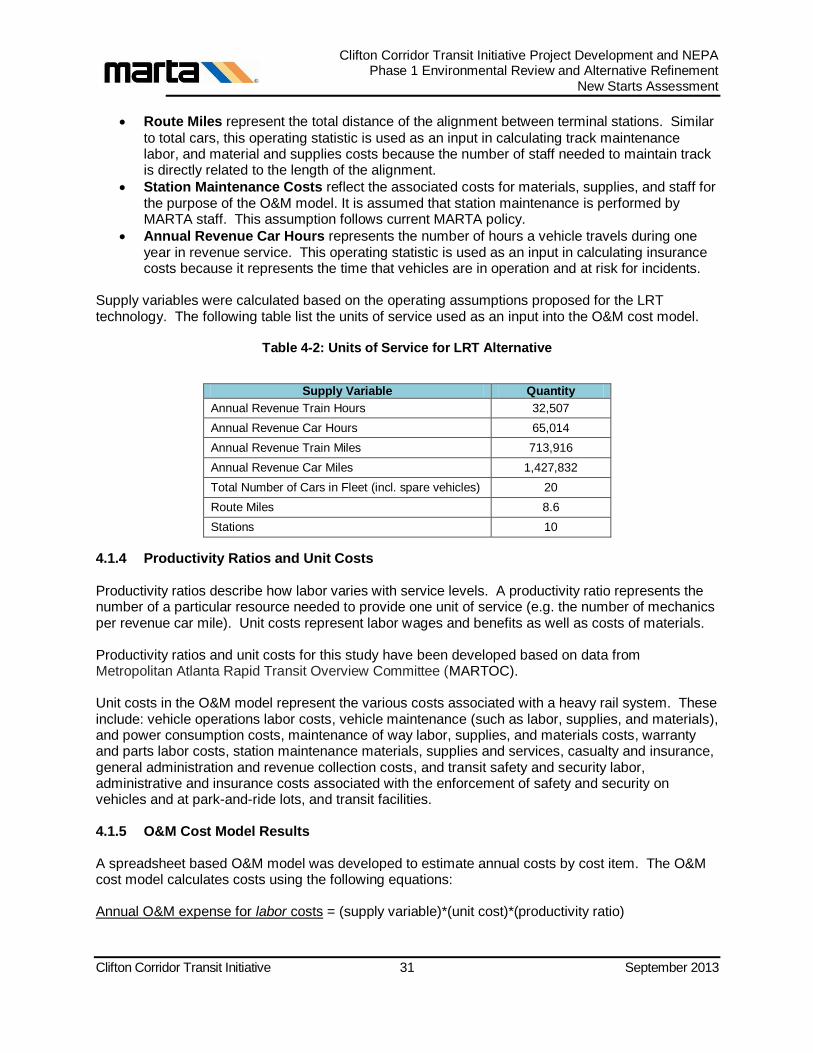
Clifton Corridor Transit Initiative Project Development and NEPA Phase 1 Environmental Review and Alternative Refinement
New Starts Assessment
Clifton Corridor Transit Initiative 31 September 2013
Route Miles represent the total distance of the alignment between terminal stations. Similar
to total cars, this operating statistic is used as an input in calculating track maintenance labor, and material and supplies costs because the number of staff needed to maintain track is directly related to the length of the alignment.
Station Maintenance Costs reflect the associated costs for materials, supplies, and staff for the purpose of the O&M model. It is assumed that station maintenance is performed by MARTA staff. This assumption follows current MARTA policy.
Annual Revenue Car Hours represents the number of hours a vehicle travels during one year in revenue service. This operating statistic is used as an input in calculating insurance costs because it represents the time that vehicles are in operation and at risk for incidents.
Supply variables were calculated based on the operating assumptions proposed for the LRT technology. The following table list the units of service used as an input into the O&M cost model.
Table 4-2: Units of Service for LRT Alternative
Supply Variable Quantity
Annual Revenue Train Hours 32,507
Annual Revenue Car Hours 65,014
Annual Revenue Train Miles 713,916
Annual Revenue Car Miles 1,427,832
Total Number of Cars in Fleet (incl. spare vehicles) 20
Route Miles 8.6
Stations 10
4.1.4 Productivity Ratios and Unit Costs
Productivity ratios describe how labor varies with service levels. A productivity ratio represents the number of a particular resource needed to provide one unit of service (e.g. the number of mechanics per revenue car mile). Unit costs represent labor wages and benefits as well as costs of materials.
Productivity ratios and unit costs for this study have been developed based on data from Metropolitan Atlanta Rapid Transit Overview Committee (MARTOC).
Unit costs in the O&M model represent the various costs associated with a heavy rail system. These include: vehicle operations labor costs, vehicle maintenance (such as labor, supplies, and materials), and power consumption costs, maintenance of way labor, supplies, and materials costs, warranty and parts labor costs, station maintenance materials, supplies and services, casualty and insurance, general administration and revenue collection costs, and transit safety and security labor, administrative and insurance costs associated with the enforcement of safety and security on vehicles and at park-and-ride lots, and transit facilities.
4.1.5 O&M Cost Model Results
A spreadsheet based O&M model was developed to estimate annual costs by cost item. The O&M cost model calculates costs using the following equations:
Annual O&M expense for labor costs = (supply variable)*(unit cost)*(productivity ratio)

Clifton Corridor Transit Initiative Project Development and NEPA Phase 1 Environmental Review and Alternative Refinement
New Starts Assessment
Clifton Corridor Transit Initiative 32 September 2013
Annual O&M expense for non-labor costs = (supply variable)*(unit cost)
Based on the service model for the Clifton Corridor Transit Initiative, the annual O&M costs for the Revised LPA is $21,687,367, as detailed in Table 4-3.

Clifton Corridor Transit Initiative Project Development and NEPA Phase 1 Environmental Review and Alternative Refinement
New Starts Assessment
Clifton Corridor Transit Initiative 33 September 2013
Table 4-3: LPA Annual O & M Cost Estimate (2013 Dollars)
Cost Item Supply Variable Resource Variable Resource Unit Cost Type Productivity Ratio Unit Cost FTE Annual Cost
Vehicle Operations
Rail Operators 32,507 Annual Revenue Train Hours 102,200 Work Hours 58.7212 L 3.1439 Work Hrs/Rev. Train Hr $54,538.58 /Employee 35 $6,001,307
Rail Operations Supervisors 32,507 Annual Revenue Train Hours 52,560 Work Hours 40.3131 L 1.6169 Work Hrs/Rev. Train Hr $72,803.25 /Employee 18 $2,118,857
Subtotal $8,120,165
Vehicle Maintenance and Power Consumption
Traction Power 1,427,832 Annual Revenue Car Miles U - $0.92 /Rev. Car Mile $1,313,605
Rail Car Mechanics 1,427,832 Annual Revenue Car Miles 46,720 Work Hours 0.7019 L 0.0327 Work Hrs/Rev. Car Mile $62,633.73 /Employee 16 $1,127
Rail Car Servicers - Veh. Maint. & Power Consumption 1,427,832 Annual Revenue Car Miles 17,520 Work Hours 0.1930 L 0.0041 Work Hrs/Rev. Car Mile $45,931.84 /Employee 6 $1,127
Rail Shop Machinists 1,427,832 Annual Revenue Car Miles 5,840 Work Hours 0.0631 L 0.0123 Work Hrs/Rev. Car Mile $45,018.54 /Employee 2 $1,105
Rail Car Maintenance Supervisors 1,427,832 Annual Revenue Car Miles 17,520 Work Hours 0.3026 L 0.0123 Work Hrs/Rev. Car Mile $72,011.79 /Employee 6 $5,302
Materials, Supplies, and Contracted Services 1,427,832 Annual Revenue Car Miles M - $0.46 /Rev. Car Mile $656,803
Subtotal $1,979,069
Maintenance of Way (MOW)
MOW Technicians 8.6 Route Miles 8.6 Route Miles L 1.0000 Rte Mile/Rte Mile $49,962.84 /Employee 15 $427,682
Rail MOW Supervisors 8.6 Route Miles 8.6 Route Miles L 1.0000 Rte Mile/Rte Mile $64,515.05 /Employee 7 $552,249
Track Maintainers 8.6 Route Miles 8.6 Route Miles L 1.0000 Rte Mile/Rte Mile $49,586.27 /Employee 4 $424,458
Track Laborers 8.6 Route Miles 8.6 Route Miles L 1.0000 Rte Mile/Rte Mile $31,673.00 / Employee 4 $271,121
Materials, Supplies, and Contracted Services 8.6 Route Miles M - $30,000.00 /Rte. Mile $256,800
Subtotal $1,932,310
Warranty & Parts
Warranty & Parts Manager 20 Total number of cars in fleet 20 Total Cars in fleet L 1.0000 Total Cars/Total Cars $61,817.34 /Employee 1 $1,236,347
Warranty & Parts Specialist 20 Total number of cars in fleet 20 Total Cars in fleet L 1.0000 Total Cars/Total Cars $43,130.08 /Employee 1 $862,602
Stores Clerk 20 Total number of cars in fleet 20 Total Cars in fleet L 1.0000 Total Cars/Total Cars $33,703.84 /Employee 2 $674,077
Receiving Clerk 20 Total number of cars in fleet 20 Total Cars in fleet L 1.0000 Total Cars/Total Cars $55,096.32 /Employee 1 $1,101,926
Subtotal $3,874,952
Station Maintenance
Station Maintenance Materials, Supplies, and
Contracted Services 10 Stations M - $51,500.00 /Station $515,000
Light Rail Maintenance Facility 20 Total number of cars in fleet M - $21,693.00 /Car $433,860
Subtotal $948,860
General Administration
General Administration 20 Total number of cars in fleet - $26,673.00 /Car $533,460
Subtotal $533,460
Other
Casualty and Insurance 65,014 Annual Revenue Car Hours - $33.83 /Rev.Car Hr $2,199,424
Revenue Collection Salary and Fringe 10 Stations L - $12,167.00 /Station $121,670
Revenue Collection General Administration 10 Stations - $8,165.00 /Station $81,650
Subtotal $2,402,744
Transit Security and Safety
Salary and Fringe 32,507 Annual Revenue Train Hours L - $11.63 /Rev. Train Hr. $378,056
General Administration 32,507 Annual Revenue Train Hours - $46.16 /Rev. Train Hr. $1,500,523
Insurance 32,507 Annual Revenue Train Hours - $0.53 /Rev. Train Hr. $17,229
Subtotal $1,895,808
Grand Total $21,687,367
L=Labor M= Material U=Utilities

Clifton Corridor Transit Initiative Project Development and NEPA Phase 1 Environmental Review and Alternative Refinement
New Starts Assessment
Clifton Corridor Transit Initiative 34 September 2013
4.2 Key Performance Data
This section identifies service characteristics and operating assumptions for the LPA, existing bus services, and any new service that may be developed for the Clifton Corridor. Operating plans were developed for the No Build and LPA alternatives, which formed the basis for operating and maintenance and capital cost estimates. The No Build Alternative includes the region’s current and planned roadway and transit projects, while the LPA is light rail transit. Table 4-4 lists service characteristics and operating assumptions for the LPA.
Table 4-4: Service Characteristics/Operating Assumptions
Service Span Weekday AM Peak PM Peak Weekend
05:00-01:00 05:00-09:00 15:00-19:00 06:00-24:00
Service Frequency (minutes)
Weekday Peak/Off-Peak Weekend
7.5/20
20 Operating Days
Weekdays Saturdays Sundays
259 52 54
Number of Trains (all options) Weekday Peak/Off-Peak Weekend
8/3
3
Number of Vehicles required Weekday Peak/Off-Peak Weekend
16/6
6
Service hours (annual) Train-hours
32,507
Service miles (annual)
Car-miles Train-miles
1,427,832 713,916
4.2.1 Bus Service
The current Clifton Corridor transit service consists of several MARTA bus routes and shuttle coverage by Emory University. The station areas for the LPA are located where the majority of the routes will not be affected with any type of realignment. The bus routes will serve the stations and continue to their current termination points. This also applies to the Emory shuttles that terminate at the Woodruff Transit Hub.
Two new MARTA feeder bus routes were added to better connect the LPA to employment and activity centers. In addition, two Emory shuttles were combined to connect two significant destination points. The major arterials and collector roads for this corridor and for the feeder and shuttle services are:
North Decatur
Briarcliff
Lavista
North Druid Hills

Clifton Corridor Transit Initiative Project Development and NEPA Phase 1 Environmental Review and Alternative Refinement
New Starts Assessment
Clifton Corridor Transit Initiative 35 September 2013
Clifton
Table 4-5 reflects the feeder routes and shuttle services within the corridor and the routing changes, if any, that were made. The changes for Emory in the LPA include Emory Conference Center, Emory Rollins, and Emory Clairmont.
Table 4-5: Feeder Bus and Emory Shuttle Service
Route Name Routing
6 Emory No change to existing routing but route will serve Emory and Briarcliff stations.
8 North Druid Hills No changes to this routing.
8 Feeder
North Druid Hills A new route from Brookhaven station, North Druid Hills Rd. continue to Briarcliff Rd and terminates at the Briarcliff station.
16 Noble No change to existing routing but route will serve Briarcliff station.
19 Clairmont No change to existing routing but route will serve North Decatur/Clairmont station.
27 Cheshire Bridge/ Ansley Mall
No change to existing routing but route will serve Cheshire Bridge station.
30 Lavista No changes to this routing.
33 Briarcliff/Lenox No changes to this routing in the Revised LPA.
36 North Decatur / Virginia Highlands
No change to existing routing but route will serve North Decatur/Clairmont, Superior, Suburban Plaza and DeKalb Medical Center stations.
120 Feeder
Tucker A new route from Tucker via Mountain Industrial, Hugh Howell, Lawrenceville Hwy, Scott Blvd to terminate at Suburban Plaza.
123 North DeKalb Mall No change to existing routing from Decatur station but route will serve DeKalb Medical Center station.
125 Clarkston/Northlake No change to existing routing but route will serve DeKalb Medical Center station.
Emory Shuttles*
Emory Executive Park No change to routing but route will serve Emory and Briarcliff stations.
Emory Executive Park -new This route will combine the Executive Park and the CCTMA routing in to one route that will serve the Emory and Briarcliff stations.
Emory CCTMA No change to routing but route will serve Emory, North Decatur/Clairmont stations.
Emory CCTMA - new (see Executive Park –new)
Emory South DeKalb No change to this route but route will serve Emory stations.
Emory North DeKalb No change to existing routing but route will serve Emory, North Decatur/Clairmont, Superior and Suburban Plaza stations.
Emory A No change in routing but route will serve the Emory stations.
Emory B No change in routing but route will serve the Emory stations.
Emory C No change in routing but route will serve the Emory stations.
Emory D No change in routing but route will serve the Emory stations.
Emory E No change in routing but route will serve the Emory stations.
Emory M No change in routing but route will serve the Emory stations.
Emory Oxford No change in routing but route will serve Emory and North Decatur/Clairmont stations.
Emory Grady No change in routing but route will serve the Emory stations.
Emory Midtown No change in routing but route will serve the Emory stations.
Emory 1525 VA No change in routing but route will serve the Emory stations.
Emory GA Tech No change in routing but route will serve Briarcliff and Emory stations.
*Emory Shuttles may not serve all Emory stations; some serve one station and others more than one.

Clifton Corridor Transit Initiative Project Development and NEPA Phase 1 Environmental Review and Alternative Refinement
New Starts Assessment
Clifton Corridor Transit Initiative 36 September 2013
Bus operating assumptions include one minute dwell times at each station to reflect the time required for boarding and acceleration/deceleration. At each end point, layover times for the MARTA routes vary and are dependent upon the difference of running times and cycle times that can range between 10 percent and as much as 20 percent. The dwell time at stations is included in the running times. For the new routes service spans are allocated similarly to existing services in the corridor. Table 4-6 shows the service characteristics for the MARTA bus services and
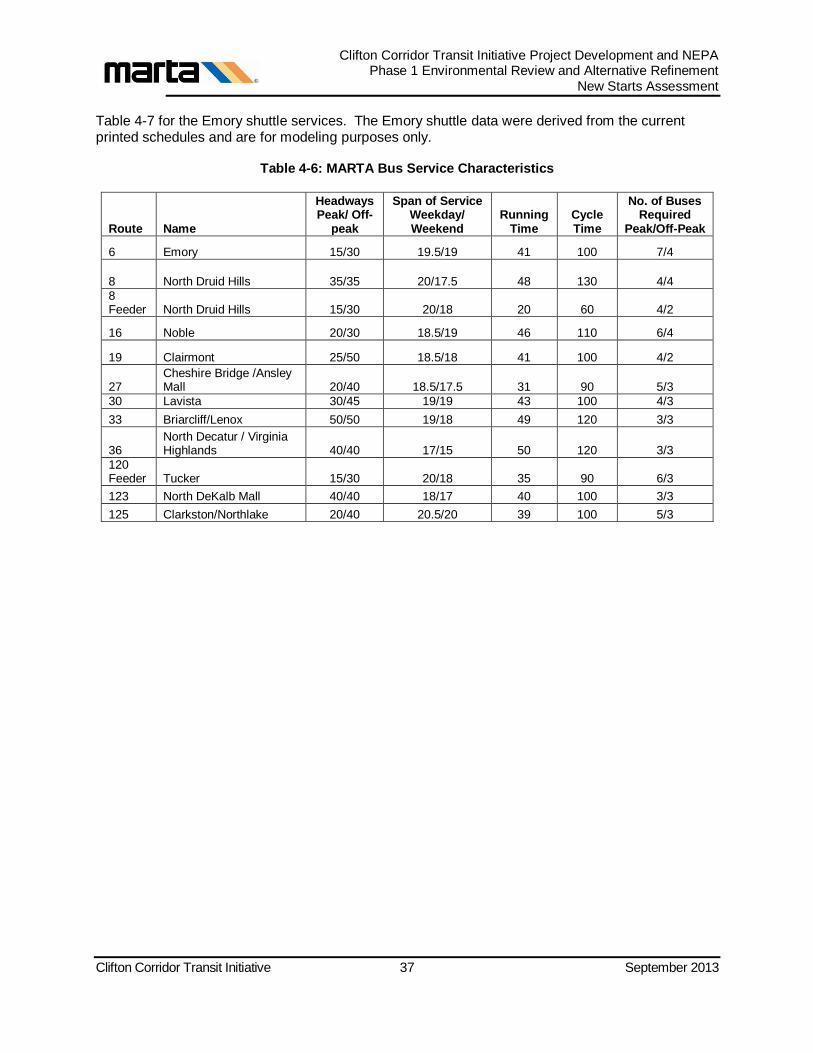
Clifton Corridor Transit Initiative Project Development and NEPA Phase 1 Environmental Review and Alternative Refinement
New Starts Assessment
Clifton Corridor Transit Initiative 37 September 2013
Table 4-7 for the Emory shuttle services. The Emory shuttle data were derived from the current printed schedules and are for modeling purposes only.
Table 4-6: MARTA Bus Service Characteristics
Route Name
Headways Peak/ Off-
peak
Span of Service Weekday/ Weekend
Running
Time Cycle Time
No. of Buses Required
Peak/Off-Peak
6 Emory 15/30 19.5/19 41 100 7/4
8 North Druid Hills 35/35 20/17.5 48 130 4/4
8 Feeder North Druid Hills 15/30 20/18 20 60 4/2
16 Noble 20/30 18.5/19 46 110 6/4
19 Clairmont 25/50 18.5/18 41 100 4/2
27 Cheshire Bridge /Ansley Mall 20/40 18.5/17.5 31 90 5/3
30 Lavista 30/45 19/19 43 100 4/3
33 Briarcliff/Lenox 50/50 19/18 49 120 3/3
36 North Decatur / Virginia Highlands 40/40 17/15 50 120 3/3
120 Feeder Tucker 15/30 20/18 35 90 6/3
123 North DeKalb Mall 40/40 18/17 40 100 3/3
125 Clarkston/Northlake 20/40 20.5/20 39 100 5/3

Clifton Corridor Transit Initiative Project Development and NEPA Phase 1 Environmental Review and Alternative Refinement
New Starts Assessment
Clifton Corridor Transit Initiative 38 September 2013
Table 4-7: Emory Shuttle Service Characteristics*
Route Name
Headways Peak/ Off-
Peak Span of Service Weekday -only
Running
Time Cycle Time
No. of Buses required
Peak/Off-Peak
Emory Executive Park 40 8 15 40 1/1
Emory Executive Park -new 30/40 17.5 25 60 2/2
Emory CCTMA 20/45 17.5 12.5 40 2/1
Emory CCTMA - new 20/30 17.5 25 60 3/2
Emory South DeKalb 35/40 10 40 90 3/3
Emory North DeKalb 10/35 14 25 60 5/2
Emory A 20/20 13 10 30 2/2
Emory B 15/30 17.5 15 40 3/2
Emory C 6/6 15 4 15 1/1
Emory D 9/9 15 8 30 4/2
Emory E 8/8 9 7 24 3/3
Emory M 8/15 15 2 10 2/1
Emory Oxford 60/90 15 90 180 3/3
Emory Grady 60/60 12 25 60 1/1
Emory Midtown 60/60 14 20 60 1/1
Emory 1525 VA 35/35 10 10 35 1/1
Emory GA Tech 60/60 11 26 60 1/1
*included for modeling purposes only
Table 4-8 shows operating statistics of peak vehicles, vehicle miles and vehicle hours for the options for the feeder routes. The peak vehicles number shown is needed to operate the existing routes within the corridor plus any additional services that were added due to the station locations of the LPA. The number of buses assumes a 20 percent spare ratio.
Table 4-8: Bus Feeder Routes Operating Statistics
Peak Vehicles including Spares
Vehicle Miles (annual)
Vehicle Hours (annual)
59 1,012,374 94,520
Table 4-9 outlines the estimated operating statistics for the Emory shuttles. The number of
estimated shuttles also assumes a 20 percent spare ratio.
Table 4-9: Estimated Emory Shuttle Operating Statistics
Peak Vehicles including Spares
Vehicle Miles (annual)
Vehicle Hours (annual)
47 341,103 77,959
4.2.2. Local Standards
Operating assumptions for the load standards are based on current MARTA Service Standards which are described below. Service standards are required by the MARTA Act and a federal requirement to recipients receiving federal monies. The service standards are revised and adopted by the Board of Directors within 120 days of each new fiscal year. Load standards impact not only
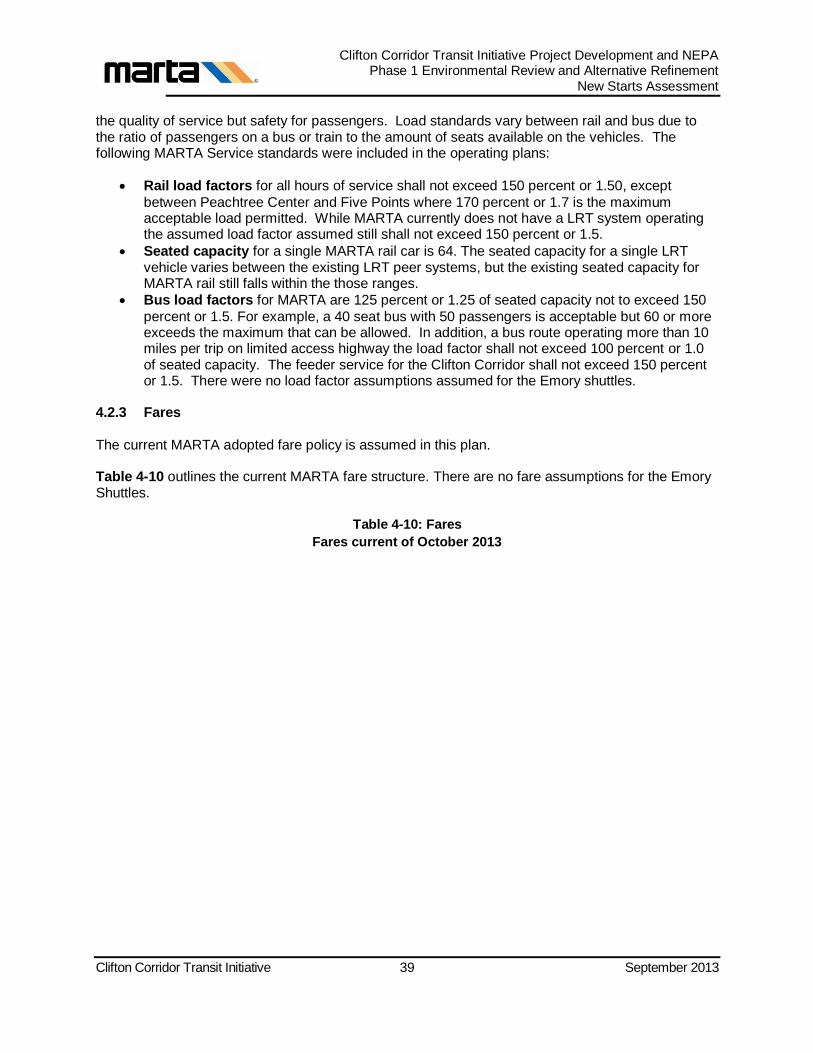
Clifton Corridor Transit Initiative Project Development and NEPA Phase 1 Environmental Review and Alternative Refinement
New Starts Assessment
Clifton Corridor Transit Initiative 39 September 2013
the quality of service but safety for passengers. Load standards vary between rail and bus due to the ratio of passengers on a bus or train to the amount of seats available on the vehicles. The following MARTA Service standards were included in the operating plans:
Rail load factors for all hours of service shall not exceed 150 percent or 1.50, except
between Peachtree Center and Five Points where 170 percent or 1.7 is the maximum acceptable load permitted. While MARTA currently does not have a LRT system operating the assumed load factor assumed still shall not exceed 150 percent or 1.5.
Seated capacity for a single MARTA rail car is 64. The seated capacity for a single LRT vehicle varies between the existing LRT peer systems, but the existing seated capacity for MARTA rail still falls within the those ranges.
Bus load factors for MARTA are 125 percent or 1.25 of seated capacity not to exceed 150
percent or 1.5. For example, a 40 seat bus with 50 passengers is acceptable but 60 or more exceeds the maximum that can be allowed. In addition, a bus route operating more than 10 miles per trip on limited access highway the load factor shall not exceed 100 percent or 1.0 of seated capacity. The feeder service for the Clifton Corridor shall not exceed 150 percent or 1.5. There were no load factor assumptions assumed for the Emory shuttles.
4.2.3 Fares
The current MARTA adopted fare policy is assumed in this plan.
Table 4-10 outlines the current MARTA fare structure. There are no fare assumptions for the Emory Shuttles.
Table 4-10: Fares
Fares current of October 2013

Clifton Corridor Transit Initiative Project Development and NEPA Phase 1 Environmental Review and Alternative Refinement
New Starts Assessment
Clifton Corridor Transit Initiative 40 September 2013
Fare Type Price
(in 2012 $)
Multi-Day Visitor Pass (1-4 Days) (unlimited rides)
Price (in 2012 $) Special Fare Programs
Price (in 2012 $)
Cash 2.50 1 Day Pass 9.00 Visitor's Pass Program Discounted
Breeze Card (with purchase of
additional fare loaded on card)
1.00 2 Day Pass 14.00 Partnership Program
(Employers) Discounted
Single Trip 2.50 3 Day Pass 16.00 University U-Pass
Program
Students: 68.50
Faculty/Staff: 83.80
Round Trip 5.00 4 Day Pass 19.00 Student Pass Program
(K-12) in MARTA service area only
14.40
Ten (10) Trips 25.00
Reduced Fare Program (Seniors, Disabled riders & Medicare recipients)
1.00
Twenty (20) Trips 42.50
Shuttles Regular fare
with free transfer
7-Day Pass (Unlimited for 7
consecutive days beginning first
time use)
23.75
30-Day Pass (Unlimited for 30 consecutive days
beginning first time use)
95.00
4.3 Station Demand
This section presents the results of the travel demand forecasts at the station level for the LPA. The regional travel demand model maintained by the Atlanta Regional Commission (ARC) was the basis for analyzing ridership in the Clifton Corridor. The ARC model and the networks used to forecast the ridership by station were discussed previously in Section 3.1 of this report. Transit forecasts were prepared for current year and horizon year (2040) and where applicable, compared to the No Build for both years. The analysis included ridership forecasts for the full alignment and partial alignment for the LPA.
4.3.1 Full Alignment Analysis
Boardings for the full alignment are provided in Table 4-11 below for years 2010 and horizon year 2040. Between those years, boardings are projected to grow from 12,770 in 2010 to 24,440 in 2040 – a 91 percent increase over the current year.
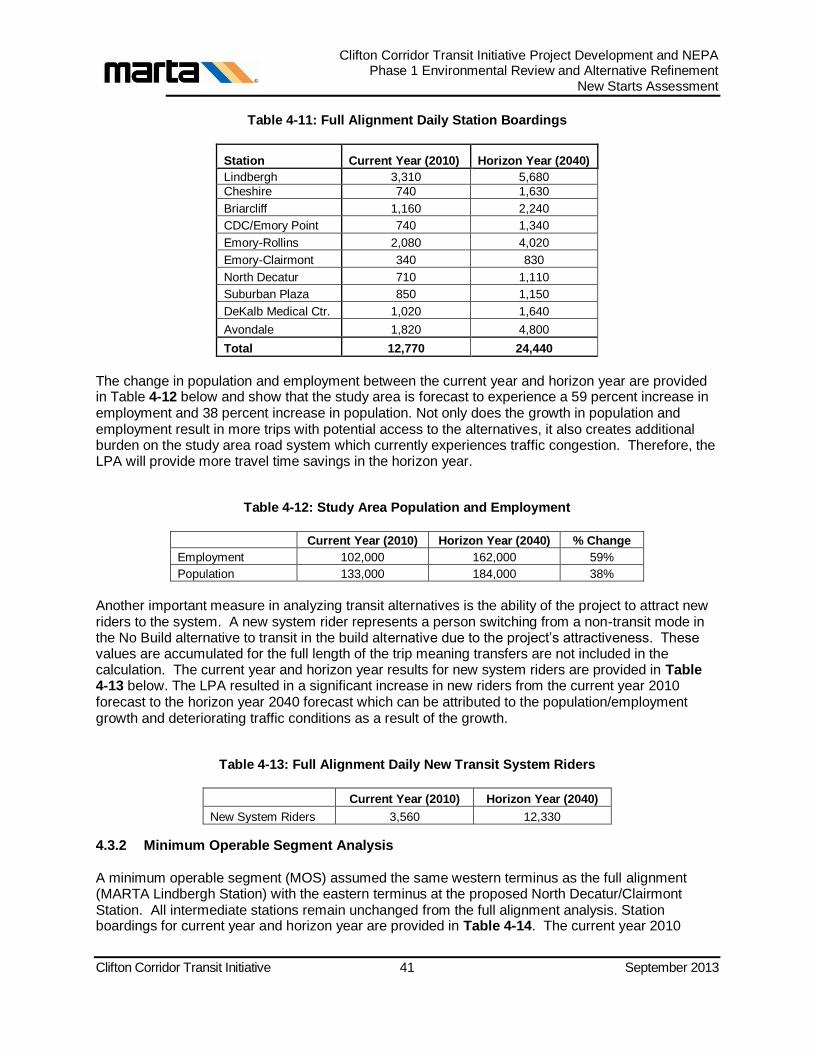
Clifton Corridor Transit Initiative Project Development and NEPA Phase 1 Environmental Review and Alternative Refinement
New Starts Assessment
Clifton Corridor Transit Initiative 41 September 2013
Table 4-11: Full Alignment Daily Station Boardings
Station Current Year (2010) Horizon Year (2040)
Lindbergh 3,310 5,680
Cheshire 740 1,630
Briarcliff 1,160 2,240
CDC/Emory Point 740 1,340
Emory-Rollins 2,080 4,020
Emory-Clairmont 340 830
North Decatur 710 1,110
Suburban Plaza 850 1,150
DeKalb Medical Ctr. 1,020 1,640
Avondale 1,820 4,800
Total 12,770 24,440
The change in population and employment between the current year and horizon year are provided in Table 4-12 below and show that the study area is forecast to experience a 59 percent increase in employment and 38 percent increase in population. Not only does the growth in population and employment result in more trips with potential access to the alternatives, it also creates additional burden on the study area road system which currently experiences traffic congestion. Therefore, the LPA will provide more travel time savings in the horizon year.
Table 4-12: Study Area Population and Employment
Current Year (2010) Horizon Year (2040) % Change
Employment 102,000 162,000 59%
Population 133,000 184,000 38%
Another important measure in analyzing transit alternatives is the ability of the project to attract new riders to the system. A new system rider represents a person switching from a non-transit mode in the No Build alternative to transit in the build alternative due to the project’s attractiveness. These values are accumulated for the full length of the trip meaning transfers are not included in the calculation. The current year and horizon year results for new system riders are provided in Table 4-13 below. The LPA resulted in a significant increase in new riders from the current year 2010 forecast to the horizon year 2040 forecast which can be attributed to the population/employment growth and deteriorating traffic conditions as a result of the growth.
Table 4-13: Full Alignment Daily New Transit System Riders
Current Year (2010) Horizon Year (2040)
New System Riders 3,560 12,330
4.3.2 Minimum Operable Segment Analysis
A minimum operable segment (MOS) assumed the same western terminus as the full alignment (MARTA Lindbergh Station) with the eastern terminus at the proposed North Decatur/Clairmont Station. All intermediate stations remain unchanged from the full alignment analysis. Station boardings for current year and horizon year are provided in Table 4-14. The current year 2010
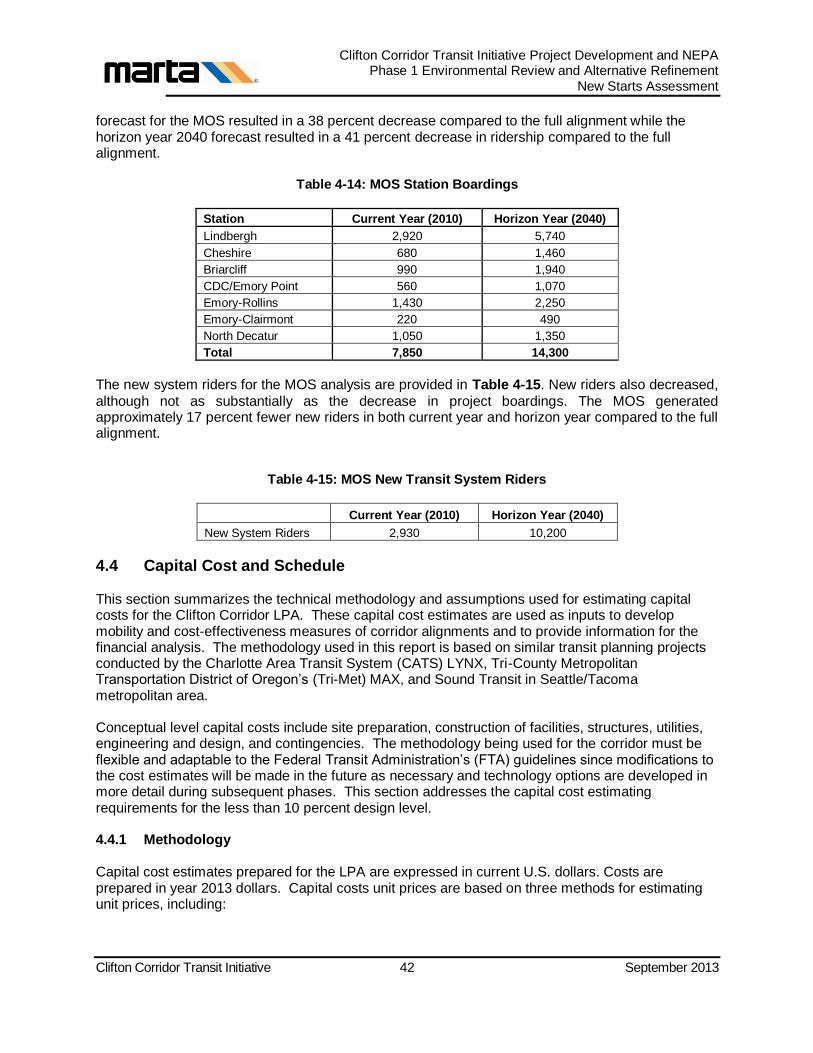
Clifton Corridor Transit Initiative Project Development and NEPA Phase 1 Environmental Review and Alternative Refinement
New Starts Assessment
Clifton Corridor Transit Initiative 42 September 2013
forecast for the MOS resulted in a 38 percent decrease compared to the full alignment while the horizon year 2040 forecast resulted in a 41 percent decrease in ridership compared to the full alignment.
Table 4-14: MOS Station Boardings
Station Current Year (2010) Horizon Year (2040)
Lindbergh 2,920 5,740
Cheshire 680 1,460
Briarcliff 990 1,940
CDC/Emory Point 560 1,070
Emory-Rollins 1,430 2,250
Emory-Clairmont 220 490
North Decatur 1,050 1,350
Total 7,850 14,300
The new system riders for the MOS analysis are provided in Table 4-15. New riders also decreased,
although not as substantially as the decrease in project boardings. The MOS generated approximately 17 percent fewer new riders in both current year and horizon year compared to the full alignment.
Table 4-15: MOS New Transit System Riders
Current Year (2010) Horizon Year (2040)
New System Riders 2,930 10,200
4.4 Capital Cost and Schedule
This section summarizes the technical methodology and assumptions used for estimating capital costs for the Clifton Corridor LPA. These capital cost estimates are used as inputs to develop mobility and cost-effectiveness measures of corridor alignments and to provide information for the financial analysis. The methodology used in this report is based on similar transit planning projects conducted by the Charlotte Area Transit System (CATS) LYNX, Tri-County Metropolitan Transportation District of Oregon’s (Tri-Met) MAX, and Sound Transit in Seattle/Tacoma metropolitan area.
Conceptual level capital costs include site preparation, construction of facilities, structures, utilities, engineering and design, and contingencies. The methodology being used for the corridor must be flexible and adaptable to the Federal Transit Administration’s (FTA) guidelines since modifications to the cost estimates will be made in the future as necessary and technology options are developed in more detail during subsequent phases. This section addresses the capital cost estimating requirements for the less than 10 percent design level.
4.4.1 Methodology
Capital cost estimates prepared for the LPA are expressed in current U.S. dollars. Costs are prepared in year 2013 dollars. Capital costs unit prices are based on three methods for estimating unit prices, including:
Clifton Corridor Transit Initiative Project Development and NEPA Phase 1 Environmental Review and Alternative Refinement
New Starts Assessment
Clifton Corridor Transit Initiative 43 September 2013
Historical bid prices
Analysis of production rates, labor, equipment rates, and material costs for each construction activity
Parametric unit costs
These methods may be used individually or in combination. For the conceptual design level, when limited engineering details are available, the historical bid price method is typically used.
Capital cost estimates are developed in accordance with FTA guidelines. The guidelines call for cost estimates to be prepared and reported using the latest FTA Standard Cost Categories (SCC). These cost categories form the basis format and structure which are used for capital cost detail and summary sheets that will be developed for this project. The FTA Standard Cost Category organization allows for a more direct comparison to other FTA funded transit projects.
4.4.2 Assumptions
Below are the Standard Cost Category definitions of each element used in the capital cost estimate and assumptions for each. The elements are grouped according to the FTA Standard Cost Category worksheet and are presented below for the LRT alternative alignments.
SCC 10.00: Guideway and Track Elements
The guideway cost is based on parametric unit costs which are identified above for the alternative alignments. Guideway construction includes at grade, aerial, and sub-grade structures such as retaining walls, bridges, and tunnels. Generally, all guideway cost estimates provide the following:
At grade structures
o All site work, including clearing, grubbing, and excavation
o Borrow, fill, and soil stabilization
o Grassing
o Retaining walls
Aerial Structures
o Structural excavation and backfill
o Concrete footings, columns, pier caps, and deck slab
o Steel reinforcement
o Guardrail
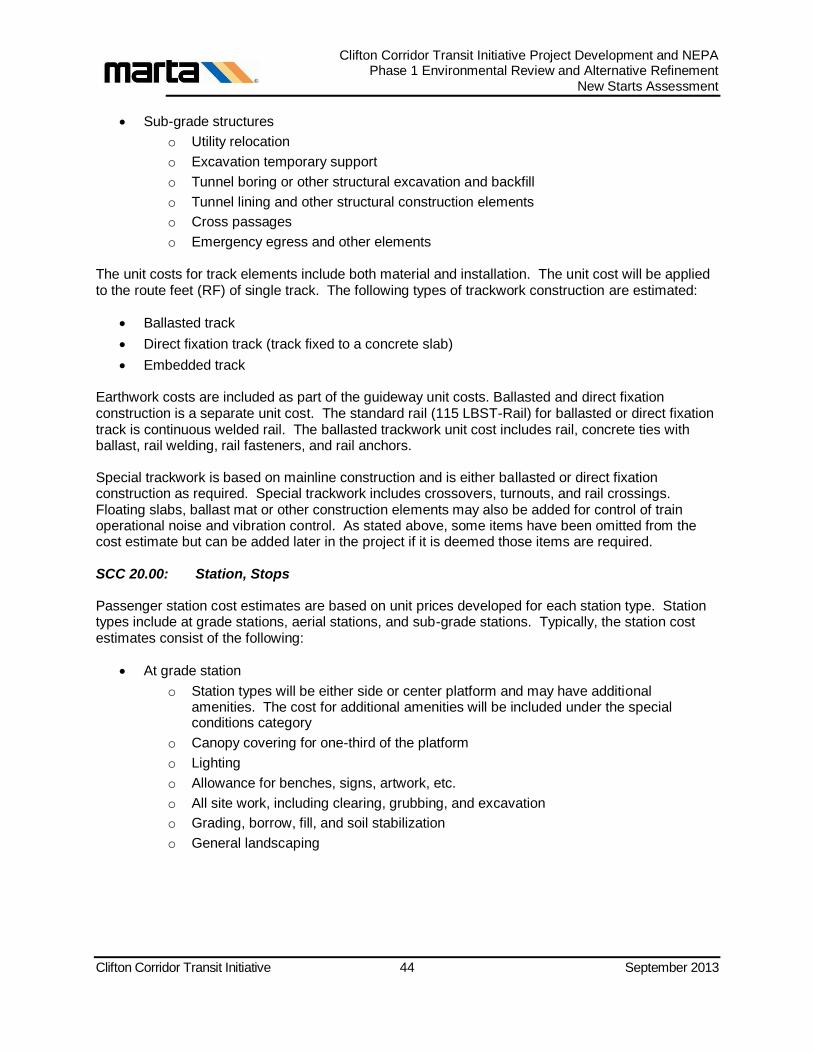
Clifton Corridor Transit Initiative Project Development and NEPA Phase 1 Environmental Review and Alternative Refinement
New Starts Assessment
Clifton Corridor Transit Initiative 44 September 2013
Sub-grade structures
o Utility relocation
o Excavation temporary support
o Tunnel boring or other structural excavation and backfill
o Tunnel lining and other structural construction elements
o Cross passages
o Emergency egress and other elements
The unit costs for track elements include both material and installation. The unit cost will be applied to the route feet (RF) of single track. The following types of trackwork construction are estimated:
Ballasted track
Direct fixation track (track fixed to a concrete slab)
Embedded track
Earthwork costs are included as part of the guideway unit costs. Ballasted and direct fixation construction is a separate unit cost. The standard rail (115 LBST-Rail) for ballasted or direct fixation track is continuous welded rail. The ballasted trackwork unit cost includes rail, concrete ties with ballast, rail welding, rail fasteners, and rail anchors.
Special trackwork is based on mainline construction and is either ballasted or direct fixation construction as required. Special trackwork includes crossovers, turnouts, and rail crossings. Floating slabs, ballast mat or other construction elements may also be added for control of train operational noise and vibration control. As stated above, some items have been omitted from the cost estimate but can be added later in the project if it is deemed those items are required.
SCC 20.00: Station, Stops
Passenger station cost estimates are based on unit prices developed for each station type. Station types include at grade stations, aerial stations, and sub-grade stations. Typically, the station cost estimates consist of the following:
At grade station
o Station types will be either side or center platform and may have additional amenities. The cost for additional amenities will be included under the special conditions category
o Canopy covering for one-third of the platform
o Lighting
o Allowance for benches, signs, artwork, etc.
o All site work, including clearing, grubbing, and excavation
o Grading, borrow, fill, and soil stabilization
o General landscaping
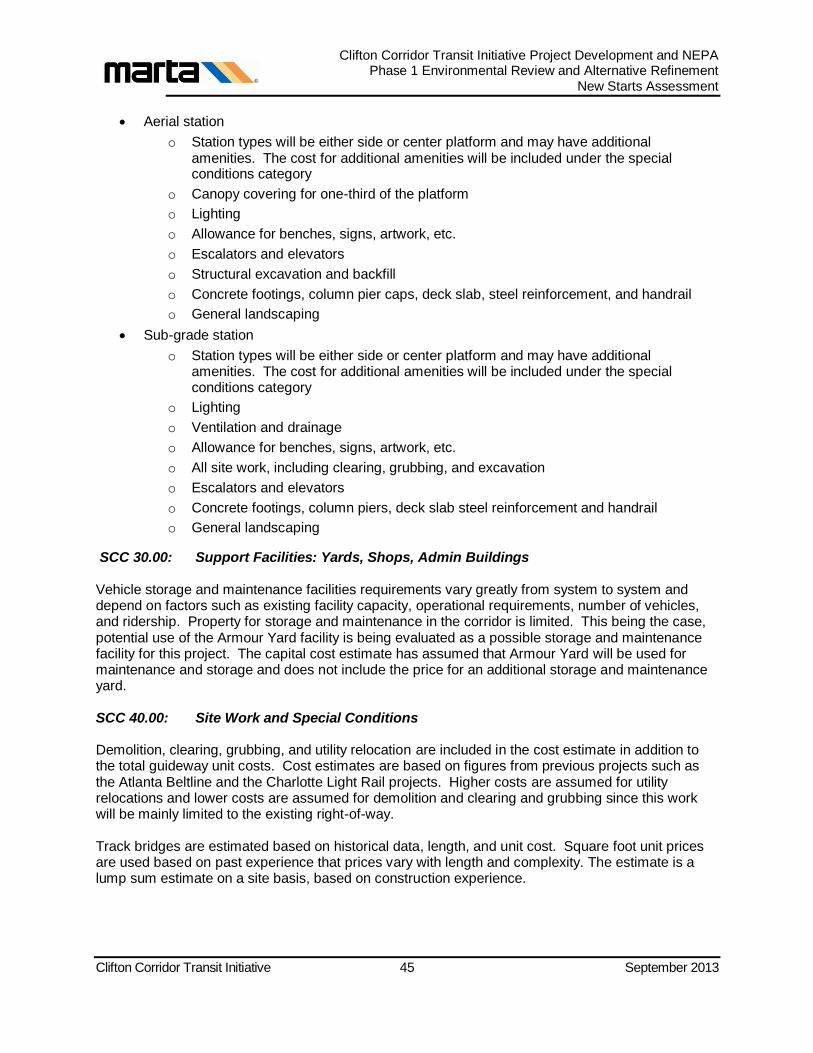
Clifton Corridor Transit Initiative Project Development and NEPA Phase 1 Environmental Review and Alternative Refinement
New Starts Assessment
Clifton Corridor Transit Initiative 45 September 2013
Aerial station
o Station types will be either side or center platform and may have additional amenities. The cost for additional amenities will be included under the special conditions category
o Canopy covering for one-third of the platform
o Lighting
o Allowance for benches, signs, artwork, etc.
o Escalators and elevators
o Structural excavation and backfill
o Concrete footings, column pier caps, deck slab, steel reinforcement, and handrail
o General landscaping
Sub-grade station
o Station types will be either side or center platform and may have additional amenities. The cost for additional amenities will be included under the special conditions category
o Lighting
o Ventilation and drainage
o Allowance for benches, signs, artwork, etc.
o All site work, including clearing, grubbing, and excavation
o Escalators and elevators
o Concrete footings, column piers, deck slab steel reinforcement and handrail
o General landscaping
SCC 30.00: Support Facilities: Yards, Shops, Admin Buildings
Vehicle storage and maintenance facilities requirements vary greatly from system to system and depend on factors such as existing facility capacity, operational requirements, number of vehicles, and ridership. Property for storage and maintenance in the corridor is limited. This being the case, potential use of the Armour Yard facility is being evaluated as a possible storage and maintenance facility for this project. The capital cost estimate has assumed that Armour Yard will be used for maintenance and storage and does not include the price for an additional storage and maintenance yard.
SCC 40.00: Site Work and Special Conditions
Demolition, clearing, grubbing, and utility relocation are included in the cost estimate in addition to the total guideway unit costs. Cost estimates are based on figures from previous projects such as the Atlanta Beltline and the Charlotte Light Rail projects. Higher costs are assumed for utility relocations and lower costs are assumed for demolition and clearing and grubbing since this work will be mainly limited to the existing right-of-way.
Track bridges are estimated based on historical data, length, and unit cost. Square foot unit prices are used based on past experience that prices vary with length and complexity. The estimate is a lump sum estimate on a site basis, based on construction experience.

Clifton Corridor Transit Initiative Project Development and NEPA Phase 1 Environmental Review and Alternative Refinement
New Starts Assessment
Clifton Corridor Transit Initiative 46 September 2013
SCC 50.00: Systems
Assumed systems for LRT include traction power substations, overhead contact system, communication system, fire and safety systems, security systems, and fare collection system.
Traction Power: This estimate assumes an overhead contact system with trolley wire and single
center catenary poles, where appropriate. Traction power substations are assumed to be spaced at one-mile intervals along the alignment. Capital cost for this element is based on comparable costs from other systems.
Communications: This estimate assumes the system utilizes a fiber optic communication system (radio, telephone, public address, variable message signs, and CCTV) which allows transit operators to communicate with the control center and allows communication with passengers and law enforcement. Costs for this element are based on work of similar nature from other similar projects and include spare parts and appropriate allowances.
Fare Collection: Costs for the fare collection system are based on current MARTA fare collection system costs. It should be noted that fare collection technology may change and the costs may be subject to change in the latter stages of the design process to insure the most current design standards.
SCC 60.00: Right-of-Way, Land, Existing Improvements
Right-of-Way (ROW) includes the cost of purchasing and gaining access to all required property along the alignment for project implementation. This includes property acquisition fees, permanent, and temporary easements. Costs also include legal fees, appraisals, residential, and business relocations. Partial takes and easements along the alignment length are estimated based on construction limits. For cost estimate purposes high end ROW costs are used; however, there is potential that the cost could decrease as a result of the ROW negotiation process.
SCC 70.00: Vehicles
Vehicles include provisions for spare parts. Unit prices for these vehicles are based on the American Public Transportation Association’s (APTA) database for U.S. average new vehicle costs for 2010 and 2011.
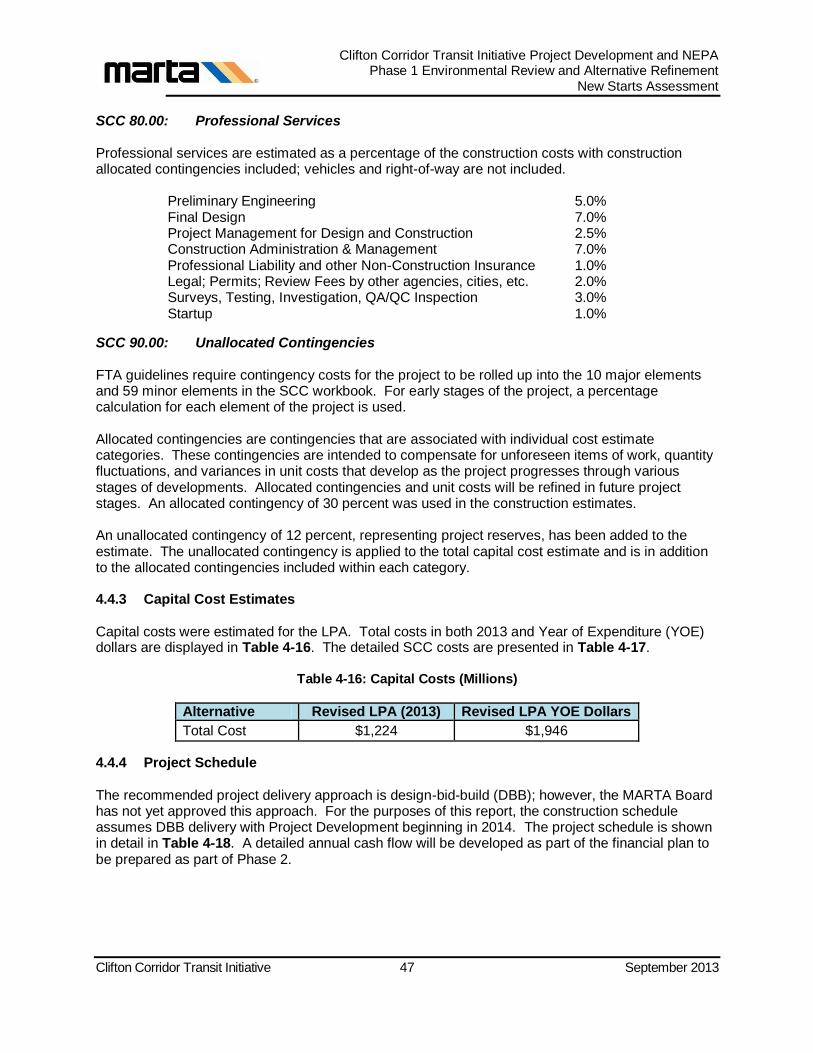
Clifton Corridor Transit Initiative Project Development and NEPA Phase 1 Environmental Review and Alternative Refinement
New Starts Assessment
Clifton Corridor Transit Initiative 47 September 2013
SCC 80.00: Professional Services
Professional services are estimated as a percentage of the construction costs with construction allocated contingencies included; vehicles and right-of-way are not included.
Preliminary Engineering 5.0% Final Design 7.0% Project Management for Design and Construction 2.5% Construction Administration & Management 7.0% Professional Liability and other Non-Construction Insurance 1.0% Legal; Permits; Review Fees by other agencies, cities, etc. 2.0% Surveys, Testing, Investigation, QA/QC Inspection 3.0% Startup 1.0%
SCC 90.00: Unallocated Contingencies
FTA guidelines require contingency costs for the project to be rolled up into the 10 major elements and 59 minor elements in the SCC workbook. For early stages of the project, a percentage calculation for each element of the project is used.
Allocated contingencies are contingencies that are associated with individual cost estimate categories. These contingencies are intended to compensate for unforeseen items of work, quantity fluctuations, and variances in unit costs that develop as the project progresses through various stages of developments. Allocated contingencies and unit costs will be refined in future project stages. An allocated contingency of 30 percent was used in the construction estimates.
An unallocated contingency of 12 percent, representing project reserves, has been added to the estimate. The unallocated contingency is applied to the total capital cost estimate and is in addition to the allocated contingencies included within each category.
4.4.3 Capital Cost Estimates
Capital costs were estimated for the LPA. Total costs in both 2013 and Year of Expenditure (YOE) dollars are displayed in Table 4-16. The detailed SCC costs are presented in Table 4-17.
Table 4-16: Capital Costs (Millions)
Alternative Revised LPA (2013) Revised LPA YOE Dollars
Total Cost $1,224 $1,946
4.4.4 Project Schedule
The recommended project delivery approach is design-bid-build (DBB); however, the MARTA Board has not yet approved this approach. For the purposes of this report, the construction schedule assumes DBB delivery with Project Development beginning in 2014. The project schedule is shown in detail in Table 4-18. A detailed annual cash flow will be developed as part of the financial plan to be prepared as part of Phase 2.
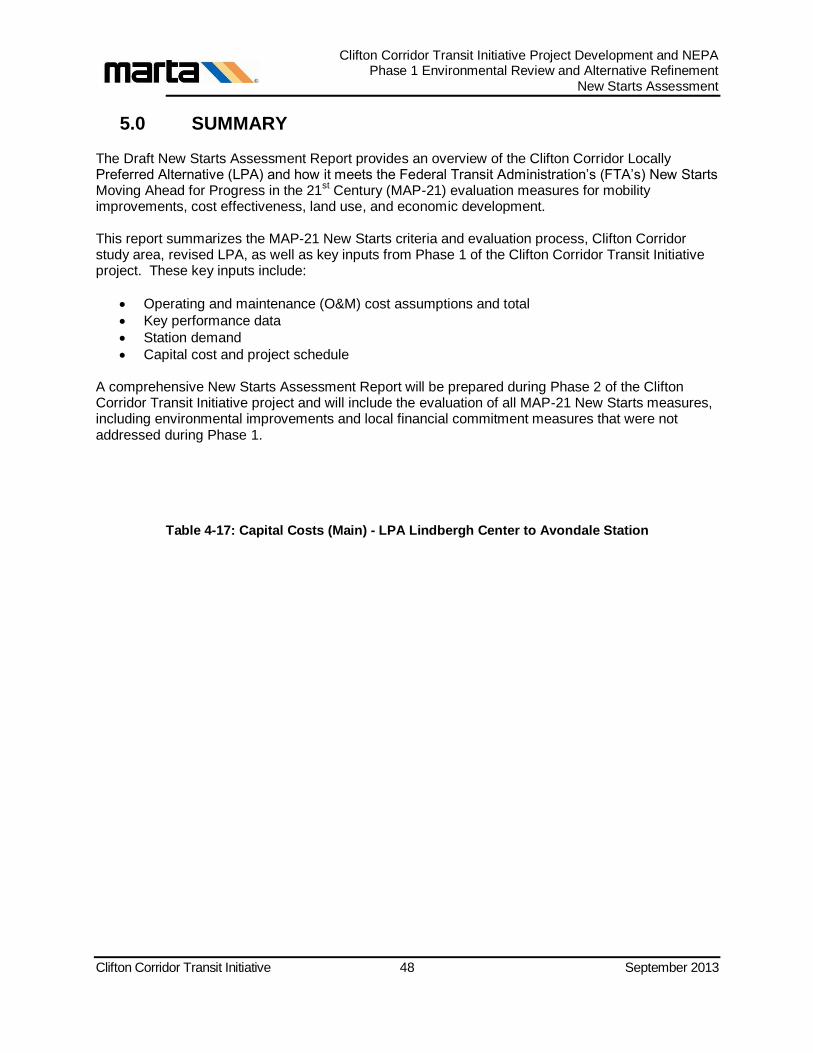
Clifton Corridor Transit Initiative Project Development and NEPA Phase 1 Environmental Review and Alternative Refinement
New Starts Assessment
Clifton Corridor Transit Initiative 48 September 2013
5.0 SUMMARY
The Draft New Starts Assessment Report provides an overview of the Clifton Corridor Locally Preferred Alternative (LPA) and how it meets the Federal Transit Administration’s (FTA’s) New Starts Moving Ahead for Progress in the 21
st Century (MAP-21) evaluation measures for mobility
improvements, cost effectiveness, land use, and economic development.
This report summarizes the MAP-21 New Starts criteria and evaluation process, Clifton Corridor study area, revised LPA, as well as key inputs from Phase 1 of the Clifton Corridor Transit Initiative project. These key inputs include:
Operating and maintenance (O&M) cost assumptions and total
Key performance data
Station demand
Capital cost and project schedule
A comprehensive New Starts Assessment Report will be prepared during Phase 2 of the Clifton Corridor Transit Initiative project and will include the evaluation of all MAP-21 New Starts measures, including environmental improvements and local financial commitment measures that were not addressed during Phase 1.
Table 4-17: Capital Costs (Main) - LPA Lindbergh Center to Avondale Station

Clifton Corridor Transit Initiative Project Development and NEPA Phase 1 Environmental Review and Alternative Refinement
New Starts Assessment
Clifton Corridor Transit Initiative 49 September 2013
MARTA - FTA FUNDED 2013
Alternatives Analysis 2028
Quantity Base Year
Dollars w/o
Contingency
(X000)
Base Year
Dollars
Allocated
Contingency
(X000)
Base Year
Dollars
TOTAL
(X000)
Base Year
Dollars Unit
Cost
(X000)
Base Year
Dollars
Percentage
of
Construction
Cost
Base Year
Dollars
Percentage
of
Total
Project Cost
YOE Dollars
Total
(X000)
10 GUIDEWAY & TRACK ELEMENTS (route miles) 8.56 349,249 104,775 454,024 $53,040 62% 37% 767,395
10.01 Guideway: At-grade exclusive right-of-way 0 0
10.02 Guideway: At-grade semi-exclusive (allows cross-traffic) 0.86 4,768 1,430 6,198 $7,207 10,476
10.03 Guideway: At-grade in mixed traffic 2.30 15,411 4,623 20,034 $8,710 33,862
10.04 Guideway: Aerial structure 0.96 18,364 5,509 23,874 $24,868 40,351
10.05 Guideway: Built-up fill 0.00 0 0 0 $14,405 0
10.06 Guideway: Underground cut & cover 0.31 57,288 17,186 74,474 $240,240 125,877
10.07 Guideway: Underground tunnel 2.53 213,734 64,120 277,855 $109,824 469,632
10.08 Guideway: Retained cut or fill 1.60 22,624 6,787 29,411 $18,382 49,710
10.09 Track: Direct fixation 8,086 2,426 10,512 17,767
10.10 Track: Embedded 4,894 1,468 6,362 10,754
10.11 Track: Ballasted 2,390 717 3,107 5,251
10.12 Track: Special (switches, turnouts) 1,691 507 2,198 3,715
10.13 Track: Vibration and noise dampening 0 0
20 STATIONS, STOPS, TERMINALS, INTERMODAL (number) 10 65,560 19,668 85,228 $8,523 12% 7% 142,033
20.01 At-grade station, stop, shelter, mall, terminal, platform 6 12,000 3,600 15,600 $2,600 25,997
20.02 Aerial station, stop, shelter, mall, terminal, platform 1 12,500 3,750 16,250 $16,250 27,081
20.03 Underground station, stop, shelter, mall, terminal, platform 3 37,500 11,250 48,750 $16,250 81,242
20.04 Other stations, landings, terminals: Intermodal, ferry, trolley, etc. 0 0
20.05 Joint development 0 0
20.06 Automobile parking multi-story structure 0 0
20.07 Elevators, escalators 3,560 1,068 4,628 7,713
30 SUPPORT FACILITIES: YARDS, SHOPS, ADMIN. BLDGS 8.56 23,500 7,050 30,550 $3,569 4% 2% 52,845
30.01 Administration Building: Office, sales, storage, revenue counting 0 0
30.02 Light Maintenance Facility 15,000 4,500 19,500 33,731
30.03 Heavy Maintenance Facility 0 0
30.04 Storage or Maintenance of Way Building 1,000 300 1,300 2,249
30.05 Yard and Yard Track 7,500 2,250 9,750 16,865
40 SITEWORK & SPECIAL CONDITIONS 8.56 54,761 16,428 71,190 $8,317 10% 6% 116,429
40.01 Demolition, Clearing, Earthwork 5,000 1,500 6,500 10,631
40.02 Site Utilities, Utility Relocation 30,282 9,085 39,366 64,383
40.03 Haz. mat'l, contam'd soil removal/mitigation, ground water treatments 1,808 542 2,350 3,844
40.04 Environmental mitigation, e.g. wetlands, historic/archeologic, parks 1,808 542 2,350 3,844
40.05 Site structures including retaining walls, sound walls 0 0 0 0
40.06 Pedestrian / bike access and accommodation, landscaping 3,164 949 4,113 6,727
40.07 Automobile, bus, van accessways including roads, parking lots 2,700 810 3,510 5,740
40.08 Temporary Facilities and other indirect costs during construction 10,000 3,000 13,000 21,261
50 SYSTEMS 8.56 69,241 20,772 90,013 $10,516 12% 7% 162,855
50.01 Train control and signals 17,446 5,234 22,680 41,033
50.02 Traffic signals and crossing protection 8,894 2,668 11,562 20,919
50.03 Traction power supply: substations 9,898 2,969 12,868 23,280
50.04 Traction power distribution: catenary and third rail 15,864 4,759 20,623 37,312
50.05 Communications 7,638 2,291 9,930 17,965
50.06 Fare collection system and equipment 4,500 1,350 5,850 10,584
50.07 Central Control 5,000 1,500 6,500 11,760
8.56 562,311 168,693 731,005 $85,398 100% 60% 1,241,556
60 ROW, LAND, EXISTING IMPROVEMENTS 8.56 54,187 16,256 70,443 $8,229 6% 94,694
60.01 Purchase or lease of real estate 49,848 14,954 64,802 87,110
60.02 Relocation of existing households and businesses 4,339 1,302 5,641 7,583
70 VEHICLES (number) 20 68,000 20,400 88,400 $4,420 7% 158,265
70.01 Light Rail 16 64,000 19,200 83,200 $5,200 148,956
70.02 Heavy Rail 0 0
70.03 Commuter Rail 0 0
70.04 Bus 0 0
70.05 Other 0 0
70.06 Non-revenue vehicles 0 0
70.07 Spare parts 4 4,000 1,200 5,200 $1,300 9,310
80 PROFESSIONAL SERVICES (applies to Cats. 10-50) 8.56 208,336 62,501 270,837 $31,640 37% 22% 360,075
80.01 Preliminary Engineering 36,550 10,965 47,515 63,171
80.02 Final Design 51,170 15,351 66,521 88,439
80.03 Project Management for Design and Construction 18,275 5,483 23,758 31,585
80.04 Construction Administration & Management 51,170 15,351 66,521 88,439
80.05 Professional Liability and other Non-Construction Insurance 7,310 2,193 9,503 12,634
80.06 Legal; Permits; Review Fees by other agencies, cities, etc. 14,620 4,386 19,006 25,268
80.07 Surveys, Testing, Investigation, Inspection 21,930 6,579 28,509 37,903
80.08 Start up 7,310 2,193 9,503 12,634
Subtotal (10 - 80) 8.56 892,835 267,850 1,160,685 $135,594 95% 1,854,590
90 UNALLOCATED CONTINGENCY 58,034 5% 83,862
Subtotal (10 - 90) 8.56 1,218,720 $142,374 100% 1,938,452
100 FINANCE CHARGES 5,714 0% 8,000
Total Project Cost (10 - 100) 8.56 1,224,434 $143,041 100% 1,946,452
Allocated Contingency as % of Base Yr Dollars w/o Contingency 30.00%
Unallocated Contingency as % of Base Yr Dollars w/o Contingency 6.50%
Total Contingency as % of Base Yr Dollars w/o Contingency 36.50%
Unallocated Contingency as % of Subtotal (10 - 80) 5.00%
YOE Construction Cost per Mile (X000) $145,042
YOE Total Project Cost per Mile Not Including Vehicles (X000) $208,900
YOE Total Project Cost per Mile (X000) $227,389
Construction Subtotal (10 - 50)
Yr of Base Year $
Yr of Revenue Ops
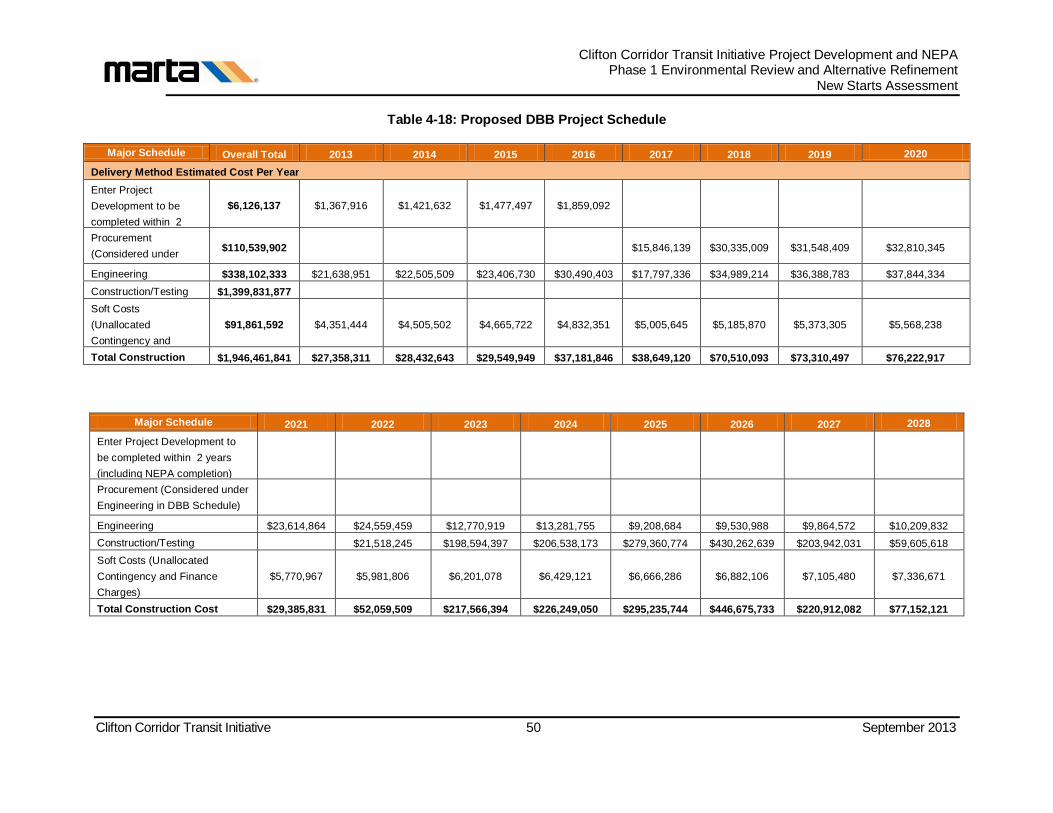
Clifton Corridor Transit Initiative Project Development and NEPA Phase 1 Environmental Review and Alternative Refinement
New Starts Assessment
Clifton Corridor Transit Initiative 50 September 2013
Table 4-18: Proposed DBB Project Schedule
Major Schedule Overall Total 2013 2014 2015 2016 2017 2018 2019 2020
Delivery Method Estimated Cost Per Year
Enter Project
Development to be
completed within 2
years (including NEPA
completion)
$6,126,137 $1,367,916 $1,421,632 $1,477,497 $1,859,092
Procurement
(Considered under
Engineering in DBB
Schedule)
$110,539,902 $15,846,139 $30,335,009 $31,548,409 $32,810,345
Engineering $338,102,333 $21,638,951 $22,505,509 $23,406,730 $30,490,403 $17,797,336 $34,989,214 $36,388,783 $37,844,334
Construction/Testing $1,399,831,877
Soft Costs
(Unallocated
Contingency and
Finance Charges)
$91,861,592 $4,351,444 $4,505,502 $4,665,722 $4,832,351 $5,005,645 $5,185,870 $5,373,305 $5,568,238
Total Construction
Cost
$1,946,461,841 $27,358,311 $28,432,643 $29,549,949 $37,181,846 $38,649,120 $70,510,093 $73,310,497 $76,222,917
Major Schedule 2021 2022 2023 2024 2025 2026 2027 2028
Enter Project Development to
be completed within 2 years
(including NEPA completion)
Procurement (Considered under
Engineering in DBB Schedule)
Engineering $23,614,864 $24,559,459 $12,770,919 $13,281,755 $9,208,684 $9,530,988 $9,864,572 $10,209,832
Construction/Testing $21,518,245 $198,594,397 $206,538,173 $279,360,774 $430,262,639 $203,942,031 $59,605,618
Soft Costs (Unallocated
Contingency and Finance
Charges)
$5,770,967 $5,981,806 $6,201,078 $6,429,121 $6,666,286 $6,882,106 $7,105,480 $7,336,671
Total Construction Cost $29,385,831 $52,059,509 $217,566,394 $226,249,050 $295,235,744 $446,675,733 $220,912,082 $77,152,121