client satisfaction survey 2006 - yukon · client satisfaction survey 2006 social assistance...
TRANSCRIPT

CLIENT SATISFACTION SURVEY 2006Social Assistance Branch, Adult Services
Department of Health and Social Services
Prepared byYukon Bureau of Statistics
September, 2006

RESULTS FROM THE CLIENT SATISFACTION SURVEY 2006
Yukon Adult Services Unit, Social Assistance Branch
Department of Health and Social Services
September 2006
Prepared byYukon Bureau of StatisticsExecutive Council Office

This report was produced by the Yukon Government’s Bureau of Statistics, which is a branch of the Government’s Executive Council office. The Bureau was working for the Social Services branch in the Department of Health and Social Services which commissioned this report.
Please note, permission is granted to use the contents of this publication provided acknowledgement is given to:
The Department of Health and Social Services, Social Services BranchYukon Government
For further information about the Social Services Branch Client Satisfaction Survey, contact:
The Department of Health and Social ServicesAdult Services Unit, Social Services Branch (H-4)Attention: Tim Brady, Manager, Adult Services Unit Phone: (867) 667-5691Email: [email protected]
For further information about the activities or publications of the Yukon Bureau of Statistics, contact:
Government of YukonExecutive Council OfficeBureau of Statistics (A-8C)Box 2703Whitehorse, YukonY1A 2C6
Phone: (867)667-5640 or callers outside Whitehorse but within Yukon call 1-800-661-0408 ext. 5640Fax: (867) 393-6203Email: [email protected]: http://www.gov.yk.ca/depts/eco/stats/index.html

CLIENT SATISFACTION SURVEY 2006 I
CONTENTSIntroduction . . . . . . . . . . . . . . . . . . . . . . . . . . . . . . . . . . . . . . . . . . . . . .1
Methodology . . . . . . . . . . . . . . . . . . . . . . . . . . . . . . . . . . . . . . . . . . . . . .1
Executive Summary . . . . . . . . . . . . . . . . . . . . . . . . . . . . . . . . . . . . . . . .2
Reception/Front Office Staff . . . . . . . . . . . . . . . . . . . . . . . . . . . . . .2
Case Managers . . . . . . . . . . . . . . . . . . . . . . . . . . . . . . . . . . . . . . . . . .2
Overall Details . . . . . . . . . . . . . . . . . . . . . . . . . . . . . . . . . . . . . . . . . . . .4
Reception/Front Office Staff . . . . . . . . . . . . . . . . . . . . . . . . . . . . . .4
Case Manager . . . . . . . . . . . . . . . . . . . . . . . . . . . . . . . . . . . . . . . . . . .9
Long-Answer Questions . . . . . . . . . . . . . . . . . . . . . . . . . . . . . . . . . . .14
Whitehorse / Communities Comparison . . . . . . . . . . . . . . . . . . . . .18
Reception/Front Office Staff . . . . . . . . . . . . . . . . . . . . . . . . . . . . .18
Case Manager . . . . . . . . . . . . . . . . . . . . . . . . . . . . . . . . . . . . . . . . . .23
Appendix: Client Satisfaction Survey form . . . . . . . . . . . . . . . . . . .28

CLIENT SATISFACTION SURVEY 2006 1
INTRODUCTIONThe Adult Services Unit of the Social Assistance Branch in the Department of Health and Social Services contacted the Yukon Bureau of Statistics in May, 2006 to undertake a survey of client satisfaction.
The survey, which had been conducted in 2001, 2002, 2004 and 2005, is a means for the staff of the Adult Services Unit to assess their service to their clients, which is the primary business of the Social Assistance Branch.
The survey, which asked clients to rate the services and staff working at the Branch, used questions similar to those used in previous surveys so that the results can be compared across the years and the Adult Services Unit can assess if there is improvement over time.
Thanks are due to those social assistance clients who took the time to respond to the survey.
METHODOLOGYThe Adult Services Unit of the Social Assistance Branch contacted the Bureau of Statistics in May, 2006 to administer and analyse the client satisfaction survey for their unit. This survey had been developed and administered in 2001, 2002, 2004 and 2005.
As a semi-autonomous unit within the Yukon Government, the Yukon Bureau of Statistics provides complete impartiality of analysis of survey results, as well as ensuring the confidentiality for individual survey results.
The 2006 Client Satisfaction Survey was mailed out in June 2006 to all social assistance clients, 666 in total, with a postage-paid return envelope included to facilitate mail-backs. Of those mailed-out forms, 108 were returned completed. Telephone follow-up of non-respondents resulted in an additional 231 completed surveys, for a combined total of 339. Compared to previous years, there were 343 completed in 2005, 320 completed in 2004, 341 in 2002 and 275 in 2001. The overall response rate for the 2006 survey was 51%, which was a decrease from previous years (52% in 2005, 55% in 2002, and 62% in 2001) except 2004, when the response rate was 47%.
There was a large number of potential respondents, 236 or 35%, whom the Bureau was unable to contact due to a non-working telephone number, cell number, or no telephone number at all. There were 44 respondents, or 7%, whom the Bureau was unable to contact due to no answer at the contact number provided or contact was only made via an answering machine. Another 28 respondents, or 4%, had valid contact numbers but were unavailable to complete the survey either because they were absent during the survey or because there were language issues. Three respondents (0.5%) were unable to complete the survey due to special circumstances (i.e. deceased or moved). There were 16 respondents, or 2%, who refused to participate.

CLIENT SATISFACTION SURVEY 2006 2
EXECUTIVE SUMMARYRECEPTION/FRONT OFFICE STAFF
In 2006, 87.0% of clients rated the reception/front office staff ‘good’ or ‘excellent’ in answering their questions; in 2005 this figure was 87.2%, in 2004 it was 87.9%, in 2002 it was 87.1% and in 2001 it was 84.4%.
In 2006, 88.5% of clients rated the reception/front office staff ‘good’ or ‘excellent’ in knowing what they were doing; in 2005 this figure was 84.9%, in 2004 it was 83.4%, in 2002 it was 85.6% and in 2001 it was 87.7%.
In 2006, 91.7% of clients rated the reception/front office staff ‘good’ or ‘excellent’ in being polite/respectful; in 2005 this figure was 92.4%, in 2004 it was 86.6%, in 2002 it was 89.7% and in 2001 it was 90.8%.
In 2006, 84.3% of clients rated the reception/front office staff ‘good’ or ‘excellent’ in being quick to respond; in 2005 this figure was 82.8%, in 2004 it was 81.2%, in 2002 it was 83.8% and in 2001 it was 84.7%.
In 2006, 87.9% of clients rated the reception/front office staff ‘good’ or ‘excellent’ in being patient; in 2005 this figure was 90.0%, in 2004 it was 83.4%, in 2002 it was 84.7% and in 2001 it was 85.1%
In 2006, 83.1% of clients rated the reception/front office staff ‘good’ or ‘excellent’ in being personal and caring about their situation; in 2005 this figure was 80.5%, in 2004 it was 75.0%, in 2002 it was 75.6% and in 2001 it was 80.8%
Answers to questions were:
In 2006, 84.7% of clients rated the reception/front office staff ‘good’ or ‘excellent’ in being clear; in 2005 this figure was 86.9%, in 2004 it was 80.9%, in 2002 it was 80.8% and in 2001 it was 83.6%
In 2006, 86.1% of clients rated the reception/front office staff ‘good’ or ‘excellent’ in being timely; in 2005 this figure was 83.7%, in 2004 it was 81.0%, in 2002 it was 77.0% and in 2001 it was 78.2%
In 2006, 84.7% of clients rated the reception/front office staff ‘good’ or ‘excellent’ in being helpful; in 2005 this figure was 85.5%, in 2004 it was 80.7%, in 2002 it was 83.5% and in 2001 it was 86.6%
CASE MANAGERSIn 2006, 81.1% of clients rated their case managers ‘good’ or ‘excellent’ in answering their questions; in 2005 this figure was 81.6%, in 2004 it was 85.3%, in 2002 it was 86.5% and in 2001 it was 86.9%
In 2006, 82.0% of clients rated their case managers ‘good’ or ‘excellent’ in knowing what they were doing; in 2005 this figure was 80.8%, in 2004 it was 82.8%, in 2002 it was 84.8% and in 2001 it was 85.1%
In 2006, 86.5% of clients rated their case managers ‘good’ or ‘excellent’ in being polite/respectful; in 2005 this figure was 87.1%, in 2004 it was 87.2%, in 2002 it was 87.5% and in 2001 it was 89.1%
In 2006, 82.3% of clients rated their case managers ‘good’ or ‘excellent’ in being quick to respond; in 2005 this figure was 81.0%, in 2004 it was 81.9%, in 2002 it was 81.5% and in 2001 it was 84.0%
In 2006, 84.6% of clients rated their case managers ‘good’ or ‘excellent’ in being patient; in 2005 this figure was 84.3%, in 2004 it was 83.7%, in 2002 it was 86.9% and in 2001 it was 87.9%
In 2006, 82.6% of clients rated their case managers ‘good’ or ‘excellent’ in being personal and
•
•
•
•
•
•
•
•
•
•
•
•
•
•
•

CLIENT SATISFACTION SURVEY 2006 3
caring about their situation; in 2005 this figure was 79.8%, in 2004 it was 80.1%, in 2002 it was 81.1% and in 2001 it was 82.6%
Answers to questions were:
In 2006, 82.0% of clients rated their case managers ‘good’ or ‘excellent’ in being clear; in 2005 this figure was 82.8%, in 2004 it was 81.9%, in 2002 it was 84.2% and in 2001 it was 85.1%
In 2006, 80.5% of clients rated their case managers ‘good’ or ‘excellent’ in being timely; in 2005 this figure was 80.5%, in 2004 it was 80.9%, in 2002 it was 81.3% and in 2001 it was 79.3%
In 2006, 81.4% of clients rated their case managers ‘good’ or ‘excellent’ in being helpful; in 2005 this figure was 80.1%, in 2004 it was 80.0%, in 2002 it was 83.6% and in 2001 it was 82.6%
Overall, in 2006, 85.9% of the clients reported being ‘somewhat satisfied’ or ‘very satisfied’; in 2005 this figure was 96.4%, in 2004 it was 87.2%, in 2002 it was 88.6% and in 2001 it was 84.1%
•
•
•

CLIENT SATISFACTION SURVEY 2006 4
OVERALL DETAILSRECEPTION/FRONT OFFICE STAFFClients of the Adult Services Unit were asked to rate services based on their experience. The first section of the survey related to their experience when dealing with reception and front office staff. Clients were asked to rate different areas of service on a scale from ‘Poor’ to ‘Excellent’.
All graphs show results from 2001, 2002, 2004 and 2005 along with findings from the 2006 survey for comparison.
Q2. Clients were asked if the reception/front office staff knew what they were doing.
More respondents in 2006 said this service was ‘excellent’, 46.3%, than in any other year. Meanwhile, fewer respondents rated the service as ‘good’ at 42.2% when compared to all previous years with the exception of 2005.
Answered My Questions
1.8%
42.2%
1.1%2.3% 2.1%1.1% 2.1%1.5%
47.8%
0.9%1.5%
9.4%
36.6%
50.4%
1.8%
9.4%
42.2%44.3%
8.5%
42.8%
48.7%
8.9%
39.2%39.4%
9.9%
Poor Fair Good Excellent Don’t Know
2001
2002
2004
2005
2006
Q1. The first question asked clients if they felt reception or front office staff had answered their questions.
More respondents in 2006 said this service was ‘excellent’, 50.4% than in any other year. Meanwhile, fewer respondents rated the service as ‘good’ at 36.6% when compared to all previous years.
Knew What They Were Doing
2.5%
45.1%
3.3%1.5% 2.3%2.8% 2.8%2.0%
45.8%
1.7%1.8%
6.8%
42.2%
46.3%
2.1%
6.5%
42.6%41.6%
10.6%
44.0%43.1%
10.9%
40.3%39.1%
10.8%
Poor Fair Good Excellent Don’t Know
2001
2002
2004
2005
2006

CLIENT SATISFACTION SURVEY 2006 5
Q3. This question asked clients if they felt reception/front office staff were polite and/or respectful.
62.2% of respondents rated this service as ‘excellent’, more than any year except 2005. However, the amount who rated the service as ‘good’ remained consistent with the two previous years at 29.5%.
Q4. Clients were asked if reception or front office staff were quick to respond.
The number who said this service was ‘excellent’ in 2006 (50.4%) was very close to the number for 2005 (50.7%). These numbers were higher than the previous three years. Meanwhile, the number who said this service was ‘good’ was also close to the 2005 number (33.9% compared to 32.1%). These numbers were lower than the previous three years.
Were Polite/Respectful
1.8%
39.9%
1.5%2.6% 1.5%2.2% 2.8%2.6%
63.0%
1.2%1.8%3.5%
29.5%
62.2%
2.1%
6.5%
50.9%
55.1%
6.2%
34.6%
29.4%
8.4%
57.2%
29.4%
3.2%
Poor Fair Good Excellent Don’t Know
2001
2002
2004
2005
2006
Were Quick to Respond
2.9%
43.6%
1.8%2.6% 2.1%3.4% 2.5%
5.0%
50.7%
1.2%3.8%
8.6%
33.9%
50.4%
2.1%
10.6%
41.1%
45.3%
11.5%
38.5%
35.3%
12.8%
45.9%
32.1%
9.9%
Poor Fair Good Excellent Don’t Know
2001
2002
2004
2005
2006

CLIENT SATISFACTION SURVEY 2006 6
Q5. Clients were asked to rate the office staff on patience.
The number of respondents in 2006 who rated the service as ‘excellent’ (51.9%) was slightly lower than the number for 2005 (53.6%), but higher than the previous three years. Meanwhile, the number who rated the service as ‘good’ (36.0%) remained close to the numbers for 2004 (35.3%) and 2005 (36.4%).
Q6. The next question asked if reception or front office staff were personal and caring about the clients’ situation.
More respondents in 2006 said this service was ‘excellent’, 50.4%, than in any other year. 32.7% said the service was ‘good’, and 8.6% said the service was ‘fair’, which is the lowest number for any year since 2001.
Were Patient
2.2%
39.3%
2.2%1.8%3.2%3.1% 4.1%3.2%
53.6%
0.9%2.4%
5.6%
36.0%
51.9%
2.9%
10.5%
45.8% 46.6%
10.3%
38.1%
35.3%
9.4%
48.1%
36.4%
5.2%
Poor Fair Good Excellent Don’t Know
2001
2002
2004
2005
2006
Were Personal and Caring About My Situation
2.9%
34.6%
4.7%5.6%3.8%
5.0% 4.7%4.1%
49.9%
2.3%3.2%
8.6%
32.7%
50.4%
3.5%
11.6%
46.2%
42.4%
15.0%
33.2%
30.3%
15.3%
44.7%
30.6%
12.5%
Poor Fair Good Excellent Don’t Know
2001
2002
2004
2005
2006

CLIENT SATISFACTION SURVEY 2006 7
Q7. Clients were asked to assess whether they felt the answers to their questions were clear.
The percentage of respondents who said this service was ‘excellent’ has followed a general upward trend for the five years of the survey. The number for 2006, 43.7%, is almost the same as the number for 2005, 44.0%. Meanwhile, the percentage who responded ‘good’ has fluctuated somewhat over the past five years, with the number for 2006, 41.0%, lower than all but the number for 2004.
Q8. The next question in this area asked if clients thought their questions were answered in a timely manner.
Again, more respondents, 44.2% in 2006 said this service was ‘excellent’ than in any other year. 41.9% of respondents rated the service as ‘good’ which was very close to the responses given in 2001, 2004, and 2005. Fewer respondents said ‘poor’ in response to this question, 6.2%, than any other year of the survey.
The next set of questions clients were asked to answer focused on how they felt their questions were dealt with by the reception or front office staff. Clients were asked to rate different areas of service on a scale from ‘poor’ to ‘excellent’.
The Answers to My Questions were Clear
2.6%
45.8%
2.2%2.4% 2.7%3.8% 4.1%2.6%
44.0%
0.9%2.4%
9.7%
41.0%43.7%
2.7%
11.6%
37.8%39.2%
14.2%
41.6%40.6%
11.3%
40.3%42.9%
8.7%
Poor Fair Good Excellent Don’t Know
2001
2002
2004
2005
2006
The Answers to My Questions were Timely
4.0%
41.8%
4.0%4.7%3.3%3.1% 4.1%3.8%
42.6%
2.0%2.7%
6.2%
41.9%44.2%
3.2%
13.8%
36.4%38.8%
15.1%
38.2%
41.3%
11.9%
39.7%41.1%
9.6%
Poor Fair Good Excellent Don’t Know
2001
2002
2004
2005
2006

CLIENT SATISFACTION SURVEY 2006 8
Q9. The final question in this area asked clients to rate how helpful the reception and front office staff were in answering their questions.
In 2006, 43.7% of respondents rated this service as ‘excellent’, while 41.0% rated this service as ‘good’. Both numbers are about average for the ratings of the previous four years.
The Answers to My Questions were Helpful
2.5%
43.3%
3.3%2.9% 2.9%5.0% 4.4%4.4%
46.1%
2.0%3.5%
8.0%
41.0%43.7%
2.1%
7.6%
43.3% 43.7%
10.6%
39.8%39.4%
10.0%
41.3%39.4%
7.3%
Poor Fair Good Excellent Don’t Know
2001
2002
2004
2005
2006

CLIENT SATISFACTION SURVEY 2006 9
CASE MANAGERClients of the Adult Services Unit were also asked to rate the service they received based on their experience when dealing with their Case Manager. Clients were once again asked to rate the same areas of service on a scale from ‘poor’ to ‘excellent’ for Case Managers.
All graphs show results from 2001, 2002, 2004 and 2005 along with findings from the 2006 survey for comparison.
Q10. Clients were asked to rate how their Case Managers had answered their questions.
Fewer respondents in 2006 said this service was ‘excellent’, 51.0%, than in any other year. The rating for ‘good’ (30.1%) was also lower than all other years except 2005 (26.8%). More clients rated this service as ‘fair’ at 12.4% than in any previous year.
Q11. Clients were asked to rate their Case Manager on whether the Mangers knew what they were doing.
In 2006, fewer respondents rated this service as ‘excellent’ (48.1%) than in any other year. However, more respondents rated the service as ‘good’ (33.9%) or ‘fair’ (11.8%) than in any previous year.
Answered My Questions
4.0%
33.4%
1.8%
5.0%
2.0%3.8%
2.2%
6.4%
54.8%
0.3%
5.0%
12.4%
30.1%
51.0%
1.2%
7.3%
53.5% 53.8%
6.4%
32.7%31.9%
8.8%
53.4%
26.8%
11.1%
Poor Fair Good Excellent Don’t Know
2001
2002
2004
2005
2006
Knew What They Were Doing
6.2%
33.1%
1.8%
5.6%
2.3%
5.9%
2.5%
7.9%
53.4%
1.5%4.1%
11.8%
33.9%
48.1%
1.2%
6.9%
52.0% 52.3%
7.3%
32.5%30.0%
8.8%
52.8%
27.4%
9.3%
Poor Fair Good Excellent Don’t Know
2001
2002
2004
2005
2006

CLIENT SATISFACTION SURVEY 2006 10
Q12. This question asked clients to rate how polite and/or respectful their case manager was to them as clients.
In 2006, fewer respondents rated this service as ‘excellent’ (55.5%) than in any other year. However, more respondents rated the service as ‘good’ (31.0%) than in any previous year.
Q13. Clients were asked to rate the service level of how quick case managers were to respond to them.
Again, fewer respondents in 2006 said this service was ‘excellent’, 50.4%, than in any other year. 31.9% of respondents rated the service as ‘good’, more than any other year except 2001, which was at 32.7%.
Were Polite/Respectful
4.4%
30.5%
1.8%
5.3%2.3%
4.1%1.6%
5.8%
60.6%
1.2%4.4%
7.1%
31.0%
55.5%
0.9%
4.7%
58.6% 58.8%
5.0%
28.7%26.3%
7.2%
60.9%
26.5%
5.2%
Poor Fair Good Excellent Don’t Know
2001
2002
2004
2005
2006
Were Quick to Respond
6.2%
32.7%
1.8%
5.6%
2.1%
8.4%
1.6%
7.6%
53.9%
0.9%
6.2%
10.0%
31.9%
50.4%
0.9%
8.0%
51.3% 51.6%
10.9%
29.9%29.4%
8.1%
52.5%
27.1%
9.9%
Poor Fair Good Excellent Don’t Know
2001
2002
2004
2005
2006

CLIENT SATISFACTION SURVEY 2006 11
Q14. Clients were asked to rate case managers on patience.
Fewer respondents in 2006 rated this service as ‘excellent’ (51.6%) than any other year. More respondents, 33.0%, rated the service as ‘good’ when compared to all years except 2001, when it was at 33.4%. 10.0% said the service was ‘fair’ which was higher than any other year in the survey.
Q15. The next question asked clients to rate how personal and caring the case managers were about the clients situation.
The number of respondents who said the service was ‘excellent’ has been on a downward trend since 2004 (58.5%), continuing with 2006 at 54.0%. Meanwhile, the numbers for ‘good’ have had a corresponding upward trend from the low in 2004 (21.3%) to the high in 2006 (28.6%). Also, more clients rated this service as ‘fair’ (10.3%) than any other year.
Were Patient
5.1%
33.4%
1.5%
4.7%2.0%
4.7%3.1%
5.8%
55.1%
1.2%3.5%
10.0%
33.0%
51.6%
1.2%
5.5%
54.5% 55.0%
6.4%
31.9%
28.1%
8.4%
55.6%
29.2%
7.9%
Poor Fair Good Excellent Don’t Know
2001
2002
2004
2005
2006
Were Personal and Caring About My Situation
5.8%
28.7%
2.9%
7.6%
2.4%
6.9%
3.8%
10.2%
57.1%
1.5%
4.7%
10.3%
28.6%
54.0%
1.5%
8.7%
53.9%
58.2%
8.8%
22.9%21.3%
9.4%
58.8%
22.7%
7.9%
Poor Fair Good Excellent Don’t Know
2001
2002
2004
2005
2006

CLIENT SATISFACTION SURVEY 2006 12
Q16. Clients were asked to assess whether they felt the answers to their questions received from case managers were clear.
The 2006 respondents’ answers about this service being ‘excellent’, 47.2%, were average when compared with the previous years. There were 34.8% of respondents who said the service was ‘good’, which is close to the numbers from 2002, 2004 and 2005. There were 10.6% of respondents who felt the service was ‘fair’ which was more than in any other year.
Q17. The next question in this area asked if clients thought their questions were answered in a timely manner by their case managers.
Only 46.0% of respondents felt this service was ‘excellent’, the lowest number since 2001. However, after a downward trend, the numbers for ‘good’ were back at 34.5%, the same as in 2002.
The Answers to My Questions were Clear
4.0%
39.6%
2.5%4.7%
2.6%
5.9%
2.2%
7.9%
48.7%
0.3%
4.7%
10.6%
34.8%
47.2%
1.8%
8.4%
45.5%48.5%
8.5%
35.7%35.3%
10.0%
46.6%
34.1%
8.5%
Poor Fair Good Excellent Don’t Know
2001
2002
2004
2005
2006
The Answers to My Questions were Timely
5.1%
36.7%
3.6%5.6%
2.3%
6.9%
1.9%
9.0%
49.3%
1.2%
5.9%
10.3%
34.5%
46.0%
1.8%
12.0%
42.6%
46.8%
10.8%
34.5%33.1%
10.3%
47.8%
31.2%
8.7%
Poor Fair Good Excellent Don’t Know
2001
2002
2004
2005
2006

CLIENT SATISFACTION SURVEY 2006 13
Q18. The final question in this area asked clients to rate how helpful their case managers were in answering their questions.
In 2006 only 45.7% rated this service as ‘excellent’, lower than in any other year. However, the 2006 rating for ‘good’ was 35.7%, back to where it was in 2001 before there was three-year downward trend.
Q20. Clients were asked to rate how satisfied they were overall with the services they received from the Adult Services Unit at the Social Assistance Office.
In 2006 there were 61.4% of respondents who rated their overall satisfaction as ‘very satisfied’, similar to the numbers from 2004, 2002 and 2001. 24.5% of respondents reported being ‘somewhat satisfied’, which is the lowest number since 2002. The number that reported being ‘somewhat dissatisfied’ is the lowest of all the years at 5.0%, while the number of those who reported being ‘very dissatisfied’ (5.6%) remained fairly consistent with the numbers for 2001, 2004 and 2005.
The Answers to My Questions were Helpful
4.7%
35.7%
3.6%5.3%
2.6%
6.6%
2.2%
8.2%
50.4%
0.9%
6.5%
9.7%
35.7%
45.7%
1.5%
9.1%
46.9%49.1%
8.5%
34.5%
30.9%
11.3%
49.1%
29.7%
10.2%
Poor Fair Good Excellent Don’t Know
2001
2002
2004
2005
2006
Overall Satisfaction
5.1%8.3%
22.5%
61.6%
2.5%3.5%
60.5%
1.2%
5.0%
1.3%
5.2%3.2%
5.6%
24.5%
2.7%
6.7%
28.1%
59.7%
6.6%
27.5% 28.8%
5.8%
67.6%
61.4%
5.0%
Very dissatified Somewhat dissatisfied Somewhat satisfied Very satisfied Don't Know
2001
2002
2004
2005
2006

CLIENT SATISFACTION SURVEY 2006 14
More Money (46 Comments, 28%)There needs to be more money for clothing.Provide money for emergency situations, i.e.. family emergencies.Increase the allowance. Everything is going up except the money I receive.Better help for going to school and more money.The amount of money to be adjusted to the cost of living.More help for child care.More financial and medical help for single mothers.Improve the furniture allowance so one can buy furniture from any place. One cannot buy a good bed and mat-tress for $5.00, but at a moving out sale one can get many things.Case Workers (16 Comments, 10%)Quit changing the social workers or at least let us know ahead of time.Don’t keep changing our case managers around. It gets tiring telling your story over and over.Reduce case load on case managers.Clear understanding of each individual case. There seems to be doubt between the case worker and the people upstairs which causes stress.One case worker per client. I have had many case workers, which make things confusing.Make it easier for people to switch case workers in Whitehorse.Minimize the number of workers I have. I have had too many different case workers and I had to keep saying my story over again. Within six months I probably had six workers.More employees to look after the clients.Be More Understanding (10 Comments, 6%)Case workers that help you correct mistakes that have been made with your cheque.To be seen as a person not just a number. There is the sense that unless there is an emergency you are just a number.People get clumped together, make it more individual according to their circumstance.To hire people who really care, not $50,000.00 a year heartless, self-centered, arrogant people who think they own you.Everyone should be treated the same and I should not have to feel like I’m begging for help when I actually need the service.Empathy! Because it’s a government office it’s very regulated, matter of fact, to the point of robotic. I actually had regulation quoted to me.Cheque Handling Process (13 Comments, 8%)Direct Deposit for cheques would be great.Automatic monthly disability cheque unless address, etc. changes.The mail delivery of cheques is unreliable and creates stress. Pick up is much better and should be allowed. Let us know if mail delivery is compulsory.They should call me to let me know when there’s a cheque ready for me. I feel like I’m interfering when I call there.Communications (18 Comments, 11%)When another case manager takes over they should know what’s going on.The office staff need to take their time and talk to people.
LONG-ANSWER QUESTIONSQ21. If there were only one thing you could suggest to improve the service you received, what would it be?

CLIENT SATISFACTION SURVEY 2006 15
Clearer communication by the case workers. I found it frustrating to get clear communication with my case worker. It could have been me but sometimes I misunderstood her.Case managers should not be rude.They need to have better communication between front office staff and case workers.The case worker cannot bring her personal life into work.Spend more time with the client.More clear communication between the staff.That first time applicants are better informed about what Social Assistance does and does not cover (like prescrip-tions, dental, etc.). Everyone has been excellent about answering my questions but it would be nice to have some kind of handout to refer to instead of having to go in and ask someone all the time.Working with Clients Who have Disabilities (5 Comments, 3%)To have a disability dept for those who cannot work, yet can keep some of their pride in the community.More one-on-one time with your case worker who can help a disabled person and try and place them into work.There needs to be more help with disability applications and information as where to apply.People with disabilities should have their cheques automatically deposited in the bank, this would make it easier for some.Program or Policy changes (21 Comments, 13%)They need to pay me as a caregiver. I am a caregiver but I happen to also be a relative. I want a level playing field. I feel they don’t treat caregivers or relatives with respect.A faster computer for them.Do not take child support payments off the assistance amount received by the client.Having to go in to the office every month is crazy. My son is Down Syndrome; it’s not going away.Do a check up on social workers more often than once a year.Increase the budget or programs to rehabilitate older clients.When you need extra help there should be money available that you don’t need to pay back.Yukon could take a lead in multi-dimensional approaches to addictions: harm reduction, treatment options, etc.Social Assistance and Yukon Housing need to work together for the people who have both.Better filing system, they lost my files a couple of times.Office Reception Area (4 Comments, 2%)The ladies at the front desk could give more information to you.A better answering service should be setup. Currently if you don’t press 1, 2 or 3 it disconnects. It should pass to reception so you can talk to someone.More people working at the counter.Water and fruit in the waiting room.Change Paperwork (6 Comments, 4%)Those persons with a permanent disability should not need to fill in the monthly forms - automatic bank deposit would be very useful.Cut the forms down in length. The take too long to fill in.The sheet that the landlord had to fill out was a bit confusing so if they could make that easier.Respond Quicker, Speed up Processes (9 Comments, 5%)They need to respond quicker to my needs.Better communication, faster response time.Make it easier to talk with my worker. They’re very busy. I call and get an answering machine.Relations with Staff (9 Comments, 5%)Live up to their mission statement.Use courtesy and respect as the signs say.
CLIENT SATISFACTION SURVEY 2006 16
Don’t treat us like criminals.The social workers need to change their attitude, lighten up, and be nicer.The case manager needs to be more honest.Training Opportunities (5 Comments, 3%)A lot of the people that work [as] social workers need to work with the special needs kids so they know what to suggest or not to suggest.The social workers should attend workshops periodically reminding them that their clients are only there because they need money in order to survive. This seems to be easily forgotten.The management should have a training session on Hep-C and how that affects a person and what the medica-tion does to a person.Child Tax Benefit (3 Comments, 2%)Stop deducting the Child Tax Credit off my cheque. That sure would help.Housing Options (3 Comments, 2%)By not taking so much rent off the cheque when you’re with Yukon Housing.Help clients find a place to live. Better housing.
Thankful, Satisfied, Good Service (50 Comments, 37%)The Whitehorse office is one of the best in Canada.Thank you for caring.They’ve made it much easier for me because there is someone that speaks French there.I appreciate so much that everyone at Social Assistance has treated me with dignity and respect.My case worker was excellent.Not Enough Money (17 Comments, 13%)They give you a winter clothing allowance but what about the rest of the year, I have holes in my underwear.Just to live we had to borrow money from friends. I’m in debt up to my eyeballs.Social assistance hasn’t changed bottom line dollar to clients for over fifteen years. That is criminal! This a viola-tion of intent!It was a pitiful amount of money. We suffered the whole time we were on assistance, near starvation.Improve Service (30 Comments, 22%)It’s a very secretive department, you find things out through others. It’s hard to get information from them. They aren’t there helping you like they pretend they are. It’s always their way. I’m very dissatisfied.Case workers should have to go through the system so they would know what it is like.When I call my worker and leave a message she doesn’t call me back until the end of the day. It’s often too late by then.Some of the people behind the counter need a refresher on information. They think they know, but they don’t. Then they give you wrong information.On $50.00 bills there is a quote (Universal Declaration of Human Rights 1948). “All Human beings are born free and equal in dignity and rights.” If only we were treated like that.Miscellaneous (20 Comments, 15%)Not knowing what caused the change, I would say the Plexiglas barrier is somewhat overdone.If the office could try and co-ordinate flights with check-in times at accommodation places when you are sent out-side for medical or make arrangements for earlier check-in when you arrive at 10:30 AM and can’t check-in until 3:00 PM and you have sick children, it is just too much.
Q22. Additional Comments

CLIENT SATISFACTION SURVEY 2006 17
I was having to go in for every prescription but they finally gave me a card that pays for my prescription, what a difference. Thank you.They’ve turned into a lending company to make up for the cost of living. They’re trying their best but their hands are tied.It is very hard to find somewhere decent to live when you have kids.I’m finding it difficult. They say I have too much in my bank account but that money is for car insurance. Things are more expensive here in [a community] and I’m having to live off of $266.00 a month.Review Policies (9 Comments, 7%)I get a pension cheque once a month and it is almost always the same amount but I have to take it in each month and show them, I don’t like doing that.Legislation needs to change. Payments need to increase or deductions decrease to at least meet Canadian poverty level. How can people on S.A.S. possibly be in debt to S.A.S. if they have no assets? Living? Below Canadian poverty level.I don’t earn enough money as it is, so I shouldn’t have to write an I.O.U. for extra money and then pay it back.Addiction recovery options must be greatly increased. We have a serious epidemic.“Do away with the two tier schedule A & B. It actually inhibits persons finding work. Allow persons, “”working poor””, to keep more of their income, not just a $100.00 a month. Work for Policy change and for education of the public in general. Create public and political will towards helping, really helping these less fortunate.”Support for Job Placement/Training (4 Comments, 3%)I wish they would help me get an education and a computer so I could get a job.There should be more training opportunities for the younger generation who could work but are on assistance.They’re misleading in regards to getting support to go to school. I had to get a letter from an employer promising work before they would pay for my schooling. It’s degrading!Cheque System (2 Comments, 1%)We would rather pickup our cheques.“There are a couple of snap dragons up front who really aren’t good. Cheques will not be released until 2:00 no matter what your circumstances are. Sometimes you are sick or need to co-ordinate a ride to pick up your cheque. It is a real headache to not”

CLIENT SATISFACTION SURVEY 2006 18
WHITEHORSE / COMMUNITIES COMPARISONRECEPTION/FRONT OFFICE STAFFWhen viewing the following charts it is important to know that there were 307 respondents from Whitehorse, whereas there were only 32 respondents from the communities.
Clients of the Adult Services Unit were asked to rate the services of the reception/front office staff based on their experiences on a scale of ‘poor’ to ‘excellent’.
Answered My Questions
0.7%
8.8%
35.8%
53.1%
1.3%
9.4%
15.6%
43.8%
25.0%
6.3%
Poor Fair Good Excellent Don't Know
Whitehorse
Communities
Knew What They Were Doing
1.6%
6.2%
43.0%
46.9%
1.3%3.1%
12.5%
34.4%
40.6%
9.4%
Poor Fair Good Excellent Don't Know
Whitehorse
Communities

CLIENT SATISFACTION SURVEY 2006 19
Were Polite/Respectful
1.6%3.3%
29.0%
63.8%
1.3%3.1%
6.3%
34.4%
46.9%
9.4%
Poor Fair Good Excellent Don't Know
Whitehorse
Communities
Were Quick to Respond
2.9%
8.5%
34.5%
51.1%
1.6%
12.5%
9.4%
28.1%
43.8%
6.3%
Poor Fair Good Excellent Don't Know
Whitehorse
Communities

CLIENT SATISFACTION SURVEY 2006 20
Were Personal and Caring About My Situation
2.9%
8.1%
32.6%
51.5%
3.3%
6.3%
12.5%
34.4%
40.6%
6.3%
Poor Fair Good Excellent Don't Know
Whitehorse
Communities
Were Patient
2.0%
5.5%
36.2%
52.8%
2.3%
6.3% 6.3%
34.4%
43.8%
9.4%
Poor Fair Good Excellent Don't Know
Whitehorse
Communities

CLIENT SATISFACTION SURVEY 2006 21
The Answers to My Questions were Clear
2.0%
9.4%
42.0%43.6%
2.3%
6.3%
12.5%
31.3%
43.8%
6.3%
Poor Fair Good Excellent Don't Know
Whitehorse
Communities
The Answers to My Questions were Timely
2.0%
6.2%
42.3%
45.0%
2.6%
9.4%
6.3%
37.5% 37.5%
9.4%
Poor Fair Good Excellent Don't Know
Whitehorse
Communities

CLIENT SATISFACTION SURVEY 2006 22
The Answers to My Questions were Helpful
2.3%
7.5%
42.0%
44.6%
1.6%
15.6%
12.5%
31.3%
34.4%
6.3%
Poor Fair Good Excellent Don't Know
Whitehorse
Communities

CLIENT SATISFACTION SURVEY 2006 23
Answered My Questions
3.9%
11.7%
30.6%
52.4%
1.0%
15.6%
18.8%
25.0%
37.5%
3.1%
Poor Fair Good Excellent Don't Know
Whitehorse
Communities
CASE MANAGERWhen viewing the following charts it is important to know that there were 307 respondents from Whitehorse, whereas there were only 32 respondents from the communities.
Clients of the Adult Services Unit were asked to rate the services of the case managers based on their experiences on a scale of ‘poor’ to ‘excellent’.
Knew What They Were Doing
3.6%
10.7%
33.9%
49.5%
1.3%
9.4%
21.9%
34.4% 34.4%
0.0%
Poor Fair Good Excellent Don't Know
Whitehorse
Communities
CLIENT SATISFACTION SURVEY 2006 24
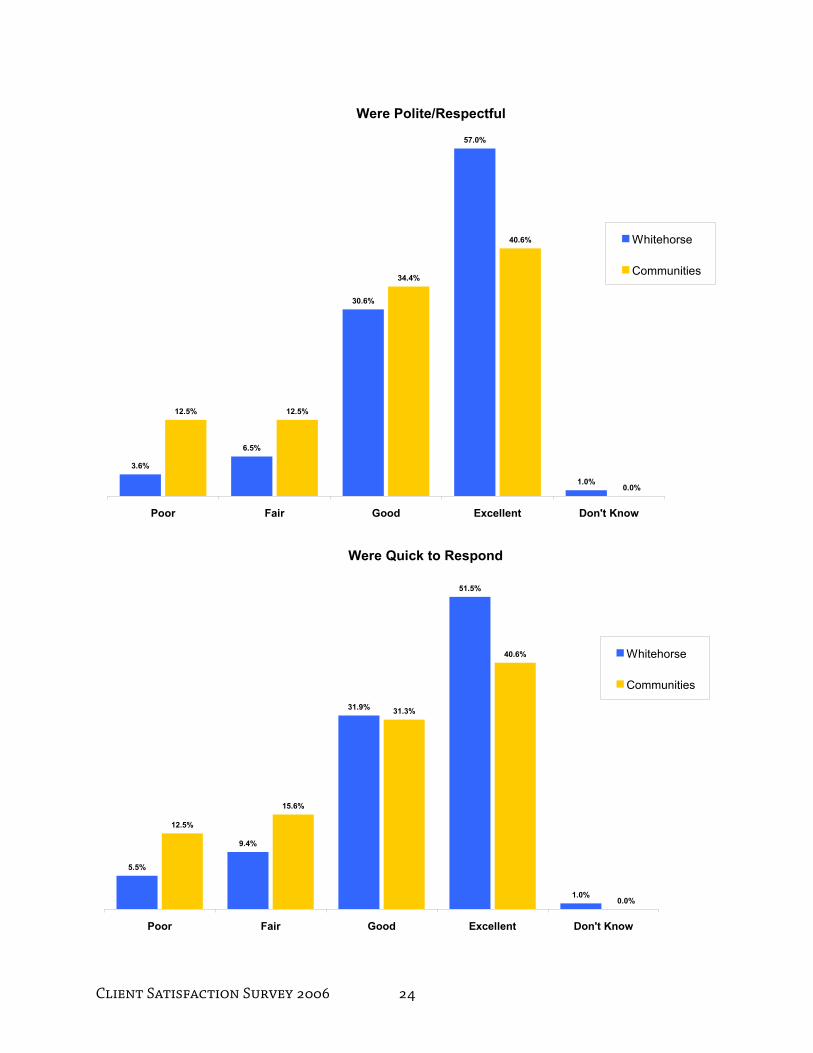
Were Polite/Respectful
3.6%
6.5%
30.6%
57.0%
1.0%
12.5% 12.5%
34.4%
40.6%
0.0%
Poor Fair Good Excellent Don't Know
Whitehorse
Communities
Were Quick to Respond
5.5%
9.4%
31.9%
51.5%
1.0%
12.5%
15.6%
31.3%
40.6%
0.0%
Poor Fair Good Excellent Don't Know
Whitehorse
Communities
CLIENT SATISFACTION SURVEY 2006 25
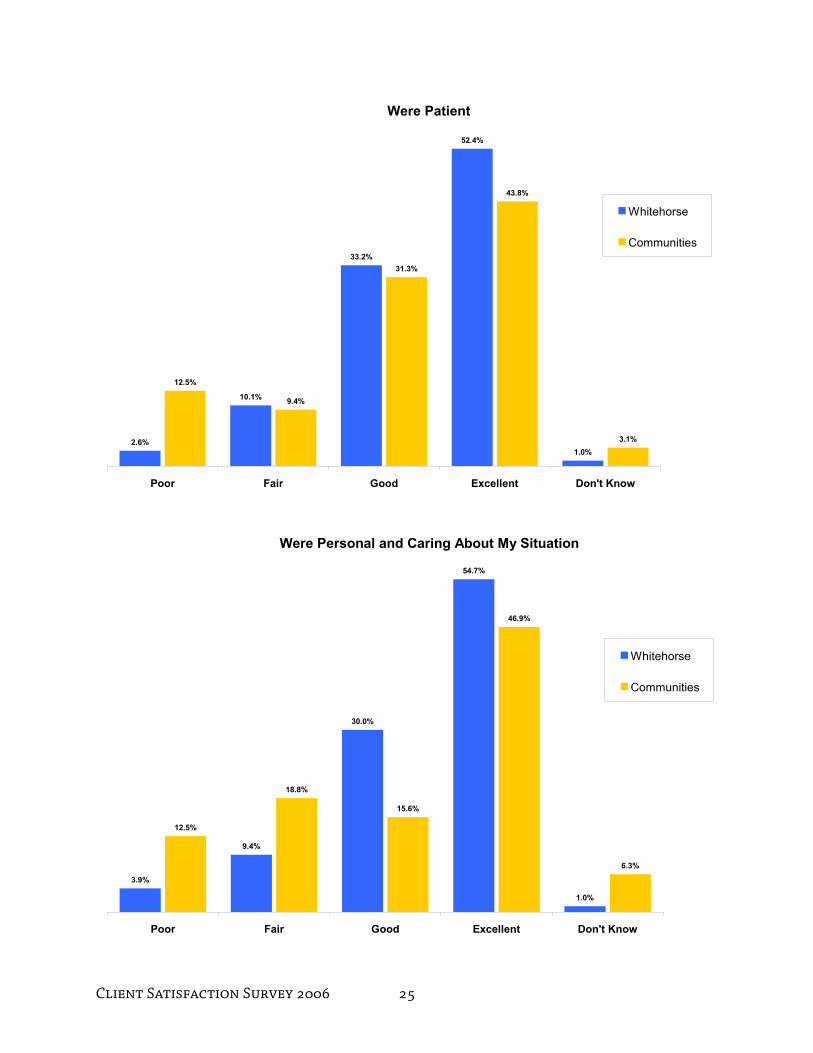
Were Patient
2.6%
10.1%
33.2%
52.4%
1.0%
12.5%
9.4%
31.3%
43.8%
3.1%
Poor Fair Good Excellent Don't Know
Whitehorse
Communities
Were Personal and Caring About My Situation
3.9%
9.4%
30.0%
54.7%
1.0%
12.5%
18.8%
15.6%
46.9%
6.3%
Poor Fair Good Excellent Don't Know
Whitehorse
Communities

CLIENT SATISFACTION SURVEY 2006 26
The Answers to My Questions were Clear
3.9%
9.8%
35.5%
48.5%
1.3%
12.5%
18.8%
28.1%
34.4%
6.3%
Poor Fair Good Excellent Don't Know
Whitehorse
Communities
The Answers to My Questions were Timely
5.2%
10.1%
35.2%
46.6%
1.3%
12.5% 12.5%
28.1%
40.6%
6.3%
Poor Fair Good Excellent Don't Know
Whitehorse
Communities
CLIENT SATISFACTION SURVEY 2006 27
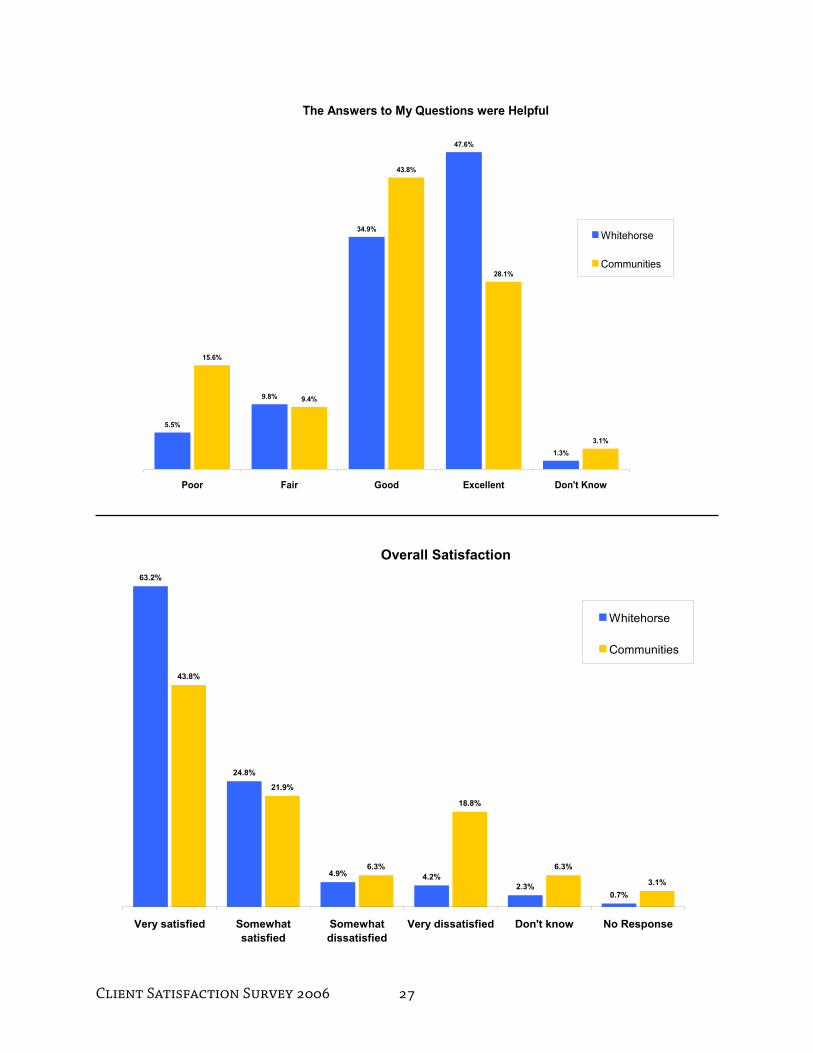
The Answers to My Questions were Helpful
5.5%
9.8%
34.9%
47.6%
1.3%
15.6%
9.4%
43.8%
28.1%
3.1%
Poor Fair Good Excellent Don't Know
Whitehorse
Communities
Overall Satisfaction63.2%
24.8%
4.9% 4.2%2.3%
0.7%
43.8%
21.9%
6.3%
18.8%
6.3%
3.1%
Very satisfied Somewhatsatisfied
Somewhatdissatisfied
Very dissatisfied Don't know No Response
Whitehorse
Communities

CLIENT SATISFACTION SURVEY 2006 28
APPENDIX: CLIENT SATISFACTION SURVEY FORM
Po
or
Fair
G
ood
Exce
llent
D
on’t
Kno
w
1. A
nsw
ered
my
ques
tions
�
��
��
2. K
new
wha
t the
y w
ere
doin
g �
��
��
3. W
ere
polit
e/re
spec
tful
��
��
�4.
Wer
e qu
ick
to re
spon
d �
��
��
5. W
ere
patie
nt
��
��
�6.
Wer
e pe
rson
al a
nd c
arin
g
abo
ut m
y si
tuat
ion
��
��
��
Poor
Fa
ir
Goo
d Ex
celle
nt
Don
’t K
now
7.
Cle
ar
��
��
�8.
Tim
ely
��
��
�9.
Hel
pful
�
��
��
Po
or
Fair
G
ood
Exce
llent
D
on’t
Kno
w
10. A
nsw
ered
my
ques
tions
�
��
��
11. K
new
wha
t the
y w
ere
doin
g �
��
��
12. W
ere
polit
e/re
spec
tful
��
��
�13
. Wer
e qu
ick
to re
spon
d �
��
��
14. W
ere
patie
nt
��
��
�15
. Wer
e pe
rson
al a
nd c
arin
g
ab
out m
y si
tuat
ion
��
��
��
Po
or
Fair
G
ood
Exce
llent
D
on’t
Kno
w
16. C
lear
�
��
��
17. T
imel
y �
��
��
18. H
elpf
ul
��
��
�
THE
SUR
VEY
QU
ESTI
ON
S
Plea
se ra
te e
ach
of th
e ite
ms b
elow
bas
ed o
n yo
ur e
xper
ienc
e w
ith th
e:1)
rec
eptio
n/fr
ont o
ffice
staf
f and
2) y
our c
ase
man
ager
at th
e Adu
lt Se
rvic
es U
nit (
in th
e So
cial
Ass
ista
nce
Offi
ce).
Mar
k yo
ur c
hoic
e by
che
ckin
g ( �
) th
e be
st a
nsw
er.
INTR
OD
UC
TIO
N
You
can
help
us b
y co
mpl
etin
g th
issu
rvey
!
Ever
y ye
ar w
e as
k ou
r clie
nts w
hat
they
thin
k ab
out h
ow w
e ar
e do
ing
inpr
ovid
ing
serv
ices
to th
em.
This
surv
ey is
an
oppo
rtuni
ty fo
r you
to te
ll us
wha
t you
thin
k of
the
soci
alas
sist
ance
pro
gram
and
staf
f.
We
have
ask
ed th
e Yu
kon
Bur
eau
ofSt
atis
tics t
o ru
n th
is su
rvey
for u
s.Th
e B
urea
u w
ill e
nsur
e th
at y
our
com
men
ts a
re k
ept c
onfid
entia
l, an
dth
at th
e re
port
prod
uced
on
the
surv
eyre
sults
will
not
iden
tify
any
resp
onde
nt -
so p
leas
e be
fran
k an
dho
nest
in y
our a
nsw
ers t
o ou
rqu
estio
ns.
Plea
se ta
ke a
mom
ent t
o fil
l out
the
surv
ey a
nd re
turn
it to
us i
n th
een
clos
ed se
lf-ad
dres
sed,
stam
ped
enve
lope
. Yo
u m
ay a
lso
leav
e yo
urco
mpl
eted
form
at t
he S
ocia
lA
ssis
tanc
e O
ffice
at:
3168
Thi
rd A
venu
eW
hite
hors
e
If y
ou c
ould
mai
l it b
ack
to u
s or d
rop
it of
f by
Aug
ust 2
5 th
at w
ould
be
appr
ecia
ted.
�Th
e R
ecep
tion/
Fron
t Offi
ce S
taff
I Dea
lth W
ith:
The
Ans
wer
s To
My
Que
stio
ns w
ere:
My
Cas
e M
anag
er:
The
Ans
wer
s To
My
Que
stio
ns w
ere:

CLIENT SATISFACTION SURVEY 2006 29
21.I
f the
re w
as o
nly
one
thin
g yo
uco
uld
sugg
est t
o im
prov
e th
ese
rvic
e yo
u re
ceiv
ed, w
hat
wou
ld it
be?
____
____
____
____
____
____
____
____
___
____
____
____
____
____
____
____
____
____
____
____
____
____
____
____
____
____
____
____
____
____
____
____
____
____
____
____
____
____
____
____
____
____
____
____
____
____
____
22.P
leas
e pr
ovid
e an
y ad
ditio
nal
com
men
ts y
ou m
ay h
ave
in th
esp
ace
belo
w:
____
____
____
____
____
____
____
____
____
____
____
____
____
____
____
____
____
____
____
____
____
____
____
____
___
____
____
____
____
____
____
____
____
____
____
____
____
____
____
____
____
____
__
Man
y th
anks
for t
he ti
me
you
have
take
n to
com
plet
e th
e su
rvey
!Yo
u ca
n pi
ck u
p a
copy
of t
he re
port
atth
e Yu
kon
Bur
eau
of S
tatis
tics,
4th
Floo
r, Ly
nn B
uild
ing,
308
Ste
ele
Stre
et.
If y
ou w
ish
you
may
pro
vide
you
r nam
ein
the
box
belo
w.
If y
ou n
eed
to p
rovi
de m
ore
info
rmat
ion
or to
spea
k to
som
eone
dire
ctly
, ple
ase
call
667-
5691
and
ask
for T
im B
rady
.
A su
rvey
of i
ndiv
idua
lson
soci
al a
ssis
tanc
e an
dw
hat t
hey
thin
k of
the
peop
le a
nd se
rvic
es o
fth
e Yu
kon’
s Adu
ltSe
rvic
es U
nit a
t the
Soci
al A
ssis
tanc
e O
ffice
19.P
leas
e he
lp u
s to
unde
rsta
nd h
owyo
u ra
ted
each
of y
our a
nsw
ers f
orqu
estio
ns 1
thro
ugh
18.
If “
Poor
”is
the
low
est r
atin
g an
d “E
xcel
lent
”is
the
high
est,
whe
re o
n th
e sc
ale
wou
ld y
ou p
ut F
air a
nd G
ood.
Plea
se d
raw
a li
ne to
show
whe
reyo
u w
ould
pla
ce th
em o
n th
e sc
ale.
20.O
vera
ll, h
ow sa
tisfie
d w
ere
you
with
the
serv
ices
you
rece
ived
from
the A
dult
Serv
ices
Uni
t at t
heSo
cial
Ass
ista
nce
Offi
ce?
Mar
kyo
ur c
hoic
e by
che
ckin
g(�
) th
e be
st a
nsw
er.
�Ve
ry sa
tisfie
d�
Som
ewha
t sat
isfie
d�
Som
ewha
t dis
satis
fied
�Ve
ry d
issa
tisfie
d�
Don
’t kn
ow
�
Wha
tdo yo
uth
ink?
Exc
elle
nt
Poor
Exe
cutiv
e C
ounc
il O
ffice
Bur
eau
of S
tatis
tics
Goo
d
Fair