clfmi windloadguide revised 2014
TRANSCRIPT

8/15/2019 CLFMI WindLoadGuide Revised 2014
http://slidepdf.com/reader/full/clfmi-windloadguide-revised-2014 1/38
CHAIN LINK FENCEWIND LOAD GUIDE FOR THE
SELECTION OF LINE POST AND
LINE POST SPACING(WLG 2445)
Revised June, 2014
Copyright (C) 2014 Chain Link Fence Manufacturers Institute All Rights Reserved.
10015 Old Columbia Road Suite B215Columbia, MD 21046
Ph: 301-596-2583 Fax: 301-596-2594Email: [email protected]

8/15/2019 CLFMI WindLoadGuide Revised 2014
http://slidepdf.com/reader/full/clfmi-windloadguide-revised-2014 2/38
Published by:
Chain Link Fence Manufacturers Institute (CLFMI)
10015 Old Columbia Road • Suite B-215 • Columbia, MD 21046
Phone: (301) 596-2583 • Fax: (301) 596-2594
E-mail: [email protected]
Website: www.chainlinkinfo.org
CLFMI Technical Support Team
To get answers to your questions regarding the content or usage of the information containedin this publication, contact one of these fence industry professionals for assistance.
BILL ULLRICH email: [email protected] Phone: 410-849-2610
CHUCK NAEGELE email: [email protected] Phone: 570-586-7260
STEVE PETERS email: [email protected] Phone: 914-576-5100TED EYSENBACH email: [email protected] Phone: 1-800-451-2612
DON FINN email: [email protected] Phone: 310-537-6300
TOM STANEK email: [email protected] Phone: 1-800-257-8182
BILL PETERSON email: [email protected] Phone: 330-773-0423

8/15/2019 CLFMI WindLoadGuide Revised 2014
http://slidepdf.com/reader/full/clfmi-windloadguide-revised-2014 3/38

8/15/2019 CLFMI WindLoadGuide Revised 2014
http://slidepdf.com/reader/full/clfmi-windloadguide-revised-2014 4/38
TABLEOF CONTENTS
Introduction ......................................................................... 1
Factors Which Influence the Size and Spacing of Line Posts 2
Figure 1, Line Post Spacing Details .................................. 3
Methodology ........................................................................ 4 to 5
How to Use the Guide.......................................................... 6
Examples .............................................................................. 7 to 9
Tables ................................................................................... 10 to 22
Table 1; Line Post Selection Guide for 105 MPH Wind
Table 2; Line Post Selection Guide for 110 MPH Wind
Table 3; Line Post Selection Guide for 120 MPH Wind
Table 4; Line Post Selection Guide for 130 MPH Wind
Table 5; Line Post Selection Guide for 140 MPH Wind
Table 6; Line Post Selection Guide for 150 MPH Wind
Table 7; Line Post Selection Guide for 160 MPH Wind
Table 8; Line Post Selection Guide for 170 MPH Wind
Table 9; Mesh and Fabric Size Coefficients "Cf 1"
Table 10; Wind Exposure Category Coefficients "Cf 2"
Table 11; Ice Exposure Effect Probability Coefficients "Cf 3"
Table 12; Line Post Material Properties Table
Table 13; Wind Speed I Velocity Pressure Table
Figure 26.5-1C, Minimum Basic Wind Speeds Map......... 23 to 24
Appendix .............................................................................. 25 to 32
References ........................................................................... 33

8/15/2019 CLFMI WindLoadGuide Revised 2014
http://slidepdf.com/reader/full/clfmi-windloadguide-revised-2014 5/38

8/15/2019 CLFMI WindLoadGuide Revised 2014
http://slidepdf.com/reader/full/clfmi-windloadguide-revised-2014 6/38
FACTORS WHICH INFLUENCE THE SIZE AND SPACING OF LINE POSTS*• HEIGHT OF FENCE The height of the fence influences the actual amount of wind force that must beresisted by the post and the required anchorage to the ground. The fence height times the line post spacing setsthe total force acting on a solid panel of the fence which is transferred to the line posts and then into the footing.
• STYLE AND SIZE OF FABRIC The style and size of fabric determines the net surface area of the solidfence panel exposed to the wind pressure which in turn must possess adequate tensile strength to transfer thedeveloped loading to the supporting members of the fence assembly; i.e., line posts, top rail and base tensionwire.
• MATERIAL STRENGTH AND SHAPE OF POST Material strength and shape of post determines the sizeof posts and their spacing which will provide the required resistance to the maximum expected wind forces thatmay develop over the anticipated normal life-span of the installation and to remain serviceable subsequent to themaximum wind event.
• UPDATED FOOTING ANALYSIS AS RELATED TO SOIL TYPE AND BEARING LOADS The type ofsoil that will be encountered at the site of the fence installation will influence the post size and spacing by way ofthe passive soil pressures that can reasonably be expected to resist the tendency for the line posts to overturnand also to remain in an essentially plumb position after the wind event. For footing design criteria, it is advisableto contact a competent geotechnical professional for the appropriate soils information at the particular site. Theminimum depth of footings in accordance with ASTM F567 is 24" plus an additional 3" for each one (1) foot offence height over 4 feet. The 2009 International Building Code, (Eq. 18-1) is utilized to determine the required
footing embedment depth, up to a maximum embedment depth of 12'-0" below finish grade
VARIABLES AND DEFINITIONS for the FORMULA FOR DETERMING FOOTING DEPTH P = Resultant concentrated wind force applied to post d = Diameter of post footingc = Distance above top of footing at which “P” is applied to post S1 = Allowable lateral soil-bearing pressure
D = Post footing embedment depth below finish grade H = Fence post height above top of footing
D = 0.5A * { 1 + [ (4.36 * H ) / A ) ]1/2
} A = 2.34P/S1*d
SEE THE CALCULATION EXAMPLE 3 ON PAGE (8) FOR AN ILLUSTRATION OF THIS ANALYSIS
The table listed below (which is also found on page 32 of this Guide) shows the Presumptive Soil Load BearingValues for calculations to determine footing sizes using this updated approach, which includes lateral as well asvertical factors.
• WIND PRESSURE Wind pressure is the most dominant factor that influences the post size and spacingsince it is the only force that can reasonably be predicted and will be acting on the posts under normal conditions.Reference Table 13 for values of various wind speeds and pressures. Wind pressure in itself is further influencedby other factors; i.e., geographical region, exposure, topography and ground surface features in the local area.
*Reference Figure I, "LINE POST (2)

8/15/2019 CLFMI WindLoadGuide Revised 2014
http://slidepdf.com/reader/full/clfmi-windloadguide-revised-2014 7/38
(2)
METHODOLOGY
ASCE 7−10 (FIGUR E 26.5−1C)
CIRCULAR CONCRETE FOOTINGS. EMBEDMEDEPTH DEPENDENT ON TYPE OF SOIL THATEXISTS ON SITE. THE O.D. (“D”) OF THE FOOTIS EXPRESSED AS 4 (pd) OR 3 (pd) (WHERE “pPOST OD) DEPENDING ON THE SIZE OF THE
POST DIAMETER.Ref. ASTM F567 and 2009 IBC (Eq. 18-1)
LINE POST – SEE TABLE 12 FOR
SCHEDULE OF TYPES, SIZES, ANDMATERIALS OF POST.

8/15/2019 CLFMI WindLoadGuide Revised 2014
http://slidepdf.com/reader/full/clfmi-windloadguide-revised-2014 8/38
METHODOLOGY
The methodology applied to develop the tabular values of "S", the unmodified maximum spacingsof line post materials, sizes and shapes most commonly employed in the chain link fencingindustry, for the fence heights and wind speeds was based on wind loading criteria outlined in
ASCE 7-10, Chapter 26, Wind Loads: General Requirements and Chapter 29, Wind Loadson Other Structures and Bui lding Appurtenances—MWFRS, excerpts of which areincluded in the Appendix of this Guide.
This application of the recommended loading criteria as it applies to fence construction takes intoconsideration all factors that influence the wind forces applied to the primary force resistingelement of the fence; in this instance the line posts, which in-turn must transfer that loading to theground. This guide is based on the assumption of a solid panel of fencing and uses multiplicationfactors for various percentages of free area of the fence panel.
To establish the magnitude of the wind force that will be acting on the line post, it must first beestablished what the net surface area of the fence panel will be; i.e., the solid panel area, "h x S"less the void spaces within the fence. The net surface area of the wire fabric is what the windforce impinges on and is directed on to the post. Since the panel of the fence is essentially a
perforated plane, it is necessary to quantify the actual solid surface to void area. The area of wiresurface was determined by establishing the number of diamonds in a square foot of fabric andtotaling the length of wire in that area. This is the value used in combination with the computed windvelocity pressures that when applied as a load to the fence post acting as a flagpole design; i.e., avertical cantilever, fixed at its base to the footing and ground.
Now with the value known for the wind velocity pressure that develops for each of the selectedranges of the eight Wind Speed Classes of 105 MPH through 170 MPH acting under normalconditions for a Wind Exposure Category "B", these forces are then applied to the face area of thefence panel assumed to be solid. With the height "H" of the fence known, the only variable thatneeds to be established to set the total gross area " Ag" of the panel is the line post spacing "S".
The values of "S" were generated based on the loading applied to the post as a vertical cantilever,in a similar fashion as the "classic" flagpole design.
Table 1 through Table 8 are set up for fence heights that range from 3 feet up to and including 20feet and twenty-six combinations of line post sizes and types, in a solid panel configuration. The"S" values were computed on the basis of their physical, material properties and formulas listedin Table 12 with a limiting value based on the maximum allowable stress.
To account for the variations in the fabric wire sizes and sizes of mesh, Table 9 was developedand lists the Coefficient "Cf 1" which accounts for the variation and is based on a ratio of net areato gross area of a solid panel for each of the commonly used styles employed in the industry.
(4)

8/15/2019 CLFMI WindLoadGuide Revised 2014
http://slidepdf.com/reader/full/clfmi-windloadguide-revised-2014 9/38
The base program for the line post spacing was set up using the condition where Wind ExposureCategory "B" is the normal situation. To account for the other two Wind Exposure Categories, "C"and "D", Table 10 was developed to list the Coefficient "Cf 2" which is a ratio of the Wind ExposureCoefficient "Kz" for Exposure "B" to the other two exposure coefficients as listed in ASCE 7-10,Table 29.3-1.
In Table 11, Ice Effect Probability Coefficient "Cf 3" is included in the guide and was set up usingarbitrary values to permit the designer the ability to make an intelligent decision relative to his
perception and experience as to the probability that a severe icing condition may developconcurrent with the listed maximum wind speed for that particular geographical location for non-solid fencing.
Figure 26.5-1C from ASCE 7-10 shows wind speed categories in the range of 105 MPH to 170MPH, but also includes special wind speed regions and a 180 MPH wind speed for use in Guam.This guide provides values of wind speeds that cover the entire range of velocities that may beencountered in the continental United States and Hawaii but does not include Guam and willrequire separate analysis to determine wind speeds in the special wind speed regions asdetermined by local jurisdictions and/or case study. For any installations determined to haveintermediate wind speeds, it is acceptable to interpolate linearly.
The user of this guide is advised that he may want to consider use of the full allowable stress ofthe material being employed which has a built-in Factor of Safety equivalent to 1.5; ie., 0.66 Fy,Reference Table 12. The user may also want to consider the merits of using a higher maximumallowable stress increase due to the fact that wind loadings usually may not be a sustainedcondition for that specific location where the fence installation is being planned.
(5)

8/15/2019 CLFMI WindLoadGuide Revised 2014
http://slidepdf.com/reader/full/clfmi-windloadguide-revised-2014 10/38
HOW TO USE THE GUIDE
For the fence fabric configuration and size of line post being considered, go to the appropriate table (Table
1,2,3, .... ,8) that closely agrees with the maximum anticipated wind speed designated by the local codes forthat geographical area where the fence installation is planned. From that table, find the value of “S” for theline post size and height desired. This value of “S” must then be multiplied by correction coefficients thataccount for the type, size and mesh of the wire fabric, “Cf1” from Table 9; Wind exposure categorycoefficient, “Cf2” from Table 10; Icing effects probability coefficient, “Cf3” from Table 11.
The recommended post spacing S’ = S X Cf1 x Cf2 x Cf3
EXAMPLE I:
Select a line post spacing for a 10’ high Chain Link fence, constructed of #9 gage wire, having a mesh size
pattern of 1-3/4”. The installation location is for a park in an urban location in the Eastern U. S., where thewind exposure is considered “ Exposure C “. Assume the local governing code indicates that the maximumwind speed for this application is 105 MPH; localized icing effects are considered to be moderate. Onepossible line post material selection for this example is Group 1A, Schedule 40 steel pipe.
From Table 1, Wind Speed 105 MPH, for a 4.0” outside diameter pipe, the listed“S” value for a 10’ high fence is 3.6.
From Table 9, the Coefficient “Cf1”, for a #9 gage, 1-3/4” mesh fabric = 6.4
From Table 10, the Coefficient “Cf2”, for a Wind Exposure Category C = 0.67
From Table 11, the Coefficient “Cf3”, for Moderate Icing Effects = 0.85
Thus the recommended maximum spacing for the 4” outside diameter Schedule 40, steel pipe post forthe 10’ high fence with a #9 gage wire and 1-3/4” mesh would be:
S’ = S X Cf1 x Cf2 x Cf3 = 3.6 x 6.4 x 0.67 x 0.85 = 13.12’
The maximum recommended spacing would be 10’-0” c/c for the posts.
(6)

8/15/2019 CLFMI WindLoadGuide Revised 2014
http://slidepdf.com/reader/full/clfmi-windloadguide-revised-2014 11/38
EXAMPLE 2
For a situation where the Wind Velocity is other than for one of the eight listed tables of line postspacings in the guide:
Select a line post size and spacing for a 16' high chain link fence installation for which the fabric is to be a #9gage - 1/2" mesh pattern. Assume the fence location is in an open terrain where the Wind ExposureCategory is "C" and the code listed maximum wind speed is 115 MPH; icing effects potential is
considered to be moderate.
From Table 9, the coefficient "Cf 1" for mesh size and gage = 2.20
From Table 10, the coefficient "Cf 2" for wind exposure "C" = 0.69
From Table 11, the coefficient "Cf 3" for moderate icing effect = 0.85
From Table 2, for a 110 MPH wind and a 16' high fence, select a Trialline post size spacing factor "S" = 4.8 for a Group lA, 6-5/8" OD steel pipe.
For this arrangement the maximum spacing would be the result of 4.8 x 2.20 x
0.69 x 0.85 = 6.19' ; This may not be an economical or practical spacing.
Therefore try the spacing for a Group IA, 8-5/8" OD steel pipe where "S" = 9.70 whose maximum recommended spacing would be 9.70/4.8 x 6.19' = 12.51'.
Since the wind speed being evaluated is 115 MPH condition the recommended spacingwould be 110/115 x 12.51' = 11.97' or 10'- 0" on centers, which would be moreconsistent with the usual standard spacing followed in the industry.
(7)

8/15/2019 CLFMI WindLoadGuide Revised 2014
http://slidepdf.com/reader/full/clfmi-windloadguide-revised-2014 12/38
EXAMPLE3:
For a site location with a high wind condi tion and the design selection of anappropriate footing size and depth:
Select a line post size, its spacing and footing for a 12' high chain link fence that will consist of a #9gage-1-3/4" mesh fabric. Installation will be in Southern Florida in an open terrain with a wind
exposure category "C" and a maximum wind velocity of 150 MPH. Soil condition is assumed to be asilty sand (Actual soil properties should be established by a qualified geotechnical engineer familiarwith local soil conditions).
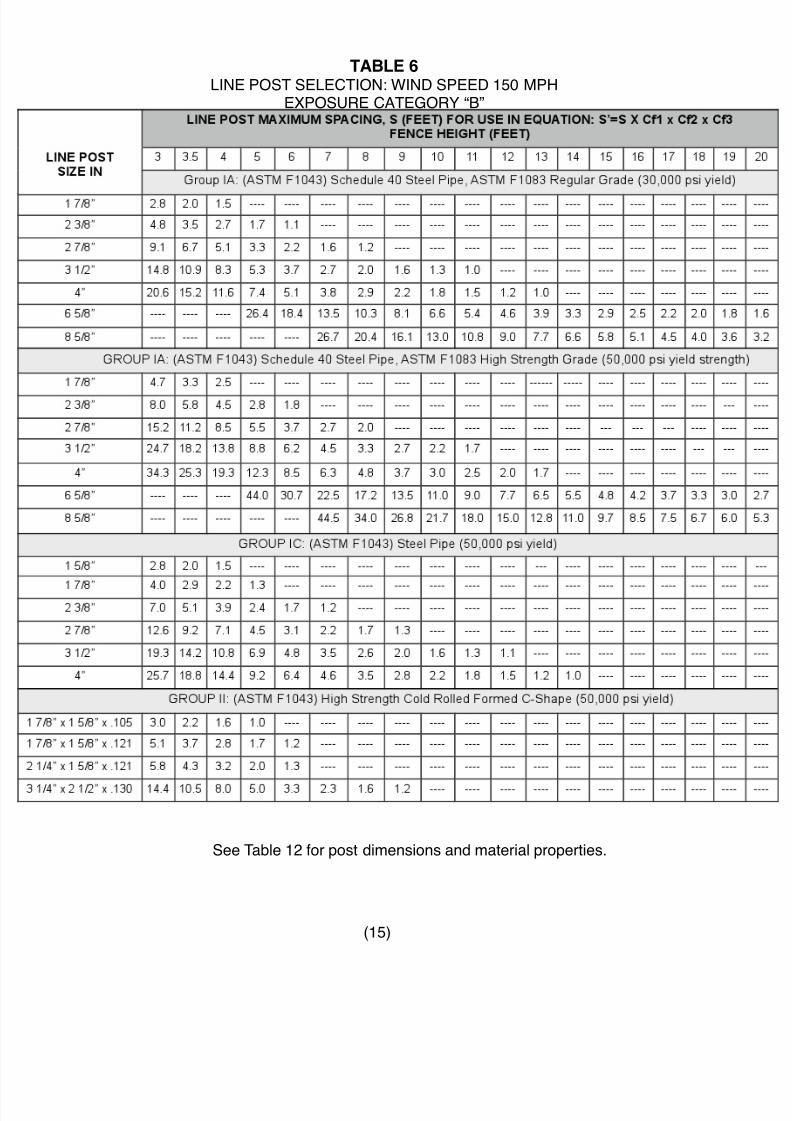
From Table 6 for 150 MPH wind and under 12' high fence and a trial sizeline post of Group lA, 4" outside diameter steel pipe "S" = 1.2
"Cf 1" for the fabric size and gage = 6.4"Cf 2" for the wind exposure category= 0.67"Cf 3" for icing condition = 1.0
Thus the maximum spacing for the Group lA, 4" outside diameter pipe = 1.2 x 6.4 x0.67 x 1.0 = 5.14'. This may not be an economical spacing; try anothertrial size post.
Checking the spacing for a Group lA, 6-5/8" outside diameter pipe where"S" = 4.6, maximum spacing will be 4.6/1.2 x 5.14' = 19.7’ use 10'-0".
For the 6-5/8” outside diameter line post, the minimum footing size is 3 x Pipeoutside diameter per ASTM F567 or 19.9"; however, it is recommended thatfooting size of 30" diameter be used. The minimum depth of footingembedment in the silty sand soil is to be calculated as follows:
LINEPOST FOOTING PRESSURE
Allowable lateral soil bearing pressure (S1) for silty sand = 150 psf *,
as determined from the 2009 International Building Code Table 1806.2Presumptive Soil Load-Bearing Values. See Appendix, pg. 32.
(8)

8/15/2019 CLFMI WindLoadGuide Revised 2014
http://slidepdf.com/reader/full/clfmi-windloadguide-revised-2014 13/38
EXAMPLE3 (Continued):
Distance of applied force above footing "c" = 0.5H + 0.05H =0.55 x 12’ = 6.60’
Applied Force "P" = (1/Cf1) x Net Area of Fence x Wind Pressure where Cf1 is theMesh and Fabric Size Coefficient from Table 9 and the Wind Pressure is the DesignWind Pressure from Table 13.
P = (0.16 sf/sf) (120 sf) (30.84 Ib/sf) = 592 lbs
Diameter of footing d = 30" = 2.50'
Solving for "D" D = 0.5A * { 1 + [ (4.36 * H ) / A ) ]1/2 } (2009 IBC Eq. 18-1) .
where A = 2.34P/S1*d = 2.34 * ( 592 lbs ) / 150 psf * 2.5= 3.69
D = ( 0.5 )( 3.69 ) * { 1 + [4.36 * ( 12 / 3.69 )]1/2 }
= 8.79’
This required depth is less than the maximum embedment depth of 12.0' specified in the 2009 International Building Code and also exceeds theminimum footing depth as set by ASTM F567 whis 24" + [ 3" X ( 12'- 4.0' ) ]= 24" + 24" = 48" . Therefore, the calculated depth is the preferred ch
Use a footing depth of 9.0’
* Assumed allowable soil bearing pressure; actual value should be determined by appropriate means.
(9)

8/15/2019 CLFMI WindLoadGuide Revised 2014
http://slidepdf.com/reader/full/clfmi-windloadguide-revised-2014 14/38

8/15/2019 CLFMI WindLoadGuide Revised 2014
http://slidepdf.com/reader/full/clfmi-windloadguide-revised-2014 15/38
TABLE 2 LINE POST SELECTION: WIND SPEED 110 MPH
EXPOSURE CATEGORY “B”
See Table 12 for post dimensions and material properties.
(11)

8/15/2019 CLFMI WindLoadGuide Revised 2014
http://slidepdf.com/reader/full/clfmi-windloadguide-revised-2014 16/38
TABLE 3 LINE POST SELECTION: WIND SPEED 120 MPH
EXPOSURE CATEGORY “B”
See Table 12 for post dimensions and material properties.
(12)

8/15/2019 CLFMI WindLoadGuide Revised 2014
http://slidepdf.com/reader/full/clfmi-windloadguide-revised-2014 17/38
TABLE 4 LINE POST SELECTION: WIND SPEED 130 MPH
EXPOSURE CATEGORY “B”
See Table 12 for post dimensions and material properties.
(13)

8/15/2019 CLFMI WindLoadGuide Revised 2014
http://slidepdf.com/reader/full/clfmi-windloadguide-revised-2014 18/38
TABLE 5 LINE POST SELECTION: WIND SPEED 140 MPH
EXPOSURE CATEGORY “B”
See Table 12 for post dimensions and material properties.
(14)
8/15/2019 CLFMI WindLoadGuide Revised 2014
http://slidepdf.com/reader/full/clfmi-windloadguide-revised-2014 19/38
TABLE 6 LINE POST SELECTION: WIND SPEED 150 MPH
EXPOSURE CATEGORY “B”
See Table 12 for post dimensions and material properties.
(15)

8/15/2019 CLFMI WindLoadGuide Revised 2014
http://slidepdf.com/reader/full/clfmi-windloadguide-revised-2014 20/38
TABLE 7 LINE POST SELECTION: WIND SPEED 160 MPH
EXPOSURE CATEGORY “B”
See Table 12 for post dimensions and material properties
(16)

8/15/2019 CLFMI WindLoadGuide Revised 2014
http://slidepdf.com/reader/full/clfmi-windloadguide-revised-2014 21/38
TABLE 8 LINE POST SELECTION: WIND SPEED 170 MPH
EXPOSURE CATEGORY “B”
See Table 12 for post dimensions and material properties.
(17)

8/15/2019 CLFMI WindLoadGuide Revised 2014
http://slidepdf.com/reader/full/clfmi-windloadguide-revised-2014 22/38

8/15/2019 CLFMI WindLoadGuide Revised 2014
http://slidepdf.com/reader/full/clfmi-windloadguide-revised-2014 23/38

8/15/2019 CLFMI WindLoadGuide Revised 2014
http://slidepdf.com/reader/full/clfmi-windloadguide-revised-2014 24/38
TABLE 11 Ice Exposure Coeffic ients (Cf 3)
Regional Conditions Cf 3
Regions likely to experience heavy ice storms 0.45
Regions subject to moderate icing effects 0.85
Regions not subject to the effects of icing 1.00
NOTES
1. Maximum spacing of posts may be limited by top rail design.
2. Recommended maximum spacing of posts not to exceed 10’-0”.
3. For solid fence use exposure coefficient (Cf3) = 1.0.
4. Ice exposure coefficient is an arbitrary value that may be assigned based on the judgment ofthe designer, considering the probability of an event occurring where maximum iceaccumulation and peak wind velocity occurs at the same time in the locality the fence isinstalled.
(20)

8/15/2019 CLFMI WindLoadGuide Revised 2014
http://slidepdf.com/reader/full/clfmi-windloadguide-revised-2014 25/38
( 21)
TABLE 12
Sx..... Section Modulus lx..... Moment of Inertia Fx..... Minimum Yield
Mallow...... Allowable Moment Capacity Post (Fy)(Sx)0.66/12 in.ft
Em..... Modulus of Elasticity of Material
Line Post Material Properties Table

8/15/2019 CLFMI WindLoadGuide Revised 2014
http://slidepdf.com/reader/full/clfmi-windloadguide-revised-2014 26/38
TABLE 13
Design Wind Pressure, q (LB / SF)
Wind Veloci ty (MPH) EXPOSURECATEGORY
Height (ft)
Kz 105 110 120 130 140 150 160 170
0 - 15 0.57 16.00 16.58 19.74 23.16 26.86 30.84 35.09 39.61 B
15 - 20 0.62 16.44 18.04 21.47 25.19 29.22 33.54 38.16 43.08
0 - 15 0.85 22.53 24.73 29.43 34.54 40.06 45.99 52.32 59.07 C
15 - 20 0.90 23.86 26.18 31.16 36.57 42.42 48.69 55.40 62.54
0 - 15 1.03 27.30 29.97 35.66 41.85 48.54 55.72 63.40 71.57 D
15 - 20 1.08 28.63 31.42 37.39 43.89 50.90 58.43 66.48 75.05
NOTES:
q = (0.00256)(Kz)(Kzt)(Kd)G)(Cf)(V2)
Kz = EXPOSURE COEFFICIENT (GIVEN ABOVE)Kzt = 1.0 (TOPOGRAPHIC FACTOR, PRESUMED = 1 FOR NO TOPOGRAPHIC EFFECTS)Kd = 0.85 (DIRECTIONALITY FACTOR)G = .85 (GUST FACTOR)Cf = 1.3 (FORCE COEFFICIENT)V = VELOCITY (GIVEN ABOVE)
REF: ASCE 7-10, "MINIMUM DESIGN LOADS FOR BUILDINGS AND OTHER STRUCTURES"
(22)

8/15/2019 CLFMI WindLoadGuide Revised 2014
http://slidepdf.com/reader/full/clfmi-windloadguide-revised-2014 27/38
ER 26 WIND LOADS: GENERAL REQUIREMENTS CHAPT
Figure 26.5-1C Basic Wind Speeds for Occupancy Category I Buildings and Other Structures.
Notes:
1. Values are nominal design 3-second gust wind speeds in miles per hour (m/s) at 33 ft (10m) above ground for
Exposure C category.
2. Linear interpolation between contours is permitted.
3. Islands and coastal areas outside the last contour shall use the last wind speed contour of the coastal area.
4. Mountainous terrain, gorges, ocean promontories, and special wind regions shall be examined for unusual wind
conditions.
5. Wind speeds correspond to approximately a 15% probability of exceedance in 50 years (Annual Exceedance
Probability = 0.00333, MRI = 300 Years).
249a (23)

8/15/2019 CLFMI WindLoadGuide Revised 2014
http://slidepdf.com/reader/full/clfmi-windloadguide-revised-2014 28/38
MINIMUM DESIGN LOADS
Figure 26.5-1c (Continued )
(24)
249b

8/15/2019 CLFMI WindLoadGuide Revised 2014
http://slidepdf.com/reader/full/clfmi-windloadguide-revised-2014 29/38
APPENDIX

8/15/2019 CLFMI WindLoadGuide Revised 2014
http://slidepdf.com/reader/full/clfmi-windloadguide-revised-2014 30/38

8/15/2019 CLFMI WindLoadGuide Revised 2014
http://slidepdf.com/reader/full/clfmi-windloadguide-revised-2014 31/38
CHAPTER 26 WIND LOADS: GENERAL REQUIREMENTS
256 (26)

8/15/2019 CLFMI WindLoadGuide Revised 2014
http://slidepdf.com/reader/full/clfmi-windloadguide-revised-2014 32/38
26.7.3 Exposure Categories
Exposure B: For buildings with a mean roof height of less than or equal to 30 ft (9.1 m), ExposureB shall apply where the ground surface roughness, as defined by Surface Roughness B, prevails in the
upwind direction for a distance greater than 1,500 ft (457 m). For buildings with a mean roof heightgreater than 30 ft (9.1 m), Exposure B shall apply where Surface Roughness B prevails in the upwind
direction for a distance greater than 2,600 ft (792 m) or 20 times the height of the building, whicheveris greater.
Exposure C: Exposure C shall apply for all cases where Exposures B or D do not apply.
Exposure D: Exposure D shall apply where the ground surface roughness, as defined by SurfaceRoughness D, prevails in the upwind direction for a distance greater than 5,000 ft (1,524 m) or 20 times
the building height, whichever is greater. Exposure D shall also apply where the ground surfaceroughness immediately upwind of the site is B or C, and the site is within a distance of 600 ft (183 m)
or 20 times the building height, whichever is greater, from an Exposure D condition as defined in the previous sentence. For a site located in the transition zone between exposure categories, the category
resulting in the largest wind forces shall be used.
EXCEPTION: An intermediate exposure between the preceding categories is permitted in a transitionzone provided that it is determined by a rational analysis method defi ned in the recognized literature.
29.3.2 Velocity Pressure
Velocity pressure, qz, evaluated at height z shall be calculated by the
following equation:
qz = 0.00256 KzKztKdV2 (lb/ft2) (29.3-1)
[In SI: qz = 0.613 KzKztKdV2 (N/m2); V in m/s]
where:
Kd = wind directionality factor defined in Section 26.6
Kz = velocity pressure exposure coeffi cient defined in Section 29.3.1
Kzt = topographic factor defined in Section 26.8.2
V = basic wind speed from Section 26.5.
qh = velocity pressure calculated using Eq. 29.3-1 at height h
The numerical coefficient 0.00256 (0.613 in SI) shall be used except where sufficient climatic
data are available to justify the selection of a different value of this factor for a design application.
(27)

8/15/2019 CLFMI WindLoadGuide Revised 2014
http://slidepdf.com/reader/full/clfmi-windloadguide-revised-2014 33/38
CHAPTER 26 WIND LOADS: GENERAL REQUIREMENTS
Wind Directionality Factor, Kd
Table 26.6-1
Structure Type Directionality Factor Kd*
Buildings
Main Wind Force Resisting System
Components and Cladding
0.85
0.85
Arched Roofs 0.85
Chimneys, Tanks, and Similar Structures
Square
Hexagonal
Round
0.90
0.95
0.95
Solid Freestanding Walls and Solid
Freestanding and Attached Signs 0.85
Open Signs and Lattice Framework 0.85
Trussed Towers
Triangular, square, rectangular
All other cross sections 0.85
0.95
*Directionality Factor K d has been calibrated with combinations of loads
specified in Chapter 2. This factor shall only be applied when used in
conjunction with load combinations specified in Sections 2.3 and 2.4.
250 (28)

8/15/2019 CLFMI WindLoadGuide Revised 2014
http://slidepdf.com/reader/full/clfmi-windloadguide-revised-2014 34/38
CHAPTER 29 WIND LOADS ON OTHER STRUCTURES AND BUILDING APPURTENANCES—MWFRS
Velocity Pressure Exposure Coefficients, Kh and Kz
Table 29.3-1
Exposure Height above
ground level, z
ft (m) B C D
0-15 (0-4.6) 0.57 0.85 1.03 20 (6.1) 0.62 0.90 1.08 25 (7.6) 0.66 0.94 1.12 30 (9.1) 0.70 0.98 1.16 40 (12.2) 0.76 1.04 1.22 50 (15.2) 0.81 1.09 1.27 60 (18) 0.85 1.13 1.31 70 (21.3) 0.89 1.17 1.34 80 (24.4) 0.93 1.21 1.38 90 (27.4) 0.96 1.24 1.40
100 (30.5) 0.99 1.26 1.43 120 (36.6) 1.04 1.31 1.48 140 (42.7) 1.09 1.36 1.52 160 (48.8) 1.13 1.39 1.55 180 (54.9) 1.17 1.43 1.58 200 (61.0) 1.20 1.46 1.61 250 (76.2) 1.28 1.53 1.68 300 (91.4) 1.35 1.59 1.73 350 (106.7) 1.41 1.64 1.78 400 (121.9) 1.47 1.69 1.82 450 (137.2) 1.52 1.73 1.86 500 (152.4) 1.56 1.77 1.89
Notes:
1. The velocity pressure exposure coefficient K z may be determined from the followingformula:
For 15 ft. ≤ z ≤ zg For z < 15 ft.
K z = 2.01 (z/zg)2/α
K z = 2.01 (15/zg)2/α
2. α and zg are tabulated in Table 26.9.1.
3. Linear interpolation for intermediate values of height z is acceptable.
4. Exposure categories are defined in Section 26.7.
310 (29)

8/15/2019 CLFMI WindLoadGuide Revised 2014
http://slidepdf.com/reader/full/clfmi-windloadguide-revised-2014 35/38
s
h s/2
0.3 0.90
1.0 0.75 ≥ 2 0.60
B
SOLID SIGN ORs
h
GROUND SURFACE
ELEVATION VIEW
s s s Balance
F
CASE A WIND F FF
F WIND
CASE C
FBalance s s s
F
F 0.05h h/2
s=h h/2
GROUND SURFACE s/h < 1 s/h = 1
CROSS-SECTION VIEW
RANGE
F F WIND
F F
F WIND
0.2BRANGE
PLAN VIEWS Cf , CASE A & CASE B
Aspect Ratio, B/s Clearance
Ratio, s/h ≤ 0.05 0.1 0.2 0.5 1 2 4 5 10 20 30 ≥ 45 1
1.80
1.70
1.65
1.55 1.45 1.40 1.35 1.35 1.30 1.30
1.30
1.30
0.9 1.85 1.75 1.70 1.60 1.55 1.50 1.45 1.45 1.40 1.40 1.40 1.40 0.7 1.90 1.85 1.75 1.70 1.65 1.60 1.60 1.55 1.55 1.55 1.55 1.55 0.5 1.95 1.85 1.80 1.75 1.75 1.70 1.70 1.70 1.70 1.70 1.70 1.75 0.3 1.95 1.90 1.85 1.80 1.80 1.80 1.80 1.80 1.80 1.85 1.85 1.85 0.2 1.95 1.90 1.85 1.80 1.80 1.80 1.80 1.80 1.85 1.90 1.90 1.95
≤ 0.16 1.95 1.90 1.85 1.85 1.80 1.80 1.85 1.85 1.85 1.90 1.90 1.95
Cf , CASE C Aspect Ratio, B/s Aspect Ratio, B/s Region
(hor izontal
distance fr om
windward edge) 2 3 4 5 6 7 8 9 10
Region (hor izontal
distance fr om
windward edge) 13 ≥ 45 0 to s 2.25 2.60 2.90 3.10* 3.30* 3.40* 3.55* 3.65* 3.75* 0 to s 4.00* 4.30*
s to 2s 1.50 1.70 1.90 2.00 2.15 2.25 2.30 2.35 2.45 s to 2s 2.60 2.55 2s to 3s 1.15 1.30 1.45 1.55 1.65 1.70 1.75 1.85 2s to 3s 2.00 1.95 3s to 10s 1.10 1.05 1.05 1.05 1.05 1.00 0.95 3s to 4s 1.50 1.85
4s to 5s 1.35 1.85 5s to 10s 0.90 1.10
*Values shall be multipliedL / s Reduction Factor PLAN VIEW OF W ALL OR SIGN W ITH
by the following reduction
r Lr A RETURN CORNER
f actor when a return>10s 0.55 0.55
B WIND
Notes:
1. The term "signs" in notes below also applies to "freestanding walls".
2. Signs with openings comprising less than 30% of the gross area are classified as solid signs. Force coefficients for solid signs with openings
shall be permitted to be multiplied by the reduction factor (1 - (1 - ε)1.5
).
3. To allow for both normal and oblique wind directions, the following cases shall be considered:
For s/h < 1:
CASE A: resultant force acts normal to the face of the sign through the geometric center.
CASE B: resultant force acts normal to the face of the sign at a distance from the geometric center
toward the windward edge equal to 0.2 times the average width of the sign.
For B/s ≥ 2, CASE C must also be considered:
CASE C: resultant forces act normal to the face of the sign through the geometric centers of each region.
For s/h = 1:
The same cases as above except that the vertical locations of the resultant forces occur at a distance above
the geometric center equal to 0.05 times the average height of the sign.
4. For CASE C where s/h > 0.8, force coefficients shall be multiplied by the reduction factor (1.8 - s/h).
5. Linear interpolation is permitted for values of s/h, B/s and Lr /s other than shown.
6. Notation:
B: horizontal dimension of sign, in feet (meters);
h: height of the sign, in feet (meters);
s: vertical dimension of the sign, in feet (meters);
ε: ratio of solid area togross area;
Lr : horizontal dimension of return corner, in feet (meters)
MINIMUM DESIGN LOADS
Design Wind Loads All Heights Figure 29.4-1 Force Coefficients,Cf
Other Structures Solid Freestanding Walls
& Solid Freestanding Signs
WIND0.2B
(30)
8/15/2019 CLFMI WindLoadGuide Revised 2014
http://slidepdf.com/reader/full/clfmi-windloadguide-revised-2014 36/38
CHAPTER 26 WIND LOADS: GENERAL REQUIREMENTS
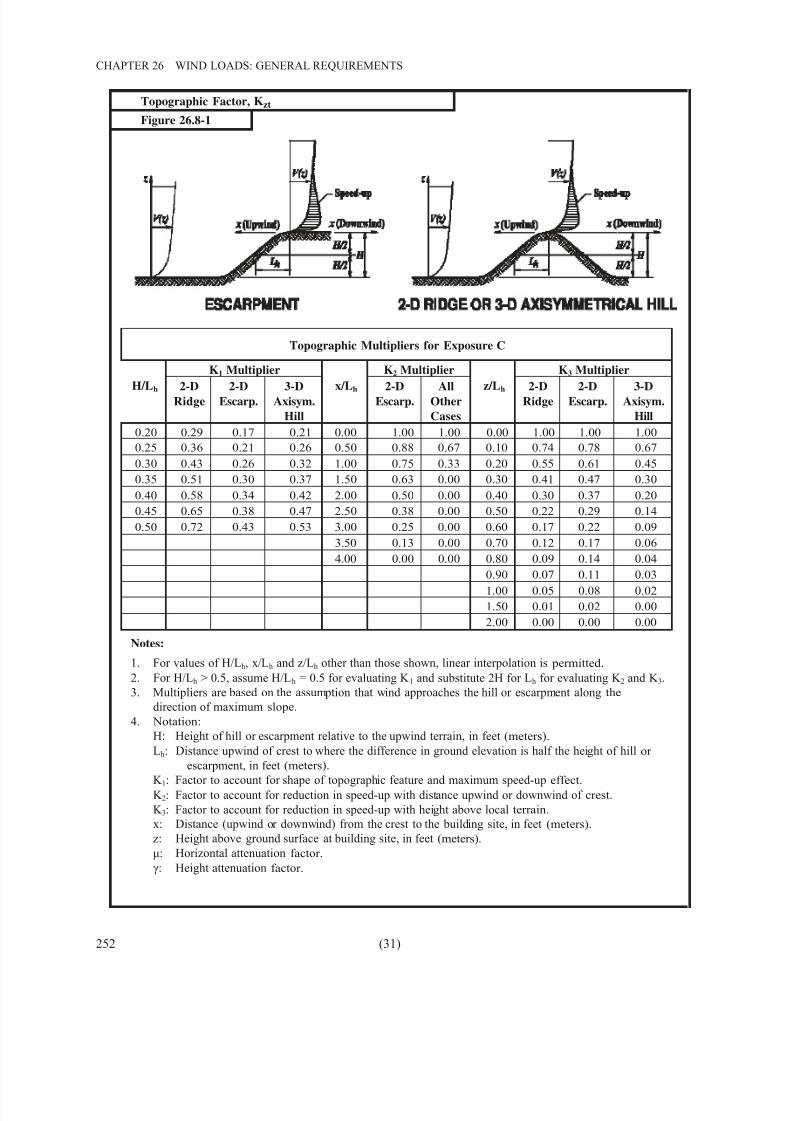
Topographic Factor, Kzt
Figure 26.8-1
Topographic Multipliers for Exposure C
K1 Multiplier K2 Multiplier K3 Multiplier H/L
h 2-D
Ridge 2-D
Escarp. 3-D
Axisym.
Hill
x/Lh
2-D
Escarp.
All
Other
Cases
z/L
h 2-D
Ridge
2-D
Escarp. 3-D
Axisym.
Hill
0.20 0.29 0.17 0.21 0.00 1.00 1.00 0.00 1.00 1.00 1.00
0.25 0.36 0.21 0.26 0.50 0.88 0.67 0.10 0.74 0.78 0.67 0.30 0.43 0.26 0.32 1.00 0.75 0.33 0.20 0.55 0.61 0.45 0.35 0.51 0.30 0.37 1.50 0.63 0.00 0.30 0.41 0.47 0.30 0.40 0.58 0.34 0.42 2.00 0.50 0.00 0.40 0.30 0.37 0.20 0.45 0.65 0.38 0.47 2.50 0.38 0.00 0.50 0.22 0.29 0.14 0.50 0.72 0.43 0.53 3.00 0.25 0.00 0.60 0.17 0.22 0.09
3.50 0.13 0.00 0.70 0.12 0.17 0.06 4.00 0.00 0.00 0.80 0.09 0.14 0.04
0.90 0.07 0.11 0.03
1.00 0.05 0.08 0.02 1.50 0.01 0.02 0.00 2.00 0.00 0.00 0.00
Notes:
1. For values of H/Lh, x/Lh and z/Lh other than those shown, linear interpolation is permitted.
2. For H/Lh > 0.5, assume H/Lh = 0.5 for evaluating K 1 and substitute 2H for Lh for evaluating K 2 and K 3.
3. Multipliers are based on the assumption that wind approaches the hill or escarpment along the
direction of maximum slope.
4. Notation:
H: Height of hill or escarpment relative to the upwind terrain, in feet (meters).
Lh: Distance upwind of crest to where the difference in ground elevation is half the height of hill or
escarpment, in feet (meters).
K 1: Factor to account for shape of topographic feature and maximum speed-up effect. K 2: Factor to account for reduction in speed-up with distance upwind or downwind of crest.
K 3: Factor to account for reduction in speed-up with height above local terrain. x: Distance (upwind or downwind) from the crest to the building site, in feet (meters).
z: Height above ground surface at building site, in feet (meters).
μ: Horizontal attenuation factor.
γ: Height attenuation factor.
252 (31)

8/15/2019 CLFMI WindLoadGuide Revised 2014
http://slidepdf.com/reader/full/clfmi-windloadguide-revised-2014 37/38
SOILS AND FOUNDATIONS
loads, the calculations shall be in accordance with Sections 1806.3.1 through 1806.3.4.
1806.3.1 Combined resistance. The total resistance to lat-
eralloads shall be permitted to be determined by combining
the values derived from the lateral bearing pressure and thelateral sliding resistance specified in Table 1806.2.
1806.3.2 Lateral sliding resistance limit. For clay, sandyclay, silty clay, clayey silt, silt and sandy silt, in no case shallthe lateral sliding resistance exceed one-half the dead load.
1806.3.3 Increase for depth. The lateral bearing pressures
specified in Table 1806.2 shall be permitted to be increased
by the tabular value for each additional foot (305 mm) of
depth to a maximum of 15 times the tabular value.
1806.3.4 Increase for poles. Isolated poles for uses such asflagpoles or signs and poles used to support buildings thatare not adversely affected by a 1/2 inch (12.7 mm) motion at
the ground surface due to short-term lateral loads shall be
permitted to be designed using lateral bearing pressuresequal to two times the tabular values.
SECTION 1807 FOUNDATION WALLS, RETAINING WALLS AND
EMBEDDED POSTS AND POLES
1807.1 Foundation walls. Foundation walls shall be designed
and constructed in accordance with Sections 1807.1.1 through 1807.1.6. Foundation walls shall be supported by foundationsdesigned in accordance with Section 1808.
1807.1.1 Design lateral soil loads. Foundation walls shall
be designed for the lateral soil loads set forth in Section 1610.
1807.1.2 Unbalanced backfill height. Unbalanced backfill
height is the difference in height between the exterior finishground level and the lower of the top of the concrete footing
that supports the foundation wall or the interior finish
ground level. Where an interior concrete slab on grade is
provided and is in contact with the interior surface of the
foundation wall, the unbalanced backfill height shall be per-
mitted to be measured from the exterior finish ground level
to the top of the interior concrete slab.
1807.1.3 Rubble stone foundation walls. Foundation
walls of rough or random rubble stone shall not be less than
16 inches (406 mm) thick. Rubble stone shall not be used for
foundation walls of structures assigned to Seismic Design
CategoryC, D, E or F.
1807.1.4 Permanent wood foundation systems. Perma-
nent wood foundation systems shall be designed andinstalled in accordance with AF &PA PWF. Lumber and ply-
wood shall be treated in accordance with AWPA Ul (Com-
modity Specification A, Use Category 4B and Section 5.2)and shall be identified in accordance with Section 2303.1.8.1.
1807.1.5 Concrete and masonry foundation walls. Con-crete and masonry foundation walls shall be designed in
accordance with Chapter 19 or 21, as applicable.
Exception: Concrete and masonry foundation walls shall
be permitted to be designed and constructed in accordance
with Section 1807.1.6.
TABLE1806.2
PRESUMPTIVE LOAD-BEARING VALUES
LATERAL SLIDING RESISTANCE
CLASS OF MATERIALS VERTICAL FOUNDATION
PRESSURE (psf )
LATERAL BEARINGPRESSURE
(psf/f below natural grade) Coefficient of frictiona Cohesion (psf)b
1. Crystalline bedrock 12 ,000 1,200 0.70 -
2. Sedimentary and foli-
ated rock 4,000 400 0.35 -
3. Sandy gravel and/or
gravel (GW and GP) 3,000 200 0.35 -
4. Sand, silty sand, clayey
sand, silty gravel andclayey gravel (SW , SP ,
SM, SC, GM and GC)
2,000 150 0.25 -
5. Clay, sandy clay, silty
clay, clayey silt, silt and
sandy silt (CL, ML,
MH and CH)
1,500 100 - 130
For SI : 1 pound per square foot = 0.0479 kPa, 1 pound per square foot per foot = 0.157 kPa/m .
a. Coefficient to be multiplied by the dead load .
b. Cohesion value to be multiplied by the contact area, as limited by Section 1806 .3.2.
392 (32) 2009 INTERNATI ONAL BUILDING CODE®

8/15/2019 CLFMI WindLoadGuide Revised 2014
http://slidepdf.com/reader/full/clfmi-windloadguide-revised-2014 38/38
REFERENCES
ASCE Publication ASCE 7-10, "Minimum Load Design Criteria for Buildings and Other Structures,” Section 26, Wind Loads.
American Society of Testing Materials Standard, ASTM FI043, Standard Specification for Strength and Protective Coatings on Metal Industrial Chain Link Fence Framework
American Society of Testing Materials Standard, ASTM F567, Standard Practice for Installation of Chain Link Fence.
American Society of Testing Materials Standard, ASTM FI083, Pipe, Steel, Hot-Dipped Zinc Coated (Galvanized) Welded for Fence Structures
American Institute of Steel Construction, “Manual of Steel Construction-AllowableStress Design”
*Copyrighted material reproduced by permission of the author and publisher, The American Society of CivilEngineers, from ASCE 7-10.
(33)