cleavage structures and ideological dimensions in english ... · cleavage structures and...
TRANSCRIPT

Cleavage Structures and Ideological Dimensions in
English Politics: Some Evidence from VAA Data
Jonathan Wheatley
University of Zurich
Paper prepared for the ECPR General Conference, Montreal, 26-29August 2015.
Abstract
The left-right dimension is the most common way of conceptualizingideological difference. It is based on the traditional cleavage in societybetween capital and labour. But in an ever more globalised world, arethe concepts of Left and Right as relevant today as they were half a cen-tury ago? This paper builds on the hypothesis of Kriesi et al. (2006),who argue that a new societal cleavage has emerged in many Europeansocieties between “winners” and “losers” of globalisation and that insome countries this has manifested itself in the formation of new pop-ulist “right-wing” parties. I argue that this cleavage has engendereda new ideological dimension that pits “cosmopolitans” against “com-munitarians” and draws on cultural issues relating to identity, ratherthan economic issues. I test this argument by identifying latent di-mensions from opinion data generated by two Voting Advice Applica-tions (VAAs) deployed in England in 2014 and 2015 and by mappingthe positions of party supporters with respect to these dimensions. Ifind that in England the political space is defined by two main ideo-logical dimensions: an economic Left-Right dimension and a culturalcommunitarian-cosmopolitan dimension. I also find that supporters ofthe newly formed United Kingdom Independence Party (UKIP) arelocated near the communitarian pole of the cultural dimension. Fi-nally, I find that amongst voters who are not politically interested, theeconomic dimension is hardly relevant at all, but that the set of issuesthat define the cultural dimension remain relevant and structure thepolitical views of these voters.
Introduction
The aim of this paper is to explore the validity of the concepts of Left andRight as ideological markers in English politics. Specifically I investigate
1
whether or not Left versus Right still constitutes a meaningful ideologicaldimension, and if it does what issues load onto it. “Left” and “Right” areambiguous concepts; for Huber and Inglehart, the Left-Right dimension is“an amorphous vessel whose meaning varies in systematic ways with theunderlying political and economic conditions in a given society” (Huber andInglehart 1995, 90). Moreover, the concepts of Left and Right have provedextraordinarily flexible over time. First coined in post-revolutionary Franceto distinguish supporters of the King and Church (the Right) from sup-porters of the French Revolution (the Left), by the twentieth century theseconcepts had acquired an economic significance with those on the Rightsupporting free-market capitalism and those on the Left supporting redis-tribution of wealth and defending the interests of labour. Today “Left”and “Right” are variously used to refer to both economic ideologies (cap-ital versus labour) and cultural ideologies (social liberalism versus socialconservatism).
That Left and Right in Western Europe took on an economic significancein the twentieth century is unsurprising. By then the class cleavage, i.e. thatbetween capital and labour, had become the dominant cleavage in society.However, in their seminal essay of 1967 Lipset and Rokken identify no lessthan four potential societal cleavages that have structured the formation ofparty politics in Western Europe since the end of the eighteenth century.The cleavage between labour and capital was but the last of these cleavagesto emerge; Lipset and Rokkan identify two more that appeared earlier incertain societies as a result of the so called “national revolution”; thesewere between the centre and the periphery and between the interests of theChurch and those of the state. The capital versus labour cleavage appearedas a result of the Industrial Revolution, as did a further cleavage betweenland and industry (Lipset and Rokkan 1967). Kriesi et al. (2006) identifya fifth societal cleavage that appeared at the end of the twentieth centuryand the beginning of the twenty-first: that between “winners” and “losers”of globalisation.
Given the complexities of societal cleavages in many European societies,is it not possible that politics is rather too complex to be reduced to justone (Left versus Right) ideological dimension? Lipset (1959) warns thatpolitics becomes especially conflict-prone when the economic (capital ver-sus labour) cleavage reinforces a religious-secular cleavage, leaving open the(more desirable) possibility that these two cleavages may be cross-cutting,suggesting by implication the possibility of at least two independent ideolog-ical dimensions. While not all (five) cleavages identified above are relevantin all societies, it is very likely that more than one may be relevant in most.If they are cross-cutting, rather than reinforcing, they may define a multi-dimensional ideological space.
By the 1970s and 1980s, scholars were already proposing a second ideo-logical dimension that existed in parallel to the (economic) Left versus Right
2

dimension. Inglehart (1977, 1990) identified the emergence of a “new poli-tics” based on what he terms “post-materialist values” that emerged as partof the counter-culture of the 1960s and 1970s and that began to supplant—orexist in parallel with—materialist values that were based on the imperativeof economic need. “Post-materialist values” include cultural notions of gen-der equality, gay rights, environmental protection and tolerance of alterna-tive lifestyles. Based on these concepts, some scholars suggest that two ide-ological dimensions—one economic and one cultural—would better describethe ideological space in Europe than a single all-encompassing Left-Rightdimension. Thus Kitschelt suggests a libertarian-authoritarian dimensionin addition to an (economic) Left-Right dimension (Kitschelt 1994, 1995),while Marks et al. (2006) suggest TAN/GAL as an acronym for the seconddimension, where TAN stands for traditionalism/authority/nationalism andGAL refers to green/alternative/libertarian. The well-known Chapel Hillsurvey, carried out by scholars of the University of North Carolina, uses aneconomic Left-Right dimension and a TAN/GAL dimension to locate Eu-ropean political parties in a two-dimensional ideological space (Marks et al.2006; Bakker et al. 2015).
The political system in the United Kingdom is usually described as atwo-party system that is defined by a single Left-Right dimension, with theLabour Party on the Left and the Conservative Party on the Right. Thesmaller third party, the Liberal Democrats (previously the Liberal Party),is usually placed in the middle of the spectrum or very slightly to the leftof centre. Above all, the Left-Right dimension is seen as an economic di-mension with the Labour Party representing labour on the Left and theConservatives representing capital on the Right. However, following TonyBlair’s election as leader of the Labour party in 1994, the Labour Party in-creasingly adopted business-friendly policies and embraced the free marketeconomy, reducing the distance between the two main parties on the eco-nomic dimension. During the beginning of twenty-first century, the UnitedKingdom Independence Party (UKIP), a eurosceptic party formed in 1991as the anti-Federalist League, began to draw votes from the other parties.Weak on economic policy, UKIP was defined more by its stance on cultural oridentity issues such as Britain’s relation to Europe, immigration (for whichit advocated strict controls) and localism. UKIP took first place in elec-tions to the European Parliament in 2014 and came third in terms of votes,with 12.6 percent in the general elections of 2015. The two-party systemin the United Kingdom was further undermined by the Scottish NationalParty (SNP), which by 2015 had become the dominant party in Scotland,garnering 50 percent of the vote there.
These developments suggest that British politics is becoming more com-plex and can no longer be so easily defined by a single Left-Right dimension.While UKIP is usually defined as “right-wing”, it is not defined in this waybecause of its economic policy, but because of its stance on immigration
3

and other identity issues. For Ford and Goodwin (2014), UKIP draws from“left behind” voters, typically older, blue-collar workers who feel that theirinterests are no longer represented by the traditional parties, especially theLabour Party, which they feel has neglected its traditional working classbase and has become too cosmopolitan and London-based. James Meek,reflecting on the constituency of Thanet, where UKIPs leader Nigel Faragestood as a candidate in the 2015 elections and came a close second behindthe Conservatives, identifies an “alienation of [the local] economy and in-frastructure from the people who live there”, giving rise to a sense amongstless advantaged residents that they are “being taken for a ride by remotepowers” (Meek 2014). Wary of change and unable to pinpoint the causeof change, they focus on what they see in front of them—more newcomersspeaking eastern European languages—and a sense that it is the EU andthe Westminster establishment that is to blame.
In short, authors such as Ford and Goodwin are describing voters whoare “left behind” by globalisation and the changes associated with it and arebitter and resentful about their powerlessness. To adopt the terminology ofKriesi et. al, they are “losers” of globalisation in a new societal cleavagebetween “winners” and “losers”. Indeed Kriesi et. al suggest that globali-sation’s losers more often adopt a position of “cultural demarcation” thanfocus on their economic woes and demand economic redistribution, leadingmany of them to turn to populist anti-immigration, anti-EU, “right-wing”parties (Kriesi et al. 2006). Referring to what would appear to be the samecleavage, some UK commentators have suggested that there is increasingly adivide in society between “communitarians” and “cosmopolitans” (Wheat-ley 2015a). While the former group (that to which UKIP supporters tendto belong) reject change, prefer continuity and stability and feel that “thoseclose to us matter more than people who are far away”1, the latter arepredominantly metropolitan liberals who welcome change, cultural diversityand geographical mobility. The question we seek to address in this paperis whether a new communitarian-cosmopolitan dimension is more and morecoming to define the ideological space in the United Kingdom, with UKIPrepresenting the communitarian pole, and, if so, whether this dimensionexists alongside an economic Left-Right dimension or even is beginning tosupplant it.
In order to address this question we draw from public opinion data gen-erated from an online application called a Voting Advice Application (VAA),the purpose of which is to help users decide how to vote in elections. Specif-ically, the data is drawn from two VAAs: the EUvox VAA, which was de-ployed prior to elections to the European Parliament (EP) in May 2014,and WhoGetsMyVoteUK, which was deployed before the general elections
1Goodhart, David, “How to close the door on an accidental mass migration”, FinancialTimes, 24 October 2014
4
a year later. The data contains users’ opinions on thirty policy issues andin this paper I use Mokken Scale Analysis to identify ideological dimensionsand locate users, parties and, more specifically, party supporters on a policyspace defined by these dimensions. My approach is inductive; instead ofpredefining ideological dimensions a priori like Marks et al., I “let the dataspeak for itself” and predetermine neither the number nor the nature of eachdimension. Another innovation of my approach in this paper is that I focusmore on how voters are aligned, rather than how political elites are aligned.While traditional approaches to locating parties in an ideological space in-volve elite surveys (Kitschelt et al. 1999) or manifesto analyses (Budge etal. 2001); here the focus is—to adopt a term coined by Key (1964)—the“party-in-the-electorate”.
Of course, one problem we face is that VAA users are a self-selectedsample that may not be representative of the population at large. To helpovercome this problem, I divide the overall samples of VAA users into anumber of different sub-samples, based on age, education and political in-terest, and perform the analysis on each subgroup separately. I also generatea sample of users than is more or less representative of the voting popula-tion in terms of vote intention. The goal of this sampling exercise is tosee whether the coherence of the dimensions identified varies between thedifferent sub-samples.
My overall findings are the following. First, two principal ideological di-mensions were identified from the opinion data generated by the two VAAs,one of which was that between an economic Left and an economic Rightand one of which represented the divide described above between communi-tarians and cosmopolitans. These two dimensions covary with one anotherwith economically right-wing voters tending to be more communitarian andeconomically left-wing voters tending towards the cosmopolitan end of thespectrum. While one interpretation of data from EUvox suggested thatthese two dimensions could be subsumed into a single over-arching dimen-sion, WhoGetsMyVoteUK identifies them as clearly distinct.
The second main finding regards the role of UKIP. Users who identi-fied themselves as UKIP supporters in both VAAs were positioned near thecommunitarian pole of the communitarian-cosmopolitan dimension. Thisconforms to the hypothesis that UKIP supporters feel threatened by global-isation and seek refuge in their close community and “like-minded” people.
The third finding is probably the most dramatic. This is that amongstsub-samples of voters with relatively low political interest and—to a lesserextent—amongst younger and less well-educated voters, the covariances ofuser responses to policy issues belonging to the cultural communitarian-cosmopolitan dimension are significantly higher than corresponding covari-ances along the economic Left-Right dimension. Indeed amongst the cohortthat shows least interest in politics, the economic Left-Right dimension ishardly a coherent dimension at all, while the communitarian-cosmopolitan
5

dimension remains relatively strong.The rest of the paper will proceed as follows. First I explain the method
used for analysing the data generated by the VAAs, including identifyingideological dimensions, mapping party supporters with respect to these di-mensions and analysing sub-samples of the data. I then go on to presentthe results of the analysis. I end the paper with a short conclusion.
Method
As has been pointed out in the previous section, the data I use for thisanalysis has been generated by two VAAs deployed in the United Kingdombefore the EP elections in 2014 and before the 2015 general elections. Be-cause somewhat different questions were asked in England, Scotland, Walesand Northern Ireland, here I consider only the England dataset, which wasfar larger than the other three. The dataset generated from EUvox (forthe EP elections) in England contains data from 60,728 users after cleaning,while the WhoGetsMyVote dataset (from the general elections) incorporatesdata from 17,281 users.
VAAs are online applications that enable users to compare their policypreferences with those of political parties (or election candidates) in order tohelp them decide how to vote. Users are presented with a number of policyor issue statements to which they can express varying degrees of agreementor disagreement. Independently, parties (or candidates) are either coded byexperts or self-coded on each statement. The application then matches theuser and parties (or candidates) in the form of a graphical display, whichshows the user how close he or she is to each party or candidate. BothEUvox and WhoGetsMyVoteUK included thirty issue statements and userscould respond with any one of the following response categories: “completelyagree”, “agree”, “neither agree nor disagree”, “disagree”, “completely dis-agree” and “no opinion”. In both VAAs, users were also invited to answer anumber of supplementary questions, which included age, education, genderand (in the case of EUvox) interest in politics (very, somewhat, little or notat all) or (in the case of WhoGetsMyVoteUK) attention paid to politics (ona scale from 1 to 10). Further supplementary questions also asked users toname the parties (if any) they a) felt closest to, b) intended to vote for inthe coming general elections and c) (for EUvox only) intended to vote for inthe EP elections. For all supplementary questions, the option “I prefer notto say” was available, while for those involving the naming of parties, theoptions “none” and “I do not intend to vote” were available. The datasetsincluded the responses of users to all issue statements and supplementaryquestions after extensive cleaning.2
2For cleaning I removed: 1) all cases in which the time taken to complete the 30 issuestatements of the VAA was less than 120 seconds; 2) all cases in which the time to respond
6
Latent ideological dimensions were identified from users’ responses to thethirty issue statements. The most commonly used method for identifyinglatent dimensions is factor analysis and this author has also previously usedfactor analysis from user responses to issue statements in VAAs, includingin an earlier work on the England EUvox dataset (Wheatley 2015a,b). How-ever, van der Eijk and Rose (2013) find that when factor analysis is appliedto ordered-categorical survey items (also often known as Likert items), theanalysis is prone to over-estimating the number of latent dimensions (over-dimensionalisation). Emons et al. (2012) hold that MSA is more suitablefor analysing discrete questionnaire data than either principal componentanalysis (PCA) or confirmatory factor analysis (CFA), and that even whenpolychoric correlations are used in PCA and CFA (as in Wheatley (2015a)and Wheatley (2015b)), the assumption within this technique of latent nor-mal distributions may distort the results. For this reason in this paper I useMokken Scale Analysis (MSA) to identify latent dimensions or scales fromusers’ responses to issue statements.
MSA has already been used on ordered-categorical VAA issue statementseither to map parties or to test the validity of the scales that are used togenerate two-dimensional maps in VAAs (Wheatley 2012; Wheatley et al.2014; Germann et al. 2015; Germann and Mendez 2015). To constitute ascale in MSA a) each variable Vj that belongs to the scale must covarywith the total score of the other variables belonging to it (excluding Vj , i.e.the rest score) with a normed covariance (or item scalability coefficient) Hj
that is more than a certain lower bound c and b) the scale must satisfythe monotonicity requirement that as the value along the latent variable (asmeasured by the mean item score of the scale) changes, so the probabilityof a corresponding unidirectional change in each item of the scale changesaccordingly and in the direction expected (Sijtsma and Molenaar 2002).In our case the variables Vj are the responses of users to the VAA issuestatements (with j in 1 .. 30) with the value Vj=4 assigned to the response“completely agree”, Vj=3 to “agree”, Vj=2 to “neither agree nor disagree”,Vj=1 to “disagree” and Vj=0 to “completely disagree” (with “no opinion”responses discarded). For each scale we identify we calculate the scalabilitycoefficient H of the entire scale (also known as Loevinger’s H). Following
to any one issue statement was less than two seconds; 3) all cases in which the time takento respond to three or more issues statements was less than 3 seconds; 4) all cases in whichthe respondent answered ten successive issue statements in the same way; 5) all cases inwhich the user completed the questionnaire by smartphone (this is because it may not havebeen intuitively obvious about how to resister “no opinion” by smart phone). I then 6)sorted the data by an anonymised code that corresponded to the IP address (first), dateof birth (second), gender (third), before removing all consecutive items with the sameIP address unless it was obvious from date of birth or gender that they were differentusers. Finally I (7) removed all those who self-identified with a citizenship other than UKcitizenship and all those that claimed a date of birth prior to 1920 (on the grounds thatthey were probably fictitious entries).
7

Mokken (1971) we consider a scale to be strong if H ≥ 0.5, medium ifH ≥ 0.4 and weak if H ≥ 0.3.
Before carrying out MSA we must take one preliminary step. The onlydisadvantage of MSA in comparison with confirmatory factor analysis (CFA)is that while the root mean square error of approximation (RMSEA) in CFAhelps the researcher to identify and remove very similar items, MSA doesnot do so unless the frequency of each response to each item (i.e., levelof difficulty) is very similar (in which case monotonicity violations may beflagged). First of all, therefore, we have to check that no two items aresubstantively similar, i.e. effectively refer to the same issue. If they do,the risk is that we give too much weight to that issue within the scale weidentify, leading to a biased scale. Substantively “superfluous” items shouldtherefore be removed.
The next steps identify the scales. First, following Emons et al. (2012), Irun what is known as an automated item selection procedure (AISP) in R (inthe R package “mokken”) on all the items Vj and all reversed items V revj(calculated as 4-Vj), gradually increasing the lower bound c in incrementsof 0.05 for the coefficients Hj . In AISP I use a genetic algorithm thatfirst identifies the longest scale that satisfies Hj ≥ c by experimenting withall possible combinations of items and then begins the process again byidentifying scales out of the remaining items (Straat et al. 2013). For verylow values of c, we expect to find just two scales, with the second of thesesimply containing the same items as the first, but reversed. As I increase cwe would expect to see these scales break up into several separate scales thatcontain items that are substantively rather similar. Finally, as c increasesfurther still, we expect the new scales to fragment further into smaller, moreidiosyncratic scales that include just two or three items each. However, Istop the process when we reach the second stage (i.e. shortly after thesingle overarching scales have split into several distinct scales) providing chas reached a minimum threshold of 0.3. I then discard those scales thatare merely the reverse of another scale and check that all items Hj in eachscale satisfy the monotonicity criterion.3 I remove all items that do notsatisfy this condition and look for other items to replace them that satisfyboth the monotonicity criterion and the requirement that Hj ≥ c. Next, Iremove all ambiguous items from each scale, i.e. those that satisfy Hj ≥ cfor more than one scale. I also check to ensure that items that belong to oneor other scale do not contradict the substantive meaning of the dimension orare substantively ambiguous with respect to more than one scale. I removeitems that are problematic in this respect. Once again, if I remove itemsI look for viable substitutes that satisfy all conditions. The items that
3The check.monotonicity function in the R package generates “crit” values, which aredeemed to indicate nothing more than a sampling error if they remain below 40 but areconsidered to represent a violation of the monotonicity criterion if they exceed 80. Allitems that generate a “crit” value of more than 80 should be removed.
8

still remain in each scale are deemed to constitute a particular ideologicaldimension.
Given the non-representative nature of the data, I then endeavour tocheck that the same dimensional structure emerges when the analysis isapplied to a sample of the dataset that is more or less representative ofthe voting population in terms of political affiliation. I therefore randomlysample a number of users who expressed an intention to vote for each partythat is proportional to the number of votes won by that party in the relevantelection. I sample voters from the Conservative Party, Labour Party, LiberalDemocrats, Green Party and UKIP, as well as from a generic sample ofusers who intended to vote for other parties, and combine them. Giventhat 65 percent of English voters did not exercise their right to vote in theEP elections and 34 percent failed to vote in the general elections, I alsoadd those users who declared that they would not vote. As there wererelatively few of these, I top them up by randomly selecting users whodeclared themselves to be undecided until the sample includes the requiredproportion of abstainers. While clearly a large number of undecided votersdid, in fact vote, I assume their political affiliations to be similar to those ofabstainers in order to provide a best estimate.
Having identified scales (i.e. dimensions) that satisfy all of the aboveconditions on both the original dataset and on the (politically) represen-tative dataset, I calculate the position of all users that give an opinion onthe relevant items with respect to the dimensions identified. I do this bysumming the scores on all items that are deemed to belong to the relevantscale (using reversed items if an item is pointing in the opposite “ideologi-cal direction” from others) and normalising the sum to produce a value ofbetween zero and one. I then identify party supporters as those users whoname as the same party a) the party they felt closest to, b) the party theyintended to vote for in the forthcoming general elections and c) (in the caseof EUvox) the party they intended to vote for in the EP elections. Consid-ering only the five largest parties in England—the Conservative Party, theLabour Party, the Liberal Democrats UKIP and the Green Party—I thencalculate the mean positions of each group of party supporters with respectto each dimension and—if possible—plot graphically the contour lines thatenclose 50 percent of party supporters.
As a reliability check, I calculate the parties’ (or party elites’) positionsas articulated by manifesto pledges, other policy documents and speechesby leading members of the parties. This exercise is well-adapted to theVAAs because all parties were coded on each issue statement by a group ofexperts. The method used to code parties is the so-called Delphi method(Dalkey and Helmer 1963; Gemenis 2014), which is, in fact, rather rigorous.The method works as follows. First, a panel of experts are assigned to codeeach party. They work independently from one another in order to pro-vide estimates of the policy positions of the parties for each issue statement
9

and justify their estimates by providing information from statements in thepress, party manifestos or other relevant sources. In the case of both EUvoxand WhoGetsMyVoteUK, five coders were assigned to each party. Subse-quently, individual estimates and their justifications are fed back to the panelanonymously for a second round of coding in which panellists update theirinitial codes with the help of justifications from their fellow coders. Oncethe codes converge to a sufficient extent to be deemed consistent (demon-strated by values of the van der Eijk (2001) measure of agreement A ≥ 0.7),the median response is taken as the final estimate. In most cases (includingfor EUvox and WhoGetsMyVoteUK) only two rounds of coding are needed.The positions of all the parties with respect to each dimension is calculatedin exactly the same way as users’ positions are calculated. These positionsare then plotted on the same map as the users’ positions.
The final stage is to repeat the analysis on various different sub-samplesof users. Using the full dataset, I first sample according to age, taking onesub-sample consisting of those aged less than 40 in May 2015 (for EUvoxdata this means sampling those born in 1975 or later) and one consistingof those aged 40 or more. Next, I sample according to education. Fromthe EUvox dataset I select those who have a university education and thosewho do not, while from the WhoGetsMyVoteUK dataset (in which the sup-plementary questions are a little different), I select those who finished theireducation at age 20 and over and those who finished their education earlier.Finally, I select three subsamples from both datasets on the basis of polit-ical interest/attention paid to politics. From the EUvox dataset I identifythose who a) are “very” interested in politics, b) are “somewhat” interestedin politics, and c) have “little” or “no” interest in politics, while from theWhoGetsMyVoteUK dataset I distinguish between those who graded them-selves between 1 and 4 on a 1-10 scale in terms of attention paid to politics,from those graded 5 to 8 and finally those graded 9 or 10.
Results
As there was an emphasis on EU-related issues in EUvox, I first need to iden-tify and delete from the questionnaire any superfluous items. Three itemsare substantively very similar and are about the same issue, so to includethem all would have given too much weight to that issue. These are Item 6(on whether EU membership is a bad thing), Item 9 (on remaining withinthe EU) and Item 10 (on holding an in-out referendum on EU membership).As Item 6 is more about a judgement of the current situation than a policyand Item 10 may tap into two separate constructs (whether the EU is agood thing and whether referendums are a good thing), I drop items 6 and10 and retain Item 9. WhoGetsMyVoteUK covered a wide range of issuesand none could be seen as superfluous.
10

Analysis of the remaining items in the EUvox dataset reveals two possibledimensional structures: a one-dimensional solution and a two-dimensionalsolution. The one-dimensional solution is observed at c=0.3 (the minimumvalue of all item scalability coefficients Hj). At this point, we have onebroad Left-Right dimension that includes eighteen issues relating to Euro-pean integration (with Euro-enthusiasts on the “left” and Eurosceptics onthe “right”), the role of the state in the economy, redistribution of wealth,government spending, labour regulations, shale gas extraction, immigration,gay marriage and the influence of Islam (with anti-immigration, anti-gaymarriage and anti-Islam orientations on the “right”).
The second solution was obtained by increasing c to 0.4. At this pointeconomic issues begin to break away from the main overarching dimensionand form a dimension of their own. The economic dimension includes fouritems on the free market in healthcare, state regulation of the economy,cutting government spending and tax cuts for the rich. The remaining di-mension is a cultural dimension that includes eleven items on EU integration,immigration, gay marriage and Islam. However, substantively there is oneitem that is somewhat problematic. This is Item 5 (on redistributing wealthfrom rich to poor countries), which is substantively ambiguous as it refersto both redistribution of wealth and to EU powers. We therefore excludethis item.
To see the issue statements that belong to both solutions, see the firstfour columns of Table 1 and refer to Table 5 (in the Appendix) for thewording of each issue statement. If the item contains the suffix “ rev”,this means that agreement with the item means the user is “left” and sothe values assigned to the response categories have been reversed, makingall items “point” in a rightward direction. In Tables 1 and 2 (see below)the value of Hj is given with the number of “crit” values in parenthesesafterwards. The Hj values in parentheses are the Hj values obtained whenan item belonging to another scale is inserted into the scale. This is a checkfor ambiguous items.
Analysis of the WhoGetsMyVoteUK dataset reveals a clear two-dimen-sional solution. The dimensions identified here are very similar to the eco-nomic and cultural dimensions identified in the two-dimensional EUvox so-lution. The economic dimension includes eight items on taxing the wealthy,nationalising the railways, benefit cuts, private sector involvement in health-care, free schools, university tuition fees, extraction of shale gas and theTrident nuclear missile system, while the cultural dimension includes thir-teen items on inheritance tax, wind farms, forcing young people to work forbenefits, gay marriage, the role of Christianity, localism, EU membership,foreign aid, immigration, English votes for English laws and the EuropeanConvention for human rights. However, some of these items are substan-tively ambiguous or contradict the substantive meaning of the dimension.Thus Item 3 (on the abolition of inheritance tax) could be seen as support-
11

Table 1: Mokken Scales Identified from EUvox Dataset
Full Dataset Representative Dataset1D Solution 2D Solution 1D Solution 2D Solution
Dim 1 Dim 1 Dim 2 Dim 1Item Hj (crit) Hj (crit) Hj (crit) Hj (crit) Hj (crit) Hj (crit)
1 0.48 (32) 0.54 (0) (0.36) 0.42 (73) 0.46 (11) (0.28)2 0.39 (59) 0.46 (21) (0.29) 0.39 (40) (0.22)3 0.53 (0) 0.64 (0) (0.35) 0.51 (6) 0.58 (0) (0.26)4 rev 0.42 (59) 0.47 (53) (0.30)5 rev 0.48 (0) 0.43 (48)9 rev 0.53 (59) 0.63 (0) (0.36) 0.51 (45) 0.55 (5) (0.28)11 (0.25) 0.44 (57) (0.19) 0.39 (31)12 0.44 (6) 0.34 (44)13 0.38 (24) (0.34) 0.43 (0) (0.26) 0.38 (0)14 rev 0.45 (19) 0.40 (33)15 0.41 (25) (0.37) 0.46 (0) 0.34 (46) (0.30) 0.41 (0)16 0.33 (46)19 0.40 (37) (0.36) 0.44 (0) 0.33 (46) (0.28) 0.39 (0)20 0.35 (72)21 0.51 (2) 0.58 (0) (0.37) 0.48 (5) 0.53 (0) (0.28)25 rev 0.41 (40) 0.49 (0) (0.28) 0.36 (46) 0.41 (9) (0.21)28 0.48 (41) 0.57 (11) (0.33) 0.46 (11) 0.51 (3) (0.25)29 rev 0.50 (7) 0.56 (0) (0.35) 0.49 (26) 0.52 (1) (0.29)30 0.52 (1) 0.61 (0) (0.37) 0.52 (26) 0.57 (0) (0.29)
H 0.45 0.56 0.44 0.37 0.50 0.39
12

Table 2: Mokken Scales Identified from WhoGetsMyVoteUK Dataset
Full Dataset Representative DatasetDim 1 Dim 2 Dim 1 Dim 2
Item Hj (crit) Hj (crit) Hj (crit) Hj (crit)
2 rev 0.31 (0) (0.19) 0.34 (21) (0.20)6 rev 0.40 (0) (0.11) 0.42 (0) (0.07)7 rev 0.32 (47) (0.20) 0.34 (57) (0.19)8 rev 0.41 (0) (0.17) 0.42 (0) (0.15)14 rev (0.12) 0.30 (45) (0.10) 0.35 (49)15 (0.15) 0.39 (26) (0.14) 0.40 (22)17 (0.08) 0.41 (8) (0.06) 0.43 (33)19 rev 0.33 (0) (0.09) 0.36 (12) (0.08)20 rev 0.34 (0) (0.14) 0.36 (0) (0.13)21 rev (0.15) 0.45 (7) (0.14) 0.50 (8)22 rev (0.15) 0.46 (35) (0.14) 0.51 (34)24 (0.15) 0.51 (37) (0.14) 0.55 (53)25 (0.14) 0.49 (0) (0.14) 0.52 (28)26 (0.18) 0.48 (0) (0.17) 0.51 (10)27 (0.20) 0.35 (36) (0.22) 0.40 (40)30 (0.21) 0.46 (9) (0.21) 0.51 (6)
H 0.35 0.43 0.37 0.47
ing tradition (i.e. cultural) or as a means of allowing more wealth to betransferred between generations (economic). Similarly, Item 9 (on forcingyoung people to work for benefits) could be seen as a call for order anddiscipline (cultural) or as a means of cutting benefits (economic). Environ-mental items can also be seen as both cultural and economic; while Markset al. (2006) define green issues a defining element of their Tan/Gal culturalscale, environmental issues are seen by some through the prism of dangerousmultinationals riding roughshod over the common people (and therefore eco-nomic Left/Right). The fact that one environmental issue (fracking, Item12) forms part of the economic scale, while another (wind farms, Item 13)belongs to the cultural scale illustrates further the ambiguities involved. Fi-nally, in the economic scale there is one item that does not fit in at all withthe substantive meaning of the scale and that is item 23 (on Trident). Hav-ing removed substantively ambiguous or incongruous items (Items 3, 9, 12,13 and 23), we are left with ten items in the cultural scale and six in theeconomic scale. These scales are shown in Table 2.
After repeating the analysis on a sample of the EUvox dataset that ismade to be representative in terms of vote intention (containing 16,824 en-tries, see above), we find we have to remove a number of further items
13

from the scales. From both the overarching Left-Right scale (in the one-dimensional solution) and the cultural scale (in the two-dimensional solu-tion) we find that Item 4 now violates the monotonicity criterion, so weremove this item. We also have to remove another three items of the over-arching scale (Items 13, 16 and 20) either because the value of Hj dropsbelow 0.3 or because there is a violation of the monotonicity requirement(associated with “crit” values of greater than 80, see footnote 3). Overall,we find that values for Hj are somewhat lower than those we obtained forthe full sample and for the two-dimensional solution we need to reduce c to0.35 in order to maintain the dimensional structure intact, as keeping c at0.4 would lead to a fracturing of the dimensional structure. The outputs areprovided in the last three columns of Table 1. Finally, if we retest the scalesthat we identify from the WhoGetsMyVoteUK dataset on a sub-sample ofthis dataset that is representative in terms of vote intention (4,513 entries),we find that both scales still satisfy all criteria and do not need to be altered.
Overall, the outputs we obtain by analysing the two datasets are verysimilar, especially if we consider the two dimensional solution for the EU-vox dataset. Such a solution was also obtained for this dataset in Wheatley(2015a) and this is therefore the model we will consider in the analysis inthe rest of the paper. In both cases, the cultural dimension consists of itemsthat are strikingly similar to the above mentioned conceptualisation of thecommunitarian-cosmopolitan dimension, or what Kriesi et al. identify asthe salient political differences between “winners” and “losers” of globali-sation, given the prevalence of items that focus on differences between the“in-group” (the community) and the “out-group” (“others” such as immi-grants, outsiders, gays and the EU). Looking at the overall values of H(Loevinger’s H) for each scale, we see that the communitarian-cosmopolitanscale is strong (H ≥ 0.5) in the EUvox dataset and medium (H ≥ 0.4) in theWhoGetsMyVoteUK dataset, while the economic scale is medium in EUvoxand weak (H ≥ 0.3) in WhoGetsMyVoteUK.
Let us now move on to the second stage of the analysis and plot thepositions of party supporters and of the party as coded by experts withrespect to the two dimensions (as identified from the datasets that havebeen made representative according to vote intention). The maps, whichare shown in Figure 1, include the mean positions of party supporters (in afilled circle), the contour lines that enclose 50 percent of party supportersand the positions of the parties as coded by experts (marked by an asterisk).Turning first to the positions of party supporters, the map shown in Figure1 is virtually identical to the map shown in Wheatley (2015a) in which thedimensions were identified from the EUvox dataset using another method(factor analysis), which makes the findings appear all the more robust. Sim-ilarly Figures 1 and 2 appear to show party supporters in very similar po-sitions, although here there are one or two subtle differences. First, in theWhoGetsMyVoteUK map the position of the Green Party is rather more
14

0.0 0.2 0.4 0.6 0.8 1.0
0.0
0.2
0.4
0.6
0.8
1.0
Economic Left/Right Dimension
Com
munitarian/C
osm
opolit
an D
imensio
n
CON
LAB LD
UKIP
CONS
UKIP
(a) EUvox
0.0 0.2 0.4 0.6 0.8 1.0
0.0
0.2
0.4
0.6
0.8
1.0
Economic Left/Right Dimension
Com
munitarian/C
osm
opolit
an D
imensio
n
CON
LAB LD
UKIP
CONS
LD
UKIP
GREEN
(b) WhoGetsMyVoteUK
Figure 1: Party Maps
left-wing economically relative to the Labour Party in comparison with theEUvox positions. In Wheatley (2015a) the EUvox position of this partywas already flagged as an anomaly, given the Green Party’s strong anti-austerity rhetoric, but it was suggested that many Green party supporterswere protest voters, rather than hardcore leftists, and that this explainedthe positioning of party supporters as rather more centrist than the partyitself. In this context, the position of party supporters as mapped from theWhoGetsMyVoteUK dataset seems more coherent with the party’s overallposition and suggests that the increased publicity given to the Green Partyafter the EP elections may have provided greater clarity to voters aboutwhere this party stands.
The second—and rather more notable—discrepancy between the twomaps in Figure 1 relates to the position of UKIP supporters. In WhoGetsMy-VoteUK UKIP supporters appear further to the left economically than theydo in EUvox. A possible explanation for this is that as UKIP support de-clined after the EP elections (around the time of the EP elections UKIPsopinion poll ratings in the UK as a whole averaged close to 20 percent, whileUKIPs vote in the general elections was 12.6 percent), the more econom-ically right-wing of UKIP supporters switched to the Conservatives. Thiswould appear to be consistent with the fact that in the 2015 general electionsthe Conservatives were not badly damaged by the UKIP threat, as manypundits had predicted, while UKIP often performed rather well in Labourheartlands.
Turning now to the positions of the parties as coded by experts, aswe would expect users are rather more fickle in their responses to issuestatements than parties and this is shown by the fact that party supportersare less dispersed than are the parties themselves. After all, parties generally
15

need to take a consistent ideological position (which ordinary voters do not)and if they take a “left” position on one issue, they are also likely to take a“left” position on another, similar issue. At the same time, we see that whilethe parties themselves are only slightly more dispersed along the cultural axisthan party supporters, along the economic axis they are far more dispersed,suggesting that competition along the economic dimension is more relevantfor party elites than for voters. In both maps the position of the ConservativeParty as coded by experts is very significantly to the right along the economicaxis in comparison with the positions of Conservative supporters.
I now analyse the sub-samples of both datasets that have been selectedaccording to age, education and political interest. Here we compare mea-sures of the overall scalability coefficient (Loevinger’s H) for the differentsub-samples. The results are shown in Table 3. We see that the strength (orcoherence) of both scales declines when we move from older voters (40 yearsold or more in 2015) to younger voters (less than 40 years of age). Thistrend is observed in analysing both datasets. When we move from univer-sity educated voters to less well-educated voters, we find that the strength ofthe economic scale decreases significantly, but the coherence of the culturaldimension either remains unchanged (in the case of the EUvox dataset) oractually increases (in the case of the WhoGetsMyVoteUK dataset). Butprobably the most dramatic effects are observed when we move from vot-ers with a high interest (or attention) in politics towards less interested (orattentive) voters. Here we observe that while both scales become weakerwith decreasing interest, this decrease is far more dramatic for the economicscale in both datasets. Indeed, for the less interested (or attentive) group,the economic scale does not form a coherent scale at all in either dataset,with H<0.2, despite the fact that the cosmopolitan-communitarian scale re-mains a scale of medium strength (in the case of EUvox) or weak (in thecase of WhoGetsMyVoteUK). All in all, the analysis would suggest that theeconomic left-right scale is barely coherent as a scale amongst younger, lesswell-educated and, most importantly, less politically interested voters.
Given the dramatic changes observed when we separate our overall sam-ples into sub-samples with differing levels of political interest (or attention),it is perhaps worth checking the mean positions of party supporters wheneach group of supporters is disaggregated according to the three levels ofpolitical interest (or attention) we have identified. We would expect that, asthe dimensions become less coherent with lower political interest, the meanposition of each party’s supporters would move towards the centre and thistrend would be particularly noticeable along the economic dimension. Ifparties’ relative positions with respect to one another does not change, how-ever, this would suggest that there is little systematic bias in the positioningof the parties shown in Figure 1. If, however, some parties move faster to-wards the centre than others when we change the level of political interest,this would suggest that Figure 1 is indeed subject to a certain level of bias.
16

Table 3: Comparison of Samples
Sample H (comm.-cos.) H (econ.)
Overall (EUvox) 0.58 0.44Overall (WhoGetsMyVoteUK) 0.43 0.35Politically Representative (EUvox) 0.50 0.39Politically Representative (WhoGetsMyVoteUK) 0.47 0.37Older (EUvox) 0.60 0.50Older (WhoGetsMyVoteUK) 0.48 0.42Younger (EUvox) 0.50 0.40Younger (WhoGetsMyVoteUK) 0.42 0.33Higher education (EUvox) 0.54 0.49Higher education (WhoGetsMyVoteUK) 0.40 0.38No higher education (EUvox) 0.54 0.36No higher education (WhoGetsMyVoteUK) 0.43 0.30High political interest (EUvox) 0.64 0.59High political attention (WhoGetsMyVoteUK) 0.49 0.51Medium political interest (EUvox) 0.56 0.39Medium political attention (WhoGetsMyVoteUK) 0.41 0.28Low political interest (EUvox) 0.46 0.19Low political attention (WhoGetsMyVoteUK) 0.34 0.16
This is because our self-selected sample of VAA users is likely to be moreinterested in politics than the average voter by virtue of the fact that theyhave used an online app on politics.4 The results of this analysis are shownin Table 4.
Table 4 does suggest that there may be some bias with respect to therelative positions of party supporters. While for the economic dimension allparties tend to move strongly towards a range of 0.4-0.5 in the case of EUvoxand 0.35-0.4 in the case of WhoGetsMyVoteUK as interest decreases, thecommunitarian-cosmopolitan dimension reveals a more complex pattern ofvariation. The least politically interested amongst Labour Party support-ers are located 0.13 units more “communitarian” than their most politicallyinterested counterparts in the EUvox dataset and 0.14 more “communitar-ian” in WhoGetsMyVoteUK, while the corresponding figures for the simi-larly “communitarian” Liberal Democrats are 0.12 and 0.10, while for theGreen Party they are 0.10 and 0.12. The Conservative sub-samples vary lit-
4Indeed there is data to confirm this. For example, among EUvox respondents 33per cent claimed to be “very interested in politics”, 48 per cent “somewhat interested”,15 per cent “a little interested” and 2 per cent “not at all interested” (with a further 3per cent preferring not to say). Corresponding figures for the same question in the morerepresentative European Elections Study carried out in 2009 were 19, 36, 35 and 10 percent, respectively. Source: GESIS Data Catalogue 2.1 at dx.doi.org/doi:10.4232/1.10202,accessed 14 December 2014
17
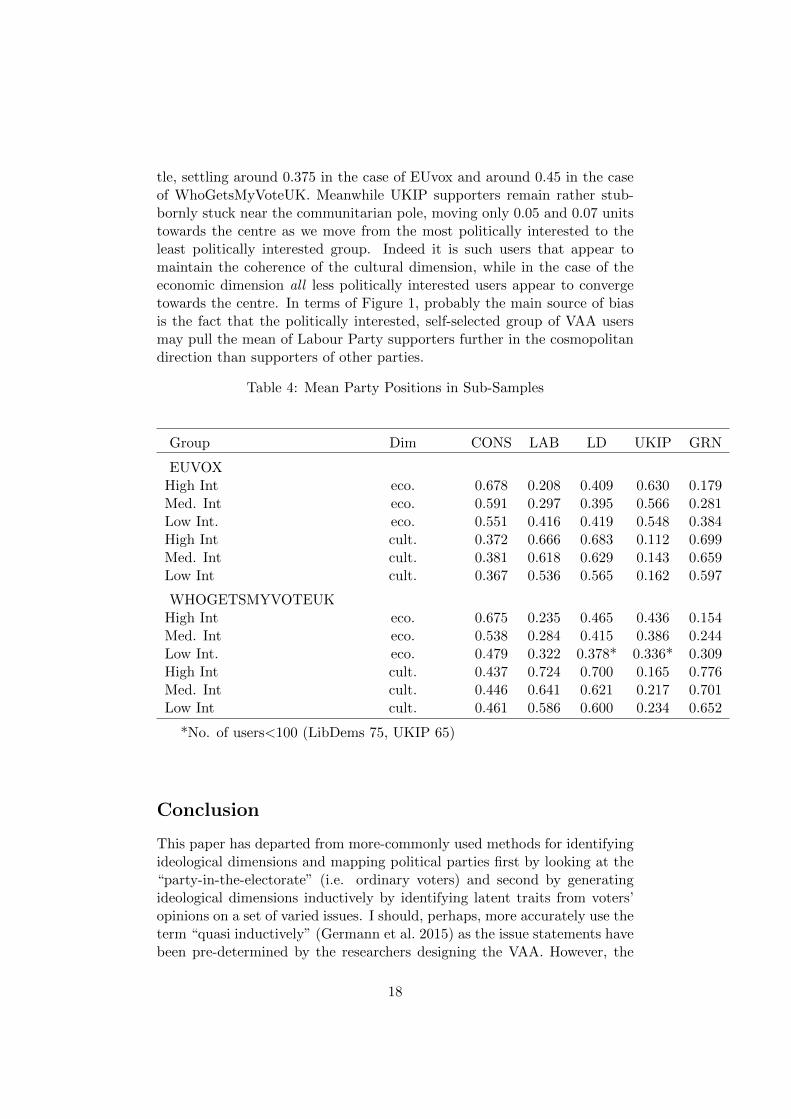
tle, settling around 0.375 in the case of EUvox and around 0.45 in the caseof WhoGetsMyVoteUK. Meanwhile UKIP supporters remain rather stub-bornly stuck near the communitarian pole, moving only 0.05 and 0.07 unitstowards the centre as we move from the most politically interested to theleast politically interested group. Indeed it is such users that appear tomaintain the coherence of the cultural dimension, while in the case of theeconomic dimension all less politically interested users appear to convergetowards the centre. In terms of Figure 1, probably the main source of biasis the fact that the politically interested, self-selected group of VAA usersmay pull the mean of Labour Party supporters further in the cosmopolitandirection than supporters of other parties.
Table 4: Mean Party Positions in Sub-Samples
Group Dim CONS LAB LD UKIP GRN
EUVOXHigh Int eco. 0.678 0.208 0.409 0.630 0.179Med. Int eco. 0.591 0.297 0.395 0.566 0.281Low Int. eco. 0.551 0.416 0.419 0.548 0.384High Int cult. 0.372 0.666 0.683 0.112 0.699Med. Int cult. 0.381 0.618 0.629 0.143 0.659Low Int cult. 0.367 0.536 0.565 0.162 0.597
WHOGETSMYVOTEUKHigh Int eco. 0.675 0.235 0.465 0.436 0.154Med. Int eco. 0.538 0.284 0.415 0.386 0.244Low Int. eco. 0.479 0.322 0.378* 0.336* 0.309High Int cult. 0.437 0.724 0.700 0.165 0.776Med. Int cult. 0.446 0.641 0.621 0.217 0.701Low Int cult. 0.461 0.586 0.600 0.234 0.652
*No. of users<100 (LibDems 75, UKIP 65)
Conclusion
This paper has departed from more-commonly used methods for identifyingideological dimensions and mapping political parties first by looking at the“party-in-the-electorate” (i.e. ordinary voters) and second by generatingideological dimensions inductively by identifying latent traits from voters’opinions on a set of varied issues. I should, perhaps, more accurately use theterm “quasi inductively” (Germann et al. 2015) as the issue statements havebeen pre-determined by the researchers designing the VAA. However, the
18

fact that very similar results are obtained from two different sets of issuesstatements—involving very different sets of issues given that the EUvoxquestionnaire was designed for the EP elections and WhoGetsMyVoteUKfor the general elections—confirms the robustness of the findings.
Analysis of both datasets suggests that two ideological dimensions defineadequately the policy space in England: one economic left-right dimensionand one cultural communitarian-cosmopolitan dimension. While they co-vary to a significant degree with economic rightists tending to be more com-munitarian and economic leftists tending to be more cosmopolitan, thesetendencies do not always hold and the two dimensions should be consideredas separate. The identification of the communitarian-cosmopolitan dimen-sion lends weight to the hypothesis of Kriesi et al. (2006) that politics isincreasingly defined by a cleavage between “winners” and “losers” of glob-alisation with “losers” tending to adopt a position of cultural demarcationand to perceive “outsiders”, such as immigrants and the EU, as a threat.
Ford and Goodwin (2014) infer that UKIP draw support from those vot-ers who feel that they have “lost” in an increasingly globalised world, or—intheir terms—have been “left behind”. As we have seen, UKIP supportersare firmly entrenched near the cosmopolitan pole of the communitarian-cosmopolitan dimension, even amongst less politically interested users. In-creasingly they tend to be drawn from the economic left as well as theeconomic right, which also supports Ford and Goodwin’s contention thatthey are often older blue-collar workers who may have voted Labour sometime in the past.
If UKIP supporters are located at the communitarian end of the commun-itarian-cosmopolitan pole, then the Green Party and the Liberal Democratslay claim to the cosmopolitan end of this spectrum, although not to suchan unambiguous degree. While Labour Party supporters also tend towardsthe cosmopolitan pole, their position shown in Figure 1 may be exaggerateddue to the selection bias that favours politically interested users.
Indeed both the Labour Party and the Conservatives occupy a ratherambiguous position with respect to the communitarian-cosmopolitan dimen-sion and this is already reflected in divisions within both parties. Withinthe Conservative Party there has recently been a degree of tension betweenmore “cosmopolitan” Tories such as George Osborne and Matthew Parrisand “communitarians” such as Tim Montgomerie and Owen Patterson andsuggestions of a split in the Cabinet over the 2017 referendum over whetherto remain within the EU may be systematic of a more fundamental split.While the Labour Party is divided between economic liberals and economicleftists, this split is compounded by a further split between the cosmopolitan“Islington Labour” of some close colleagues of former prime minister TonyBlair and the more communitarian “blue Labour” of political guru MauriceGlasman and his colleagues.
The most striking finding of all is the fact that the main variable that
19

affects the coherence of the responses to the issue statements along bothdimensions is interest in politics and this variable has significantly moreinfluence than age, education or political affiliation. Given that VAA userstend to be self-selected in terms of high political interest, this means thattreating a VAA dataset as if it were representative of the population atlarge is likely to be problematic. However, if we rather treat VAA users hasa “panel of interested citizens” then it is valid to use the data they generateto tell us about the political landscape, providing we make any selection biasexplicit. Indeed ideological positions of political parties are often identifiedfrom the opinions of political elites, who are clearly far less representativeof voters. In each case we have to be clear about the data we draw fromand about the strengths and pitfalls of each approach.
The fact that the economic dimension is far less coherent than the cul-tural communitarian-cosmopolitan dimension amongst less politically inter-ested voters is striking. This suggests that among probably a majority ofcitizens the economic dimension is not the primary axis along which theyorganise their political views, but that it is the cultural communitarian-cosmopolitan dimension that provides the guiding role. The economic axis,on the other hand, is more important for a rather narrow stratum of po-litically interested voters and political elites (as evidenced by the strongdispersion of the parties as coded by experts along the economic axis). Atthe same time, a subsection of English citizens—including those who havelittle interest in politics—remain wedded to communitarian values. These,I would suggest, are Ford and Goodwin’s “left behind voters, Kriesi et al’s“losers” of globalisation.
Bartolini and Mair (1990) hypothesise that the cleavages identified byLipset and Rokkan, or at least the party systems they generated, somehowbecame frozen in the twentieth century. This research would suggest that theopening up of a new cleavage may have “unfrozen” them with the emergenceof new “communitarian” parties such as UKIP, the Sweden Democrats andthe Finns party. It is interesting to note that further analysis from EUvoxdatasets carried out in other EU countries also shows that, in most cases, theeconomic dimension becomes far less coherent than the cultural dimensionas political interest decreases. If an economic dimension pitting Left againstRight (or labour against capital) defined the political arena in the UnitedKingdom and other European countries in the twentieth century, maybe itis a cultural cleavage that pits cosmopolitans against communitarians thatdefines politics in the twenty-first.
References
Bakker, R., De Vries, C., Edwards, E., Hooghe, L., Jolly, S., Marks, G., Polk,J., Rovny, J., Steenbergen, M. and Vachudova, M. A. (2015). Measuring
20

Party Positions in Europe: The Chapel Hill Expert Survey Trend File, 1999–2010. Party Politics, 21(1):143–152.
Bartolini, S. and Mair P. (1990). Identity, Competition, and Electoral Avail-ability: The Stability of European Electorates, 1885-1985. Cambridge: Cam-bridge University Press.
Budge, I., Klingemann, H. D., Volkens, A., Bara, J., and Tanenbaum, E.(2001). Mapping Policy Preferences, Estimates for Parties, Governmentsand Electors 1945-1998. Oxford: Oxford University Press.
Dalkey, N. and Helmer, O. (1963). An experimental application of the Delphimethod to the use of experts. Management Science, 9(3): 458–467.
Emons, W. H., Sijtsma, K. and Pedersen, S. S. (2012). Dimensionality ofthe Hospital Anxiety and Depression Scale (HADS) in Cardiac Patients.Comparison of Mokken Scale Analysis and Factor Analysis. Assessment,19(3): 337–353.
Ford, R. and Goodwin, M. J. (2014). Revolt on the Right: Explaining Sup-port for the Radical Right in Britain. Abingdon and New York: Routledge.
Gemenis, K. (2014). An Iterative Expert Survey Approach for EstimatingParties Policy Positions. Quality and Quantity, 1-16. DOI: 10.1007/s11135-014-0109-5.
Germann, M., Mendez, F., Wheatley, J., and Serdlt, U. (2015). Spatialmaps in voting advice applications: The case for dynamic scale validation.Acta Politica, 50(2): 214–238.
Germann, M., Mendez, F. (2015). Dynamic Scale Validation Reloaded.Quality and Quantity, 1-27. DOI: 10.1007/s11135-015-0186-0.
Huber, J. and Inglehart, R. (1995). Expert Interpretations of Party Spaceand Party Locations in 42 Societies. Party Politics, 1(1):73–111.
Kitschelt, H., Mansfeldova, Z., Markowski, R. and Toka, G. (1999). Post-Communist Party Systems. Competition, Representation, and Inter-PartyCooperation. Cambridge: Cambridge University Press.
Kriesi, H., Grande, E., Lachat, R., Dolezal, M., Bornschier, S., and Frey,T. (2006). Globalization and the Transformation of the National PoliticalSpace: Six European Countries Compared. European Journal of PoliticalResearch, 45(6):921–956.
Inglehart, R. (1977). The Silent Revolution (Vol. 8). Princeton: PrincetonUniversity Press.
Inglehart, R. (1990). Culture Shift in Advanced Industrial Society. Princeton:Princeton University Press.
Key V.O. (1964) Politics, Parties and Pressure Groups. New York: Crowell.
21

Kitschelt, H. (1995). Formation of Party Cleavages in Post-CommunistDemocracies: Theoretical Propositions. Party Politics, 1(4): 447–472.
Kitschelt, H. (1994). The Transformation of European Social Democracy.Cambridge: Cambridge University Press.
Lipset, S. M. (1959). Some Social Requisites of Democracy: Economic De-velopment and Political Legitimacy. American Political Science Review,53(1):69–105.
Lipset, S. M. and Rokkan, S. (1967). Cleavage Structures, Party Systems,and Voter Alignments: An introduction. In Lipset, S. M., and Rokkan, S.(Eds.). Party Systems and Voter Alignments: Cross-national Perspectives(Vol. 7). New York: Free Press, pp. 1–64.
Marks, G., Hooghe, L., Nelson, M., and Edwards, E. (2006). Party Compe-tition and European Integration in the East and West Different Structure,Same Causality. Comparative Political Studies, 39(2):155–175.
Meek, J. (2014). In Farageland. London Review of Books, 36(19):5–10.
Mokken, R. J. (1971). A Theory and Procedure of Scale Analysis: WithApplications in Political Research, (Vol. 1). Berlin: Walter de Gruyter.
Sijtsma, K. and Molenaar, I. W. (2002). Introduction to Nonparametric ItemResponse Theory. Thousand Oaks, CA: Sage.
Straat, J.H., van der Ark, L. A. and Sijtsma, K. (2013). Comparing Opti-mization Algorithms for Item Selection in Mokken Scale Analysis. Journalof Classification, 30(1): 75–99.
van der Eijk, C. (2001). Measuring Agreement in Ordered Rating Scales.Quality and Quantity, 35(3): 325–341.
van der Eijk, C., Rose, J. (2015). Risky Business: Factor Analysis of SurveyData—Assessing the Probability of Incorrect Dimensionalisation. PloS one,10(3), e0118900.
Wheatley, J. (2015) Restructuring the Policy Space in England: The End ofthe Left–Right Paradigm? British Politics, 1–18. DOI: 10.1057/bp.2015.35.
Wheatley, J. (2015) Identifying Latent Policy Dimensions from Public Opin-ion Data: An Inductive Approach. Journal of Elections, Public Opinion &Parties, 25(2):215–233.
Wheatley, J., Carman, C., Mendez, F., Mitchell, J. (2014). The Dimen-sionality of the Scottish Political Space: Results from an Experiment on the2011 Holyrood Elections. Party Politics, 20(6): 864–878.
Wheatley, J. (2012). Using VAAs to Explore the Dimensionality of the PolicySpace: Experiments from Brazil, Peru, Scotland and Cyprus. InternationalJournal of Electronic Governance 5(3-4), 318-348.
22

Appendix
Table 5: Issue Statements, EUvox
Item no. Item
1 The United Kingdom should never adopt the Euro2 A single member state should be able to block a treaty change, even if all the other members states agree to it3 The right of EU citizens to work in the United Kingdom should be restricted4 There should be a common EU foreign policy even if this limits the capacity of the United Kingdom to act independently5 The EU should redistribute resources from richer to poorer EU regions6 Overall, EU membership has been a bad thing for the United Kingdom7 EU treaties should be decided by Westminster rather than by citizens in a referendum.8 The EU should impose economic sanctions on Russia, even if this jeopardises gas supplies to EU countries9 The United Kingdom should remain within the European Union.10 The United Kingdom should hold an in or out referendum on EU membership as soon as possible.11 Free market competition makes the health care system function better12 The number of public sector employees should be reduced13 The state should intervene as little as possible in the economy14 Wealth should be redistributed from the richest people to the poorest15 Cutting government spending is a good way to solve the economic crisis16 It should be easy for companies to fire people17 External loans from institutions such as the IMF are a good solution to crisis situations.18 When a state rescues a bank it should take control over it19 The top rate of income tax should be reduced further.20 The government should go ahead with the exploitation of underground shale gas (fracking).21 Immigrants must adapt to the values and culture of the United Kingdom22 Restrictions on citizen privacy are acceptable in order to combat crime23 To maintain public order, governments should be able to restrict demonstrations24 Less serious crimes should be punished with community service, not imprisonment25 Same sex couples should enjoy the same rights as heterosexual couples to marry26 Women should be free to decide on matters of abortion27 The recreational use of cannabis should be legal28 Islam is a threat to the values of the United Kingdom29 The United Kingdom should welcome a larger number of asylum seekers from war-torn countries.30 The United Kingdom should be allowed to set quotas on the number of EU immigrants entering the country.
23

Table 6: Issue Statements, WhoGetsMyVoteUK
Item no. Item
1 Government spending should be cut further in order to balance the budget.2 A “mansion tax” should be levied on high-value residential properties.3 Inheritance tax should be abolished.4 Special concessions for pensioners (e.g. winter fuel allowance, free TV licences) should only be provided to the less well-off.5 The top rate of income tax should be reduced.6 The railways should be renationalised.7 The government should scrap what is commonly known as the bedroom tax.8 Private sector involvement in the NHS should be reduced.
9Young people out of work, education or training for six months should be made to do unpaid community work in order to getbenefits.
10 The option of imprisonment should be retained for the possession of drugs for personal consumption.
11To fight terrorism and other serious crimes, internet service providers and telecoms companies should keep and surrenderdetails of users’ activities if required by government agencies.
12 The government should allow the extraction of underground shale gas (fracking).13 The government should end subsidies for wind farms.14 Same sex and heterosexual couples should enjoy the same rights to marry.15 England should be more confident about its Christian heritage.16 The current legal entitlement of two weeks paternity leave should be increased.17 For social housing, priority should be given to people whose parents and grandparents were born locally.18 State schools should be able to select pupils according to ability.19 Free Schools and Academies should be brought back under Local Authority control.20 University tuition fees should be scrapped.21 The UK should remain within the European Union.22 The UK should maintain its support to developing countries through foreign aid.23 The Trident nuclear weapons system should be scrapped.24 The UK should be able to restrict the number of EU immigrants entering the country.25 The National Health Service should give priority to British citizens.26 State benefits should only be available to those who have lived in the UK for at least five years.27 Only English MPs should have the right to vote on issues that only affect England.28 The House of Lords should be replaced by a directly elected chamber.29 Young people should be given the right to vote at the age of 16.30 The UK should withdraw from the European Convention on Human Rights.
24