clearance concepts: fundamentals and application to
TRANSCRIPT

Chapman UniversityChapman University Digital Commons
Pharmacy Faculty Articles and Research School of Pharmacy
2018
Clearance Concepts: Fundamentals andApplication to Pharmacokinetic Behavior of DrugsReza MehvarChapman University, [email protected]
Follow this and additional works at: https://digitalcommons.chapman.edu/pharmacy_articles
Part of the Biological Factors Commons, Complex Mixtures Commons, Medicinal andPharmaceutical Chemistry Commons, Other Chemicals and Drugs Commons, Other Pharmacy andPharmaceutical Sciences Commons, Pharmaceutical Preparations Commons, and the Pharmaceuticsand Drug Design Commons
This Article is brought to you for free and open access by the School of Pharmacy at Chapman University Digital Commons. It has been accepted forinclusion in Pharmacy Faculty Articles and Research by an authorized administrator of Chapman University Digital Commons. For more information,please contact [email protected].
Recommended CitationMehvar R. Clearance concepts: Fundamentals and application to pharmacokinetic behavior of drugs. J. Pharm. Pharm. Sci.2018;21(1s):88s-102s. doi: 10.18433/jpps29896

Clearance Concepts: Fundamentals and Application to PharmacokineticBehavior of Drugs
CommentsThis article was originally published in Journal of Pharmacy and Pharmaceutical Sciences, volume 21, issue 1s, in2018. DOI:10.18433/jpps29896
CopyrightCanadian Society for Pharmaceutical Sciences
This article is available at Chapman University Digital Commons: https://digitalcommons.chapman.edu/pharmacy_articles/577

88
Clearance Concepts: Fundamentals and Application to Pharmacokinetic Behavior of Drugs
Received, April 13, 2018; Accepted, April 26, 2018; Published, May 21, 2018.
INTRODUCTION Clearance concepts were introduced into the pharmacokinetics discipline in the 1970s by Gillette (1), Rowland et al. (2), and Wilkinson and Shand (3). As elegantly described by Benet (4) in a tribute to Dr. Rowland for his contributions in this area, many experimental observations could not be explained by the prevalent pharmacokinetic theories in the late 1960s and early 1970s before the introduction of clearance concepts. In contrast to the heavy reliance on mathematical relationships for description of the pharmacokinetic behavior of drugs in pre-clearance era, the clearance concepts were based on the relationship between organ clearance and physiologic parameters, such as drug free (unbound) fraction in blood (fub), intrinsic capability of the
eliminating organ to remove the free drug from the body (Cl’int), and the organ blood flow (Q). Since the 1970s, the clearance concepts have been widely used in the literature to explain the pharmacokinetic behavior of many drugs and the effects of changes in the physiological parameters, as a result of disease states, drug-drug interactions, or age, on the blood concentration-time courses of drugs after different routes of administration. The purpose of this communication is to 1) briefly review the fundamental principles of clearance concepts and 2) _________________________________________
Corresponding Author: Reza Mehvar, Pharm.D., Ph.D., Department of Biomedical and Pharmaceutical Sciences, School of Pharmacy, Chapman University Rinker Health Science Campus, 9401 Jeronimo Road, Irvine, CA, USA; E-mail: [email protected]
J Pharm Pharm Sci (www.cspsCanada.org) 21s, 88s - 102s, 2018
Reza Mehvar Department of Biomedical and Pharmaceutical Sciences, School of Pharmacy, Chapman University, Irvine, California, USA.
ABSTRACT: Clearance concepts were introduced into the pharmacokinetics discipline in the 1970s and since then have played a major role in characterization of the pharmacokinetic behavior of drugs. These concepts are based on the relationship between organ extraction ratio or clearance and physiologic parameters such as the organ blood flow and the intrinsic capability of the eliminating organ to remove the free (unbound) drug from the body. Several theoretical models have been developed, which define these relationships and may be used to predict the effects of changes in the physiological parameters on various pharmacokinetic parameters of drugs, such as drug clearance. In this communication, the fundamentals of the two most widely used models of hepatic metabolism, namely the well-stirred (venous equilibrium) and parallel-tube (sinusoidal perfusion) models, are reviewed. Additionally, the assumptions inherent to these models and the differences between them in terms of their predictive behavior are discussed. The effects of changes in the physiologic determinants of clearance on the blood concentration-time profiles of drugs with low and high extraction ratio are also presented using numerical examples. Lastly, interesting and unusual examples from the literature are provided where these concepts have been applied beyond their widely known applications. These examples include estimation of the oral bioavailability of drugs in the absence of otherwise needed intravenous data, differentiation between the role of liver and gut in the first-pass loss of drugs, and distinction between the incomplete absorption and first-pass metabolism in the gastrointestinal tract after the oral administration of drugs. It is concluded that the clearance concepts are a powerful tool in explaining the pharmacokinetics of drugs and predicting the changes in their blood concentration-time courses when the underlying physiologic parameters are altered due to age, disease states, or drug interactions. This article is open to POST-PUBLICATION REVIEW. Registered readers (see “For Readers”) may comment by clicking on ABSTRACT on the issue’s contents page. __________________________________________________________________________________

89
to present examples of the application of clearance concepts in interpretation of pharmacokinetic behavior of drugs. FUNDAMENTAL CONCEPTS Organ Clearance The concept of organ clearance and loss of drugs across an organ of elimination have been described in detail previously (5-7). Briefly, the clearance of an eliminating organ (Cli) is the volume of blood cleared of drug by that organ per unit of time, which is defined by the following equation:
𝐶𝑙 = 𝑄 ∙ 𝐸 (1) where Ei is the organ extraction ratio or the fraction of the drug, which is eliminated by the organ during one passage, and Qi represents the blood flow to the organ. The 𝐸 value may be estimated from the steady state concentration of drug entering (Cin) and exiting (Cout) the eliminating organ, as shown in Equation 2:
𝐸 = (2)
For hepatic clearance (Clh), Equation 1 may be rewritten in terms of hepatic extraction ratio (Eh) and blood flow (Qh):
𝐶𝑙 = 𝑄 ∙ 𝐸 (3) Because the lower and upper limits of Eh are zero and 1, the Clh of drugs could potentially range from zero to Qh. Physiologic Determinants of Eh and Clh In the liver, drugs travel through the sinusoids and come in contact with the hepatocytes, which contain enzymes for drug metabolism. The drug in the sinusoids may be in two forms of protein bound and free. The extent of extraction (and clearance) of drugs depends on at least 3 factors described below. 1. Free fraction of the drug in blood (fub): It is generally assumed that only the free drug may enter the hepatocytes, where it is subject to metabolism or biliary excretion. As a general rule, the higher fub, the larger are Eh and Clh. 2. Intrinsic clearance of the free drug (Cl’int): This parameter is the intrinsic capability of the liver to remove the drug from the blood in the absence of
any flow limitations. In other words, this is the hypothetical volume of blood the liver could clear per unit of time if Qh were unlimited. As a general rule, when Cl’int increases, both Eh and Clh will increase. 3. The blood flow (Qh): Qh affects Eh and Clh differently. As the flow increases, the extraction of the drug into the hepatocytes decreases (less time for extraction). However, because Clh is a function of both Eh and Qh (Equation 3), overall, an increase in Qh results in an increase (less than proportional) in Clh. Effects of Physiologic Determinants of Eh and Clh for High and Low Eh Drugs The statements above are generally true for any drug with any Eh . However, the extent by which each of these three parameters (fub, Qh, and Cl’int) affects Eh and Clh is dependent on the initial Eh of the drug. For drugs with high metabolic capacity (such as propranolol), Cl’int may potentially be several-fold higher than the liver blood flow. Therefore, for these drugs, Clh is limited by perfusion (Qh). Because of high intrinsic metabolic capacity, these drugs have high (close to 1) extraction ratios. At the other extreme, there are drugs for which Cl’int is much less than Qh. Therefore, Clh of these drugs is limited by their Cl’int. These drugs have low Eh (close to zero). Models of Hepatic Clearance There are different models that may be used to define the relationship among physiologic parameters and hepatic extraction ratio or clearance (8-15). Two of the major models introduced in the 1970s, which are still widely used, are the well-stirred (or venous equilibrium) and parallel tube (or sinusoidal perfusion) models (8-10). These two models are graphically shown in Fig. 1. As shown in the figure, the well-stirred model assumes that the eliminating organ (liver) is a single well-stirred compartment, with the free concentration of the drug in the blood leaving the liver being in equilibrium with and equal to the free drug concentration in the liver water. The parallel-tube model assumes that the liver is composed of identical parallel tubes with even distribution of the enzymes along the length of the tube, and that the blood concentration of free drug decreases exponentially along the length of the tube (Fig. 1). For the parallel-tube model, the average concentration of the drug in the liver is estimated as the logarithmic averages of the inlet (Cin) and outlet (Cout) concentrations.
J Pharm Pharm Sci (www.cspsCanada.org) 21, 88s - 102s, 2018

In both models, the hepatic clearance (Clh) is related to the hepatic blood flow (Qh) and the extraction ratio (Eh) by Equation 3. Additionally, in both models, hepatic availability (Fh), which is
defined by the ratio, is related to Eh using the
following equation:
Fh = 1– Eh (4)
As demonstrated in Equation 4, Fh is the fraction of the drug escaping extraction by the liver. In other words, it is the fraction of the concentration entering the liver, which exits the liver intact. Well-Stirred Model For the well-stirred model, the relationships between Eh or Fh and fub, Cl’int, and Qh are defined by the following equations:
𝐸 =∙
∙ (5)
𝐹 = 1 − 𝐸 = 1 −∙
∙=
∙ (6)
Therefore, based on the well-stirred model, Clh may be defined in terms of its individual components using the following equation:
𝐶𝑙 = 𝑄 ×∙
∙ (7)
The 𝐶𝑙 parameter, which is an indication of the intrinsic capability of the liver to remove the drug from the body in the absence of any flow limitation, is related to the sum of activities of the enzymes that metabolize the drug:
𝐶𝑙 = ∑ ,
, , (8)
Figure 1. Graphical representations of the well-stirred (top) and parallel-tube (bottom) models of organ clearance. Cin and Cout represent concentration of the drug entering and leaving the liver, respectively, and the dashed lines indicate the unbound concentration of the drug in the liver along the direction of flow. Adapted from reference (8).
90
J Pharm Pharm Sci (www.cspsCanada.org) 21, 88s - 102s, 2018

In the above equation, Vmax,i, Km,i, and CL,u refer to the maximum velocity and Michaelis-Menten constant of the individual enzymes involved in the metabolism of the drug and the unbound concentration of the drug in the liver, respectively. If the drug is also subject to biliary excretion, Cl’int is the summation of both metabolic and excretory intrinsic clearances.
For simplicity, some investigators use Clint, instead of the term 𝑓 ∙ 𝐶𝑙 , in Equations 5, 6 and 7:
𝐸 = (9)
𝐹 = (10)
𝐶𝑙 = 𝑄 × (11)
The term Clint is defined as the intrinsic clearance of the total (free plus unbound) drug. Equation 9 may be rearranged to estimate Clint when the Eh and Qh values are known:
𝐶𝑙 =×
=×
(12)
For drugs with high Eh (i.e., high values of Clint
relative to Qh), Equations 9, 10, and 11 would simplify to the following equations:
𝐸 =(≪ )
≈ ≈ 1 (13)
𝐹 = (≪ )
≈ (14)
𝐶𝑙 = 𝑄 × (≪ )
≈ 𝑄 × ≈ 𝑄
(15) These approximate equations indicate that for drugs with very high Eh (close to 1), Fh is proportionally related to Qh and inversely related to 𝐶𝑙 . Additionally, the Clh of these drugs is perfusion-limited. Examples of drugs with high Eh include propranolol, verapamil, morphine, meperidine, nitroglycerine, and lidocaine.
On the other hand, for drugs with low Eh (i.e., low values of Clint relative to Qh), Eh is directly related to Clint and inversely related Qh, Fh is almost close to 1, and Clh of the drug becomes almost equal to Clint or 𝑓 ∙ 𝐶𝑙 :
𝐸 = (≪ )
≈ (16)
𝐹 = (≪ )
≈ ≈ 1 (17)
𝐶𝑙 = 𝑄 × (≪ )
≈ 𝑄 × ≈ 𝐶𝑙 ≈
𝑓 ∙ 𝐶𝑙 (18)
Examples of drugs with low Eh include warfarin, tolbutamide, diazepam, erythromycin, and theophylline. Parallel-Tube Model For the parallel-tube model, the relationships between Eh, Fh, or Clh and fub, Cl’int, and Qh are given below:
𝐸 = 1 − 𝑒∙
= 1 − 𝑒 (19)
𝐹 = 1 − 𝐸 = 𝑒∙
= 𝑒 (20)
𝐶𝑙 = 𝑄 ∙ 𝐸 = 𝑄 1 − 𝑒∙
= 𝑄 1 −
𝑒 (21)
If Equation 19 or Equation 20 for the parallel tube model is to be used for the estimation of Clint when Eh and Qh are known, this may be done by taking the natural logarithm of the exponential term:
ln(1 − 𝐸 ) = (22)
𝐶𝑙 = −𝑄 × ln(1 − 𝐸 ) = −𝑄 × ln𝐹 (23)
Similar to the well-stirred model, for drugs with
the very high or very low Eh, Equation 21 predicts that the Clh is limited by Qh or Clint (𝑓 ∙ 𝐶𝑙 ), respectively.
For both models, the above equations assume
that the permeability of the drug across the interstitial space and hepatocyte membranes is much higher than the Cl’int of the drug. Therefore, permeability is not the rate-limiting step in the elimination of the drug. However, if permeability becomes an issue, these equations need to be modified to account for the permeability parameters. Pravastatin is an
91
J Pharm Pharm Sci (www.cspsCanada.org) 21s, 88s - 102s, 2018

example of drugs with uptake permeability-limited elimination (16).
Differences between the Models in Predictions of Pharmacokinetics of Drugs Simulations have shown (8) that the two models behave relatively close to each other with regard to the effects of changes in fub and/or Cl’int (i.e., Clint). However, the major difference between the two models is with regard to their prediction of hepatic availability (Fh) based on changes in Qh for the high Eh dugs. Although the differences between the two models for the prediction of Eh even at high Eh is relatively small (30%), this translates to very large differences between the two models in prediction of Fh and oral AUC of drugs with high hepatic Eh (8). This is because at high Eh, Fh changes linearly relative to Qh for the well-stirred model as demonstrated in Equation 14 ( 𝐹 ≈ 𝑄 𝐶𝑙⁄ ). However, for the parallel-tube model, Fh changes exponentially relative to Qh, as demonstrated in Equation 20 ( 𝐹 = 𝑒 ⁄ ). Therefore, at the extreme Eh value of 0.99, the difference in prediction of Fh for the two models may be over a thousand-fold (8). Further experimental studies (9, 10) have suggested that for most drugs, such as lidocaine, the well-stirred model predicts the clearance of the drug better. Therefore, most investigators use the well-stirred model in their analysis of hepatic clearance of drugs, unless it is proven to be not applicable. However, it has recently been argued that the studies designed to distinguish between the two models are inherently biased towards the well-stirred model (17), a notion that is subject to debate (18) and outside the scope of this review. Because of the prevalence of the use of the well-stirred model in the literature, we will use this model for the remainder of our discussion and case studies presented here. The Relationship between Hepatic Availability (Fh) and Oral Bioavailability (F) Figure 2 depicts the potential barriers for an oral dose to reach systemic circulation, which may result in the loss of drugs after their oral administration (19). After the intravenous dosing, however, the drug is introduced directly into the systemic circulation. Therefore, the oral bioavailability of drugs (F), or the extent by which an oral dose enters the systemic circulation, is defined by the ratio of the blood AUCs after the oral and intravenous administration. As
𝐹 = 𝐹 × 𝐹 × 𝐹 (24)
𝐹 = 0.4 × 0.5 × 0.3 = 0.06
It should be noted that if the absorption of the drug is complete and there is no gastrointestinal metabolism (i.e., 𝐹 × 𝐹 = 1 ), the hepatic availability and oral bioavailability would be the same. In other words, the oral bioavailability of drugs cannot be more than their hepatic availability.
92
J Pharm Pharm Sci (www.cspsCanada.org) 21, 88s - 102s, 2018
demonstrated in Fig. 2, after oral administration, the drug is absorbed from the gastrointestinal tract and passes through the liver before reaching the systemic circulation. This means the orally-administered drug entering the systemic circulation has to pass through the liver first (“first-pass effect”). This is different from the intravenous administration, where the drug is directly introduced into the systemic circulation without passing through the liver first (Fig. 2). Obviously, in both cases (intravenous and oral), after reaching the systemic circulation, a fraction of the drug will be passing through different organs, including the liver, with each circulation. However, the oral drug has one extra “pass” through the liver during the absorption process. Therefore, the oral bioavailability of drugs (F) is influenced by their hepatic availability (Fh). In addition to Fh, F is also affected by the loss of drug during the absorption process such as incomplete absorption and/or metabolism/degradation in the gastrointestinal tract (Fig. 2). To clarify this, consider an example where 200 mg of a drug is administered orally to a patient. Assume only 40% of the dose is absorbed orally (fraction of the dose absorbed or Fab of 0.4), which means only 80 mg reaches the enterocytes. If the drug is subject to metabolism in the gut, resulting in 50% of the drug escaping metabolism in the enterocytes (Fg of 0.5), only 40 mg of the drug reaches the liver. Assuming a hepatic Eh of 0.7 (Fh or hepatic availability of 0.3), 30% of the drug reaching the liver will pass intact into the systemic circulation (0.3 x 40 mg or 12 mg). This means that out of the 200-mg oral dose, only 12 mg reaches the systemic circulation. Therefore, the oral bioavailability of this drug (relative to intravenous administration), which may be estimated experimentally by the oral AUC: intravenous AUC ratio, is only 0.06 or 6% (12/200). The following equation describes the relationship among F, Fab, Fg, and Fh:

Figure 2. Barriers to drug entry into the systemic circulation after oral administration of drugs. For comparison, direct introduction of the drug into the systemic circulation after intravenous administration is also shown. Abbreviations: Fab, fraction of the dose absorbed; Fg, fraction of the dose escaping gut metabolism; Fh, fraction of the dose escaping liver metabolism; Eg, gut extraction ratio; Eh, liver extraction ratio. Adapted from reference (19). Effects of Qh, fub, and Cl’int on the Blood Concentration-Time Courses of Low and High Eh Drugs After intravenous dosing, the only pharmacokinetic parameter that affects the AUC of a drug is its systemic Cl. However, after oral dosing, the AUC is dependent on both the systemic Cl and oral availability (F), both of which are subject to change if fub, Cl’int, and/or Qh is changed. Here, we examine the effects of a change in the determinants of Clh of drugs on their blood concentration-time profiles for the low and high Eh drugs. For simplicity, we assume that the drug is eliminated by hepatic metabolism only, which means the systemic Cl is equal to Clh. Additionally, we assume that the oral absorption of the drug is complete with no metabolism in the gut, which means the oral availability of the drug (F) is equal to its hepatic availability (Fh). Low Extraction Ratio Drugs The characteristics of a hypothetical drug with a very low Eh value of 0.0011 under normal conditions and when the Clint (Cl’int or fub) or Qh values are increased by a factor of 2 are listed in Table 1. Additionally, the corresponding blood concentration-time courses of the drug are presented in Fig. 3. After selection of Cl’int and fub values for this drug to generate a low Clint value (0.1 L/h) relative to the hepatic blood flow (90 L/h), the Eh, Fh, and Clh are calculated using Equations 9, 4, and 3, respectively. As stated above, for a low Eh drug, Clh is expected to be close to Clint or 𝑓 ∙ 𝐶𝑙 . This is also shown in Table 1 for Control subjects, where the Clint and Clh values are almost identical for this
hypothetical drug. Additionally, Fh for this drug is very high (almost 1) (Table 1). Assuming a volume of distribution of 5 L, the half-life of the drug is 35 h in Control subjects (Table 1). As demonstrated in Table 1, the changes in either Cl’int or fub would produce the same net effect on the other kinetic parameters of the drug because they are both reflected in the Clint value. A two-fold increase in Cl’int or fub results in a two-fold increase in Clint, Eh, and Clh for this low Eh drug (Table 1). Additionally, a two-fold increase in Clh also results in a two-fold decrease in the half-life of the drug (Table 1). However, the Fh value of the drug remains close to 1, regardless of the changes in fub or Cl’int (Table 1). As demonstrated in Figs. 3A and 3B, a two-fold increase in Clint for a low Eh drug results in an almost two-fold increase in its Cl, which is demonstrated by a corresponding two-fold decrease in the AUC and half-life after both intravenous and oral dosing. An example of such change is the effects of co-administration of warfarin, a low Eh drug, with rifampin, which induces the metabolism of warfarin (higher Cl’int), resulting in a higher clearance, lower AUC, and a shorter half-life (20).
As for Qh, neither intravenous nor oral profile of a low Eh drug is affected by a change in Qh (Figs. 3C and 3D). Although a two-fold increase in Qh results in a two-fold decrease in Eh, the Clh value remains unchanged because the decrease in Eh is compensated by a corresponding increase in Qh (Table 1). This is consistent with the notion that the Cl of a low Eh drugs is mostly dependent on fub and Cl’int (Equation 18). Additionally, Fh of the drug is very high regardless of the change in Qh (Table 1).
93
J Pharm Pharm Sci (www.cspsCanada.org) 21, 88s - 102s, 2018

Figure 3. Effects of a two-fold increase in Clint (fub or Cl’int) (top panels) or Qh (bottom panels) on the blood concentration-time courses of a hypothetical low Eh drug after intravenous (left) or oral (right) administration of a 50-mg dose of the drug. The kinetic parameters are listed in Table 1. Table 1. The pharmacokinetic parameters of a hypothetical drug a with low hepatic extraction ratio (Eh) in the absence (Control) and presence of changes in the intrinsic capability of the liver to remove the free drug (Cl’int), free drug fraction in blood (fub), or hepatic blood flow (Qh).
Condition Cl’int (L/h)
fub Clint (L/h)
Qh (L/h)
Ehb Fh
b Clhb
(L/h) V
(L) t1/2
c (h)
Control 10 0.01 0.10 90 0.00111 0.999 0.0999 5 34.7 Cl’int x 2 20 0.01 0.20 90 0.00222 0.998 0.200 5 17.4 fub x 2 10 0.02 0.20 90 0.00222 0.998 0.200 5 17.4 Qh x 2 10 0.01 0.10 180 0.000555 0.999 0.0999 5 34.7
a The hypothetical drug has a Cl’int of 10 L/h, a fub of 0.01, and a volume of distribution (V) of 5 L under baseline conditions, with elimination through the liver only. b Eh, Fh, and Clh were estimated from the values of Cl’int, fub, and Qh using Equations 9, 4, and 3, respectively. c Half-life (t1/2) is estimated from 𝑡 / =
. ×, where Cl is assumed to be equal to Clh.
0 20 40 601
10
Time (Hours)
Co
nc
en
tra
tion
(mg
/L)
Low E-Control
Increased Clint
0 20 40 601
10
Time (Hours)
Co
nc
en
tra
tio
n (m
g/L
)
Low E-Control
Increased Qh
0 20 40 601
10
Time (Hours)
Co
nc
en
tra
tion
(mg
/L)
Low E-Control
Increased Clint
0 20 40 601
10
Time (Hours)
Co
nc
en
tra
tion
(mg
/L)
Low E-Control
Increased Qh
(A) (B)
(C) (D)
94
J Pharm Pharm Sci (www.cspsCanada.org) 21, 88s - 102s, 2018

High Extraction Ratio Drugs The pharmacokinetic characteristics of a high Eh drug in the absence (Control) or presence of changes in Cl’int, fub, or Qh are listed in Table 2. Additionally, the corresponding blood concentration-time courses are shown in Fig. 4. The Clint of the drug in Control subjects (1500 L/h) is much more than the Qh of 90 L/h, hence a high Eh of 0.943 (Table 2). As expected, the drug has a very low Fh value of 0.0566. Additionally, assuming a V of 400 L, the drug has a half-life of 3.26 h (Table 2). In contrast to the low Eh drug (Table 1), doubling the Clint by doubling either fub or Cl’int does not substantially affect the Eh, Clh, or half-life of this high Eh drug (Table 2). The lack of changes in the Clh of this high Eh drug after doubling Clint is predictable because the Clh of these drugs are mostly perfusion limited. However, the hepatic availability (and oral bioavailability) of the drug is reduced by almost 50% when Clint is increased by a factor of 2 (Table 2). This is because after oral dosing, the Fh of the high Eh drugs is almost linearly (inversely) related to their Clint (Equation 14). Consequently, whereas the blood concentration-time courses of the high Eh drug after the intravenous administration are insensitive to changes in Clint (no change in Cl) (Fig. 4A), the Fh, blood concentrations, and AUC of the drug after the oral administration are reduced by an almost 50% in the presence of a two-fold increase in Clint (Fig. 4B).
The above discussion clearly shows that the disease states and/or drug interactions that affect Cl’int and/or fub would be reflected in the blood concentration-time courses of high Eh drugs only after the oral dosing, but not after the intravenous administration (Figs. 4A and 4B).
An example of such effect is the interaction between the enzyme inducer pentobarbital and the high Eh drug alprenolol reported by Alvan et al. (21).
In that study, a single dose of alprenolol was administered intravenously or orally before and after 10-14 daily doses of pentobarbital. Whereas pentobarbital reduced the AUC of the orally-administered alprenolol by more than 75% without affecting the alprenolol’s half-life, it did not significantly affect the AUC or half-life of the drug after its intravenous administration.
As for Qh, in contrast to the low Eh drugs, the pharmacokinetics of high Eh drugs are affected by changes in this parameter after both intravenous and oral administration. As shown in Table 2, doubling Qh hardly affects the Eh value but almost doubles the Fh and Clh of the drug. Therefore, the blood concentration-time course of the drug after the intravenous administration shows a 50% reduction in the AUC and half-life (Fig. 4C). The oral profile would be affected by changes in both Cl and Fh (Fig. 4D). After oral dosing, an increase in Cl due to an increase in Qh causes a proportional reduction in AUC and shortening of half-life. However, an increase in Qh also proportionally increases Fh (𝐹 ≈
) and AUC. Therefore, as demonstrated in Fig.
4D, the AUC after oral dosing remains the same. Please note that the above discussions are based on the well-stirred model, which predicts that oral AUC is not dependent on Qh for drugs that are eliminated by hepatic metabolism:
𝐴𝑈𝐶 =∙
(25)
In the above equation, an increase in Qh causes proportional increases in both Cl and F, without any significant changes in the AUC for a drug with high Eh.
Table 2. The pharmacokinetic parameters of a hypothetical druga with high hepatic extraction ratio (Eh) in the absence (Control) and presence of changes in the intrinsic capability of the liver to remove the free drug (Cl’int), free drug fraction in blood (fub), or hepatic blood flow (Qh)
Condition Cl’int (L/h)
fub Clint (L/h) Qh (L/h)
Ehb Fh
b Clhb
(L/h) V
(L) t1/2
c (h)
Control 15000 0.1 1500 90 0.943 0.0566 84.9 400 3.26 Cl’int x 2 30000 0.1 3000 90 0.971 0.0291 87.4 400 3.17 fub x 2 15000 0.2 3000 90 0.971 0.0291 87.4 400 3.17 Qh x 2 15000 0.1 1500 180 0.893 0.107 161 400 1.72
a The hypothetical drug has a Cl’int of 15000 L/h, a fub of 0.1, and a volume of distribution (V) of 400 L under baseline conditions, with elimination through the liver only. b Eh, Fh, and Clh were estimated from the values of Cl’int, fub, and Qh using Equations 9, 4, and 3, respectively. c Half-life (t1/2) is estimated from 𝑡 / =
. ×, where Cl is assumed to be equal to Clh.
95
J Pharm Pharm Sci (www.cspsCanada.org) 21, 88s - 102s, 2018

Figure 4. Effects of a two-fold increase in Clint (fub or Cl’int) (top panels) or Qh (bottom panels) on the blood concentration-time courses of a hypothetical high Eh drug after intravenous (left) or oral (right) administration of a 400-mg dose of the drug. The kinetic parameters are listed in Table 2. An example of the effects of changes in the blood flow on the pharmacokinetics in the literature is related to the interaction of lidocaine, a high Eh drug, with metoprolol and propranolol, which reduce the cardiac output and hepatic blood flow (22). Lidocaine was administered by a short intravenous infusion alone or 1 day after pretreatment with metoprolol (50 mg orally every 6 h) or propranolol (40 mg orally every 6 h). Metoprolol and propranolol reduced the clearance of intravenous lidocaine by 30% and 50% respectively, presumably due to their effects on the hepatic blood flow.
It should be noted that the changes in the clearance, in addition to affecting the half-life of the drug, also affects the maximum plasma concentration (Cmax) and the time to reach Cmax for orally-administered drug. Oral Clearance and Intrinsic Clearance The well-stirred model predicts that the oral clearance (Clo or Cl/F) of a drug with hepatic elimination alone and no loss in the gastrointestinal tract (F = Fh) is in fact equal to its Clint (𝑓 ∙ 𝐶𝑙 ), therefore, being independent of Qh regardless of drug’s Eh:
0 4 8 120.01
0.1
1
Time (Hours)
Co
nc
en
tra
tion
(mg
/L)
High E-Control
Increased Clint
0 4 8 120.01
0.1
1
Time (Hours)
Co
nc
en
tra
tio
n (m
g/L
)
High E-Control
Increased Qh
0 4 8 120.001
0.01
0.1
Time (Hours)
Co
nc
en
tra
tion
(m
g/L
)
High E-Control
Increased Clint
0 4 8 120.001
0.01
0.1
Time (Hours)
Co
nc
en
tra
tio
n (m
g/L
)
High E-Control
Increased Qh
(A) (B)
(C) (D)
96
J Pharm Pharm Sci (www.cspsCanada.org) 21, 88s - 102s, 2018

𝐶𝑙 = = =×
=×
=
𝐶𝑙 = 𝑓 ∙ 𝐶𝑙 (26)
Consequently, it is not surprising that the oral AUC is not affected by Qh, as shown in Figs. 3D and 4D for the low and high Eh drugs, respectively. Even if the Fab and/or Fg values are significantly lower than 1, Clo is still a function of Clint (and not Qh) as shown below:
𝐶𝑙 = = =×
× ×=
×
× ×=
× (27)
EXAMPLES OF APPLICATION OF CLEARNCE CONCEPTS IN INTERPRETATION OF PHARMACOKINETIC BEHAVIOR OF DRUGS Estimation of Hepatic Extraction Ratio of Drugs from In Vivo Pharmacokinetic Data Equation 3 may be rearranged to estimate Eh of a drug after its intravenous administration:
𝐸 = (28)
After intravenous administration of the drug, the systemic Cl is estimated from the blood concentration-time data, and an estimate of Clh is obtained by either assuming Clh is equal to systemic clearance (i.e., for drugs with hepatic elimination only) or by subtracting renal Cl from the systemic clearance (i.e., for drugs with both renal and hepatic elimination), as discussed in detail recently (23). An estimate of Eh is then obtained using the calculated Clh and an average Qh. The estimates of Eh value can then be used to predict the pharmacokinetics and blood concentration-time profiles of the drug in the presence of changes in the physiologic determinants of clearance such as organ blood flow, intrinsic clearance, or fub. The assumptions inherent to this type of calculation and the ramifications of using plasma or serum concentrations, instead of blood concentrations, and/or liver plasma flow, instead of liver blood flow, were recently discussed in detail (23). Briefly, it was shown that if plasma clearance and hepatic blood flow are used, the estimated Eh
would be accurate only if the blood: plasma concentration (B:P) ratio of the drug is equal to 1. However, the use of the plasma concentrations and plasma liver flow will always result in an overestimation of the true Eh unless the drug does not penetrate the red blood cells (23). Prediction of Oral Bioavailability from Oral Data Only In some cases, administration of a drug by intravenous method is not feasible or an injectable dosage form is not available. Using the clearance concepts, and some assumptions, it is possible to obtain a rough estimate of the extent of oral bioavailability of drugs using oral data only. We reported (24) the oral clearance (Clo) of tetrabenazine, a drug used for the control of movement disorders, in four patients with tardive dyskinesia. The Clo values were estimated by dividing the oral dose by the AUC. We then used the following equation, which is based on Equations 10 and 26 to estimate Fh in these patients, assuming a hepatic blood flow of 1.28 (L/h)/kg and complete oral absorption and intestinal availability (i.e., 𝐹 =𝐹 ):
𝐹 = 𝐹 = = (29)
The estimated F values were 0.05, 0.08, 0.07,
and 0.02 for patients with Clo values of 431, 252, 299, and 1090 (ml/min)/kg, respectively (24). Based on these values, we suggested that the oral bioavailability (F) of tetrabenazine in humans is very low. Indeed, the F value obtained in another study (25) after the intravenous and oral administration of the drug to humans (0.05) was very close to the values obtained from the oral data alone.
It should be noted that these calculations assume elimination by the liver alone (i.e., no renal or gastrointestinal clearance). However, a modified version of Equation 29 may be provided for drugs with both renal and hepatic clearance pathways, as shown below:
𝐶𝑙 = = =×
=
×( )= (30)
𝐶𝑙 × 𝐹 = 𝐶𝑙 + 𝑄 − 𝑄 𝐹 (31)
𝐹 (𝐶𝑙 + 𝑄 ) = 𝐶𝑙 + 𝑄 (32)
97
J Pharm Pharm Sci (www.cspsCanada.org) 21, 88s - 102s, 2018
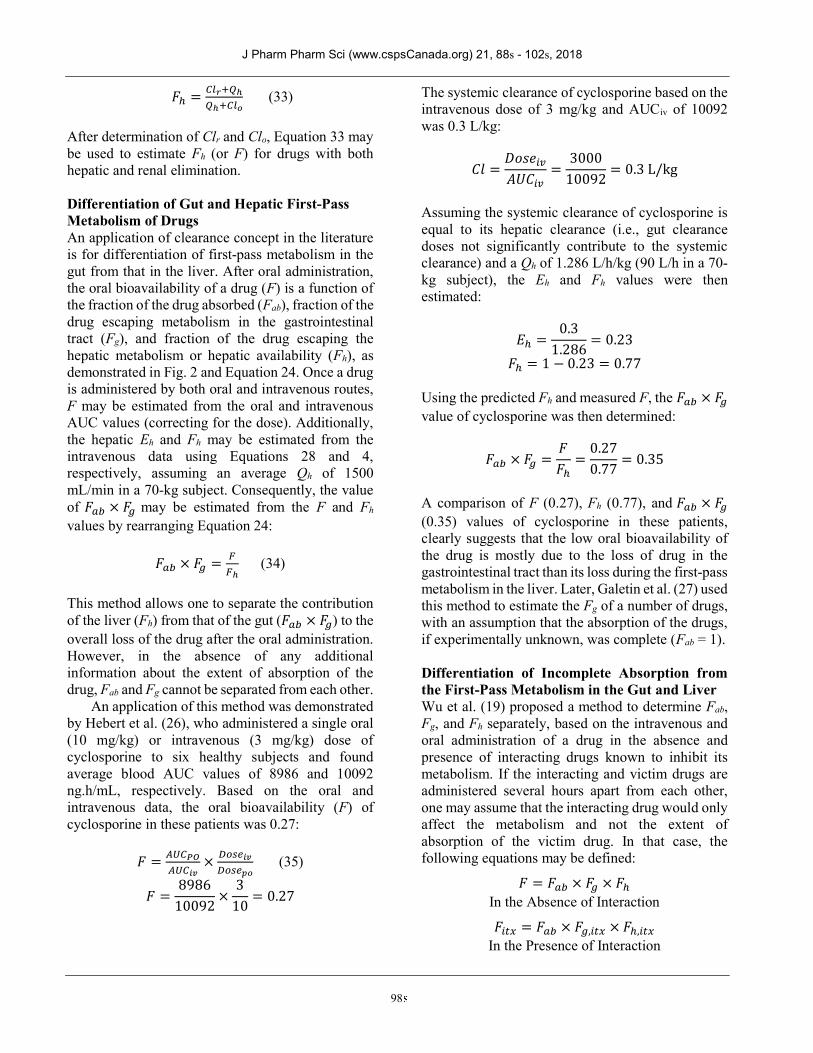
𝐹 = (33)
After determination of Clr and Clo, Equation 33 may be used to estimate Fh (or F) for drugs with both hepatic and renal elimination. Differentiation of Gut and Hepatic First-Pass Metabolism of Drugs An application of clearance concept in the literature is for differentiation of first-pass metabolism in the gut from that in the liver. After oral administration, the oral bioavailability of a drug (F) is a function of the fraction of the drug absorbed (Fab), fraction of the drug escaping metabolism in the gastrointestinal tract (Fg), and fraction of the drug escaping the hepatic metabolism or hepatic availability (Fh), as demonstrated in Fig. 2 and Equation 24. Once a drug is administered by both oral and intravenous routes, F may be estimated from the oral and intravenous AUC values (correcting for the dose). Additionally, the hepatic Eh and Fh may be estimated from the intravenous data using Equations 28 and 4, respectively, assuming an average Qh of 1500 mL/min in a 70-kg subject. Consequently, the value of 𝐹 × 𝐹 may be estimated from the F and Fh values by rearranging Equation 24:
𝐹 × 𝐹 = (34)
This method allows one to separate the contribution of the liver (Fh) from that of the gut (𝐹 × 𝐹 ) to the overall loss of the drug after the oral administration. However, in the absence of any additional information about the extent of absorption of the drug, Fab and Fg cannot be separated from each other.
An application of this method was demonstrated by Hebert et al. (26), who administered a single oral (10 mg/kg) or intravenous (3 mg/kg) dose of cyclosporine to six healthy subjects and found average blood AUC values of 8986 and 10092 ng.h/mL, respectively. Based on the oral and intravenous data, the oral bioavailability (F) of cyclosporine in these patients was 0.27:
𝐹 = × (35)
𝐹 =8986
10092×
3
10= 0.27
The systemic clearance of cyclosporine based on the intravenous dose of 3 mg/kg and AUCiv of 10092 was 0.3 L/kg:
𝐶𝑙 =𝐷𝑜𝑠𝑒
𝐴𝑈𝐶=
3000
10092= 0.3 L/kg
Assuming the systemic clearance of cyclosporine is equal to its hepatic clearance (i.e., gut clearance doses not significantly contribute to the systemic clearance) and a Qh of 1.286 L/h/kg (90 L/h in a 70-kg subject), the Eh and Fh values were then estimated:
𝐸 =0.3
1.286= 0.23
𝐹 = 1 − 0.23 = 0.77 Using the predicted Fh and measured F, the 𝐹 × 𝐹 value of cyclosporine was then determined:
𝐹 × 𝐹 =𝐹
𝐹=
0.27
0.77= 0.35
A comparison of F (0.27), Fh (0.77), and 𝐹 × 𝐹 (0.35) values of cyclosporine in these patients, clearly suggests that the low oral bioavailability of the drug is mostly due to the loss of drug in the gastrointestinal tract than its loss during the first-pass metabolism in the liver. Later, Galetin et al. (27) used this method to estimate the Fg of a number of drugs, with an assumption that the absorption of the drugs, if experimentally unknown, was complete (Fab = 1). Differentiation of Incomplete Absorption from the First-Pass Metabolism in the Gut and Liver Wu et al. (19) proposed a method to determine Fab, Fg, and Fh separately, based on the intravenous and oral administration of a drug in the absence and presence of interacting drugs known to inhibit its metabolism. If the interacting and victim drugs are administered several hours apart from each other, one may assume that the interacting drug would only affect the metabolism and not the extent of absorption of the victim drug. In that case, the following equations may be defined:
𝐹 = 𝐹 × 𝐹 × 𝐹 In the Absence of Interaction
𝐹 = 𝐹 × 𝐹 , × 𝐹 , In the Presence of Interaction
98
J Pharm Pharm Sci (www.cspsCanada.org) 21, 88s - 102s, 2018

where the subscript itx indicates the parameter in the presence of the interacting drug. The values of 𝐹 × 𝐹 or 𝐹 × 𝐹 , may be easily estimated from F and Fh or Fitx and Fh,itx, respectively, using Equation 34.
In the case of an enzyme inhibitor interaction, the value of Fab may be estimated between its two minimum and maximum boundaries. The maximum boundary of Fab is 1. The minimum boundary of Fab is assuming Fg,itx is equal to 1 (i.e., complete inhibition of gut metabolism). Setting Fab to its maximum (i.e., 1) or minimum (calculated from the enzyme inhibition data) boundaries, the values of Fg in control subjects (i.e., the absence of drug interaction) may be estimated between a minimum and a maximum.
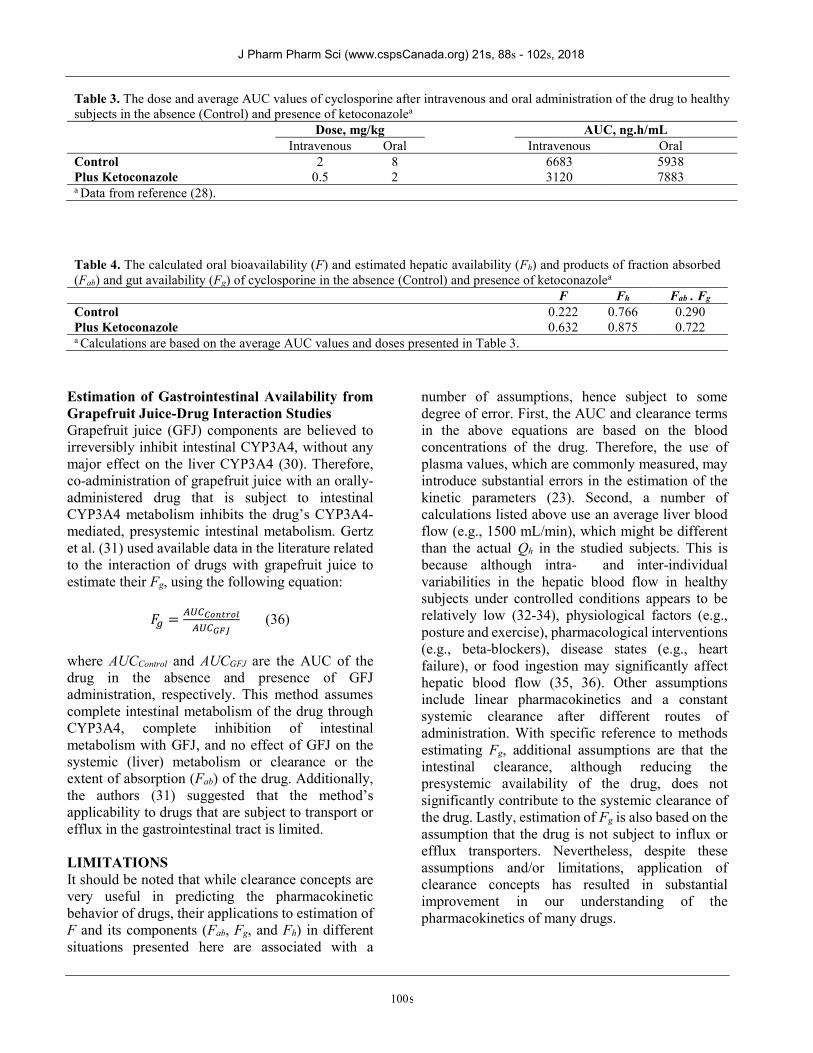
The method was used to determine the contribution of hepatic and gastrointestinal first-pass metabolism to the overall F of cyclosporine in the presence and absence of two enzyme inhibitors (erythromycin and ketoconazole) and an enzyme inducer (rifampin) (19). Here, we present the data (28) and calculations (19) for the ketoconazole inhibition study, which was conducted in five healthy subjects. The doses and average blood AUC values after the oral and intravenous administration of cyclosporine in the absence (Control) and presence of ketoconazole are listed in Table 3 (28).
Using the average values presented in Table 3, The F, Fh, and 𝐹 × 𝐹 values in Control subjects may be estimated as shown below:
𝐹 =𝐴𝑈𝐶
𝐴𝑈𝐶×
𝐷𝑜𝑠𝑒
𝐷𝑜𝑠𝑒=
5938
6683×
0.5
2= 0.222
𝐶𝑙 =𝐷𝑜𝑠𝑒
𝐴𝑈𝐶=
2000
6683= 0.299 𝐿/ℎ/𝑘𝑔
𝐹 = 1 − 𝐸 = 1 −𝐶𝑙
𝑄= 1 −
0.299
1.28= 1 − 0.234
= 0.766
𝐹 × 𝐹 =𝐹
𝐹=
0.222
0.766= 0.290
Similarly, Fitx, Fh,itx, and 𝐹 × 𝐹 , in the presence of ketoconazole may be calculated using the respective data in Table 3. The summary of the above calculations, based on the average AUC value reported before (28), are presented in Table 4.
The data in the presence of ketoconazole, presented in Table 4, suggest that two boundaries of Fab are 1 and 0.722. Consequently, Fg may be estimated at these two boundaries:
𝐹 × 𝐹 = 0.290
𝐹 =0.290
𝐹
𝐹 =0.290
1= 0.290
𝐹 =0.290
0.722= 0.402
Therefore, the lower ( 𝐹 ) and upper (𝐹 ) limits of Fg for cyclosporine in healthy volunteers are 0.290 and 0.402, whereas the lower and upper limits of Fab are 0.722 and 1, respectively. Considering an Fh of 0.766 (Table 4), the data suggest that the low oral bioavailability of cyclosporine in Control subjects (0.222) is indeed mostly due to its first-pass metabolism in the gut (Fg of 0.290-0.402), whereas the oral absorption of the formulation is relatively high (Fab of 0.722-1.0). Again, these calculations assume that gut clearance, although reducing the presystemic availability of the drug, does not significantly contribute to the systemic clearance of the drug, meaning that Cl is equal to Clh.
More recently, Hisaka et al. (29) developed a new method based on the concept of drug-drug interactions to estimate Fg values from the changes in the AUC and half-life values of the victim drug in the presence of the perpetrating drug. The method is based on the idea that the inhibition of intestinal metabolism causes a change in the AUC without any changes in the plasma half-life. However, inhibition of hepatic metabolism results in changes in both half-life and AUC, unless the clearance of the drug is flow-limited (i.e., drugs with high extraction ratio). Nevertheless, the method still requires an approximation of Fab value. Using this method, the authors estimated Fg values of 0.56 ± 0.29 (mean ± SD) for 20 drugs that were CYP3A substrates and 0.86 ± 0.11 for 8 drugs that were not CYP3A substrates. The interested readers are referred to the original article (29) for details about the method and derivation of equations.
99
J Pharm Pharm Sci (www.cspsCanada.org) 21, 88s - 102s, 2018
Estimation of Gastrointestinal Availability from Grapefruit Juice-Drug Interaction Studies Grapefruit juice (GFJ) components are believed to irreversibly inhibit intestinal CYP3A4, without any major effect on the liver CYP3A4 (30). Therefore, co-administration of grapefruit juice with an orally-administered drug that is subject to intestinal CYP3A4 metabolism inhibits the drug’s CYP3A4-mediated, presystemic intestinal metabolism. Gertz et al. (31) used available data in the literature related to the interaction of drugs with grapefruit juice to estimate their Fg, using the following equation:
𝐹 = (36)
where AUCControl and AUCGFJ are the AUC of the drug in the absence and presence of GFJ administration, respectively. This method assumes complete intestinal metabolism of the drug through CYP3A4, complete inhibition of intestinal metabolism with GFJ, and no effect of GFJ on the systemic (liver) metabolism or clearance or the extent of absorption (Fab) of the drug. Additionally, the authors (31) suggested that the method’s applicability to drugs that are subject to transport or efflux in the gastrointestinal tract is limited. LIMITATIONS It should be noted that while clearance concepts are very useful in predicting the pharmacokinetic behavior of drugs, their applications to estimation of F and its components (Fab, Fg, and Fh) in different situations presented here are associated with a
number of assumptions, hence subject to some degree of error. First, the AUC and clearance terms in the above equations are based on the blood concentrations of the drug. Therefore, the use of plasma values, which are commonly measured, may introduce substantial errors in the estimation of the kinetic parameters (23). Second, a number of calculations listed above use an average liver blood flow (e.g., 1500 mL/min), which might be different than the actual Qh in the studied subjects. This is because although intra- and inter-individual variabilities in the hepatic blood flow in healthy subjects under controlled conditions appears to be relatively low (32-34), physiological factors (e.g., posture and exercise), pharmacological interventions (e.g., beta-blockers), disease states (e.g., heart failure), or food ingestion may significantly affect hepatic blood flow (35, 36). Other assumptions include linear pharmacokinetics and a constant systemic clearance after different routes of administration. With specific reference to methods estimating Fg, additional assumptions are that the intestinal clearance, although reducing the presystemic availability of the drug, does not significantly contribute to the systemic clearance of the drug. Lastly, estimation of Fg is also based on the assumption that the drug is not subject to influx or efflux transporters. Nevertheless, despite these assumptions and/or limitations, application of clearance concepts has resulted in substantial improvement in our understanding of the pharmacokinetics of many drugs.
Table 3. The dose and average AUC values of cyclosporine after intravenous and oral administration of the drug to healthy subjects in the absence (Control) and presence of ketoconazolea Dose, mg/kg AUC, ng.h/mL Intravenous Oral Intravenous Oral Control 2 8 6683 5938 Plus Ketoconazole 0.5 2 3120 7883 a Data from reference (28).
Table 4. The calculated oral bioavailability (F) and estimated hepatic availability (Fh) and products of fraction absorbed (Fab) and gut availability (Fg) of cyclosporine in the absence (Control) and presence of ketoconazolea
F Fh Fab . Fg Control 0.222 0.766 0.290 Plus Ketoconazole 0.632 0.875 0.722 a Calculations are based on the average AUC values and doses presented in Table 3.
100
J Pharm Pharm Sci (www.cspsCanada.org) 21s, 88s - 102s, 2018

CONCLUSIONS In conclusion, development of clearance concepts has significantly moved the discipline of pharmacokinetics forward. Although clearance concepts are more discussed in terms of hepatic clearance, they are equally applicable to clearance by other eliminating organs, such as the kidneys. The concepts allow definition of organ and total clearance values in terms of physiologic parameters such as organ blood flow and intrinsic capability of the eliminating organ to remove the drug from the body. Furthermore, the clearance concepts allow prediction of the pharmacokinetics of drugs after intra- and extravascular routes in the presence of disease states, drug interactions, or as a result of patients’ age. Researchers have applied these concepts to predict the oral bioavailability of drugs in the absence of otherwise needed intravenous data, to distinguish between the role of liver and gut in the first pass metabolism of drugs, and to differentiate between the incomplete oral absorption and metabolism in the gut after oral administration of drugs. More than 45 years after their introduction, clearance concepts remain a powerful tool in explaining the pharmacokinetics of drugs and predicting the changes in the blood concentration-time course of drugs when the underlying physiologic parameters are altered. REFERENCES 1. Gillette JR. Factors affecting drug metabolism. Ann
N Y Acad Sci. 1971;179:43-66. 2. Rowland M, Benet, L.Z., Grahm, G.G. Clearance
concepts in pharmacokinetics. J Pharmacokinet Biopharm. 1973;1:123-36.
3. Wilkinson G, Shand D. A physiological approach to hepatic drug clearance. Clin Pharmacol Ther. 1975;18:377-89.
4. Benet LZ. Clearance (nee Rowland) concepts: a downdate and an update. J Pharmacokinet Pharmacodyn. 2010;37:529-39.
5. Mehvar R. Interdependency of pharmacokinetic parameters: a chicken-and-egg problem? Not! J Pharm Pharm Sci. 2006;9:113-8.
6. Sirianni GL, Pang KS. Organ clearance concepts: New perspectives on old principles. J Pharmacokinet Biopharm. 1997;25:449-70.
7. Pang KS, Weiss M, Macheras P. Advanced pharmacokinetic models based on organ clearance, circulatory, and fractal concepts. AAPS J. 2007;9:E268-83.
8. Pang K, Rowland M. Hepatic clearance of drugs. I. Theoretical considerations of a "well-stirred" model and a "parallel tube" model. Influence of hepatic blood flow, plasma and blood cell binding, and the hepatocellular enzymatic activity on hepatic drug clearance. J Pharmacokinet Biopharm. 1977;5:625-53.
9. Pang K, Rowland M. Hepatic clearance of drugs. II. Experimental evidence for acceptance of the "well-stirred" model over the "parallel tube" model using lidocaine in the perfused rat liver in situ preparation. J Pharmacokinet Biopharm. 1977;5:655-79.
10. Pang K, Rowland M. Hepatic clearance of drugs. III. Additional experimental evidence supporting the "well-stirred" model, using metabolite (MEGX) generated from lidocaine under varying hepatic blood flow rates and linear conditions in the perfused rat liver in situ preparation. J Pharmacokinet Biopharm. 1977;5:681-99.
11. Roberts M, Rowland M. Hepatic elimination--dispersion model. J Pharm Sci. 1985;74:585-7.
12. Gray M, Tam Y. The series-compartment model for hepatic elimination. Drug Metab Disposit. 1986;15:27-31.
13. Pang KS, Terrell JA, Nelson SD, Feuer KF, Clements MJ, Endrenyi L. An enzyme-distributed system for lidocaine metabolism in the perfused rat liver preparation. J Pharmacokinet Biopharm. 1986;14:107-30.
14. Bass L, Robinson P, Bracken AJ. Hepatic elimination of flowing substrates: the distributed model. J Theor Biol. 1978;72:161-84.
15. Goresky CA, Bach GG, Nadeau BE. On the uptake of materials by the intact liver. The transport and net removal of galactose. J Clin Invest. 1973;52:991-1009.
16. Yamazaki M, Akiyama S, Nishigaki R, Sugiyama Y. Uptake is the rate-limiting step in the overall hepatic elimination of pravastatin at steady state in rats. Pharm Res. 1996;13:1559-64.
17. Benet LZ, Liu S, Wolfe AR. The universally unrecognized assumption in predicting drug clearance and organ extraction ratio. Clin Pharmacol Ther. 2018;103:521-5.
18. Rowland M, Pang KS. Commentary on "The universally unrecognized assumption in predicting drug clearance and organ extraction ratio". Clin Pharmacol Ther. 2018;103:386-8.
19. Wu CY, Benet LZ, Hebert MF, Gupta SK, Rowland M, Gomez DY, et al. Differentiation of absorption and first-pass gut and hepatic metabolism in humans: Studies with cyclosporine. Clin Pharmacol Ther. 1995;58:492-7.
20. O'Reilly RA. Interaction of sodium warfarin and rifampin. Studies in man. Ann Intern Med. 1974;81:337-40.
101
J Pharm Pharm Sci (www.cspsCanada.org) 21, 88s - 102s, 2018

21. Alvan G, Piafsky K, Lind M, von Bahr C. Effect of pentobarbital on the disposition of alprenolol. Clin Pharmacol Ther. 1977;22:316-21.
22. Conrad KA, Byers JM, 3rd, Finley PR, Burnham L. Lidocaine elimination: effects of metoprolol and of propranolol. Clin Pharmacol Ther. 1983;33:133-8.
23. Mehvar R. Application of organ clearance to estimation of the in vivo hepatic extraction ratio. Curr Clin Pharmacol. 2016;11:47-52.
24. Mehvar R, Jamali F, Watson M, Skelton D. Pharmacokinetics of tetrabenazine and its major metabolite in man and rat: bioavailability and dose dependency studies. Drug Metab Disposit. 1987;15:250-5.
25. Roberts MS, McLean S, Millingen KS, Galloway HM. The pharmacokinetics of tetrabenazine and its hydroxy metabolite in patients treated for involuntary movement disorders. Eur J Clin Pharmacol. 1986;29:703-8.
26. Hebert MF, Roberts JP, Prueksaritanont T, Benet LZ. Bioavailability of cyclosporine with concomitant rifampin administration is markedly less than predicted by hepatic enzyme induction. Clin Pharmacol Ther. 1992;52:453-7.
27. Galetin A, Gertz M, Houston JB. Potential role of intestinal first-pass metabolism in the prediction of drug-drug interactions. Expert Opin Drug Metab Toxicol. 2008;4:909-22.
28. Gomez DY, Wacher VJ, Tomlanovich SJ, Hebert MF, Benet LZ. The effects of ketoconazole on the intestinal metabolism and bioavailability of cyclosporine. Clin Pharmacol Ther. 1995;58:15-9.
29. Hisaka A, Nakamura M, Tsukihashi A, Koh S, Suzuki H. Assessment of intestinal availability (FG) of substrate drugs of cytochrome p450s by analyzing changes in pharmacokinetic properties caused by drug-drug interactions. Drug Metab Dispos. 2014;42:1640-5.
30. Bailey DG, Malcolm J, Arnold O, Spence JD. Grapefruit juice-drug interactions. Br J Clin Pharmacol. 1998;46:101-10.
31. Gertz M, Davis JD, Harrison A, Houston JB, Galetin A. Grapefruit juice-drug interaction studies as a method to assess the extent of intestinal availability: utility and limitations. Curr Drug Metab. 2008;9:785-95.
32. Soons PA, De Boer A, Cohen AF, Breimer DD. Assessment of hepatic blood flow in healthy subjects by continuous infusion of indocyanine green. Br J Clin Pharmacol. 1991;32:697-704.
33. Richardson PD, Withrington PG. Liver blood flow. I. Intrinsic and nervous control of liver blood flow. Gastroenterology. 1981;81:159-73.
34. Carlisle KM, Halliwell M, Read AE, Wells PN. Estimation of total hepatic blood flow by duplex ultrasound. Gut. 1992;33:92-7.
35. Daneshmend TK, Jackson L, Roberts CJ. Physiological and pharmacological variability in estimated hepatic blood flow in man. Br J Clin Pharmacol. 1981;11:491-6.
36. McLean AJ, McNamara PJ, duSouich P, Gibaldi M, Lalka D. Food, splanchnic blood flow, and bioavailability of drugs subject to first-pass metabolism. Clin Pharmacol Ther. 1978;July:5-10.
102
J Pharm Pharm Sci (www.cspsCanada.org) 21, 88s - 102s, 2018