clean energy saving: applied research into etna’s water · pdf fileclean energy saving:...
TRANSCRIPT

Clean energy saving: applied research into Etna’s water supply systems in Catania, Italy
F. Patania, A. Gagliano, F. Nocera & I. Pellegrino Energy and Environment Division of DIIM, Engineering Faculty of University of Catania, Italy
Abstract
Saving energy not only reduces the use of combustible fossil fuels but certainly contributes to reducing environmental pollution due to traditional energy production by combustion. One of the less investigated energy saving sectors is hydroelectricity. Hydroelectricity production has always involved huge dams regulating enormous quantities of water supplied by natural or artificial reservoirs to generate high levels of electricity. If this was gone into detail with an accurate analysis of how much potential hydroelectric power is continuously lost through the adduction and distribution systems of the drinking water for average large cities, one would discover countless ways nationwide of generating power by hydro-micro turbines in situ without losses through the grid. Regarding this matter the authors have been carried out some applied research to utilize potential energy, otherwise wasted due to dissipative phenomena along the system of distribution and in final reservoirs, of a public water company in Catania The potential energy otherwise wasted has been recovered using some hydro micro-turbines able to convert wasted energy into 6 MWh per annum of electric power. On this ground, the authors want to show results of new applied research, carried out on a system of distribution of a water private company operating in Catania province, that confirms how such energy saving could be intensively exploited. Consequently, this study would like to illustrate: the layout of water resource distribution; the choice of insertion points for the hydro-micro turbines; the most suitable calculation methodology for evaluating potential power production; the annual electrical power obtainable, or the potential energy savings; and the reduction of environmental pollution coming from the degrease of combustion of ETP necessary to produce the same amount of electric power obtained by hydro-micro turbines. Keywords: air pollution, hydro micro turbines, saving energy.
Energy and Sustainability 35
www.witpress.com, ISSN 1743-3541 (on-line)
© 2007 WIT PressWIT Transactions on Ecology and the Environment, Vol 105,
doi:10.2495/ESUS070041

1 Foreword
Small-scale hydropower is one of the most cost-effective and reliable energy technologies to be considered for providing clean electricity generation. In particular, the key advantages that small hydro has over wind, wave and solar power are:
- High efficiency (70% - 90%), by far the best of all energy technologies. - High capacity factor (typically >50%), compared with 10% for solar and
30% for wind
Hydro-turbines convert water pressure into mechanical shaft power, which can be used to drive an electricity generator, or other machinery. The power available is proportional to the product of head and flow rate. The general formula for any hydro system’s power output is:
P = η ρ g Q H (1) where:
- P is the mechanical power produced at the turbine shaft (Watts), - η is the hydraulic efficiency of the turbine, ρ is the density of water (1000
kg/m3), - g is the acceleration due to gravity (9.81 m/s2), - Q is the volume flow rate passing through the turbine (m3/s), - H is the effective pressure head of water across the turbine (m).
The best turbines can have hydraulic efficiencies in the range 80% to over 90% (higher than all other prime movers), although this will reduce with size. The authors focus on the possibility to convert water pressure of aqueducts of potable water into mechanical shaft power.
2 The case study
The Acqua Sud Company manages the main aqueduct for the city of Catania and it consists of wells with stations of pumping, pipes of water at pressure, deposits and nets of water supply. The authors focused on the possibility to convert water pressure of the two pipes called “P1-Monte Palma” and “P3-ST”. At the end of the two pipes, the water pressure is converted in a powerhouse by a turbine to mechanical energy in the form of a rotating shaft, and that is in turn converted to electrical energy through the generator. The electrical energy passes from the generator through controls and switchgear that are designed to provide electrical protection to both the power plant and the powerlines. There may be a nearby substation (or simply a transformer) that raises the voltage to a level compatible with the electrical system and an interconnecting powerline to the nearest point of the utility capable of accepting the power.
36 Energy and Sustainability
www.witpress.com, ISSN 1743-3541 (on-line)
© 2007 WIT PressWIT Transactions on Ecology and the Environment, Vol 105,
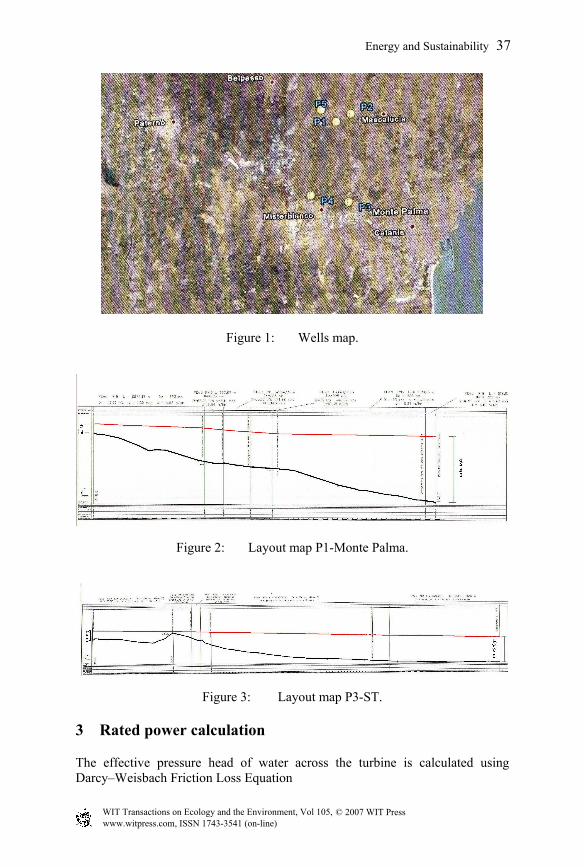
Figure 1: Wells map.
Figure 2: Layout map P1-Monte Palma.
Figure 3: Layout map P3-ST.
3 Rated power calculation
The effective pressure head of water across the turbine is calculated using Darcy–Weisbach Friction Loss Equation
Energy and Sustainability 37
www.witpress.com, ISSN 1743-3541 (on-line)
© 2007 WIT PressWIT Transactions on Ecology and the Environment, Vol 105,

2
2L VJD g
λ= (2)
where J is the friction loss [m] V is the velocity [m/s] D is the duct diameter [m] g is the acceleration due to gravity [m/s2] λ is the friction factor. The velocity is found from the equation
QVA
= (3)
where Q is the discharge [m3/s] A is the duct area [m2]. The friction factor is calculated using Colebrook–White Equation
1 2,512 log3,71Re D
ελ λ
= ⋅ +
(4)
where λ is the friction factor Re is the Reynolds Number ε is the Colebrook-White roughness coefficient [m] D is the duct diameter [m]. The Reynolds Number is found from the equation
Re V Dρµ
= (5)
where V is the free-stream fluid velocity [m/s] D is the duct diameter [m] ρ is the Fluid density [Kg/m3] µ is the fluid viscosity (dynamic) [Kg/m s]. The following tables show the main characteristics detected in situ of investigated system and the calculated electric power that can be obtain by hydro micro turbine.
38 Energy and Sustainability
www.witpress.com, ISSN 1743-3541 (on-line)
© 2007 WIT PressWIT Transactions on Ecology and the Environment, Vol 105,

Table 1: Pipe characteristics.
Sections 1-20 20-26 26-3 3-4 4-27 27-30 P1-
Monte Palma PEad (PN6)
ε=0.02 mm D=225 mm L=2277 m Q=40 l/s
J=15.55 m
PEad (PN10)ε=0.02 mm D=225 mm L=383 m Q=65 l/s J=6.45 m
PEad (PN6)ε=0.02 mm D=225 mmL=564 m Q=65 l/s J=7.52 m
Steel ε=0.03 mmD=200 mmL=450 m Q=65 l/s J=7.49 m
PEad (PN6)ε=0.02 mm D=225 mm L=3128 m Q=25 l/s J=7.13 m
PEad (PN6) ε=0.02 mm D=225 mm L=212 m Q=50 l/s J=1.73 m
Sections 1-24 24-22 26-30 30-58 4-27
P3-ST
PEad (PN10) ε=0.02 mm D=280 mm L=2664m Q=55.5 l/s J=11.40 m
PEad (PN6) ε=0.02 mm D=280 mm L=604 m
Q=55.5 l/s J=2.05 m
PEad (PN8) ε=0.02 mm D=280 mm L=297 m
Q=55.5 l/s J=1.27m
PEad (PN8)ε=0.02 mm D=280 mm L=6235 m Q=55.5 l/s J=26.69 m
PEad (PN8) ε=0.02 mm D=280 mm L=3632 m Q=55.5 l/s J=15.55 m
Table 2: Effective pressure head of water across the turbine.
Gross Head (m)
L(m) J(m) Net Head H (m)
P1-Monte Palma
278 7014 45.9 232.1
P3-ST 160.5 13432 56.9 103.6
Table 3:
P1-Monte Palma Q
m3/s H m
P KW
0.050 232.1 81.23 P3-ST
Q m3/s
H m
P KW
0.055 103.6 39.88 If we take 70% as a typical water-to-wire efficiency for the whole system, then the above equation of hydro system’s power output simplifies to:
P (kW) = 7 Q (m3/s) H (m) (6) The annual energy output is estimated using the Capacity Factor (CF) as follows:
Energy (kWh/year) = P (kW) CF 8760 (7)
Energy and Sustainability 39
www.witpress.com, ISSN 1743-3541 (on-line)
© 2007 WIT PressWIT Transactions on Ecology and the Environment, Vol 105,
Output power peak.
The ‘capacity factor’ is a ratio summarising how hard a turbine is working and in our case we assume capacity factor of 70% Electricity produced per annum (kWh) = 81.23*0.90*8760 = 640.4 KWh (P1-Monte Palma). Electricity produced per annum (kWh) = 39.88*0.90*8760 = 314.4 KWh (P3-ST).
4 Technology
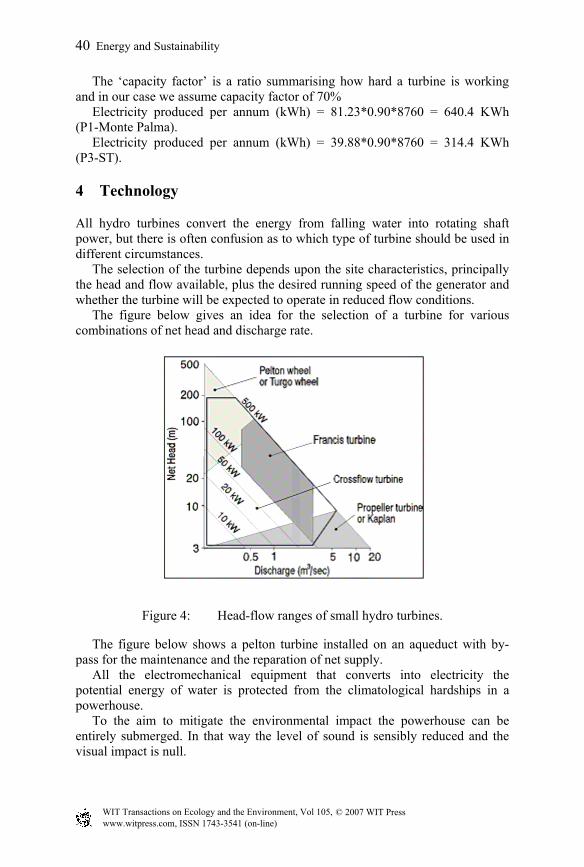
All hydro turbines convert the energy from falling water into rotating shaft power, but there is often confusion as to which type of turbine should be used in different circumstances. The selection of the turbine depends upon the site characteristics, principally the head and flow available, plus the desired running speed of the generator and whether the turbine will be expected to operate in reduced flow conditions. The figure below gives an idea for the selection of a turbine for various combinations of net head and discharge rate.
Figure 4: Head-flow ranges of small hydro turbines.
The figure below shows a pelton turbine installed on an aqueduct with by-pass for the maintenance and the reparation of net supply. All the electromechanical equipment that converts into electricity the potential energy of water is protected from the climatological hardships in a powerhouse. To the aim to mitigate the environmental impact the powerhouse can be entirely submerged. In that way the level of sound is sensibly reduced and the visual impact is null.
40 Energy and Sustainability
www.witpress.com, ISSN 1743-3541 (on-line)
© 2007 WIT PressWIT Transactions on Ecology and the Environment, Vol 105,

Figure 5: Pelton turbine installed on aqueduct with by-pass (tamanini).
5 Environmental assessment
In order for the greenhouse gas (GHG) emissions reductions generated from a project to be recognised and sold on domestic or international carbon markets, several project documents need to be developed, the key elements of which are a GHG baseline study and a Monitoring Plan (MP). A GHG baseline study identifies and justifies a credible project baseline based on the review of relevant information such as grid expansion plans, dispatch models, fuel use on the margin, current fuel consumption patterns and emissions factors. The GHG baseline study sets a project boundary and identifies all sources of GHG emissions that would have occurred under the baseline scenario, i.e. the scenario most likely to have occurred if the project were not implemented. A Monitoring Plan identifies the data that needs to be collected in order to monitor and verify the emissions reductions resulting from the project and describes a methodology for quantifying these reductions as measured against the project baseline. The author utilized Greenhouse Gas Emission Reduction Analysis and Sensitivity worksheets to estimate the greenhouse gas (GHG) mitigation potential of the project The worksheets developed calculate the net annual average GHG emission reduction in equivalent tonnes of CO2 per year (tCO2/yr) and PM10 per year (tPM10/yr) resulting from the implementation of the project. Table 4 shows the reduction of CO2 and PM10 emissions due to this type of intervention.
Energy and Sustainability 41
www.witpress.com, ISSN 1743-3541 (on-line)
© 2007 WIT PressWIT Transactions on Ecology and the Environment, Vol 105,

Table 4: The reduction of CO2 and PM10.
CO2 Ton/
PM10 Kg
P1-Monte Palma
314.4 89.6
P3-ST 154.3 44.0 Table 5 shows the saving energy in ETP (Equivalent Tons of Petroleum) that is conventional unit of measure for energy sources, equivalent to 10,000 Mcal, the energy obtained from the combustion of one ton of petroleum. The conversion factors are: 1MWh thermal = 0.086 ETP, 1 MWh electricity = 0.23 ETP.
Table 5: Saving energy in ETP.
Pe KWh
Pp ETP
P1-Monte Palma
640.4 147.2
P3-ST 314.4 72.3
6 Conclusion
The research shows the following results: - The potential energy, otherwise wasted, would save about 219.5 of
Equivalent Tons of Petroleum per annum, necessary to produce the 954.8 KWh/year obtained by hydro micro turbine
- The amount of Petroleum saved would decrease the discharge in the atmosphere of 468,7 Tons of CO2 and 133,6 Kilos of PM10 per annum
- A close investigation into all system of adduction and distribution of public and private Companies along whole national territory could carry out both an unexpected amount of potential energy wasted and amount of electric power that could be produced by clean energy and that will involve a very big reduction of green house gasses discharge into atmosphere.
References
[1] Layman’s guidebook on how to develop a small hydro site. Published by the European Commission, 200 Rue de la Loi, B-1049 Brussels, Belgium.
[2] F. Patania, A. Gagliano, F. Nocera, et alt., How To Get Energy Economics And Environmental Benefits: An Applied Research For Real Case, 3rd European Congress on Economics and Management of Energy Industry, Lisbon
[3] The Micro-hydro Pelton Turbine Manual, J Thake, ITDG Publishing, 2000 [4] www.tamanini.it
42 Energy and Sustainability
www.witpress.com, ISSN 1743-3541 (on-line)
© 2007 WIT PressWIT Transactions on Ecology and the Environment, Vol 105,