clean development mechanism project design document form ... landfill gas... · project design...
TRANSCRIPT

PROJECT DESIGN DOCUMENT FORM (CDM PDD) - Version 02 CDM – Executive Board page 1
This template shall not be altered. It shall be completed without modifying/adding headings or logo, format or font.
CLEAN DEVELOPMENT MECHANISM PROJECT DESIGN DOCUMENT FORM (CDM-PDD)
Version 02 - in effect as of: 1 July 2004)
CONTENTS A. General description of project activity B. Application of a baseline methodology C. Duration of the project activity / Crediting period D. Application of a monitoring methodology and plan E. Estimation of GHG emissions by sources F. Environmental impacts G. Stakeholders’ comments
Annexes Annex 1: Contact information on participants in the project activity Annex 2: Information regarding public funding Annex 3: Baseline information Annex 4: Monitoring plan

PROJECT DESIGN DOCUMENT FORM (CDM PDD) - Version 02 CDM – Executive Board page 2
This template shall not be altered. It shall be completed without modifying/adding headings or logo, format or font.
SECTION A. General description of project activity A.1 Title of the project activity: Aurá Landfill Gas Project Document version number 1 24 November 2005 A.2. Description of the project activity: The project will be developed by Conestoga-Rovers & Associados Engenharia S/A (CRA) at the Aurá Landfill (Site), originally called Aterro Sanitário do Aurá. The Aurá Landfill has received non-hazardous solid municipal, industrial, commercial, institutional, and some agricultural wastes for approximately 15 years. The landfill normally emits carbon dioxide (CO2) and methane (CH4) into the atmosphere, with these compounds being generated by the anaerobic decomposition of the above-noted wastes placed at the site. The project will involve construction of a landfill gas collection system consisting of a grid of horizontal trenches and vertical gas extraction wells, centrifugal blower(s), and all other supporting mechanical and electrical subsystems and appurtenances necessary to collect the LFG. To combust the LFG collected from the site, an enclosed LFG flare with full process controls and instrumentation will also be constructed and operated. This will be a state-of-the-art flare capable of providing sufficient temperature and retention time of the extracted landfill gas for complete destruction of hydrocarbons. Specifically, the retention time of the landfill gas within the enclosed flare will be 0.5 seconds at a temperature of 875oC. Purpose of the Project Activity: The purpose of the proposed project activity is to collect landfill gas at the Aurá Landfill and combust the extracted LFG over a ten year-period utilizing a high-efficiency enclosed flare, thereby reducing greenhouse gas emissions (GHGs) and generating approximately 3,201,764.8 tonnes of Certified Emission Reductions (CERs). Contribution of the Project Activity to Sustainable Development: The project will make a strong contribution to sustainable development in Brasil. Over and above reducing emissions of GHGs, there are other benefits related to sustainable development as follows:
a) Contribution to recycling activities: The Municipality of Belém has plans to improve the quality and effectiveness of recycling activities currently conducted by wastepickers at the Aurá Landfill. CRA is willing to assist the Municipality of

PROJECT DESIGN DOCUMENT FORM (CDM PDD) - Version 02 CDM – Executive Board page 3
This template shall not be altered. It shall be completed without modifying/adding headings or logo, format or font.
Belém, providing technical expertise and CRA international experience in similar situations to implement an organized recycling program customized to the local conditions.
b) Contribution to human health and the environment: With the flaring of landfill gas, the population living around the landfill will have an environment that is cleaner and healthier, with improved air quality and reduced risk due to landfill gas subsurface migration and diminished potential for groundwater contamination. The landfill has also encountered incidences of landfill fires, with the associated release of incomplete combustion products, and effective landfill gas management is expected to minimize occurrence of these fires.
c) Contribution to the improvement of working conditions and employment creation: Starting with the construction phase, local manpower will be used during the implementation of the project. Local employment will be directly created during the construction phase of the project, which entails installation of vertical wells and assembly and operation of equipment such as blowers and flares. All these jobs will be created fully obeying the current Brasilian employment legislation. During the operational phase, which will take place 24 hours/day, 7 days/week, there will be new jobs created locally for duties related to operations and maintenance, landscaping, plumbing, monitoring and security personnel. These people will be fully trained on their duties and tasks.
d) Contribution to income generation: As one of the early projects in Brasil, the flaring of landfill gas at the Aurá Landfill will generate royalty revenue for the municipality of Belém throughout the ten-year crediting period of the project.
e) Contribution to technological capacity building: CRA will make available on its Web site (http://www.CRAworld.com) all information pertaining to the project activity and it is also ready to answer any questions regarding the project to whoever may be interested (municipalities, universities, and the general public) through the e-mail address: [email protected].
f) Contribution to regional integration and cooperation with other sectors: Belém will serve as a reference for other municipalities that are willing to implement similar projects at their landfill sites under the CDM incentive. Other sectors of the economy will be stimulated by the innovative nature of the project and the prospect of investing royalty monies to bring about social and environmental benefits. A.3. Project participants: A list of the involved parties is indicated below.
Name of Party Involved (host indicates a host party)
Private and/or public entity(ies) project participants*
The party involved wishes to be considered as project

PROJECT DESIGN DOCUMENT FORM (CDM PDD) - Version 02 CDM – Executive Board page 4
This template shall not be altered. It shall be completed without modifying/adding headings or logo, format or font.
participant (Yes/No)** Prefeitura Municipal de Belém,
City of Belém, State of Pará (Public Entity)
Brasil (Host Country) Conestoga-Rovers & Associados Engenharia S/A (Project Sponsor;
Private Entity)
No
United Kingdom BGC International (Private Entity) No * In accordance with the CDM modalities and procedures, at the time of making the CDM-PDD public at the stage of validation, a Party involved may or may not have provided its approval. At the time of requesting registration, the approval by the Party(ies) involved is required. ** Indicates project participant status of the party listed in first column of table A.4. Technical description of the project activity: A.4.1. Location of the project activity: The project activities will take place at the Aurá Landfill in the City of Belém, Brasil. A.4.1.1. Host Party(ies): The host country is Brasil. A.4.1.2. Region/State/Province etc.: The site is located within the State of Pará. A.4.1.3. City/Town/Community etc: The site is located within and owned by the City of Belém. A.4.1.4. Detail of physical location, including information allowing the unique identification of this project activity (maximum one page): The Aurá Landfill is located 19 kilometres (km) from the centre of the City of Belém, State of Pará and 8 km from the centre of the City of Ananindeua, State of Pará. The entire Site covers an area of 120 hectares (ha) and the waste fill area of the site is approximately 30 ha in size. The Site is located west of Curuperé Creek and east of the Parque Ambiental de Belém. A.4.2. Category(ies) of project activity:

PROJECT DESIGN DOCUMENT FORM (CDM PDD) - Version 02 CDM – Executive Board page 5
This template shall not be altered. It shall be completed without modifying/adding headings or logo, format or font.
The project activity will be a landfill gas emission reduction project under sectoral scope 13: waste handling and disposal. A.4.3. Technology to be employed by the project activity: The technology used to gather the LFG is a grid of trenches and wells within the landfill, connected to a centralized blower system used to induce vacuum. Upon gathering the LFG, the methane component of the LFG is combusted in a state-of-the-art, high-efficiency enclosed flare. The Global Warming Potential (GWP) of the LFG will thus be reduced by the destruction of the methane portion of the LFG. Vertical gas extraction wells will be established in the waste material and will be connected to the blower system through a network of underground piping installed on and around the perimeter of the landfill. The extraction wells will be connected to the subheader or directly to the header through smaller diameter laterals. As the blower is operated, a vacuum is applied through the piping network, which in turn applies a vacuum to each well and extracts LFG out of the waste. The flow of gas can be controlled at each of the individual vertical extraction wells through the use of a valve located at the top of the well piping. Each well will be individually controlled to ensure that the collection system can be effectively set up and balanced. The system will be manually monitored and controlled and each wellhead will be equipped with a secure monitoring chamber and monitoring ports for gas composition, pressure, and temperature readings. Horizontal collection trenches will be installed by excavating into the refuse. Horizontal collection trenching will be installed in an excavated trench lined with clear stone. Collection pipe within the trench will be perforated so that a vacuum can be applied and LFG drawn from the landfill. Horizontal collection trenches operate in a similar manner to vertical wells, with the main difference that the zone of influence for trenches is typically oval in shape in the vertical plane due to the higher horizontal permeability of the refuse compared to the vertical permeability. For horizontal collection trenches, the complete length of the trench will be monitored and adjusted at a single location at the connection point along a sub-header piping section. Individual trenches will be manually monitored and controlled to help with set-up and balancing of the LFG collection field. Controls for each trench will be located in a valve chamber installed in line with the trench which will include a secure monitoring chamber and monitoring ports for gas composition, pressure, and temperature readings. Non-perforated LFG collection piping will be utilized to convey the LFG from the extraction wells and horizontal collection trenches to the gas control plant. The LFG collection piping consists of a perimeter header, sub-headers, and laterals. Header piping conveys the LFG collected from sub-header and horizontal collection trenching to the gas control plant. Sub-header piping conveys LFG from lateral piping to header piping, and lateral piping conveys LFG collected primarily at vertical extraction wells to sub-header piping. At the gas control plant, the blower system will be equipped at all times to allow for regular down time for maintenance and to provide backup in the event of a component failure. The blower system will exert vacuum through the piping system to the system of vertical wells and horizontal trenches. Extracted LFG will be sent to a high-efficiency state-of-the-art enclosed flare for destruction of the methane component of the extracted landfill gas. The stack height of the flare will be specified to provide sufficient residence time for destruction of compounds in the gas at high temperature and in a controlled environment to destroy extracted methane. Flame temperature will be controlled by means of a system of automatically and

PROJECT DESIGN DOCUMENT FORM (CDM PDD) - Version 02 CDM – Executive Board page 6
This template shall not be altered. It shall be completed without modifying/adding headings or logo, format or font.
manually controlled air inlet dampers and thermocouples located in the stack. Retention time of the landfill gas within the enclosed flare will be 0.5 seconds at a temperature of 875oC. Flaring is a proven technology for the combustion of landfill gas and has been demonstrated to be reliable and environmentally safe. The industry standard destruction efficiencies for enclosed flares are upwards of 99.99% for hydrocarbons. A.4.4. Brief explanation of how the anthropogenic emissions of anthropogenic greenhouse gas (GHGs) by sources are to be reduced by the proposed CDM project activity, including why the emission reductions would not occur in the absence of the proposed project activity, taking into account national and/or sectoral policies and circumstances: Anthropogenic emissions of GHG’s occur at the Aurá Landfill when methane produced at the landfill is not destroyed. The collection and destruction of the methane in the project activity will reduce GHG emissions from the “business as usual case” currently employed by the Aurá Landfill. The current practice at this landfill is to allow the uncontrolled release of LFG into the atmosphere. The LFG generated at the site consists approximately of 50% methane and 50% carbon dioxide, both known GHGs with Global Warming Potentials (GWP) values of 21 and 1, respectively. However, the carbon dioxide portion of landfill gas is considered to be biogenic in origin and part of the natural carbon cycle, and thus not considered an anthropogenic source of greenhouse gas. Currently, there are no national or sector policies or regulations governing the release of LFG into the atmosphere. The proposed CDM project activity will establish a landfill gas collection and flaring system at the Aurá Landfill, thus generating emission reductions that satisfy all of the tests for creation of CERs over the extended life of the project. It is important to note that the abovementioned GHGs emission reductions are additional to the current site conditions and current practices, and would have not occurred in the absence of the project; thus, the project complies with the concept of additionality defined under Kyoto’s Clean Development Mechanism. Over the 10-year period of credit certification, the anticipated total reductions in tonnes of CO2 is estimated as 3,201,764.8 tonnes of CO2 equivalent. A.4.4.1. Estimated amount of emission reductions over the chosen crediting period: By direct flaring of the LFG generated at the site, the proposed project is expected to generate 3,201,764.8 tonnes of emission reductions expressed as tonnes of CO2e over the crediting period. The annual expected amount of emission reductions generated over the entire project lifespan is indicated below:

PROJECT DESIGN DOCUMENT FORM (CDM PDD) - Version 02 CDM – Executive Board page 7
This template shall not be altered. It shall be completed without modifying/adding headings or logo, format or font.
Year Annual estimation of emission reductions in tonnes of CO2 e
2006 45,779.7 2007 292,141.4 2008 309,676.3 2009 327,309.5 2010 345,063.6 2011 362,965.2 2012 345,262.7 2013 328,424.5 2014 312,406.5 2015 297,170.8 2016 235,564.6
Total estimated reductions (tonnes of CO2e) 3,201,764.8
Total number of crediting years 10 Annual average over the crediting period of estimated reductions (tonnes of CO2e)
320,176
A.4.5. Public funding of the project activity: No public funding of any kind has been provided for this project. SECTION B. Application of a baseline methodology B.1. Title and reference of the approved baseline methodology applied to the project activity: The approved baseline methodology applied to this project is the approved ACM0001 – Consolidated Baseline Methodology for Landfill Gas Project Activities. B.1.1. Justification of the choice of the methodology and why it is applicable to the project activity: ACM0001 was developed as a consolidated document that incorporates all previously-approved methodologies applicable to landfill gas project activities where the baseline scenario is the partial or total atmospheric release of landfill gas. This methodology is applicable to “landfill gas capture project activities where the baseline scenario is the partial or total atmospheric release of the gas and the project activities include situations such as: the captured gas is flared”. For the proposed project activity, the baseline scenario is the total atmospheric release of the gas, and the project activity is the flaring/destruction of captured gas; as a result, ACM0001 is applicable to the project activity.

PROJECT DESIGN DOCUMENT FORM (CDM PDD) - Version 02 CDM – Executive Board page 8
This template shall not be altered. It shall be completed without modifying/adding headings or logo, format or font.
The CERs exchange mechanism provided under the CDM is considered a real and concrete incentive in the decision to proceed with the project activity and the project activity will not be initiated without registration as a CDM project. B.2. Description of how the methodology is applied in the context of the project activity: As mentioned above, based on the current LFG management practices at the site and the current environmental regulations in Brasil, the GHG emission reductions generated by the implementation of the project activity are considered fully additional. There are no existing or pending regulatory requirements requiring the landfill site to implement any form of LFG emission reductions program. There is also no current system in place for landfill gas recovery and combustion at the site. Therefore, the project baseline is the uncontrolled release of the landfill gas into the atmosphere. The greenhouse gas emissions reductions achieved by the project activity during a given period is the difference between the amount of methane actually destroyed/combusted and the amount of methane that would have been destroyed/combusted in the absence of the project activity, times the GWP of methane. For this project, the baseline is the total release of landfill gas into the atmosphere. B.3. Description of how the anthropogenic emissions of GHG by sources are reduced below those that would have occurred in the absence of the registered CDM project activity: The ACM0001 methodology requires the use of the “Tool for the demonstration and assessment of additionality” to demonstrate and assess additionality, which is a step-wise approach that includes: • Identification of alternatives to the project activity; • Investment analysis to determine that the proposed project activity is not the most economically or
financially attractive (in the absence of the CDM incentive); • Barriers analysis; • Common practice analysis; and • Impact of registration of the proposed project activity as a CDM project activity. The “Tool for the demonstration and assessment of additionality” (UNFCCC, 22 October 2004) is applied as follows. Step 0. Preliminary screening based on the starting date of the project activity The actual methane destruction crediting period is expected to start on 1 November 2006; by then, all necessary local and UNFCCC approvals are expected to be in place ie. the crediting period will commence subsequent to registration of the project activity. As a result, Step 0 is not applicable. Step 1. Identification of alternatives to the project activity consistent with current laws and regulations

PROJECT DESIGN DOCUMENT FORM (CDM PDD) - Version 02 CDM – Executive Board page 9
This template shall not be altered. It shall be completed without modifying/adding headings or logo, format or font.
Alternatives to the project activity consistent with current laws and regulations are defined through the following sub-steps: Sub-step 1a. Define alternatives to the project activity: The below table presents an analysis of different alternatives to the project activity along with a discussion of probable outcome.
Alternatives to Project Activity Probability of Scenario Landfill gas recovery not implemented (continuation of the current situation)
Most probable: there are no regulations requiring the capture and destruction of landfill gas at the site. Additionally, the technical expertise and financial investment to engage in the project is not available in Brasil.
Project undertaken as a non-CDM project activity Not probable: The project activity requires funds for both construction of the required facilities and to maintain operations. There are no known or available funding sources available to support this project and there are no known or proposed regulatory requirements that would require the emissions to be controlled. The project activity will not be initiated without registration as a CDM project.
Electricity generation from the methane component of the extracted landfill gas
Not probable: the technical expertise and financial resources in Brasil are not available to initiate electrical generation. Utilization systems are more capitally-intensive than landfill gas capture and flaring systems, requiring significantly more investment.
The above analysis shows that the only reasonable alternative to the project activity is the continued uncontrolled release of landfill gas to the atmosphere as part of the “business-as-usual” scenario. As a result, the project activity is the only viable alternative to address the reduction of greenhouse gas emissions at the site Sub-step 1b. Enforcement of applicable laws and regulations: Each of the above alternatives complies with the applicable laws and regulations in Brasil. In terms of the project activity, the active collection and flaring of LFG is not mandatory at the Aurá landfill, and as such, the site is currently in compliance with all local environmental regulations with respect to air emissions. Step 2. Investment analysis

PROJECT DESIGN DOCUMENT FORM (CDM PDD) - Version 02 CDM – Executive Board page 10
This template shall not be altered. It shall be completed without modifying/adding headings or logo, format or font.
According to the “Tool for the demonstration and assessment of additionality” (UNFCCC, 22 October 2004), an Investment analysis or barrier analysis is required. For the investment analysis, “if the CDM project activity generates no financial or economic benefits other than CDM related income, then apply the simple cost analysis (Option I)”. Option 1 of Sub-step 2b is thus applied. The project activity involves the implementation of a landfill gas collection and flaring system to combust the methane component of landfill gas. This will require capital expenditures for the gas collection wells and piping, the mechanical instrumentation required to induce vacuum, the analytical instrumentation necessary to monitor landfill gas composition, and the enclosed drum flare to be used in destruction of the methane component of the landfill gas. Additionally, on-going expenses will be incurred to operate the facility and to maintain the system components. The destruction of methane via the project activity would not result in any income other than that derived through revenues generated from the CER exchange mechanism under the CDM. The project activity is not financially attractive under any scenario except through registration as a CDM project. Step 3. Barrier analysis The goal of step 3 is to determine whether the proposed project activity faces barriers that: (a) Prevent the implementation of this type of proposed project activity in the absence of the CDM
incentive; and (b) Do not prevent the implementation of at least one of the identified alternatives. Sub-step 3a. Identify barriers that would prevent the implementation of type of the proposed project activity: The implementation of a landfill gas collection system at the Aurá landfill site faces a number of investment and technologic barriers in the absence of the CDM incentive. These barriers are briefly discussed below. • Investment Barriers Currently, the availability of debt funding or access to international capital markets for this type of project is restricted in Brasil, as is the availability of government subsidies. • Technological Barriers Today, Brasil lacks the necessary technical knowledge to implement LFG Management projects. Although the main infrastructure for the implementation of this type of project is readily available, the technical and engineering expertise, and the main components of the LFG management systems, are not available in Brasil and therefore need to be provided by sources outside the country. Sub-step 3b. Show that the identified barriers would not prevent the implementation of at least one of the alternatives (except the proposed project activity): Alternative #1: Landfill gas recovery not implemented (continuation of the current situation)

PROJECT DESIGN DOCUMENT FORM (CDM PDD) - Version 02 CDM – Executive Board page 11
This template shall not be altered. It shall be completed without modifying/adding headings or logo, format or font.
The identified barriers would not affect the current “business-as-usual” scenario of emitting the landfill gas into the atmosphere. The “business-as-usual” scenario does not require any investments or technological improvements and is fully compatible with regulatory requirements. Alternative #2: Project undertaken as a non-CDM project activity Implementation of a landfill gas capture and flaring system without registration as a CDM project will not proceed as a result of the significant investments required to initiate the project. Investment barriers prevent the implementation of this alternative. Alternative #3: Electricity generation from the methane component of the extracted landfill gas The technical expertise resources in Brasil are not available to initiate electrical generation and as a result, this alternative presents a technological barrier. Further, as capital expenditures for landfill gas utilization systems are significantly higher than for landfill gas capture and flaring systems, there is an additional investment barrier associated with this alternative. As a result of the above analysis, the only plausible scenario is the continuation of the current scenario ie. landfill gas recovery not implemented. The project activity overcomes the stated barriers by utilizing revenues from the generation of CERs to undertake a project that would otherwise be unattractive and which has no regulatory driver for implementation. Step 4. Common practice analysis Sub-step 4a. Analyze other activities similar to the proposed project activity: With the exception of small demonstration pilot scale undertakings, landfill gas management systems are non-existent in Brasil. There are, however, several LFG management projects being filed under CDM with the local DNA, and this demonstrates the necessity of CER revenue for the implementation of this type of project. Sub-step 4b. Discuss any similar options that are occurring: Implementation of landfill gas capture and flaring systems in Brasil currently under development are reliant on revenues generated from the CER exchange mechanism under the CDM. Thus, these projects face similar barriers to implementation as the project activity. Step 5. Impact of CDM registration Once the proposed project activity is registered under CDM, the project will be entitled to proceed with the trade and and/or exchange of the generated Certified Emission Reductions (CERs) in the open market. The sale of CERs to interested parties will generate a revenue source that will leverage the project Internal Rate of Return (IRR) to a point considered to be attractive by its investors in a way that the project will become economically feasible. Therefore, the CDM registration will facilitate and allow the implementation of the proposed project activity and ensure its financial viability. As a consequence of this, real reductions in anthropogenic greenhouse gas emissions will be realized.

PROJECT DESIGN DOCUMENT FORM (CDM PDD) - Version 02 CDM – Executive Board page 12
This template shall not be altered. It shall be completed without modifying/adding headings or logo, format or font.
B.4. Description of how the definition of the project boundary related to the baseline methodology selected is applied to the project activity: The project boundary as related to the baseline methodology is delineated by the area of the Aurá Landfill. The project boundary as related to the project activity will constitute the same area and will include the gas extraction and combustion facility, where the landfill gas is destroyed. B.5. Details of baseline information, including the date of completion of the baseline study and the name of person (s)/entity (ies) determining the baseline: Date of Completion: The baseline study was completed on 15 November 2005. Detailed baseline information is included as Annex 3 of this document. Name of Entities Determining the Baseline: The baseline was determined by Conestoga Rovers & Associates Limited (project participant). Contact information is presented below: Frank A. Rovers, P. Eng. Frederick (Rick) A. Mosher, P. Eng. Edward A. McBean, Ph.D., P. Eng. Conestoga-Rovers & Associates Ltd. 651 Colby Drive Waterloo, ON Canada N2V 1C2 Telephone: +1-519-884-0510 Fax: +1-519-884-5256 http://www.CRAworld.com SECTION C. Duration of the project activity / Crediting period C.1 Duration of the project activity: C.1.1. Starting date of the project activity: The project is expected to be commissioned on 1 November 2006. C.1.2. Expected operational lifetime of the project activity: 10 years and 0 months. C.2 Choice of the crediting period and related information: C.2.1. Renewable crediting period C.2.1.1. Starting date of the first crediting period:

PROJECT DESIGN DOCUMENT FORM (CDM PDD) - Version 02 CDM – Executive Board page 13
This template shall not be altered. It shall be completed without modifying/adding headings or logo, format or font.
Not applicable. C.2.1.2. Length of the first crediting period: Not applicable. C.2.2. Fixed crediting period: C.2.2.1. Starting date: 1 November 2006 C.2.2.2. Length: 10 years and 0 months. SECTION D. Application of a monitoring methodology and plan D.1. Name and reference of approved monitoring methodology applied to the project activity: The approved monitoring methodology applied to this project activity is the ACM0001 – Consolidated Monitoring Methodology for Landfill Gas Project Activities. D.2. Justification of the choice of the methodology and why it is applicable to the project activity: ACM0001 was developed as a consolidated document that incorporates all previously-approved methodologies applicable to landfill gas activities where the baseline scenario is the partial or total atmospheric release of landfill gas. Scenarios contemplated by methodology ACM0001 include the case where the management of the LFG collected at the site includes direct flaring for emission reductions, which forms the basis of the project activity. This monitoring methodology is based on the direct measurement of the quantity of LFG captured, collected and destroyed by the LFG management system. The actual tonnage of methane emissions reduced by the project is calculated based on flow rate of the landfill gas, methane concentration, and destruction/conversion efficiency of the combustion equipment. The monitoring plan proposed by CRA provides for the continuous measurement of both LFG quantity and quality using a continuous flow meter and on-line LFG analyzer. The methane emissions reduced by the flare is determined based on the operating hours measured by a run-time meter. The destruction efficiency of the flare is directly correlated to the internal combustion temperature and the retention time in the unit.

PROJECT DESIGN DOCUMENT FORM (CDM PDD) - Version 02 CDM – Executive Board page 14
This template shall not be altered. It shall be completed without modifying/adding headings or logo, format or font.
D.2. 1. Option 1: Monitoring of the emissions in the project scenario and the baseline scenario The section was left blank on purpose. Option 2 was selected. D.2.1.1. Data to be collected in order to monitor emissions from the project activity, and how this data will be archived: ID number (Please use numbers to ease cross-referencing to D.3)
Data variable
Source of data
Data unit
Measured (m), calculated (c) or estimated (e)
Recording frequency
Proportion of data to be monitored
How will the data be archived? (electronic/ paper)
Comment
D.2.1.2. Description of formulae used to estimate project emissions (for each gas, source, formulae/algorithm, emissions units of CO2 equ.) The section was left blank on purpose. Option 2 was selected. D.2.1.3. Relevant data necessary for determining the baseline of anthropogenic emissions by sources of GHGs within the project boundary and how such data will be collected and archived : ID number (Please use numbers to ease cross-referencing to table D.3)
Data variable
Source of data
Data unit
Measured (m), calculated (c), estimated (e),
Recording frequency
Proportion of data to
be monitored
How will the data be archived? (electronic/
paper)
Comment

PROJECT DESIGN DOCUMENT FORM (CDM PDD) - Version 02 CDM – Executive Board page 15
This template shall not be altered. It shall be completed without modifying/adding headings or logo, format or font.
The section was left blank on purpose. Option 2 was selected. D.2.1.4. Description of formulae used to estimate baseline emissions (for each gas, source, formulae/algorithm, emissions units of CO2 equ.) The section was left blank on purpose. Option 2 was selected. D. 2.2. Option 2: Direct monitoring of emission reductions from the project activity (values should be consistent with those in section E). D.2.2.1. Data to be collected in order to monitor emissions from the project activity, and how this data will be archived: ID number (Please use numbers to ease cross-referencing
to table D.3)
Data variable Source of data Data unit
Measured (m),
calculated (c),
estimated (e),
Recording frequency
Proportion of data
to be monitore
d
How will the data be
archived? (electronic/
paper)
Comment
1. LFGtotal,y
Total amount of landfill gas
captured
On-Line LFG flow meter
m3 m Continuous 100% Daily: electronic Monthly:
paper
Measured by a flow meter
2. LFGflare,y
Total amount of landfill gas
flared
On-Line LFG flow meter
m3 m Continuous 100% Daily: electronic
Monthly: paper
Measured by a flow meter or calculated using flare efficiency from 1.
5. FE
Flare/combustion efficiency
Thermistors, Samples
% m/c (1) quarterly;
(2) continuously
100% Daily: electronic Monthly:
Paper
(1) Quarterly measurement of methane content of flare exhaust gas (2) Continuous measurement of operation time of flare (with temperature)
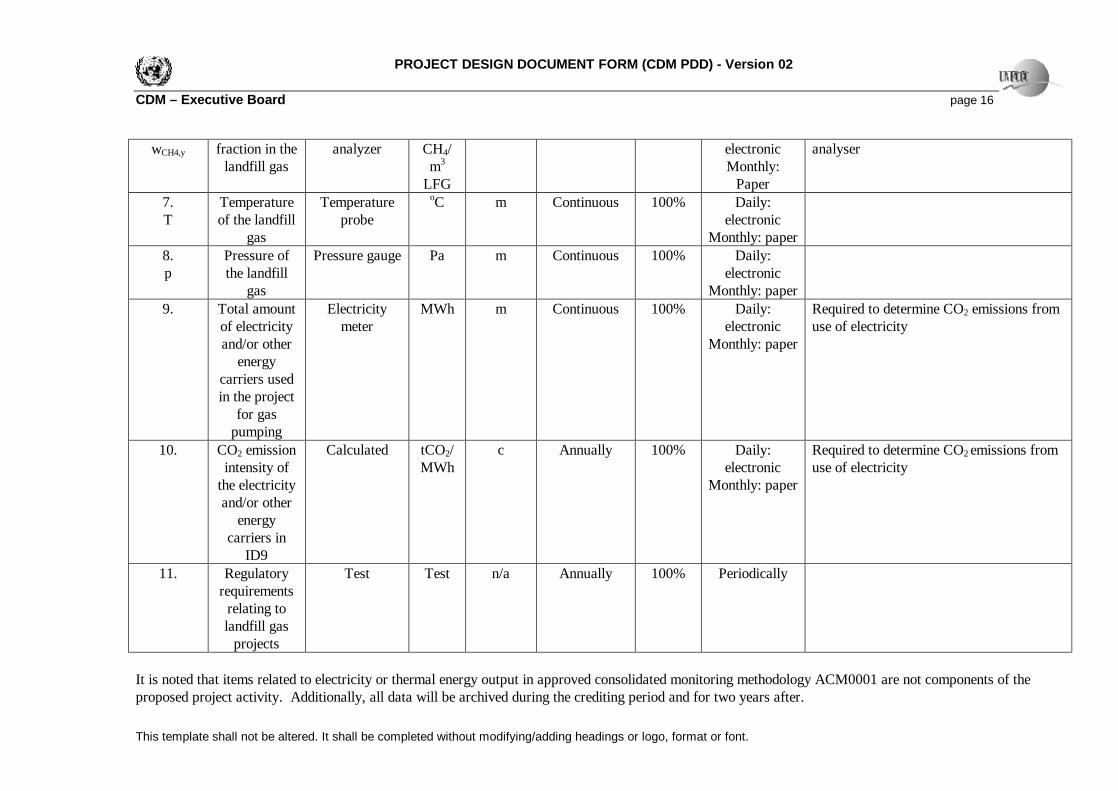
6. Methane On-Line LFG m3 m Continuous 100% Daily: Measured by continuous gas quality
PROJECT DESIGN DOCUMENT FORM (CDM PDD) - Version 02 CDM – Executive Board page 16
This template shall not be altered. It shall be completed without modifying/adding headings or logo, format or font.
wCH4,y fraction in the landfill gas
analyzer CH4/ m3
LFG
electronic Monthly:
Paper
analyser
7. T
Temperature of the landfill
gas
Temperature probe
oC m Continuous 100% Daily: electronic
Monthly: paper
8. p
Pressure of the landfill
gas
Pressure gauge Pa m Continuous 100% Daily: electronic
Monthly: paper
9. Total amount of electricity and/or other
energy carriers used in the project
for gas pumping
Electricity meter
MWh m Continuous 100% Daily: electronic
Monthly: paper
Required to determine CO2 emissions from use of electricity
10. CO2 emission intensity of
the electricity and/or other
energy carriers in
ID9
Calculated tCO2/MWh
c Annually 100% Daily: electronic
Monthly: paper
Required to determine CO2 emissions from use of electricity
11. Regulatory requirements
relating to landfill gas
projects
Test Test n/a Annually 100% Periodically
It is noted that items related to electricity or thermal energy output in approved consolidated monitoring methodology ACM0001 are not components of the proposed project activity. Additionally, all data will be archived during the crediting period and for two years after.

PROJECT DESIGN DOCUMENT FORM (CDM PDD) - Version 02 CDM – Executive Board page 17
This template shall not be altered. It shall be completed without modifying/adding headings or logo, format or font.
D.2.2.2. Description of formulae used to calculate project emissions (for each gas, source, formulae/algorithm, emissions units of CO2 equ.): Landfill gas not captured by the landfill gas collection and flaring system cannot be monitored, as this emission is diffused over the landfill. The amount of landfill gas collected and destroyed by combustion can be monitored at a centralised location using a flow meter. Project emissions are thus comprised of the quantity of methane collected and not flared due to flaring inefficiency, and this amount is subtracted from the measured amount of collected methane. The overall flaring efficiency of hydrocarbons for an enclosed flare is upwards of 99.99%. The total amount of methane destroyed by the flare in a given period is calculated as: MDproject = [LFGflare (2.) x wCH4 (6.) x DCFCH4 x FE (5.)] Where: MDproject,y = methane destroyed during a specified monitoring period (tonnes of CH4) LFGflare = average flow of LFG collected during specified monitoring period t in m3/t wCH4= percentage by volume of CH4 in LFG (m3 CH4/m3 LFG) DCFCH4 =methane density at standard pressure (1 atm) and temperature (0°C ) conditions, 0.0007168 tonnes/m3 , as per consolidated methodology ACM0001 FE = destruction efficiency of the flare (%) D.2.3. Treatment of leakage in the monitoring plan D.2.3.1. If applicable, please describe the data and information that will be collected in order to monitor leakage effects of the project activity ID number (Please use numbers to ease cross-referencing to table D.3)
Data variable
Source of data Data
unit
Measured (m), calculated (c) or estimated (e)
Recording frequency
Proportion of data to be monitored
How will the data be archived? (electronic/ paper)
Comment

PROJECT DESIGN DOCUMENT FORM (CDM PDD) - Version 02 CDM – Executive Board page 18
This template shall not be altered. It shall be completed without modifying/adding headings or logo, format or font.
No leakage effects need to be accounted under methodology ACM0001. D.2.3.2. Description of formulae used to estimate leakage (for each gas, source, formulae/algorithm, emissions units of CO2 equ.) No leakage effects need to be accounted under methodology ACM0001. D.2.4. Description of formulae used to estimate emission reductions for the project activity (for each gas, source, formulae/algorithm, emissions units of CO2 equ.) The following formulae will be used to estimate emission reductions for the project activity. ERy = (MD project,y - MDreg,y) * GWPCH4 + EGy * CEFelectricity,y + ET * CEFthermal,y Where: • ERy are the emission reductions, measured in tCO2e; • MDproject,y is the amount of methane actually destroyed/combusted during time period t, measured in tCH4; • MDreg,y is the amount of methane that would have been destroyed/combusted during time period t in the absence of the project activity, measured in tCH4; • GWPCH4 is the approved Global Warming Potential value for methane, 21 tCO2e/tCH4; • EGy is net quantity of electricity displaced during a given period t, measured in MWh; • CEFelectricity,y is the CO2 emissions intensity of the electricity displaced, measured in tCO2e/MWh. • ET is the quantity of thermal energy displaced, measured in TeraJoules (TJ); • CEFthermal,y is the CO2 emissions intensity of the thermal energy displaced, measured in tCO2e/TJ. It is noted that while the terms for electricity and thermal energy have been included to be consistent with the overall formulation stated in ACM0001, energy displacement is not a component of the proposed project activity. As a result, the above equation reduces to the following form for the project activity: ERy = (MD project,y - MDreg,y) * GWPCH4 Considering that there is no regulatory or contractual requirement determining MDreg, an adjustment factor (AF) is used in the Aurá Landfill project:

PROJECT DESIGN DOCUMENT FORM (CDM PDD) - Version 02 CDM – Executive Board page 19
This template shall not be altered. It shall be completed without modifying/adding headings or logo, format or font.
MDreg = MDproject * AF The methane destroyed by the project activity during a given time period can be determined by the following: monitoring the quantity of methane actually flared and LFG used to generate electricity and to produce thermal energy, and is given by: MDproject = MDflared + MDelectricity + MDthermal
For the proposed project activity, MDelectricity = MDthermal =0, as there is no energy displacement component of the project. As a result, the total actual quantity of methane captured and destroyed will be metered ex post once the project activity is operational, and: MDproject = MDflared And, MDflared,y = LFGflare,y * wCH4,y * DCH4 * FE Where: • MDflared,y is the quantity of methane destroyed by flaring in a given time period t, measured in tCH4; • LFGflare is the quantity of landfill gas flared during a given time period t, measured in cubic meters (m3); • wCH4 is the average methane fraction of the landfill gas as measured during the given time period t and expressed as a fraction of CH4 volume per LFG
volume (m3 CH4 / m3 of LFG); • FE is the flare efficiency (the fraction of the methane destroyed); • DCH4 is the methane density, expressed in tonnes of methane per cubic meter of methane (tCH4/m3CH4), and measured at STP (0 degree Celsius and 1.013
bar), which is 0.0007168 tCH4/m3CH4 (as per consolidated methodology ACM0001)
D.3. Quality control (QC) and quality assurance (QA) procedures are being undertaken for data monitored Data (Indicate table and ID number e.g. 3.-1.; 3.2.)
Uncertainty level of data (High/Medium/Low)
Explain QA/QC procedures planned for these data, or why such procedures are not necessary.

PROJECT DESIGN DOCUMENT FORM (CDM PDD) - Version 02 CDM – Executive Board page 20
This template shall not be altered. It shall be completed without modifying/adding headings or logo, format or font.
1. (Table D.2.2.1) Low Calibration of equipment as per manufacturer specifications to ensure validity of data measured. 2. (Table D2.2.1) Low Calibration of equipment as per manufacturer specifications to ensure validity of data measured. 5.(Table D 2.2.1) Medium Regular maintenance to ensure optimal operation of controlled combustion environment. 6. (Table D2.2.1) Low Calibration of equipment as per manufacturer specifications to ensure validity of data measured. 7. (Table D2.2.1) Low Calibration of equipment as per manufacturer specifications to ensure validity of data measured. 8. (Table D2.2.1) Low Calibration of equipment as per manufacturer specifications to ensure validity of data measured. 9. (Table D2.2.1) Low Calibration of equipment as per manufacturer specifications to ensure validity of data measured.
10. (Table D2.2.1) Low Calculated value following from ID9. 11. (Table D2.2.1) Low Not applicable.
D.4 Please describe the operational and management structure that the project operator will implement in order to monitor emission reductions and any leakage effects, generated by the project activity All continuously measured parameters (LFG flow, CH4 concentration, flare temperature, and flare operating hours), will be recorded electronically via a datalogger, which will have the capability to aggregate and print the collected data at the frequencies as specified above. Before commencement of the O&M phase, a training and quality control program will be created to ensure that good management practices are ensured and implemented by all project operating personnel in terms of record-keeping, equipment calibration, overall maintenance, and procedures for corrective action. An operations manual will be developed for the operating personnel. The procedures for filing data and calculations to be performed by the LFG management operator will be included in a daily log to be placed in the main control room. D.5 Name of person/entity determining the monitoring methodology:
The monitoring methodology for the project is determined by Conestoga-Rovers & Associates Limited. The details of the monitoring plan are provided in Annex 4 and contact information is presented below: Frank A. Rovers, P. Eng. Frederick (Rick) A. Mosher, P. Eng. Edward A. McBean, Ph.D., P. Eng. Conestoga-Rovers & Associates Ltd.
PROJECT DESIGN DOCUMENT FORM (CDM PDD) - Version 02 CDM – Executive Board page 21
This template shall not be altered. It shall be completed without modifying/adding headings or logo, format or font.
651 Colby Drive Waterloo, ON Canada N2V 1C2 Telephone: +1-519-884-0510 Fax: +1-519-884-5256 http://www.CRAworld.com


PROJECT DESIGN DOCUMENT FORM (CDM PDD) - Version 02 CDM – Executive Board page 23
This template shall not be altered. It shall be completed without modifying/adding headings or logo, format or font.
SECTION E. Estimation of GHG emissions by sources E.1. Estimate of GHG emissions by sources: It is estimated that a total of 4,848,788 tonnes of Municipal Solid Waste (MSW) was collected at the Aurá Landfill from 1990 to 2005. The Site is currently accepting approximately 1,200 tonnes/day. The total methane generation at the site has been estimated based on the waste tonnage of the landfill using a United States Environmental Protection Agency (USEPA) first-order kinetic model for landfill gas: Gi=(Mi)x (k) x (Lo/1000) exp -(k x t) Where, Gi=emission rate from the ith section of waste (m3 CH4/year) k=CH4 generation rate (1/year) Lo=CH4 generation potential (m3 CH4/tonne of refuse) Mi=mass of refuse in the ith section (tonnes) ti=age of the ith section of waste (years) The following USEPA default input parameters (U.S. Environmental Protection Agency, 1998, User’s Manual – Landfill Gas Emissions Model) were used to estimate methane emissions at the Aurá Landfill: k = 0.05 year-1, Lo = 170 m3
methane/tonne. The assumptions used to calculate methane emissions are presented as follows: Lag phase of methane production = 1 year; Methane content in LFG = 50%; LFG collection efficiency = 60%; and Density of methane = 0.0007168 tonnes/m3 (as per consolidated methodology ACM0001) Table 1 (below) presents the waste tonnage accepted at Phase A of the Aurá landfill and the methane emission estimates based on the USEPA model. It is noted that the values presented in Table 1 represent modelled quantities of methane generation for the stated time period. The actual amount of GHGs reduced will be calculated based on the actual quantities of LFG collected and flared. Table 1: Methane Emissions Estimate for the Aurá Landfill
Waste Emissions Quantity tonnes CH4/year
Year (tonnes) 1990 61,214 0.0 1991 255,937 373.0 1992 263,852 1,914.1 1993 272,013 3,428.4 1994 280,426 4,918.5 1995 289,099 6,387.2
PROJECT DESIGN DOCUMENT FORM (CDM PDD) - Version 02 CDM – Executive Board page 24
This template shall not be altered. It shall be completed without modifying/adding headings or logo, format or font.
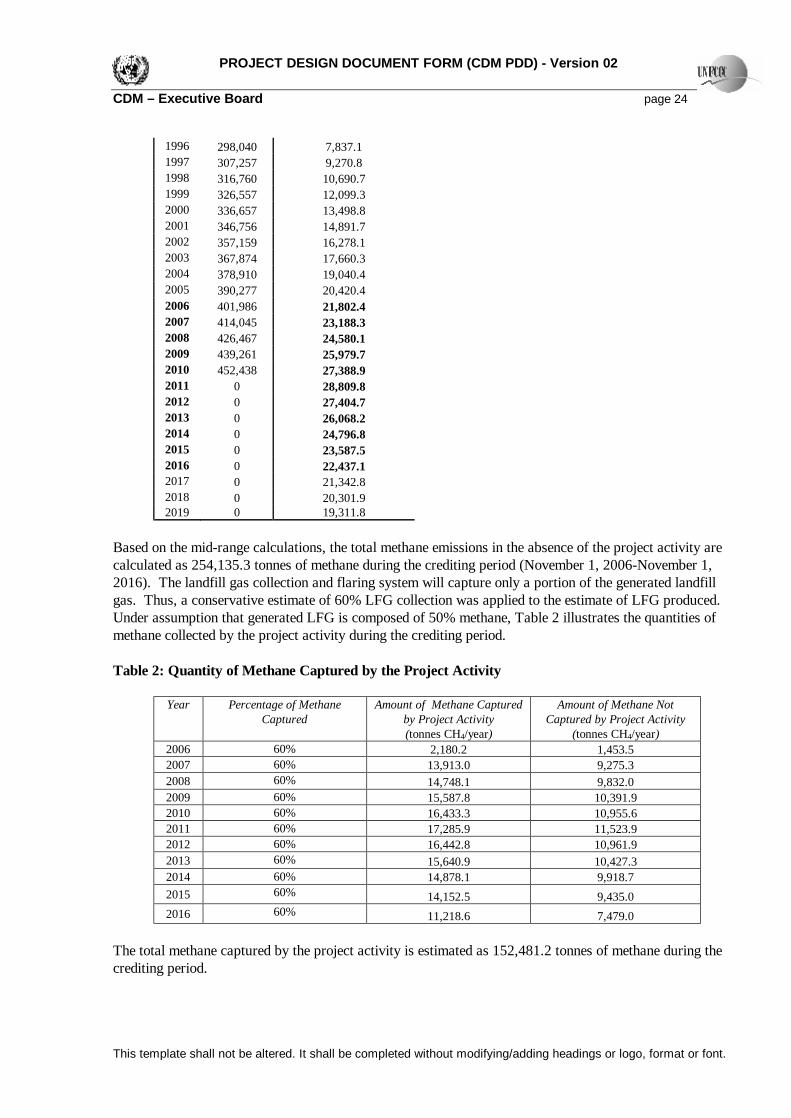
1996 298,040 7,837.1 1997 307,257 9,270.8 1998 316,760 10,690.7 1999 326,557 12,099.3 2000 336,657 13,498.8 2001 346,756 14,891.7 2002 357,159 16,278.1 2003 367,874 17,660.3 2004 378,910 19,040.4 2005 390,277 20,420.4 2006 401,986 21,802.4 2007 414,045 23,188.3 2008 426,467 24,580.1 2009 439,261 25,979.7 2010 452,438 27,388.9 2011 0 28,809.8 2012 0 27,404.7 2013 0 26,068.2 2014 0 24,796.8 2015 0 23,587.5 2016 0 22,437.1 2017 0 21,342.8 2018 0 20,301.9 2019 0 19,311.8
Based on the mid-range calculations, the total methane emissions in the absence of the project activity are calculated as 254,135.3 tonnes of methane during the crediting period (November 1, 2006-November 1, 2016). The landfill gas collection and flaring system will capture only a portion of the generated landfill gas. Thus, a conservative estimate of 60% LFG collection was applied to the estimate of LFG produced. Under assumption that generated LFG is composed of 50% methane, Table 2 illustrates the quantities of methane collected by the project activity during the crediting period. Table 2: Quantity of Methane Captured by the Project Activity
Year Percentage of Methane Captured
Amount of Methane Captured by Project Activity (tonnes CH4/year)
Amount of Methane Not Captured by Project Activity
(tonnes CH4/year) 2006 60% 2,180.2 1,453.5 2007 60% 13,913.0 9,275.3 2008 60% 14,748.1 9,832.0 2009 60% 15,587.8 10,391.9 2010 60% 16,433.3 10,955.6 2011 60% 17,285.9 11,523.9 2012 60% 16,442.8 10,961.9 2013 60% 15,640.9 10,427.3 2014 60% 14,878.1 9,918.7 2015 60% 14,152.5 9,435.0 2016 60% 11,218.6 7,479.0
The total methane captured by the project activity is estimated as 152,481.2 tonnes of methane during the crediting period.

PROJECT DESIGN DOCUMENT FORM (CDM PDD) - Version 02 CDM – Executive Board page 25
This template shall not be altered. It shall be completed without modifying/adding headings or logo, format or font.
Emissions from the project activity are expected to be negligible. The use of a high-efficiency enclosed drum flare has demonstrated capability to destroy in excess of 99.99% of hydrocarbons in the controlled combustion environment. As required, uncombusted methane will be measured and accounted for according to the requirements set forth in methodology ACM0001, but quantities of uncombusted methane are expected to be negligible. For the purpose of estimating project activity emissions, a destruction efficiency of 99.99% was applied to the quantities of methane captured (Table 2). Project activity emissions are summarized in Table 3. Table 3: Emissions Resulting from Uncombusted Methane in the Project Activity
Year Destruction Efficiency of Enclosed Flare
Amount of Uncombusted Methane
(tonnes CH4/year)
Project Activity Emissions (tonnes CO2e/year)
2006 99.99% 0.22 4.58 2007 99.99% 1.39 29.22 2008 99.99% 1.47 30.97 2009 99.99% 1.56 32.73 2010 99.99% 1.64 34.51 2011 99.99% 1.73 36.30 2012 99.99% 1.64 34.53 2013 99.99% 1.56 32.85 2014 99.99% 1.49 31.24 2015 99.99% 1.42 29.72 2016 99.99% 1.12 23.56
The only source of project activity emission is uncombusted methane. As a result, the total emissions attributed to the project activity are estimated as 320.2 tonnes CO2e over the duration of the crediting period, and E.1=320.2 tonnes CO2e. E.2. Estimated leakage: No leakage effects need to be accounted under methodology ACM0001 (E.2=0). However, methodology ACM0001 clearly states that the CO2 emission intensity of the electricity consumed by the project activity must be taken into account. In the project activity, electrical consumption is associated with the blower system used to draw landfill gas to the enclosed drum flare, and the total electrical requirement of this blower system is 37 kW. This corresponds to electrical consumption of 327 MWh/year. Electricity production in Brasil is largely comprised of hydroelectric, with approximately 97% of total energy coming from this sector (http://countrystudies.us/brazil/76.htm). According to the International Panel on Climate Change (IPCC; http://www.ipcc.ch/), the specific emission factor for hydroelectric power is 0 kg CO2/MWh. For purposes of assessing a grid emission factor for Brasil, the remaining 3% of electrical production is considered to be derived from natural gas (http://countrystudies.us/brazil/76.htm). According to the IPCC, the specific emission factor for natural gas is 15.3 tonnes C/TJ, or 202 kg CO2/MWh. An estimate of the grid emission factor for Brasil is thus calculated as 6.05 kg CO2/MWh.

PROJECT DESIGN DOCUMENT FORM (CDM PDD) - Version 02 CDM – Executive Board page 26
This template shall not be altered. It shall be completed without modifying/adding headings or logo, format or font.
Table 4 illustrates the total emissions resulting from electrical consumption in the project activity during the crediting period. Table 4: Emissions Resulting from Electrical Consumption in the Project Activity
Year Electrical Consumption in Project Activity
(MWh/year)
Emissions Resulting from Electrical Consumption
(tonnes of CO2/year) 2006 327 0.33 2007 327 1.98 2008 327 1.98 2009 327 1.98 2010 327 1.98 2011 327 1.98 2012 327 1.98 2013 327 1.98 2014 327 1.98 2015 327 1.98 2016 327 1.65
The total emissions resulting from electrical consumption in the project activity is estimated as 19.8 tonnes CO2 over the crediting period, and E.2=19.8 tonnes CO2. E.3. The sum of E.1 and E.2 representing the project activity emissions: Table 5 presents the total project activity emissions, attributable to uncombusted methane release and emissions associated with electrical consumption during the crediting period. Table 5: Total Project Activity Emissions
Year Project Activity Emissions from Uncombusted
Methane (tonnes CO2e/year)
Project Activity Emissions from Electrical Consumption
(tonnes of CO2/year)
Total Emissions Resulting from the Project Activity
(tonnes of CO2/year)
2006 4.58 0.33 4.9 2007 29.22 1.98 31.2 2008 30.97 1.98 33.0 2009 32.73 1.98 34.7 2010 34.51 1.98 36.5 2011 36.30 1.98 38.3 2012 34.53 1.98 36.5 2013 32.85 1.98 34.8 2014 31.24 1.98 33.2 2015 29.72 1.98 31.7 2016 23.56 1.65 25.2
The sum of project activity emissions during the crediting period is estimated as 340.0 tonnes CO2e, and E.3=340.0 tonnes CO2e. E.4. Estimated anthropogenic emissions by sources of greenhouse gases of the baseline:

PROJECT DESIGN DOCUMENT FORM (CDM PDD) - Version 02 CDM – Executive Board page 27
This template shall not be altered. It shall be completed without modifying/adding headings or logo, format or font.
Based on the model projections of total emissions illustrated in E.1, the total methane emission in the baseline scenario (no collection or destruction of methane at the site) is 5,336,841.3 tonnes of CO2e. Multiplied by an estimated collection efficiency of 60%, this results in an emissions reduction of 3,202,104.8 tonnes of CO2e as a result of the project activity, and E.4=3,202,104.8 tonnes of CO2e. E.5. Difference between E.4 and E.3 representing the emission reductions of the project activity: The total emission reduction of the project activity is the difference between E.4 and E.3 and results in an estimated emission reduction of 3,201,764.8 tonnes of CO2e in the crediting period. E.6. Table providing values obtained when applying formulae above: Table 6 summarizes the net emission reduction associated with the project activity. Table 6: Summary of Emission Reductions by Project Activity
Year Estimation of project activity Emission
Reductions (tonnes of CO2e)
Estimation of baseline Emission
Reductions (tonnes of CO2e)
Estimation of leakage and
project activity emissions
(tonnes of CO2e)
Estimation of Net Emission Reductions
(tonnes of CO2e)
2006 45,784.6 0 4.9 45,779.7 2007 292,172.6 0 31.2 292,141.4 2008 309,709.3 0 33.0 309,676.3 2009 327,344.2 0 34.7 327,309.5 2010 345,100.1 0 36.5 345,063.6 2011 363,003.5 0 38.3 362,965.2 2012 345,299.2 0 36.5 345,262.7 2013 328,459.3 0 34.8 328,424.5 2014 312,439.7 0 33.2 312,406.5 2015 297,202.5 0 31.7 297,170.8 2016 235,589.8 0 25.2 235,564.6
Total (tonnes of CO2e) 3,202,104.8 0 340.0 3,201,764.8
SECTION F. Environmental impacts F.1. Documentation on the analysis of the environmental impacts, including transboundary impacts: There are expected to be no significant environmental impacts due to the project activity. All condensate generated by the project activity will be collected and sanitary water will be properly collected and treated to comply with local environmental regulations. Emissions from the flare include the carbon dioxide component of landfill gas, but this carbon dioxide is considered to be a natural product of the carbon cycle. In the combustion of landfill gas, carbon dioxide is additionally produced, but this is also considered to be part of the natural carbon cycle and not of anthropogenic origin. There is minimal visual impact from the flare, and noise and vibration from the blower and flare will be limited to the localized site.

PROJECT DESIGN DOCUMENT FORM (CDM PDD) - Version 02 CDM – Executive Board page 28
This template shall not be altered. It shall be completed without modifying/adding headings or logo, format or font.
There will be no adverse environmental impact to the Curuperé Creek from the project activity. All condensate generated by the project activity will be collected and sanitary water will be properly collected and treated to comply with local environmental regulations. No liquid streams from the project activity will enter the creek system. Additionally, operation of the landfill gas collection and flaring system will reduce subsurface migration of landfill gas and the associated impacts on the river system. There is a positive environmental impact on the environment due to the project activity. Landfill gas emissions are decreased, reducing greenhouse gas emissions and impacts to localized air pollution. Odour will be diminished at local receptors. Operationally, proper management of the landfill gas will reduce the potential for landfill fires and the associated release of incomplete combustion products. Further, the driving force for subsurface migration of landfill gas and landfill gas components is minimized, protecting adjacent buildings and water bodies. F.2. If environmental impacts are considered significant by the project participants or the host Party, please provide conclusions and all references to support documentation of an environmental impact assessment undertaken in accordance with the procedures as required by the host Party: There are no significant environmental impacts resulting from the project activity. SECTION G. Stakeholders’ comments G.1. Brief description how comments by local stakeholders have been invited and compiled: CRA is in the process of inviting all stakeholders required by the Brasilian DNA to attend a public meeting that will be held in Belém in late December, when CRA will present the project to the public and official authorities and invite questions and comments. G.2. Summary of the comments received: The summary will be provided when CRA receives the comments from stakeholders. G.3. Report on how due account was taken of any comments received: Due account will be taken as CRA receives comments from stakeholders.
PROJECT DESIGN DOCUMENT FORM (CDM PDD) - Version 02 CDM – Executive Board page 29
This template shall not be altered. It shall be completed without modifying/adding headings or logo, format or font.
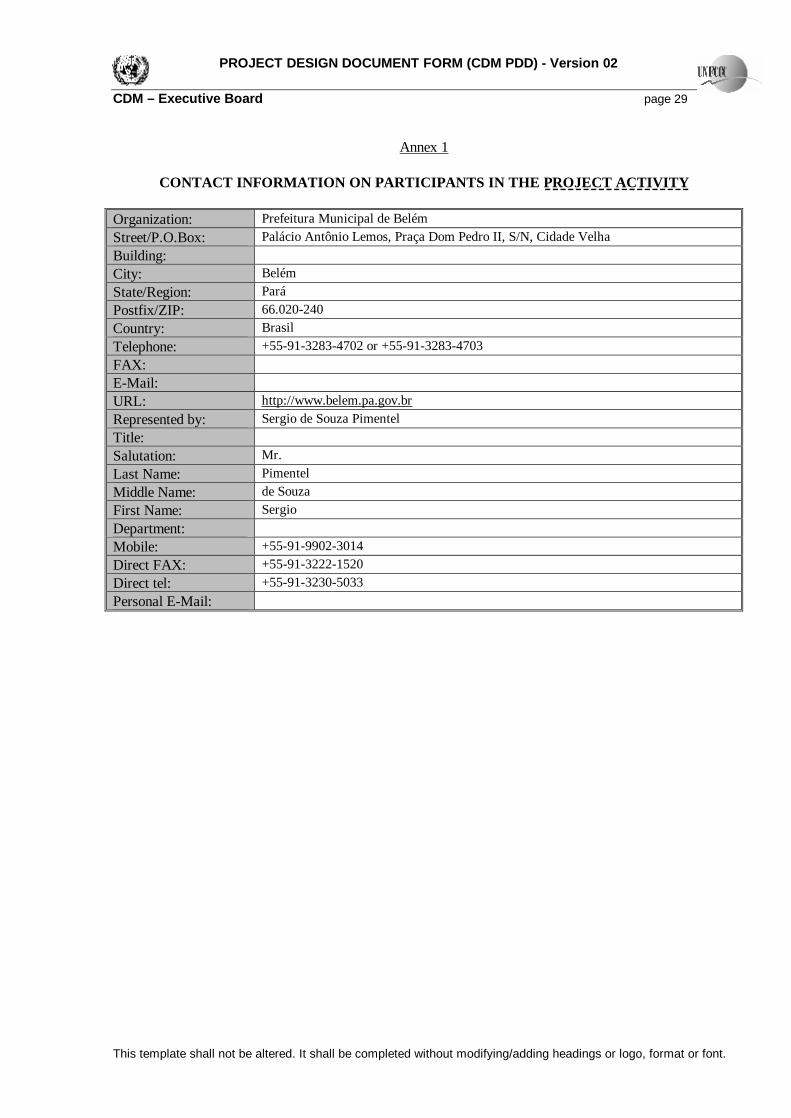
Annex 1
CONTACT INFORMATION ON PARTICIPANTS IN THE PROJECT ACTIVITY Organization: Prefeitura Municipal de Belém Street/P.O.Box: Palácio Antônio Lemos, Praça Dom Pedro II, S/N, Cidade Velha Building: City: Belém State/Region: Pará Postfix/ZIP: 66.020-240 Country: Brasil Telephone: +55-91-3283-4702 or +55-91-3283-4703 FAX: E-Mail: URL: http://www.belem.pa.gov.br Represented by: Sergio de Souza Pimentel Title: Salutation: Mr. Last Name: Pimentel Middle Name: de Souza First Name: Sergio Department: Mobile: +55-91-9902-3014 Direct FAX: +55-91-3222-1520 Direct tel: +55-91-3230-5033 Personal E-Mail:
PROJECT DESIGN DOCUMENT FORM (CDM PDD) - Version 02 CDM – Executive Board page 30
This template shall not be altered. It shall be completed without modifying/adding headings or logo, format or font.
Organization: Conestoga-Rovers & Associados Engenharia S/A Street/P.O.Box: Rua Mário Enzio Pasqualucci, 287 Building: City: São Paulo State/Region: São Paulo Postfix/ZIP: 04711-090 Country: Brasil Telephone: 55-11-5183-3404 ext 1022 FAX: 55-11-5183-3404 ext 1030 E-Mail: URL: http://www.CRAworld.com Represented by: José Manuel Mondelo Title: Principal and Senior Engineer Salutation: Mr. Last Name: Mondelo Middle Name: Manuel First Name: José Department: Mobile: Direct FAX: Direct tel: Personal E-Mail: [email protected]

PROJECT DESIGN DOCUMENT FORM (CDM PDD) - Version 02 CDM – Executive Board page 31
This template shall not be altered. It shall be completed without modifying/adding headings or logo, format or font.
Organization: BGC International Street/P.O.Box: One America Square Building: City: London State/Region: Postfix/ZIP: EC3N 2LS Country: United Kingdom Telephone: +44 20 7894 7000 FAX: +44 20 7894 7553 E-Mail: URL: Represented by: General Counsel, BGC International (cc Steve Drummond, Managing Director,
CO2e.com LLC) Title: Salutation: Last Name: Middle Name: First Name: Department: Mobile: Direct FAX: Direct tel: Personal E-Mail:

PROJECT DESIGN DOCUMENT FORM (CDM PDD) - Version 02 CDM – Executive Board page 32
This template shall not be altered. It shall be completed without modifying/adding headings or logo, format or font.
Annex 2
INFORMATION REGARDING PUBLIC FUNDING There is no public funding.

PROJECT DESIGN DOCUMENT FORM (CDM PDD) - Version 02 CDM – Executive Board page 33
This template shall not be altered. It shall be completed without modifying/adding headings or logo, format or font.
Annex 3
BASELINE INFORMATION The baseline scenario for the project activity is the uncontrolled release of landfill gas to the atmosphere. The total estimated emissions of landfill gas to the atmosphere in the baseline scenario are estimated as 5,336,841.3 tonnes of CO2e during the crediting period. There are presently no measures in place to reduce methane emissions and there are no current or pending regulations that would require the site to reduce emissions.
PROJECT DESIGN DOCUMENT FORM (CDM PDD) - Version 02 CDM – Executive Board page 34
This template shall not be altered. It shall be completed without modifying/adding headings or logo, format or font.
Annex 4
MONITORING PLAN
1.0 Introduction and Objectives The three primary purposes of the monitoring plan are: • Monitor indicators of environmental impacts and sustainable development; • To collect the necessary system data required for the determination and validation of certified
emissions reductions (CERs); and • To demonstrate successful compliance with established operating and performance criteria for
the system, and to verify that the CERs have been generated. The operational data that is collected for the system will be used to support the periodic report that will be required for the auditing and validation of CERs. The monitoring plan discussed herein is designed to meet or better the UNFCCC requirements. The monitoring plan for environmental impacts and sustainable development is discussed in Section 2. The routine system monitoring program required for the determination and validation of CERs is discussed in Section 3, while the additional system data that is collected to ensure the safe, correct, and efficient operation of the landfill gas management system is discussed in Section 4. Coupled with an operations and maintenance manual that is generally developed for a system, expected performance guidelines in accordance with the data collection procedures described below will be provided with trigger levels that would be indicative of a need for any follow-up assessment and possible remedial response measures. 2.0 Environmental Impact and Sustainable Development
Environmental impacts and sustainable development factors will be assessed through a number of economic and social indicators. Economic Development: Job creation: an incremental number of jobs will be created at the site by the implementation of the project activity, as related to landfill gas system operations and monitoring. Monthly employment records will be used to monitor this indicator. Income generation: an incremental wage increase will be realized by landfill gas management facility personnel as compared to alternative employment. Hourly wages will be used to assess this indicator, and this data will be compared to local employment data. Social and Environmental Impact: Odour: the impact of odour on neighbours is expected to decrease as a result of the landfill gas management system and will be monitored through the number of odour reports made by

PROJECT DESIGN DOCUMENT FORM (CDM PDD) - Version 02 CDM – Executive Board page 35
This template shall not be altered. It shall be completed without modifying/adding headings or logo, format or font.
neighbouring residents. All odour reports will be noted and catalogued by landfill gas management system operators. Subsurface migration of landfill gas: the driving force for subsurface (ie. through the soil) migration of landfill gases is pressure build-up in the landfill mass. Implementation of the project activity will induce vacuum in the landfill mass, inhibiting off-site subsurface migration of landfill gas. Monitoring of the migration control system aspects of the system will be undertaken by monitoring the applied vacuum at the perimeter wells of the landfill gas collection wellfield. Landfill safety: implementation of the landfill gas management system is expected to decrease the potential for adverse landfill impacts such as landfill fires. This will be monitored by assessing the number of incidents at the landfill related to fires or other concerns. Technology transfer: the project activity represents an example of technology transfer. Operation of the constructed landfill gas management system will complete the chief aspect of monitoring requirements for this performance indicator. During and after commissioning of the system, a bi-annual training program will be conducted to update operators on new or changing technology as related to the project activity. A further measure of technology transfer will be the communication of the project activity results at conferences or in the technical literature.
3.0 Monitoring Work Program The landfill gas monitoring program is a relatively simple, straight forward program designed to collect system operating data required to safely operate the system and for the verification of CERs. This data is collected in real time, and will provide a continuous record that is easy to monitor, review, and validate. The following sections will outline and discuss the following key elements of the program:
• Flow measurement; • Gas quality measurements; • Data records; and • Data assessment and reporting.
3.1 Flow Measurement The flow of landfill gas collected by the system and subsequently flared or utilized is measured via a flow measuring device suitable for measuring the velocity and volumetric flow of a gas. Two such common examples are an annubar or an orifice plate. The flow measurements are taken within the piping itself, and the flow sensors are connected to a transmitter that is capable of collecting and sending continuous data to a recording device such as a datalogger. The flow sensors are calibrated according to a specified temperature, pressure and composition of the gas, thus the flow actually measured must be corrected to according to actual temperature, pressure, and composition, thus density, of the gas measured. The equipment selected will allow dynamic compensation for these parameters, normalized to a standard temperature, pressure, and gas composition. For reporting purposes, the flows are generally required to be normalized to 0°C and 1 atm at standard gas composition of 50% methane and carbon dioxide each by volume.

PROJECT DESIGN DOCUMENT FORM (CDM PDD) - Version 02 CDM – Executive Board page 36
This template shall not be altered. It shall be completed without modifying/adding headings or logo, format or font.
Specific calibration procedures are dependent on the actual equipment selected, however calibration of the sensors is required on a regular basis to ensure the quality and validity of the data. The accuracy of a flow meter is dependent on the design of the equipment, and the specific type of sensor used, however equipment is available that will provide a minimum accuracy of +/- 2% by volume. Again dependent on the equipment selected, the measured flow is aggregated approximately once per second. All data is that is collected will be recorded for the permanent record. Both electronic and hard copies of the data will be maintained for auditing purposes, and for use in the calculation of CERs.
3.2 Gas Quality
The two parameters that are most pertinent to the validation of CERs, as well as the safe and efficient operation of the system are the concentration of methane and oxygen in the gas stream. These two parameters are measured via a common sample line that is run to the main collection system piping, and measured in real time by two separate sensors, one each for methane and oxygen. Although compensation for temperature and pressure is not required for the methane and oxygen sensors, the sensors are designed to operate within specified temperature and pressure conditions. Again, specific calibration procedures are dependent on the actual equipment selected, however calibration of the sensors is required on a regular basis to ensure the quality and validity of the data. Regular calibration of the equipment is especially important, as the accuracy of the methane and oxygen sensors is greatest within the expected range of the gas stream to be measured. Equipment is readily available that will provide an accuracy of at least +/- 1% by volume. Dependent on the equipment selected, compositions are aggregated approximately once per second. 3.3 Uncombusted Methane The flare efficiency will be monitored via quarterly measurement of uncombusted methane at stack discharge. Grab samples of the exhaust gas will be obtained and sent for analysis of methane.
3.4 Data Records Data collected from each of the parameter sensors is transmitted directly to an electronic database from which the CER quantity calculations may be carried out, and a hard copy backup of the data may be printed. Backup of the data electronically may be conducted on a daily basis, and hard copy data may be printed weekly or monthly. As a back up would be produced separate from the main recording system, no more than one day of data at a time would ever be lost due to a system malfunction. Calibration records will be kept for all instrumentation.
3.5 Data Assessment and Reporting Assessment of the flow and composition data described above coupled with the operating hours of the flare and flare destruction efficiency are used to determine the quantity of CERs generated.
PROJECT DESIGN DOCUMENT FORM (CDM PDD) - Version 02 CDM – Executive Board page 37
This template shall not be altered. It shall be completed without modifying/adding headings or logo, format or font.
The destruction efficiency of the flare is a function of the internal combustion temperature and resident holding time, which are generally measured by the flare system controller, and recorded for auditing purposes. Extensive technical documentation is available that documents the destructive efficiency of the enclosed drum flares that will be used, subject to the flow rate and combustion temperature verification. Destruction efficiency will also be assessed periodically through measurement of uncombusted methane emissions. As discussed in Section 2.1, flow data is normalized to standard temperature, pressure, and composition for reporting purposes. The data will be compiled and assessed to produce the required quantification and validation. The annual monitoring report will contain the data required for the validation of the CERs, and additionally may contain operational data from the collection system and flaring system described below to illustrate that the system is well maintained and operating at peak efficiency. Records of regular maintenance performed will also be a component of the annual report.
4.0 Related Monitoring Additional operational monitoring of the landfill gas collection wellfield is conducted in order to optimize the system and ensure that it is operating both correctly and efficiently. Periodic adjustments to the extraction wells will be required to optimize the collection system effectiveness. Such collection field adjustments are undertaken made based upon a review of the well performance history considered within the context of the overall field operation in order to maximize the collection of methane balanced against the minimization of any oxygen in the system which could introduce unsafe operating conditions. Monitoring at each extraction well will consist of the following parameters: valve position, individual well flow, individual well vacuum, and composition of the gas collected, i.e., methane, carbon dioxide, and oxygen, using a portable measuring device. At such time as a landfill gas facility is designed and commissioned, a specific monitoring plan tailored to the actual utilization technology selected will be developed for this system.
- - - - -