clean development mechanism project design document … cogeneration... · clean development...
TRANSCRIPT

PROJECT DESIGN DOCUMENT FORM (CDM-SSC-PDD) - Version 03
CDM – Executive Board
CLEAN DEVELOPMENT MECHANISM
PROJECT DESIGN DOCUMENT FORM (CDM-SSC-PDD)
Version 03 - in effect as of: 22 December 2006
CONTENTS
A. General description of the small scale project activity
B. Application of a baseline and monitoring methodology
C. Duration of the project activity / crediting period
D. Environmental impacts
E. Stakeholders’ comments
Annexes
Annex 1: Contact information on participants in the proposed small scale project activity
Annex 2: Information regarding public funding
Annex 3: Baseline information
Annex 4: Monitoring Information

PROJECT DESIGN DOCUMENT FORM (CDM-SSC-PDD) - Version 03
CDM – Executive Board
Revision history of this document
Version Number
Date Description and reason of revision
01 21 January
2003
Initial adoption
02 8 July 2005 • The Board agreed to revise the CDM SSC PDD to reflect
guidance and clarifications provided by the Board since
version 01 of this document.
• As a consequence, the guidelines for completing CDM SSC
PDD have been revised accordingly to version 2. The latest
version can be found at
<http://cdm.unfccc.int/Reference/Documents>.
03 22 December
2006 • The Board agreed to revise the CDM project design
document for small-scale activities (CDM-SSC-PDD), taking
into account CDM-PDD and CDM-NM.

PROJECT DESIGN DOCUMENT FORM (CDM-SSC-PDD) - Version 03
CDM – Executive Board
SECTION A. General description of small-scale project activity
A.1 Title of the small-scale project activity:
IANCEM Cogeneration Project
Version 02,
14/04/2008
A.2. Description of the small-scale project activity:
The project activity aims at reducing GHG emissions through the use of bagasse (a renewable fuel
source, residue from sugarcane processing) to generate power. The biomass based cogeneration facility is
at Ingenio Azucarero del Norte Compañía de Economía Mixta, IANCEM.
The project activity consists of increasing efficiency in the cogeneration facility. The implementation of
the proposed project activity will lead to the reduction of electricity purchases. Project owner might sell
the surplus in case it is generated. By dispatching renewable electricity to a grid, electricity that would
otherwise be produced using fossil fuel is displaced, reducing CO2 emissions from power plants
connected to the grid.
The biomass based cogeneration facility will make use of the residue coming from the sugar mill process
in order to generate steam and electricity. The project activity involves the steam generation in a 24 TPH
bagasse fire boiler and the installation of a new 3 MW turbine for electricity generation.
Bagasse cogeneration is important for the energy strategy of the country. Cogeneration is an alternative
that allows postponing the installation and/or dispatch of electricity produced by fossil fuel led
generation utilities. The sale of the CER generated by the project will boost the attractiveness of bagasse
cogeneration projects, helping to increase the production of this energy and decrease dependency on
fossil fuel.
Since the generation of CO2 from the utilization of biomass is consumed for the growth of biomass
plantation on its life cycle basis, the power generation from the project is considered as CO2 neutral. In
other words, CO2 will be consumed (absorbed) by plants whose biomass is used as fuel, representing a
cyclic process of carbon sequestration. Therefore the project does not lead to net on-site CO2 emissions
due to its combustion of biomass in boiler. Since, the biomass contains only negligible quantities of other
elements like Nitrogen, Sulphur etc. release of other GHGs are considered as negligible.
Contribution to Sustainable Development
The contributions of the project activity towards sustainable development are as follows:
• Reduction of global GHG emissions due to the displacement of energy generation from the grid,
• Less emission of air pollutants (NOX, PM, among others) due to the displacement of other
generation sources, such as thermoelectric plants,

PROJECT DESIGN DOCUMENT FORM (CDM-SSC-PDD) - Version 03
CDM – Executive Board
• Improvement of the use of a sustainable renewable energy source instead of non renewable ones
due to making good use of bagasse with the consequent contribution to lessen the dependency on
fossil fuels,
• Promotion of practices that bring environmental benefits paving the way for others to follow this
trend.
Considering all the inherent benefits that the implementation of the project brings, it can be concluded
that the proposed activity contributes to the sustainable development of the country.
A.3. Project participants:
Table 1: Project participants
Name of Party
involved
Private and/or public entity(ies)
project participant (as applicable)
Kindly indicate if the Parte involved wishes
to be considered as project participant.
(Yes/No)
Ecuador (host)
Ingenio Azucarero del Norte
Compañía de Economía Mixta,
IANCEM
No
A.4. Technical description of the small-scale project activity:
A.4.1. Location of the small-scale project activity:
A.4.1.1. Host Party (ies):
Ecuador
A.4.1.2. Region/State/Province etc.:
Imbabura
A.4.1.3. City/Town/Community etc:
Ibarra
A.4.1.4. Details of physical location, including information allowing the
unique identification of this small-scale project activity:
Imbabura is a province in Ecuador that is divided in 6 cantons and the capital is Ibarra. Home to an
uncountable number of lakes and other bodies of water, Imbabura is a great place for fishing and
adventure sports. Located in Ecuador’s northern highlands, the province enjoys a pleasantly dry climate
with an average temperature of around 18 degrees centigrade. Its production of handicrafts has made its
indigenous population. The province is also well known for its Cotacachi-Cayapas Ecological Reserve.

PROJECT DESIGN DOCUMENT FORM (CDM-SSC-PDD) - Version 03
CDM – Executive Board
Ibarra has an estimated population of 157,000 inhabitants and has an area of 1,162.22 km2. It is situated
to 115 km Northeast of Quito and 125 km South of Tulcán.
The project location is 00° 28' 56" N and 078° 05'44" W
Figure 1: Maps of Ecuador and Ibarra
A.4.2. Type and category (ies) and technology/measure of the small-scale project activity:
Type (I): Renewable energy projects.
Category (C): Thermal energy for the user with or without electricity.

PROJECT DESIGN DOCUMENT FORM (CDM-SSC-PDD) - Version 03
CDM – Executive Board
The project is a small scale project activity and falls under the category I.C according to the Appendix B
of the Simplified Modalities and Procedures for Small-Scale CDM project activities. It
Technology of the project
The technology used for electricity generation from biomass is the steam-Rankine cycle, which consists
of direct combustion of biomass in a boiler to generate steam, which is then expanded through a turbine.
In order to implement the project activity it was necessary to buy a foreign technology for which the
necessary know-how is not completely developed in the country, incurring in technological barriers that
prevent the implementation of the proposed project activity. More details about this issue are provided in
the section B.5.
The steam cycle plants is located at industrial site, where the waste heat from the steam turbine is
recovered and used for meeting industrial process heat needs. Such combined heat and power (CHP), or
cogeneration system provides greater levels of energy services per unit of biomass consumed than
systems that generate electric power only.
The project employs the Rankine Cycle technology for steam generation based on direct combustion and
single extraction condensing turbine for power generation. The boiler installed is a water-tube boiler
technology designed to burn the bagasse with two waterwall furnace technology. The boiler is sized to
produce a maximum of 24 tons per hour of steam at a pressure of 300 psi and a temperature of 280ºC.
The steam produced will be expanded in backpressure steam turbine where, the energy from pressure
inlet steam is efficiently converted into electricity and low-pressure exhaust steam which is provided to
the industrial process.
The aim of this project activity is to increase the electricity generation capacity in IANCEM cogeneration
unit in two phases:
• Phase 1 (2006):
o Installation of a 3 MW backpressure turbo-generator, which will generate 1.1 MW for
the sugar mill consumption
o The two 830 KW turbo generators will be out of operation.
Technical characteristics of the technology to be employed in the proposed project activity in this phase
are given below.
Table 2: Technical characteristics of the generator
Generator brand General Electric
Generator type Synchronous
Power 3000 KW
Voltage 13.8 kV

PROJECT DESIGN DOCUMENT FORM (CDM-SSC-PDD) - Version 03
CDM – Executive Board
No. Phases 4
Frequency 60 Hz
Power factor 0.8
Synchronous speed 1,800 rpm
Temperature 80 ºC
Table 3: Technical characteristics of the turbine
Turbine brand NG
Turbine type DME-700/S
Capacity 3 MW
Synchronous speed 4,927 rpm
Inlet steam pressure 41 Bar
Outlet steam pressure 1.5 Kg/cm2
Outlet steam temperature 220ºC
• Phase 2 (2007):
o Deactivation of the steam turbines in the sugar mill tandem. The turbines will be
replaced by electric motors allowing the use of the steam for electricity generation.
o The backpressure turbo-generator will generate 2.2 MW that will be used for the sugar
mill consumption.
The sponsors are convinced that bagasse cogeneration is a sustainable source of energy that brings not
only advantages for mitigating global warming, but also creates a sustainable competitive advantage for
the agricultural production in the sugarcane industry in Ecuador. Using the available natural resources in
a more efficient way, the IANCEM project activity helps to enhance the consumption of renewable
energy.
Moreover, biomass gives thermal energy with zero net carbon dioxide emission on account of
sequestration the CO2 emitted during combustion of biomass is much less than the CO2 absorbed by the
plants growth. Hence, the net CO2 emission due to burning of biomass for power generation is zero.
In conclusion, the technology described above provides the means to generate the power that will lead to
accomplish the project’s objective, that is to say, to reduce GHG emissions through the displacement of
other energy generation sources from the grid.
A.4.3 Estimated amount of emission reductions over the chosen crediting period:
PROJECT DESIGN DOCUMENT FORM (CDM-SSC-PDD) - Version 03
CDM – Executive Board
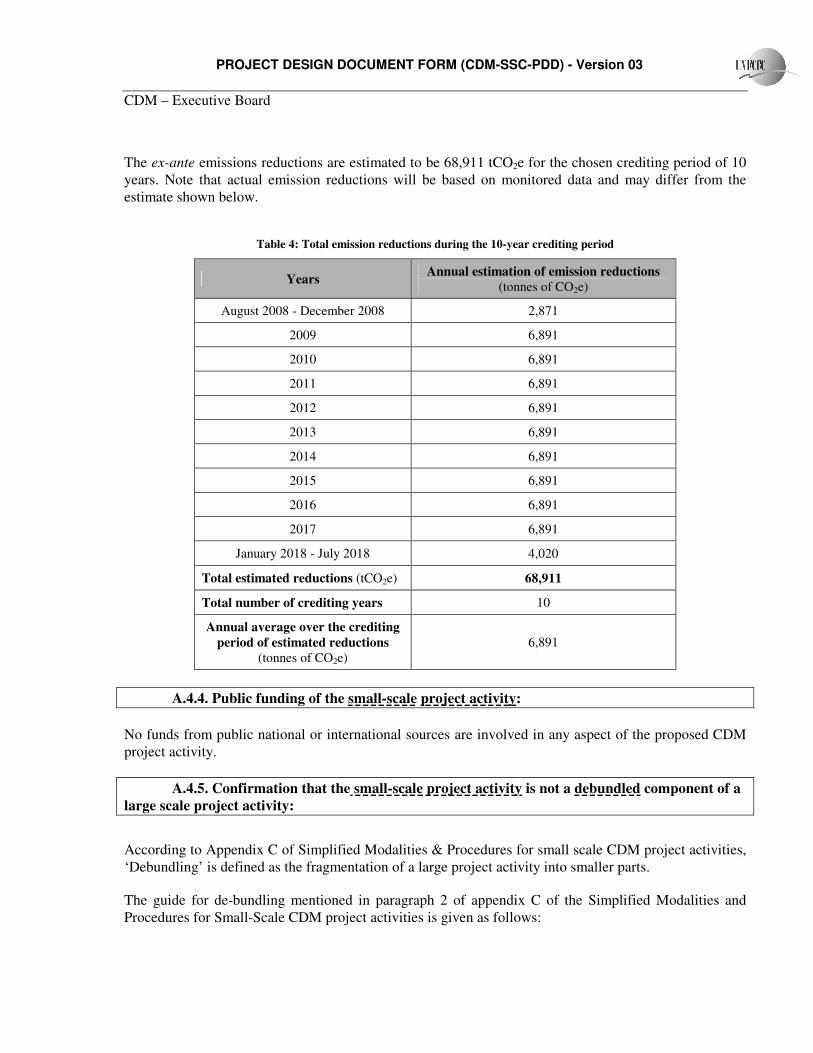
The ex-ante emissions reductions are estimated to be 68,911 tCO2e for the chosen crediting period of 10
years. Note that actual emission reductions will be based on monitored data and may differ from the
estimate shown below.
Table 4: Total emission reductions during the 10-year crediting period
Years Annual estimation of emission reductions
(tonnes of CO2e)
August 2008 - December 2008 2,871
2009 6,891
2010 6,891
2011 6,891
2012 6,891
2013 6,891
2014 6,891
2015 6,891
2016 6,891
2017 6,891
January 2018 - July 2018 4,020
Total estimated reductions (tCO2e) 68,911
Total number of crediting years 10
Annual average over the crediting
period of estimated reductions
(tonnes of CO2e)
6,891
A.4.4. Public funding of the small-scale project activity:
No funds from public national or international sources are involved in any aspect of the proposed CDM
project activity.
A.4.5. Confirmation that the small-scale project activity is not a debundled component of a
large scale project activity:
According to Appendix C of Simplified Modalities & Procedures for small scale CDM project activities,
‘Debundling’ is defined as the fragmentation of a large project activity into smaller parts.
The guide for de-bundling mentioned in paragraph 2 of appendix C of the Simplified Modalities and
Procedures for Small-Scale CDM project activities is given as follows:

PROJECT DESIGN DOCUMENT FORM (CDM-SSC-PDD) - Version 03
CDM – Executive Board
A proposed small scale project activity shall be deemed to be a de-bundled component of a large project
activity, if a registered small-scale CDM project activity or an application to register another small-
scale CDM project activity.
• With the same project participants;
• In the same project category and technology/measure; and
• Registered within the previous 2 years
• Whose project boundary is within 1 km of the project boundary of the proposed small-scale
activity at the closest point.
Based on the information provided in the guide, this project is not a de-bundled component of a large
project activity since there is no registered small scale CDM project activity or an application to register
another small scale CDM project activity (previous 2 years) by the same project proponent (IANCEM),
in the same project category and technology/measure, with project boundary within 1 km of the project
activity.
SECTION B. Application of a baseline and monitoring methodology
B.1. Title and reference of the approved baseline and monitoring methodology applied to the
small-scale project activity:
The project activity uses the simplified baseline and monitoring methodology designated “Thermal
energy for the user with or without electricity - Version 13”, Type I.C in Appendix B of the Simplified Modalities and Procedures for Small-Scale CDM project activities.
B.2 Justification of the choice of the project category:
The project is a small scale project activity and falls under the category I.C. according to the Appendix B
of the Simplified Modalities and Procedures for Small-Scale CDM project activities.
Biomass-based co-generation systems that produce heat and electricity are included in this category.
The proposed project activity is an 3MW biomass (renewable energy) based cogeneration power plant
that displace electricity form an electricity distribution system that is or would have been supplied by at
least one fossil fuel fired generating unit.
The categorization is justified by the following parameters:
1. Electricity generation capacity is lower than 15 MW;
2. Fuel type is biomass: bagasse (a renewable fuel source, residue from sugarcane processing).

PROJECT DESIGN DOCUMENT FORM (CDM-SSC-PDD) - Version 03
CDM – Executive Board
3. The sums of all forms of energy output not exceed 45 MWthermal. The project activity clearly
qualifies the said criteria since the rating of the boiler is less than the stipulated limit as show
below:
Boiler Capatity: 24 TPH
6.67 Kg/s
Steam Energy: 2,967 KJ/Kg (at 22 bar pressure and 280ºC temperature)
2.97 MJ/Kg
Water Energy (at 90ºC): 377 KJ/Kg
0.38 MJ/Kg
Boiler rating: ( ) thermalMW27.1738.097.267.6 =−×
B.3. Description of the project boundary:
As per the simplified baseline and monitoring methodology for selected small-scale CDM project activity
category, project boundary encompasses the physical and geographical site of the renewable generation
source.
For the project under consideration, the project boundary covers the biomass based cogeneration power
plant. However, for the purpose of calculation of baseline emissions, the project boundary also includes
the power plants connected physically to the grid that the proposed project activity will affect (Ecuador
National Interconnected System).
B.4. Description of baseline and its development:
The project activity involves the use of renewable energy to generate electricity. By self-generating, the
proposed project activity will lead to the reduction of electricity purchases. Project owner might sell the
surplus in case it is generated. By dispatching renewable electricity to a grid, electricity that would
otherwise be produced using fossil fuel is displaced, reducing CO2 emissions from power plants
connected to the grid.
According to the AMS-I.C. Version 13, cogeneration projects shall use one of the five following options
for baseline emission calculations depending on the technology that would have been used to produce the
thermal energy and electricity in the absence of the project activity:
(a) Electricity is imported from the grid and steam/heat is produced using fossil fuel;
(b) Electricity is produced in an onsite captive power plant (with a possibility of export to the grid)
and steam/heat is produced using fossil fuel;
PROJECT DESIGN DOCUMENT FORM (CDM-SSC-PDD) - Version 03
CDM – Executive Board
(c) A combination of (a) and (b);
(d) Electricity and steam/heat are produced in a cogeneration unit, using fossil fuel.
(e) Electricity is imported from the grid and/pr produced in an on-site captive power plant (with a
possibility of export to the grid); steam/heat is produced from renewable biomass.
The option (e) is used for baseline emission calculations. Therefore, the baseline scenario comprises the
electricity imported from the grid and the steam produced from renewable biomass.
Thus, baseline emissions includes CO2 emissions from fossil fuels that would have been used by the
operation of grid-connected power plants and by the addition of new generation sources, in order to
generate the quantity of electricity generated by the proposed project activity.
According to the AMS-I.C. Version 13, the baseline emissions for electricity imported from the grid shall
be calculated as the amount of electricity produced with the renewable energy technology (GWh)
multiplied by the CO2 emission factor of that grid.
The emission factor for grid electricity is obtained as per the procedures detailed in AMS I.D. Version 12
where the emission coefficient (measured in kg CO2e/kWh) is calculated in a transparent and
conservative manner as:
(a). A combined margin (CM), consisting of the combination of operating margin (OM) and build
margin (BM) according to the procedures prescribed in the approved methodology ACM0002
version 6. Any of the four procedures to calculate the operating margin can be chosen, but the
restrictions to use the Simple OM and the Average OM calculations must be considered
OR
(b). The weighted average emissions (in kg CO2e/kWh) of the current generation mix. The data of the
year in which project generation occurs must be used.
Calculations must be based on data from an official source (where available)1 and made publicly
available.
Option (a) is the one selected in this project. Following the methodology ACM0002 version 6, the
Baseline Emission Factor (EFy) is calculated as a combined margin, consisting of the combination of
Operating Margin Emission Factor (EFOM) and Build Margin Emission Factor (EFBM).
The consolidated methodology gives 4 different options to calculate the Operating Margin Emission
Factor (EFOM). These options are:
(a) Simple OM
1 Calculated, if data on fuel type, fuel emission factor, fuel input and power output can be obtained for each plant; if
confidential data available from the relevant host Party authority are used, the calculation carried out by the project
participants shall be verified by the DOE and the CDM-PDD may only show the resultant carbon emission factor and the
corresponding list of plants.
PROJECT DESIGN DOCUMENT FORM (CDM-SSC-PDD) - Version 03
CDM – Executive Board
(b) Simple adjusted OM
(c) Dispatch Data Analysis OM
(d) Average OM
The selection of the appropriate calculation method depends, among other factors, on the characteristics
of the electrical national grid and the available information about it.
The Simple OM method (a) can only be used where low-cost/must-run resources constitute less than 50%
of total grid generation in: 1) average of the five most recent years, or 2) based on long-term normal for
hydroelectricity production.
The average emission rate method (d) can only be used where low-cost/must run resources constitute
more than 50% of total grid generation and detailed data to apply option (b) and/or (c) is not available.
The methodology recommends the use of option (c) whenever possible.
Dispatch data analysis should be the first methodological choice, but for the proposed project activity
the Operating Margin has been calculated using the Simple Adjusted Method due to the following
reasons:
• No publicly available information exists to allow the use of option (c) Dispatch Data Analysis
OM. According to the methodology, the calculation of the OM emission factor, using option (c),
is determined ex-post. In order to write the PDD, project developers may use models to estimate
the reductions prior to validation. Such models should be able to simulate the operation of the
hydroelectric project along with the other interconnected power plants during the crediting
period, and, to achieve this, the data of many years of hydrological behavior are needed. The data
on hydrology are not available.
• In Ecuador low-cost resources constitute more than 50% of the total generation of the national
grid, which prevents from using option (a) Simple OM.
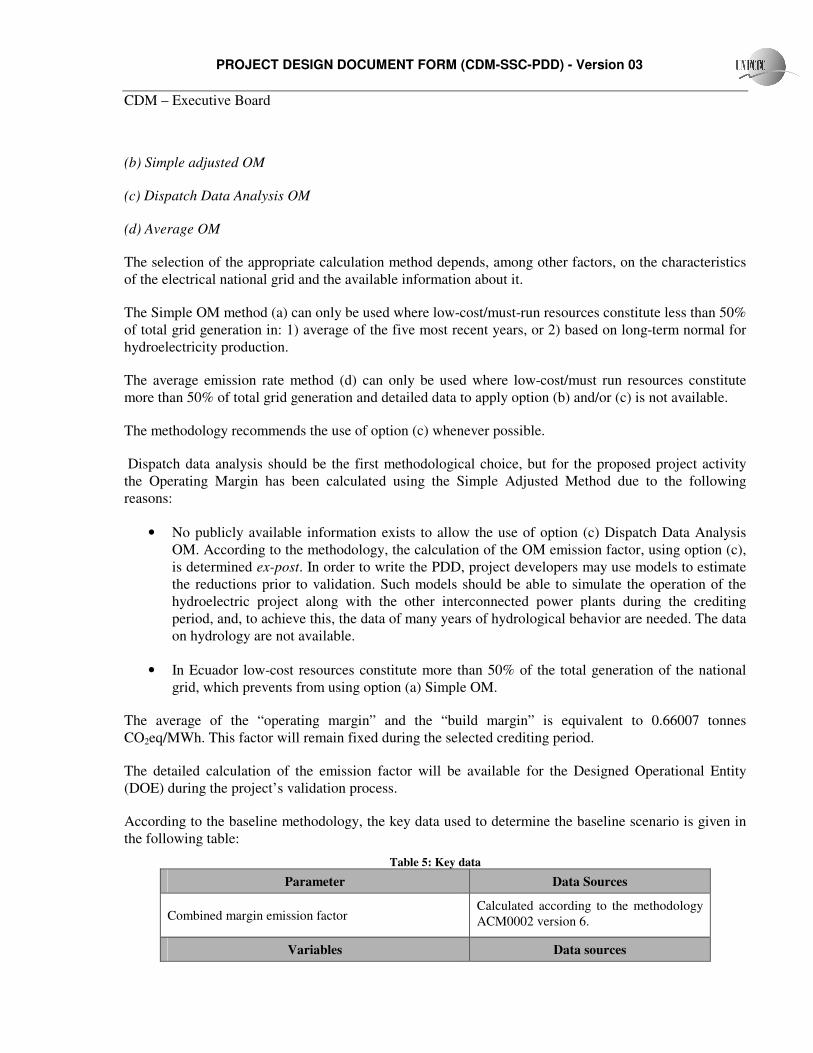
The average of the “operating margin” and the “build margin” is equivalent to 0.66007 tonnes
CO2eq/MWh. This factor will remain fixed during the selected crediting period.
The detailed calculation of the emission factor will be available for the Designed Operational Entity
(DOE) during the project’s validation process.
According to the baseline methodology, the key data used to determine the baseline scenario is given in
the following table:
Table 5: Key data
Parameter Data Sources
Combined margin emission factor Calculated according to the methodology
ACM0002 version 6.
Variables Data sources

PROJECT DESIGN DOCUMENT FORM (CDM-SSC-PDD) - Version 03
CDM – Executive Board
Electricity generation of the industrial facility per year IANCEM
For further information on key data used for baseline scenario, refer to Annex 3.
B.5. Description of how the anthropogenic emissions of GHG by sources are reduced below
those that would have occurred in the absence of the registered small-scale CDM project activity:
According to attachment A to Appendix B of the simplified modalities and procedures for small-scale
CDM project activities, project participants shall provide explanation to show that the project activity
would not have occurred anyway due to at least one of the barriers (investment, technological or other
barriers).
The following explanation provides the reasons that the project activity would not have occurred anyway
due to following barriers.
Barriers to financing
Ecuadorian financial entities and multilateral banks perceive high risks in the electricity sector, due to the
high debt rate of the distribution companies and their inability to pay. National banks are not interested
and impose important barriers for obtaining long-term credits to finance electricity generation projects in
Ecuador2. As a consequence, several banks have rejected the financing of the IANCEM Cogeneration
project.
Since there is not access to credit for this sector in the country, the project received low priority by the
management, and only after considering CDM revenues it was possible to obtain approval from the
Board of Directors and by deviating limited available own investments and resources for installing new
generation capacity was possible to finance part the project. Moreover, as shown in the original basic
engineering plan of the project a more ambitious activity was conceived, but neither current resources
nor CDM revenues were able to inject enough income as to overcome the investment barrier, reduce the
technological risks and alleviate the financial hurdles of that option.
Technological Barriers
Introducing the new biomass based power technology in the sugar mill implies:
� The introduction of risks in the management and operation of the project. In order to acquire the
more appropriate and efficient technology as required by the sugar mill, it was necessary to buy a
foreign technology for which the necessary know-how is not completely developed in the
country.
2 From different sources, it was possible to confirm that electric sector is facing several problems (lack of
investment). The description of Ecuador’s economic situation regarding electric sector are detailed in the Economic
Bulletin No. 36 – Corporación Centro de Estudios y Análisis (CEA), May 2007. Web site:
http://www.ccq.org.ec/documents/CEAINFO36.pdf
PROJECT DESIGN DOCUMENT FORM (CDM-SSC-PDD) - Version 03
CDM – Executive Board
� The installation of several equipments. The integration of all equipment was complex and
additional risks were incorporated to the process. Furthermore, as a consequence of the project
activity implementation, the industrial facility had to be modified in order to send the surplus
energy to the grid; incurring in new practices with complex work procedures.
� Paying special attention to the maintenance activities. As the technology is imported, spare parts
might have to be imported from the manufacturer, causing probable delays in the equipment
operation. By the way, several problems have been occurring since the turbine was installed due
to its inappropriate functioning. Abroad technical expert and imported spared parts have been
required incurring in important costs and delays.
� Training the personnel in charge of the turbine operation. This required professional technicians
from abroad from the manufacturing facility. Lack of proper operation might lead to equipment
malfunctioning or break, affecting the normal energy generation. Also people in charge of
turbine’s maintenance had to be properly trained.
� The personnel in charge of the turbogenerator parameters operation and monitoring were trained
with a special course. This course was taught by Engineer Paulo Moraes. Furthermore, when the
turbogenerator was assembled the operators were trained in an operation and maintenance
practice course3.
Core business Barrier
New investments in the sugar mill are typically related to increase sugar cane production capacity by
feeding new hectares. This is the core business of the sugar mill for its short-term business strategy. The
proposed project activity has been a steep diversification from the core business in the short term.
Deviating limited available own investments and resources for installing new generation capacity only to
avoid purchasing electricity from the national grid leads to a significant delay in the sugar cane
production expansion, thus redefining the business goals of the sugar mill as a long-term strategy. And
this happens since there is not access to credit for this sector in the country. Therefore, the project
received low priority by the management, and only after considering CDM revenues it was possible to
obtain approval from the Board of Directors. Moreover, as shown in the original basic engineering plan
of the project a more ambitious activity was conceived, but neither current resources nor CDM revenues
were able to inject enough income as to overcome the investment barrier, reduce the technological risks
and alleviate the financial hurdles of that option.
Above barriers are strong enough to affect the decision of the project implementation. In the absence of
the project activity, IANCEM will continue producing sugar and will increase its production, purchasing
the plant electricity needs to the grid.
The impact of registration of this project activity will be an incentive to overcome all the barriers
described above, by bringing more solidity to the investment itself and, therefore, fostering and
supporting the project owners’ breakthrough decision to go ahead with the implementation of the project
activity.
3 Training Course Certificates of the personnel in charge for the turbogenerator operation and monitoring parameters
are available

PROJECT DESIGN DOCUMENT FORM (CDM-SSC-PDD) - Version 03
CDM – Executive Board
Considering all the previous assessment, it is clear that the proposed project activity is additional.
B.6. Emission reductions:
B.6.1. Explanation of methodological choices:
Project emissions
No project emissions are considered since biomass is the main fuel used for this project activity and no
additional quantity of fossil fuel is used.
Leakage
As per the methodology, leakage is considered if the energy generating equipment is transferred form
another activity or if existing equipment is transferred to another activity. Since none of these conditions
is applicable, no leakage is considered in this project activity.
Baseline emissions
According to the AMS-I.C. Version 13, the baseline is the kWh produced by the renewable generating
unit multiplied by an emission coefficient (measured in kg CO2e/kWh) calculated according to the
procedures prescribed in the approved methodology ACM0002 version 6.
Emission Factor
Following the methodology ACM0002 version 6, the Baseline Emission Factor (EFy) is calculated as a
combined margin, consisting of the combination of Operating Margin Emission Factor (EFOM) and Build
Margin Emission Factor (EFBM) according to the following three steps.
Step 1 Calculate the Operating Margin emission factor (EFOM).
In order to calculate the Operating Margin Emission Factor (EFOM) the Simple Adjusted Method is used.
In this method, the EFOM is calculated as the generation-weighted average emission per electricity unit
(tCO2/MWh) of all generating sources serving the system, where the power sources (including imports)
are separated in low-cost/must-run power sources (k) and other power sources (j):
∑
∑
∑
∑+−=
k
yk
ki
ki
yki
j
yj
ji
ji
yji
yadjustedsimpleOMGEN
COEFF
yGEN
COEFF
yEF,
,
,
,,
,
,
,
,,
,_,
.
.
.
).1( λλ
where
Fi ,j, y = is the amount of fuel i (in a mass or volume unit) consumed by relevant power sources j in
year(s) y,
j = refers to the power sources delivering electricity to the grid,
COEFi,j y = is the CO2 emission coefficient of fuel i (tCO2 / mass or volume unit of the fuel), taking
into account the carbon content of the fuels used by relevant power sources j and the

PROJECT DESIGN DOCUMENT FORM (CDM-SSC-PDD) - Version 03
CDM – Executive Board
percent oxidation of the fuel in year(s) y, and
GENj,y = is the electricity (MWh) delivered to the grid by source j.
Fi,k,y, COEFi,k and GENk are analogous to the variables described above for plants k.
The CO2 emission coefficient COEFi is obtained as:
ijCOii OXIDEFNCVCOEF .. ,2=
where:
NCVi = is the net calorific value (energy content) per mass or volume unit of a fuel i,
OXIDi = is the oxidation factor of the fuel.
EFCO2,i = is the CO2 emission factor per unit of energy of the fuel i.
Where available, local values of NCVi and EFCO2,i should be used. If no such values are available,
country-specific values are preferable to IPCC world-wide default values.
And,
yearper hours 8,760
margin on are sourcesrun -mustcost / -lowfor which year per hours ofnumber =λ
where lambda (λy) should be calculated as follows:
Step i) Plot a Load Duration Curve. Collect chronological load data (typically in MW) for each hour of a
year, and sort load data from highest to lowest MW level. Plot MW against 8,760 hours in the year, in
descending order.
Step ii) Organize Data by Generating Sources. Collect data for, and calculate total annual generation (in
MWh) from low-cost/must-run resources (i.e. Σk GENk,y).
Step iii) Fill Load Duration Curve. Plot a horizontal line across load duration curve such that the area
under the curve (MW times hours) equals the total generation (in MWh) from lowcost/must-run
resources (i.e. ΣkGENk,y).
Step iv) Determine the "Number of hours per year for which low-cost/must-run sources are on the
margin". First, locate the intersection of the horizontal line plotted in step (iii) and the load duration
curve plotted in step (i). The number of hours (out of the total of 8,760 hours) to the right of the
intersection is the number of hours for which low-cost/must-run sources are on the margin. If the lines do
not intersect, then one may conclude that low-cost/must-run sources do not appear on the margin and λy is
equal to zero. Lambda (λy) is the calculated number of hours divided by 8,760.

PROJECT DESIGN DOCUMENT FORM (CDM-SSC-PDD) - Version 03
CDM – Executive Board
Figure 2: Illustration of Lambda Calculation for Simple Adjusted OM Method
Step 2 Calculate the Build Margin emission Factor (EFBM)
The Build Margin emission factor (EFBM,y) is calculated as the generation-weighted average emission
factor (tCO2/MWh) of a sample of power plants m, as follows:
∑
∑=
m
ym
mi
mi
ymi
yBMGEN
COEFF
EF,
,
,
,,
,
.
where Fi,m,y , COEFi,m and GENm,y are analogous to the variables described for the simple adjusted OM
method above for plants m.
The sample group m consists of either the five power plants that have been built most recently or the
power plant capacity additions in the electricity system that comprise 20% of the system generation (in
MWh) and that have been built most recently.
STEP 3. Calculate the baseline emission factor EFy as the weighted average of the Operating Margin
emission factor (EFOM,y) and the Build Margin emission factor (EFBM,y):
yBMBMyOMOMy EFwEFwEF ,, .. +=
where the weights wOM and wBM, by default, are 50% (i.e., wOM = wBM = 0.5), and EFOM,y and EFBM,y are
calculated as described in Steps 1 and 2 above and are expressed in tCO2/MWh.
Electricity Generation
According to the AMS-I.C. Version 13, in the case of project activities that involve the addition of
renewable energy units at an existing renewable energy production facility, where the existing and new
PROJECT DESIGN DOCUMENT FORM (CDM-SSC-PDD) - Version 03
CDM – Executive Board
units share the use of common and limited renewable resources (e.g. stream flow, reservoir capacity,
biomass residues), the potential for the project activity to reduce the amount of renewable resource
available to, and thus electricity generation by, existing units must be considered in the determination of
baseline emissions, project emissions, and/or leakage, as relevant.
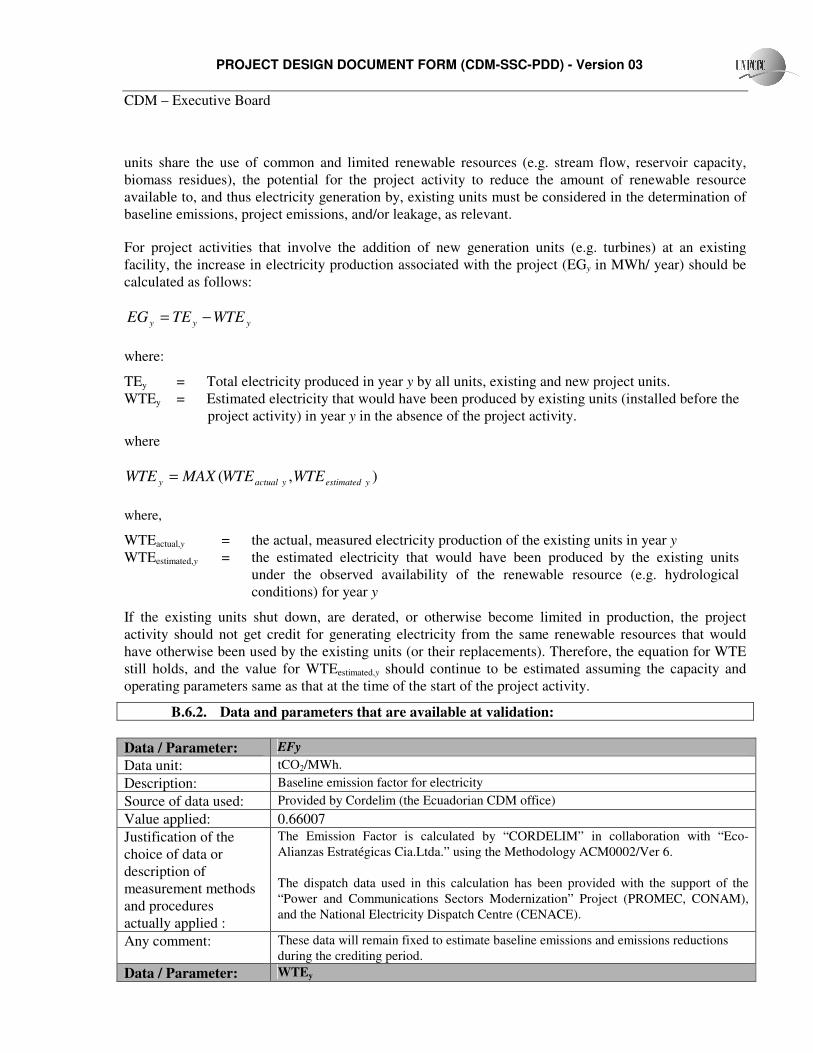
For project activities that involve the addition of new generation units (e.g. turbines) at an existing
facility, the increase in electricity production associated with the project (EGy in MWh/ year) should be
calculated as follows:
yyy WTETEEG −=
where:
TEy = Total electricity produced in year y by all units, existing and new project units.
WTEy = Estimated electricity that would have been produced by existing units (installed before the
project activity) in year y in the absence of the project activity.
where
),( yestimatedyactualy WTEWTEMAXWTE =
where,
WTEactual,y = the actual, measured electricity production of the existing units in year y
WTEestimated,y = the estimated electricity that would have been produced by the existing units
under the observed availability of the renewable resource (e.g. hydrological
conditions) for year y
If the existing units shut down, are derated, or otherwise become limited in production, the project
activity should not get credit for generating electricity from the same renewable resources that would
have otherwise been used by the existing units (or their replacements). Therefore, the equation for WTE
still holds, and the value for WTEestimated,y should continue to be estimated assuming the capacity and
operating parameters same as that at the time of the start of the project activity.
B.6.2. Data and parameters that are available at validation:
Data / Parameter: EFy
Data unit: tCO2/MWh.
Description: Baseline emission factor for electricity
Source of data used: Provided by Cordelim (the Ecuadorian CDM office)
Value applied: 0.66007
Justification of the
choice of data or
description of
measurement methods
and procedures
actually applied :
The Emission Factor is calculated by “CORDELIM” in collaboration with “Eco-
Alianzas Estratégicas Cia.Ltda.” using the Methodology ACM0002/Ver 6.
The dispatch data used in this calculation has been provided with the support of the
“Power and Communications Sectors Modernization” Project (PROMEC, CONAM),
and the National Electricity Dispatch Centre (CENACE).
Any comment: These data will remain fixed to estimate baseline emissions and emissions reductions
during the crediting period.
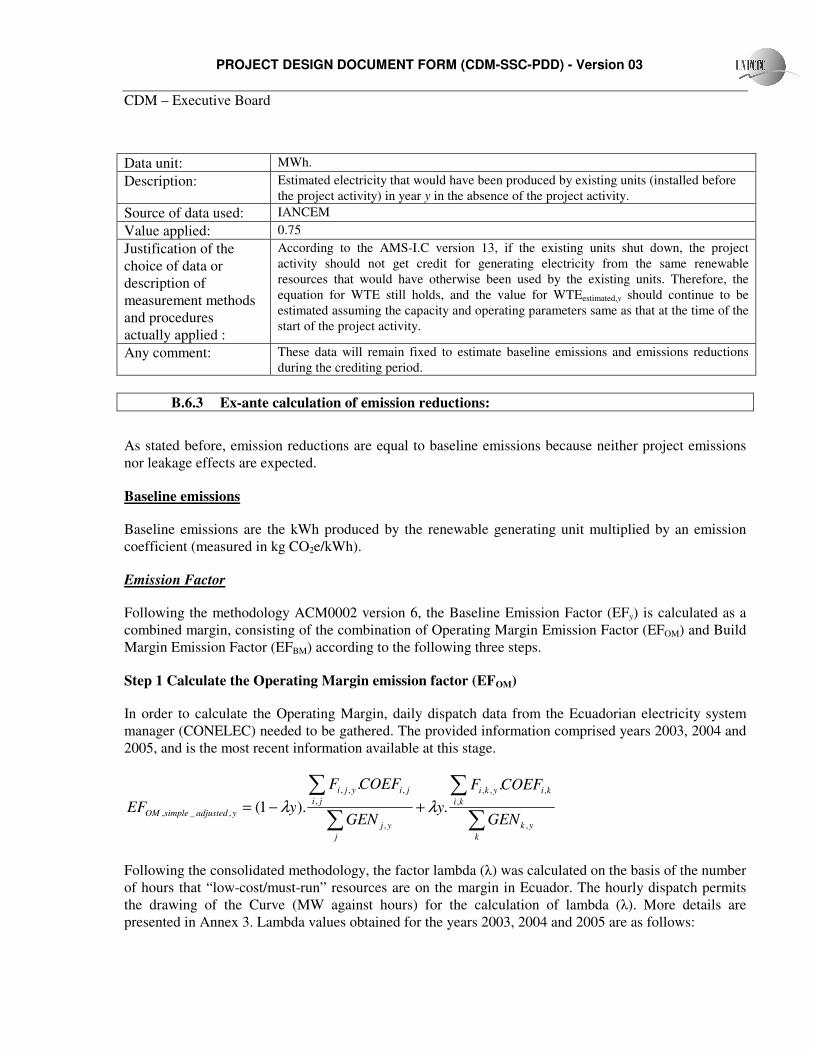
Data / Parameter: WTEy
PROJECT DESIGN DOCUMENT FORM (CDM-SSC-PDD) - Version 03
CDM – Executive Board
Data unit: MWh.
Description: Estimated electricity that would have been produced by existing units (installed before
the project activity) in year y in the absence of the project activity.
Source of data used: IANCEM
Value applied: 0.75
Justification of the
choice of data or
description of
measurement methods
and procedures
actually applied :
According to the AMS-I.C version 13, if the existing units shut down, the project
activity should not get credit for generating electricity from the same renewable
resources that would have otherwise been used by the existing units. Therefore, the
equation for WTE still holds, and the value for WTEestimated,y should continue to be
estimated assuming the capacity and operating parameters same as that at the time of the
start of the project activity.
Any comment: These data will remain fixed to estimate baseline emissions and emissions reductions
during the crediting period.
B.6.3 Ex-ante calculation of emission reductions:
As stated before, emission reductions are equal to baseline emissions because neither project emissions
nor leakage effects are expected.
Baseline emissions
Baseline emissions are the kWh produced by the renewable generating unit multiplied by an emission
coefficient (measured in kg CO2e/kWh).
Emission Factor
Following the methodology ACM0002 version 6, the Baseline Emission Factor (EFy) is calculated as a
combined margin, consisting of the combination of Operating Margin Emission Factor (EFOM) and Build
Margin Emission Factor (EFBM) according to the following three steps.
Step 1 Calculate the Operating Margin emission factor (EFOM)
In order to calculate the Operating Margin, daily dispatch data from the Ecuadorian electricity system
manager (CONELEC) needed to be gathered. The provided information comprised years 2003, 2004 and
2005, and is the most recent information available at this stage.
∑
∑
∑
∑+−=
k
yk
ki
ki
yki
j
yj
ji
ji
yji
yadjustedsimpleOMGEN
COEFF
yGEN
COEFF
yEF,
,
,
,,
,
,
,
,,
,_,
.
.
.
).1( λλ
Following the consolidated methodology, the factor lambda (λ) was calculated on the basis of the number
of hours that “low-cost/must-run” resources are on the margin in Ecuador. The hourly dispatch permits
the drawing of the Curve (MW against hours) for the calculation of lambda (λ). More details are
presented in Annex 3. Lambda values obtained for the years 2003, 2004 and 2005 are as follows:

PROJECT DESIGN DOCUMENT FORM (CDM-SSC-PDD) - Version 03
CDM – Executive Board
Table 6: Lambda values
Parameter Value
Lambda (λ) 2003 0.00833333
Lambda (λ) 2004 0.01331967
Lambda (λ) 2005 0.00011416
Lambda (λ) average 0.007255720
The Emission Factor of the Operating Margin (EFOM) is:
/MWh tCO0.74673
.
.
.
).1( 2
,
,
,
,,
,
,
,
,,
,_, =+−=∑
∑
∑
∑
k
yk
ki
ki
yki
j
yj
ji
ji
yji
yadjustedsimpleOMGEN
COEFF
yGEN
COEFF
yEF λλ
The following table summarises the values used to calculate the above result.
Table 7: Input values for calculating EFOM
Parameter Value Unit
λ 0.007255720 ----
ji
ji
yji COEFF ,
,
,, .∑ 10144041 tCO2
∑j
yjGEN , 13486064 MWh
ki
ki
yki COEFF ,
,
,, .∑ 0.004
tCO2
∑k
ykGEN , 26025569 MWh
Build Margin Emission Factor (EFCM)
Build Margin emission factor EFBM,y is based on the most recent information available on plants already
built for sample group m at the time of PDD submission The sample group m consists of the power plant
capacity additions in the electricity system that comprise 20% of the system generation (in MWh) and
that have been built most recently.
The Emission Factor of the Build Margin (EFBM) is:
4 According to the consolidated methodology ACM0002 version 6, page 3: “For imports from connected electricity system
located in another country, the emission factor is 0 tons CO2 per MWh.”

PROJECT DESIGN DOCUMENT FORM (CDM-SSC-PDD) - Version 03
CDM – Executive Board
/MWh tCO0.573404
.
2
,
,
,
,,
, ==∑
∑
m
ym
mi
mi
ymi
yBMGEN
COEFF
EF
The following table summarises the values used to calculate the above result.
Table 8: Input values for calculating EFBM
Parameter Value Unit
mi
mi
ymi COEFF ,
,
,, .∑ 1,595,611 tCO2
∑m
ymGEN , 2,782,697.97 MWh
For more details refer to Annex 3.
Baseline Emission Factor (EFy)
This is calculated as the weighted average of the Operating Margin emission factor (EFOM,y) and the
Build Margin Emission Factor (EFBM,y). The weights wOM and wBM, have been chosen as 50% (i.e., wOM =
wBM = 0.5), following the default values given in the methodology.
yBMBMyOMOMy EFwEFwEF ,, .. +=
e/MWhtCO0.660070.5734045.00.746735.0 2=×+×=yEF
Electricity Generation
The proposed project activity involves the addition of renewable energy generation units at an existing
renewable power generation facility. The increase in electricity production associated with the project
(EGy in MWh/ year) is calculated as follows:
yyy WTETEEG −=
where:
TEy = the total electricity produced in year y by all units, existing and new project units.
WTEy = the estimated electricity that would have been produced by existing units (installed before
the project activity) in year y in the absence of the project activity.

PROJECT DESIGN DOCUMENT FORM (CDM-SSC-PDD) - Version 03
CDM – Executive Board
It is expected that IANCEM will self-generate 1.1 MW of electricity through the implementation of the
phase 1 of the project activity during the year 2007 up to 2008, and 2.2 MW through the implementation
of the phase 2 from 2008.
Therefore, electricity produced by all units, existing and new project units, for the chosen crediting
period can be estimated and are shown in the following table.
Table 9: Ex-ante electricity generation
Year Generation
(hours per year)
TEy
(MWh/year)
WTEy
(MWh/year)
EGy
(MWh/year)
August 2008 - December 2008 3,000 6,600 2,250 4,350
2009 7,200 15,840 5,400 10,440
2010 7,200 15,840 5,400 10,440
2011 7,200 15,840 5,400 10,440
2012 7,200 15,840 5,400 10,440
2013 7,200 15,840 5,400 10,440
2014 7,200 15,840 5,400 10,440
2015 7,200 15,840 5,400 10,440
2016 7,200 15,840 5,400 10,440
2017 7,200 15,840 5,400 10,440
January 2018 - July 2018 4,200 9,240 3,150 6,090
Total 72,000 158,400 54,000 104,400
Electricity generation has been estimated in spreadsheet Emission Reductions IANCEM.xls.
Baseline Emissions
As mentioned above, baseline emissions include CO2 emissions from fuels that would have been used by
the operation of grid-connected power plants and by the addition of new generation sources, in order to
generate the quantity of electricity generated through the proposed project activity.
gridyyyelectricit EFEGBE ×=,
where
EGy Net quantity of electricity generated (MWh/year).
EFgrid CO2 baseline emission factor for electricity displaced due to the project activity
(tCO2/MWh).
BEelectricity,y Baseline emissions in tonnes of CO2 equivalent per year

PROJECT DESIGN DOCUMENT FORM (CDM-SSC-PDD) - Version 03
CDM – Executive Board
The CO2 baseline emission factor for electricity displaced due to the project activity is equivalent to
0.66007 tonnes CO2eq/MWh.
Therefore, GHG baseline emissions for the chosen crediting period can be estimated and are shown in
the following table.
Table 10: Ex-ante Baseline Emissions
Year EGy
(MWh/year)
Baseline Emissions
(tCO2/year)
August 2008 - December 2008 4,350 2,871
2009 10,440 6,891
2010 10,440 6,891
2011 10,440 6,891
2012 10,440 6,891
2013 10,440 6,891
2014 10,440 6,891
2015 10,440 6,891
2016 10,440 6,891
2017 10,440 6,891
January 2018 - July 2018 6,090 4,020
Total 104,400 68,911
Baseline emissions have been estimated in spreadsheet Emission Reductions IANCEM.xls.
B.6.4 Summary of the ex-ante estimation of emission reductions:
The project activity has the capacity to reduce 68,911 tonnes of CO2 equivalent emissions over a 10-year
time frame.
The emission reduction ERy achieved by the project activity are given by:
yyyy LEPEBEER −−=
The following table summarises the values obtained above.
Table 11: Ex-ante Emission Reductions (tCO2e)

PROJECT DESIGN DOCUMENT FORM (CDM-SSC-PDD) - Version 03
CDM – Executive Board
Year
Baseline
Emissions
(tCO2/year)
Project
Emissions
(tCO2/year)
Leakage
(tCO2e/year)
Emissions
Reductions
(tCO2/year)
August 2008 - December 2008 2,871 0 0 2,871
2009 6,891 0 0 6,891
2010 6,891 0 0 6,891
2011 6,891 0 0 6,891
2012 6,891 0 0 6,891
2013 6,891 0 0 6,891
2014 6,891 0 0 6,891
2015 6,891 0 0 6,891
2016 6,891 0 0 6,891
2017 6,891 0 0 6,891
January 2018 - July 2018 4,020 0 0 4,020
Total 68,911 0 0 68,911
B.7 Application of a monitoring methodology and description of the monitoring plan:
B.7.1 Data and parameters monitored:
Data / Parameter: TEy
Data unit: MWh
Description: Total electricity produced in year y by all units, existing and new project units.
Source of data to be
used: IANCEM
Value of data The total estimated energy generation throughout the first crediting period is 102,420
MWh.
Description of
measurement methods
and procedures to be
applied:
The total electricity produced by existing unit should be estimated assuming the capacity
and operating parameters same as that at the time of the start of the project activity.
The total electricity produced by the new project unit shall be monitored. Electronic
meters will be used to measure energy generation in the new unit.
QA/QC procedures to
be applied:
Monitoring systems will follow relevant procedures under ISO 9001-2000, all of which
are integrated in IANCEM’s Quality Management System.
Any comment: These data will be recorded monthly and yearly values will be used to calculate emission
reductions of the project activity.
B.7.2 Description of the monitoring plan:
According to Type I, Category C of small-scale project activity categories contained in appendix B of the
Simplified M&P for CDM Small-Scale Project Activity, monitoring shall consist of metering the
electricity generated by the renewable technology and the amount of biomass.

PROJECT DESIGN DOCUMENT FORM (CDM-SSC-PDD) - Version 03
CDM – Executive Board
The total electricity produced by existing unit should be estimated assuming the capacity and operating
parameters same as that at the time of the start of the project activity and the total electricity produced by
the new project unit shall be monitored.
The monitoring of baseline emissions implies the application of an operational and management
procedure that shall assure the correct and proper measurement and control of the variable involved in
the calculation of emission reductions.
IANCEM has maintenance and operations procedures that include the monitoring of the electricity
generated, instruments calibration and quality control, in accordance with company policies and
ISO9000-2000 certification.
The electric chief of the electric maintenance department will be the responsible for the monitoring of the
electricity generated by the renewable technology according to the R-MIN-19 V 0.3 which is part of the
register format of the quality control system of the ISO 9000-2000.
IANCEM will assign a qualified person to compile the necessary data according to the approved
methodology to accurately calculate emission reductions.
The monitoring of electric and mechanic parameters of the turbine and generator will be carried out by
the Electric and Turbo Plant Operators, which main roles are to operate and maintain the correct function
of the turbogenerators at Ingenio Azucarero del Norte. The assistants shall be in charge in case of
absence of the operator.
The operators must monitor and register (R-MIN-19 V 0.3) the following parameters: Voltage,
frequency, power factor and power, which are recorded and controlled by the operator. The energy
generated is also recorded in the same R-MIN-19 V 0.3.
The operators of the turbogenerator have the following work instructions fulfilled as requirement of the
norm ISO 6.3:
• Instructive of checking and starting up of the turboalternator NG IT-MIN-13
• Instructive of operation of the turboalternator NG IT-MIN-14
• Instructive of the energy supply of the Turbogenerator # 3 IT-MIN-15
The Electric Chief checks these records and conduct preventive and corrective actions as required. He is
in charge of appointing the personnel working in the turbogenerator, verifying the maintenance actions
are being conducted and executing the work orders needed for the good function of the equipment.
Furthermore, there are a set of plans of the electric cogeneration project and an instructions, installation,
operation and maintenance handbook of the turbine in the work site, as well as laminated copies of the
work instructions related to the turbogenerator.
Generation parameters could also be monitored from a remote station due to the monitoring program
ENERVISTA of General Electric. It must be pointed out that this program does not record historic
generation data.

PROJECT DESIGN DOCUMENT FORM (CDM-SSC-PDD) - Version 03
CDM – Executive Board
The personnel in charge of the turbogenerator parameters operation and monitoring were trained with a
special course. This course was taught by Engineer Paulo Moraes. Furthermore, when the turbogenerator
was assembled the operators were trained in a operation and maintenance practice course.
B.8 Date of completion of the application of the baseline and monitoring methodology and the
name of the responsible person(s)/entity(ies)
Date of completion: 14/03/2008
Rocío Rodriguez and Fabián Gaioli, MGM International SRL
Junín 1655, 1º B
C1113AAQ, Buenos Aires, Argentina
Tel./Fax: (54 11) 5219-1230/32
e-mail: [email protected]
Rocío Rodriguez and Fabián Gaioli are not project participants.

PROJECT DESIGN DOCUMENT FORM (CDM-SSC-PDD) - Version 03
CDM – Executive Board
SECTION C. Duration of the project activity / crediting period
C.1 Duration of the project activity:
C.1.1. Starting date of the project activity:
01/02/2006
C.1.2. Expected operational lifetime of the project activity:
40 years
C.2 Choice of the crediting period and related information:
C.2.1. Renewable crediting period
C.2.1.1. Starting date of the first crediting period:
N/A
C.2.1.2. Length of the first crediting period:
N/A
C.2.2. Fixed crediting period:
C.2.2.1. Starting date:
01/08/2008
C.2.2.2. Length:
10 years
PROJECT DESIGN DOCUMENT FORM (CDM-SSC-PDD) - Version 03
CDM – Executive Board
SECTION D. Environmental impacts
D.1. If required by the host Party, documentation on the analysis of the environmental impacts
of the project activity:
An Environmental Impact Assessment was carried out for the proposed project activity dividing it into
the following stages:
• Identification of Environmental Impacts: Carried out by means of elaborating a double entry
matrix (Leopold Matrix).
• Qualification of Environmental Impacts: with this purpose a methodology based on
Environmental Importance Qualification Criteria was designed "Criterios Relevantes Integrados"
(Buroz, 1998) that can be applied to these kind of activities.
• Determination of the Importance of Environmental Impacts: in accordance with the application
of the calculation formula for Environmental Importance, results within a qualification range
from 12 to 52 were obtained, and from that the qualification scale was determined.
• Determination of Significant Environmental Impacts: Based on different indicators, such as
importance of the impact, presence of a special condition requiring an specific management due
to the effect to be produced (irreversibility, irrecoverable condition, intensity, extension, to
name the most representative ones), and based on a qualitative objective with regard to: Legal
and regulatory aspects, fulfillment of the valid environmental legal framework; Economic
aspects, representing an economic loss or fines to the project; Stakeholders, relationship with the
community.
The Environmental Impact Assessment included a Program of Prevention and Mitigation of
Environmental Impacts. The objective of the present program is to pose measures so as to prevent,
control, mitigate and compensate the effects of described environmental impacts caused to the
environmental factors involved in the present process.
Measurements for identified environmental impacts were suggested, following an order in accordance
with the project activities, and control and monitoring measures were determined, responsible for the
activities and the fulfillment deadline. Measures for impacts have been defined, such as the la alteration
of quality of air by noise, particulate material and exhaust gases, visual alteration of landscapes due to
facilities, measures so as to properly manage waste, management of the process conflicts, avoid risk to
population and occupational health, improvement of the grinding process and measures in order to
manage the contamination for solid waste.
D.2. If environmental impacts are considered significant by the project participants or the host
Party, please provide conclusions and all references to support documentation of an environmental
impact assessment undertaken in accordance with the procedures as required by the host Party:
This project activity presents no major environmental impacts.

PROJECT DESIGN DOCUMENT FORM (CDM-SSC-PDD) - Version 03
CDM – Executive Board
SECTION E. Stakeholders’ comments
E.1. Brief description how comments by local stakeholders have been invited and compiled:
The stakeholders’ consultation process has been conduced in two stages. First, in order to obtain the
licence as cogenerator by CONELEC, a public discussion with local stakeholders was carried out in
April 2006. The people that assisted to the public audience were the following:
Eng. Andino Paola, CONELEC Representative
Eng. Enríquez Diego, BIOSFERA Cía. Ltda Representative
Eng. Enríquez Alberto, IANCEM Board of directors President
Eng. Carlos Valdivieso, IANCEM General Manager
Sr Fausto Endara López, IANCEM Director
Eng. Fausto Rivera, IANCEM Technical Assistant Manager
Ibarra Fire Brigade Representative
Municipality Representative
National Police Representative
Local Community Representative and Inhabitants
The activities executed, with the purpose of informing the community included in the Influence Area of
the Environmental Impact Assessment, were as follows:
• During the collection of the Social Baseline information when conducting the Environmental
Impact Assessment, the leaders of the surrounding communities, as well as several residents of
the area, were invited in order to inform them about the project activities and the elaboration of
studies.
• Interviews and surveys to community leaders and residents of the communities included in the
Influence Area of the Study were carried out.
• The inquiries, observations and recommendations expressed by the leaders and residents were
collected so as to include them in the elaborated diagnosis and as indicators of measures for the
Communal Relations Plan.
The invitation to the Public Audience of the Environmental Impact Assessment was published in the
Ibarra Canton press.
Radial broadcasting of the aforementioned invitation was made, on April 8-9, in the city of Ibarra.

PROJECT DESIGN DOCUMENT FORM (CDM-SSC-PDD) - Version 03
CDM – Executive Board
Written invitations were sent to the leaders of the communities included in the Influence Area of the
project.
Written invitations were sent to the public authorities of Ibarra Canton and of CONELEC.
Executive Summary of the Project Environmental Impact Assessment was sent to the attending people.
On Monday April 10th, 2006, in the Sessions Room of the Community Center of the Santa Catalina de
Salinas Parish at 16.15, the Public Audience for the Presentation of the Environmental Impact
Assessment of the IANCEM Cogeneration Project was carried out.
The attendance of authorities of the Company and from Ibarra Canton, the leaders of the Parish
Community Center, residents of involved communities and the representative of CONELEC (Eng. Paola
Andino) was verified. The Public Audience was directed by Engineer Diego Enriquez, representative of
BIOSFERA CIA. LTDA., Coordinator of the Environmental Impact Assessment of the Project.
In the second stage Project Participant invited, through a survey, a group of stakeholders so as to
comment the IANCEM cogeneration project. This survey took place on May 2007.
The following set of questions was sent to a group of stakeholders in order to collect different opinions
on the project activity:
1. According to the information available and your knowledge about issues related to Environment,
Climate Change, Kyoto Protocol, Clean Development Mechanism and Carbon Market; briefly
express your opinion on IANCEM Cogeneration Project.
2. Would you recommend to private parties, governmental authorities or other organisations to
develop this kind of projects (the use of bagasse a renewable fuel source, residue from sugarcane
processing, to generate power projects as a CDM)?
3. Do you consider that IANCEM Cogeneration Project will contribute to social, economic and
environmental development (Sustainable Development) of both, the region and Ecuador itself?
4. How does the IANCEM Cogeneration Project development affect (positively or negatively)
yourself or your environment?
5. Any additional comments you would like to express
The questionnaire was sent to the following people:
Table 12: Stakeholders
NAME POSITION
Paola Chávez Coordinator of the Environmental Science Faculty of the Catholic University of
Ecuador, Ibarra.
Jaidy Lara “Esperanza Negra” handmade group.
Silvia Salgado Andrade Parliament Member of the Ecuador National Congress

PROJECT DESIGN DOCUMENT FORM (CDM-SSC-PDD) - Version 03
CDM – Executive Board
Diego Francisco Granja
Ruales
Corporation for Imbabura
Stalin Muñoz López Bank Manager “Banco del Pacifico Ibarra”
Gabriel Ortiz Bank Manager “Banco del Pichincha Zona Norte del País”
Carlos Dávila Holguin Member of the Ibarra Civic Board
Galo Larrea Ex Ibarra Mayor
Pablo Jurado Moreno Ibarra City Mayor
María Dolores Granja IANCEM Laboratory Chief
E.2. Summary of the comments received:
The following issues were discussed in the Public Audience:
• Explanation of the Project Activities in charge of Engineer Fausto Rivera, Technical Sub-
Manager of INACEM.
• Explanation of the Environmental Impact Assessment in charge of Engineer Diego Enriquez,
representative of BIOSFERA CIA LTDA. During the expositions, a projector was used in order
to show a presentation specially designed so as to assimilate the information in a simple and
graphic manner.
• The exposition of the Environmental Impact Assessment comprised the information of the
environmental sector diagnosis, the significant environmental impacts generated by the project,
and the environmental prevention, mitigation and compensation measures to be applied.
• After the presentation, there was time for hearing the questions and observations of the attending
people, which were answered by the expositors.
The main issues discussed in the questions and observations made were as follows:
• The lack of an Environmental Impact Assessment for the sowing and harvest processes of
sugarcane, which also generate significant impacts in the surrounding communities. The
aforementioned activity is not executed by IANCEM. The Ministry of Environment is
responsible for requesting the mentioned study.
• Support in the compensation of the communities involved in the IANCEM process. It was
determined that IANCEM contributes with 25% of the Income Tax, as part of the budget for the
execution of works in the Santa Catalina de Salinas Parish.
• A representative of Ibarra Canton Municipality made some comments regarding the authority for
reviewing the Environmental Impact Assessment of the Project discussed in the Public Audience.
It was clarified that CONELEC is the authority responsible for the revision and approval of
environmental studies in the sector, power that is directly transferred by the Ministry of
Environment.

PROJECT DESIGN DOCUMENT FORM (CDM-SSC-PDD) - Version 03
CDM – Executive Board
• Specific aspects about the power generation and volume of sugarcane consumption were
discussed. The answers were provided by Eng. Fausto Rivera.
• A deep study and the clarification of environmental control measures regarding gas emissions
were requested. Information was provided about the closed system operating in the boiler, with
regard to the vapor circulation obtained from sugarcane and the treatment system for gas
emissions implemented at the end of the chimney.
Furthermore, the following table shows a synthesis of the comments received through the survey carried
out on May 2007:
Table 13: Synthesis of stakeholders’ comments
Question Nº Synthesis of the opinions received
1 Most of the interviewed people supported the project activity, mainly because the project activity
would lead to a cleaner environment and helps to avoid an increase on Earth’s temperature.
Projects based in renewable electricity generation are very important because they involve a benefit
for electric sector, which will allow the improvement of our situation and do not contaminate the
environment.
2 Yes. Most of the interviewed people would strongly recommend to carry out this kind of projects
based on renewable energy generation, due to its inherit benefits regarding the reduction of CO2
emissions and because it leads the reduction of electricity purchases to the grid.
The use of clean energy is important and must be stimulated in order to avoid environmental
contamination
3 Yes. Most of the interviewed people think that this project would contribute to Sustainable
Development of the region. It promotes the use of cleaner technologies improving the regions’
economic, environmental and social development as a whole.
4 Most of the interviewed people say that the project would positively affect their community, their
environment and the electrical sector.
5 Most of the interviewed people say that they support the project activity and hope that the project
goes ahead because it brings significant benefits trough the use of a renewable source.
It is important to become aware of the use of renewable energy and the environmental issues.
One of the consulted stakeholder does not believe that the project would contribute with the CO2
emission reductions because the bagasse combustion. He would not recommend the use of bagasse
because hydroelectric generation is better and the bagasse could be use in the paper industry.
Also, he considers that the project will not contribute to social and economic development because it
does not generate direct employment as the paper production. Moreover, he says that there are other
alternatives to the suitable use of the renewable source.
This stakeholder will be contacted by IANCEM so as to explain better the project activity and its
contribution to the CO2 emission reductions trough the use of a bagasse to generate power. Since biomass
gives thermal energy with zero net carbon dioxide emission on account of sequestration, the CO2 emitted
during combustion of biomass is much less than the CO2 absorbed by the plants growth. Hence, the net
CO2 emission due to burning of biomass for power generation is zero.

PROJECT DESIGN DOCUMENT FORM (CDM-SSC-PDD) - Version 03
CDM – Executive Board
E.3. Report on how due account was taken of any comments received:
The survey consisted on interviewing different people. Most of them had positive opinions related to
project activity implementation.

PROJECT DESIGN DOCUMENT FORM (CDM-SSC-PDD) - Version 03
CDM – Executive Board
Annex 1
CONTACT INFORMATION ON PARTICIPANTS IN THE PROJECT ACTIVITY
Organization: Ingenio Azucarero del Norte Compañia de Economia Mixta, IANCEM
Street/P.O.Box: Panamericana Norte km 25
Building:
City: Ibarra
State/Region: Imbaburra
Postfix/ZIP:
Country: Ecuador
Telephone: 593 6 2648302
FAX: 593 6 2648302
E-Mail: [email protected]
URL:
Represented by: Eng. Fausto Rivera
Title: Enginer
Salutation: Technical Manager
Last Name: Rivera
Middle Name: León
First Name: Fausto
Department: Technical Management
Mobile: 593 9 9462761
Direct FAX: 593 6 2648302
Direct tel: 593 6 2648302
Personal E-Mail: [email protected]

PROJECT DESIGN DOCUMENT FORM (CDM-SSC-PDD) - Version 03
CDM – Executive Board
Annex 2
INFORMATION REGARDING PUBLIC FUNDING
No public funding from Parties included in Annex I is availed for this project activity.

PROJECT DESIGN DOCUMENT FORM (CDM-SSC-PDD) - Version 03
CDM – Executive Board
Annex 3
BASELINE INFORMATION
The key data used to determine the ex-ante baseline scenario are given in the following table.
Table 14: Key data
Parameter Data Sources
Combined margin emission factor Calculated according to the methodology
ACM0002 version 6.
Variables Data sources
Electricity generation of the industrial facility per year IANCEM
The project activity involves the use of renewable energy to generate electricity. By self-generating, the
proposed project activity will lead the reduction of electricity purchases and permits sell the surplus to
the National Interconnected System. By dispatching renewable electricity to a grid, electricity that would
otherwise be produced using fossil fuel is displaced, reducing CO2 emissions from power plants
connected to the grid.
Thus, baseline emissions includes CO2 emissions from fossil fuels that would have been used by the
operation of grid-connected power plants and by the addition of new generation sources, in order to
generate the quantity of electricity generated by the proposed project activity.
According to the AMS-I.D. Version 12, the baseline is the kWh produced by the renewable generating
unit multiplied by an emission coefficient (measured in kg CO2e/kWh) calculated in a transparent and
conservative manner as:
(c). A combined margin (CM), consisting of the combination of operating margin (OM) and build
margin (BM) according to the procedures prescribed in the approved methodology ACM0002.
Any of the four procedures to calculate the operating margin can be chosen, but the restrictions
to use the Simple OM and the Average OM calculations must be considered
OR
(d). The weighted average emissions (in kg CO2e/kWh) of the current generation mix. The data of the
year in which project generation occurs must be used.
Calculations must be based on data from an official source (where available)5 and made publicly
available.
5 Calculated, if data on fuel type, fuel emission factor, fuel input and power output can be obtained for each plant; if
confidential data available from the relevant host Party authority are used, the calculation carried out by the project
participants shall be verified by the DOE and the CDM-PDD may only show the resultant carbon emission factor and the
corresponding list of plants;
PROJECT DESIGN DOCUMENT FORM (CDM-SSC-PDD) - Version 03
CDM – Executive Board
Option (a) is the one selected in this project. Following the methodology ACM0002 version 6, the
Baseline Emission Factor (EFy) is calculated as a combined margin, consisting of the combination of
Operating Margin Emission Factor (EFOM) and Build Margin Emission Factor (EFBM).
The consolidated methodology gives 4 different options to calculate the Operating Margin Emission
Factor (EFOM). These options are:
(a) Simple OM
(b) Simple adjusted OM
(c) Dispatch Data Analysis OM
(d) Average OM
The selection of the appropriate calculation method depends, among other factors, on the characteristics
of the electrical national grid and the available information about it.
The Simple OM method (a) can only be used where low-cost/must-run resources constitute less than 50%
of total grid generation in: 1) average of the five most recent years, or 2) based on long-term normals for
hydroelectricity production.
The average emission rate method (d) can only be used where low-cost/must run resources constitute
more than 50% of total grid generation and detailed data to apply option (b) and/or (c) is not available.
The methodology recommends the use of option (c) whenever possible.
Dispatch data analysis should be the first methodological choice, but for the proposed project activity the
Operating Margin has been calculated using the Simple Adjusted Method due to the following reasons:
• No publicly available information exists to allow the use of option (c) Dispatch Data Analysis
OM. According to the methodology, the calculation of the OM emission factor, using option (c),
is determined ex-post. In order to write the PDD, project developers may use models to estimate
the reductions prior to validation. Such models should be able to simulate the operation of the
hydroelectric project along with the other interconnected power plants during the crediting
period, and, to achieve this, the data of many years of hydrological behavior are needed. The data
on hydrology are not available.
• In Ecuador low-cost resources constitute more than 50% of the total generation of the national
grid, which prevents from using option (a) Simple OM.
The Operating Margin calculated using the Simple Adjusted Method, which is a variation on the Simple
OM method, where the power sources (including imports) are separated in low-cost/must-run power
sources (k) and other power sources (j).
The Emission Factor was calculated by “CORDELIM” in collaboration with “Eco-Alianzas Estratégicas
Cia. Ltda.” using the Methodology ACM0002 / Ver 6.

PROJECT DESIGN DOCUMENT FORM (CDM-SSC-PDD) - Version 03
CDM – Executive Board
The dispatch data used in this calculation has been provided with the gentle support of the “Power and
Communications Sectors Modernization” Project (PROMEC, CONAM), and the National Electricity
Dispatch Centre (CENACE).
b) Simple adjusted OM methodology
The Simple adjusted OM methodology is using dispatch data from the last three years and is calculated
as the generation weighed average emissions per electricity unit (tCO2/MWh) of all generating sources
serving the system, where the power sources – including imports – are separated in low-cost/must run
power sources (k) and other power sources (j).
∑
∑
∑
∑+−=
k
yk
ki
ki
yki
j
yj
ji
ji
yji
yadjustedsimpleOMGEN
COEFF
yGEN
COEFF
yEF,
,
,
,,
,
,
,
,,
,_,
.
.
.
).1( λλ
where
Fi ,j, y = is the amount of fuel i (in a mass or volume unit) consumed by relevant power sources j in
year(s) y,
j = refers to the power sources delivering electricity to the grid,
COEFi,j y = is the CO2 emission coefficient of fuel i (tCO2 / mass or volume unit of the fuel), taking
into account the carbon content of the fuels used by relevant power sources j and the
percent oxidation of the fuel in year(s) y, and
GENj,y = is the electricity (MWh) delivered to the grid by source j.
Fi,k,y, COEFi,k and GENk are analogous to the variables described above for plants k.
The CO2 emission coefficient COEFi is obtained as:
ijCOii OXIDEFNCVCOEF .. ,2=
where:
NCVi = is the net calorific value (energy content) per mass or volume unit of a fuel i,
OXIDi = is the oxidation factor of the fuel.
EFCO2,i = is the CO2 emission factor per unit of energy of the fuel i.
And,
yearper hours 8,760
margin on are sourcesrun -mustcost / -lowfor which year per hours ofnumber =λ
where lambda (λy) should be calculated as follows:

PROJECT DESIGN DOCUMENT FORM (CDM-SSC-PDD) - Version 03
CDM – Executive Board
Step i) Plot a Load Duration Curve. Collect chronological load data (typically in MW) for each hour of a
year, and sort load data from highest to lowest MW level. Plot MW against 8,760 hours in the year, in
descending order.
Step ii) Organize Data by Generating Sources. Collect data for, and calculate total annual generation (in
MWh) from low-cost/must-run resources (i.e. Σk GENk,y).
Step iii) Fill Load Duration Curve. Plot a horizontal line across load duration curve such that the area
under the curve (MW times hours) equals the total generation (in MWh) from lowcost/must-run
resources (i.e. ΣkGENk,y).
Step iv) Determine the "Number of hours per year for which low-cost/must-run sources are on the
margin". First, locate the intersection of the horizontal line plotted in step (iii) and the load duration
curve plotted in step (i). The number of hours (out of the total of 8,760 hours) to the right of the
intersection is the number of hours for which low-cost/must-run sources are on the margin. If the lines do
not intersect, then one may conclude that lowcost/must-run sources do not appear on the margin and λy is
equal to zero. Lambda (λy) is the calculated number of hours divided by 8,760.
Fuel characteristics and dispatch values used in the calculation were taken from the following
references and sources
• The calorific values used are default values taken from the “2006 IPCC Guidelines for National
Greenhouse Gas Inventories” and the “Greenhouse Gas assessment Handbook – A practical
Guidance Document for the assessment of Project-level Greenhouse Gas Emissions – Global
Environment Division, World bank, 1998”
• The fuel oxidation factors used are values taken from the “2006 IPCC Guidelines for National
Greenhouse Gas Inventories”
• The Ecuadorian dispatch data from 2003 to 2005 are taken from “Estadística del sector eléctrico
Ecuatoriano, año 2003, 2004 & 2005, CONELEC”.
• The Exact Ecuadorian hourly dispatch data have been provided by CENACE.

PROJECT DESIGN DOCUMENT FORM (CDM-SSC-PDD) - Version 03
CDM – Executive Board
The calorific values and the fuels oxidation factors are given in the following table:
Fuel Density
(ton/m3)
Net calorific
value
(TJ/103 ton)
TJ/gal
Carbon
content
(tC/TJ)
t C/gal Oxidation
Factors %
Emission
Factors
(t C/gal)
Emission
Factors
(tCO2/gal)
Fuel oil 0.96 40.4 0.000147 21.1 0.003098 1 0.003098 0.011358
Diesel 0.88 43 0.000143 20.2 0.002893 1 0.002893 0.010609
Nafta 0.74 44.5 0.000125 20 0.002493 1 0.002493 0.009141
Raw 0.86 42.3 0.000138 20 0.002754 1 0.002754 0.010098
Others 0.86 40.2 0.000131 20 0.002617 1 0.002617 0.009597
Fuel Density
(ton/m3)
Net calorific
value
(TJ/103 ton)
TJ/gal
Carbon
content
(tC/TJ)
t C/ft3 Oxidation
Factors %
Emission
Factors
(t C/ ft3)
Emission
Factors
(tCO2/ ft3)
Natural
Gas 0.00074 48 0.000001 15.3 0.000015 1 0.000015 0.000056
Ecuadorian Operating Margin:
Using the above guidelines and references, λy was calculated for each year as shown below:
Lambda (λ) 2003
Hour
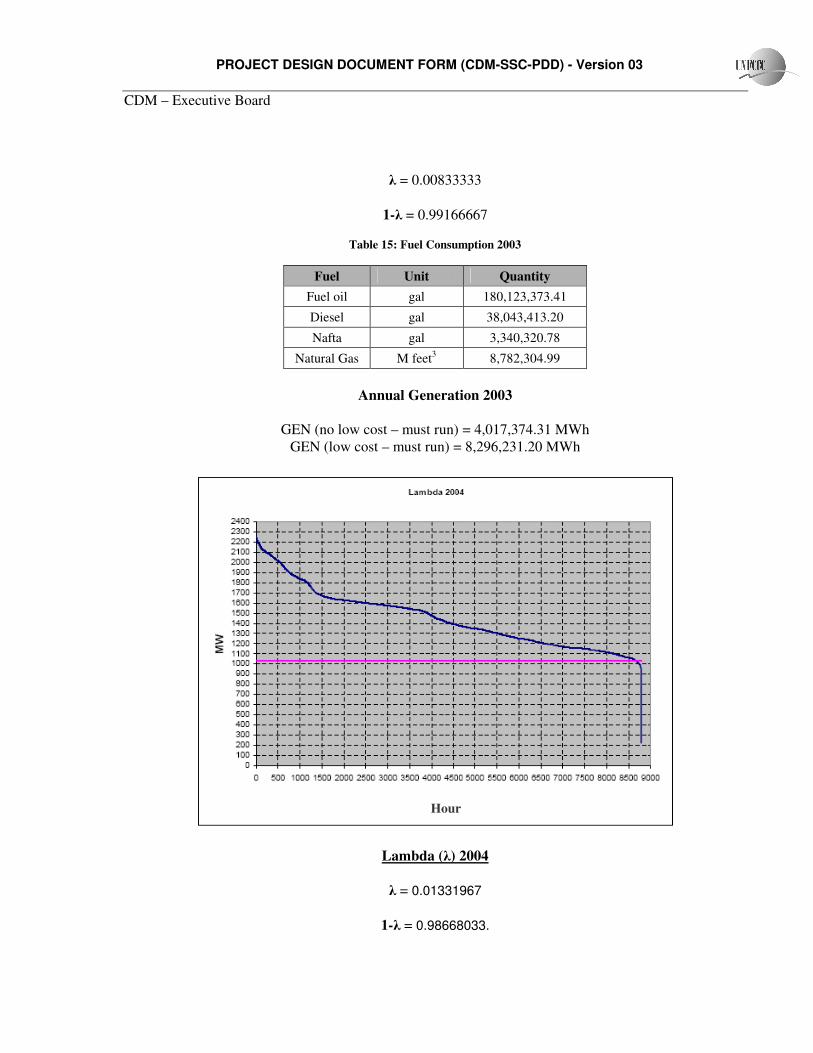
PROJECT DESIGN DOCUMENT FORM (CDM-SSC-PDD) - Version 03
CDM – Executive Board
λ = 0.00833333
1-λ = 0.99166667
Table 15: Fuel Consumption 2003
Fuel Unit Quantity
Fuel oil gal 180,123,373.41
Diesel gal 38,043,413.20
Nafta gal 3,340,320.78
Natural Gas M feet3 8,782,304.99
Annual Generation 2003
GEN (no low cost – must run) = 4,017,374.31 MWh
GEN (low cost – must run) = 8,296,231.20 MWh
Lambda (λ) 2004
λ = 0.01331967
1-λ = 0.98668033.
Hour

PROJECT DESIGN DOCUMENT FORM (CDM-SSC-PDD) - Version 03
CDM – Executive Board
Table 16: Fuel Consumption 2004
Fuel Unit Quantity
Fuel oil gal 168,400,787.14
Diesel gal 55,493,120.27
Nafta gal 5,782,832.00
Natural Gas M feet3 8,489,427.00
Raw gal -
Others gal 8,904,731.00
Annual Generation 2004
GEN (no low cost – must run) = 4,151,248.20 MWh
GEN (low cost – must run) = 9,037,269.50 MWh
Lambda (λ) 2005
λ = 0.00011416
1-λ = 0.99988584
Table 17: Fuel Consumption 2005
Hour

PROJECT DESIGN DOCUMENT FORM (CDM-SSC-PDD) - Version 03
CDM – Executive Board
Fuel Unit Quantity
Fuel oil gal 201,288,733.48
Diesel gal 84,575,676.06
Nafta gal 26,504,327.20
Natural Gas M feet3 9,244,613.99
Raw gal -
Others gal 10,655,589.63
Annual Generation 2005
GEN (no low cost – must run) = 5,317,441.96 MWh
GEN (low cost – must run) = 8,692,068.28 MWh
And the Operating Margin from 2003 to 2005 was calculated to 0.74673 tCO2/MWh.
Calculating the Build Margin
The Build Margin is calculated as the generation-weighted average emission factor (tCO2/MWh) of a
sample of power plants m, as follows:
∑
∑=
m
ym
mi
mi
ymi
yBMGEN
COEFF
EF,
,
,
,,
,
.
where Fi,m,y , COEFi,m and GENm,y are analogous to the variables described for the simple adjusted OM
method above for plants m.
Fuel characteristics and values used in the calculation were taken from the following references and
sources:
• The calorific values used are default values taken from the “2006 IPCC Guidelines for National
Greenhouse Gas Inventories” and the “Greenhouse Gas assessment Handbook – A practical
Guidance Document for the assessment of Project-level Greenhouse Gas Emissions – Global
Environment Division, World bank, 1998”
• The fuel oxidation factors used are values taken from the “2006 IPCC Guidelines for National
Greenhouse Gas Inventories”
• The Ecuadorian dispatch data from 2003 to 2005 are taken from “Estadística del sector eléctrico
Ecuatoriano, año 2003, 2004 & 2005, CONELEC”
Ecuadorian Build Margin
The first option was chosen to calculate the Build Margin, using the power plant capacity additions in the
electricity system that compromises 20 % of the most recent added system generation. This combination
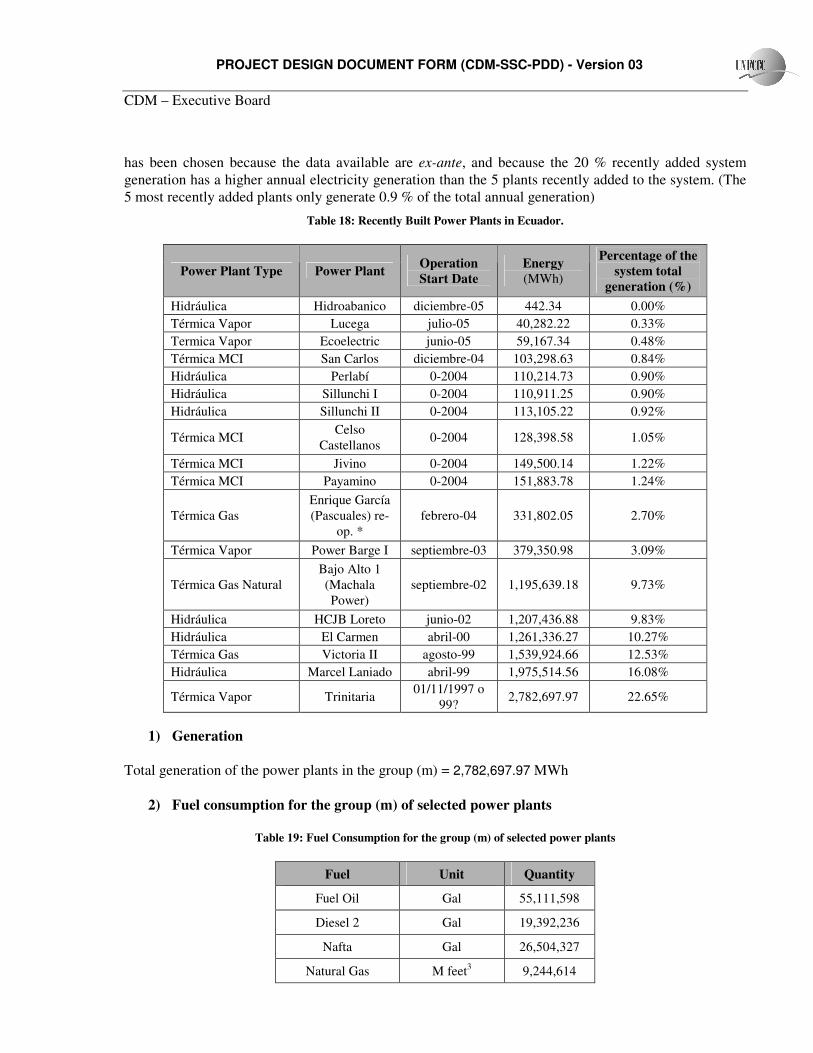
PROJECT DESIGN DOCUMENT FORM (CDM-SSC-PDD) - Version 03
CDM – Executive Board
has been chosen because the data available are ex-ante, and because the 20 % recently added system
generation has a higher annual electricity generation than the 5 plants recently added to the system. (The
5 most recently added plants only generate 0.9 % of the total annual generation)
Table 18: Recently Built Power Plants in Ecuador.
Power Plant Type Power Plant Operation
Start Date
Energy
(MWh)
Percentage of the
system total
generation (%)
Hidráulica Hidroabanico diciembre-05 442.34 0.00%
Térmica Vapor Lucega julio-05 40,282.22 0.33%
Termica Vapor Ecoelectric junio-05 59,167.34 0.48%
Térmica MCI San Carlos diciembre-04 103,298.63 0.84%
Hidráulica Perlabí 0-2004 110,214.73 0.90%
Hidráulica Sillunchi I 0-2004 110,911.25 0.90%
Hidráulica Sillunchi II 0-2004 113,105.22 0.92%
Térmica MCI Celso
Castellanos 0-2004 128,398.58 1.05%
Térmica MCI Jivino 0-2004 149,500.14 1.22%
Térmica MCI Payamino 0-2004 151,883.78 1.24%
Térmica Gas
Enrique García
(Pascuales) re-
op. *
febrero-04 331,802.05 2.70%
Térmica Vapor Power Barge I septiembre-03 379,350.98 3.09%
Térmica Gas Natural
Bajo Alto 1
(Machala
Power)
septiembre-02 1,195,639.18 9.73%
Hidráulica HCJB Loreto junio-02 1,207,436.88 9.83%
Hidráulica El Carmen abril-00 1,261,336.27 10.27%
Térmica Gas Victoria II agosto-99 1,539,924.66 12.53%
Hidráulica Marcel Laniado abril-99 1,975,514.56 16.08%
Térmica Vapor Trinitaria 01/11/1997 o
99? 2,782,697.97 22.65%
1) Generation
Total generation of the power plants in the group (m) = 2,782,697.97 MWh
2) Fuel consumption for the group (m) of selected power plants
Table 19: Fuel Consumption for the group (m) of selected power plants
Fuel Unit Quantity
Fuel Oil Gal 55,111,598
Diesel 2 Gal 19,392,236
Nafta Gal 26,504,327
Natural Gas M feet3 9,244,614

PROJECT DESIGN DOCUMENT FORM (CDM-SSC-PDD) - Version 03
CDM – Executive Board
Raw Gal -
The calculated Build Margin is: 0.573404 tCO2/MWh
Calculating the Emission Factor
The Emission Factor is a weighted average of the Operating Margin emission factor (EFOM,y) and the
Build Margin emission factor (EFBM,y):
yBMBMyOMOMy EFwEFwEF ,, .. +=
where the weights wOM and wBM, by default, are 50% (i.e., wOM = wBM = 0.5), and EFOM,y and EFBM,y are
calculated as described in Steps 1 and 2 above and are expressed in tCO2/MWh.
Emission Factors - Ecuadorian electricity grid, 2003 – 2005
Default CDM projects - using the default 50 % weights: 0.66007tCO2/MWh
Wind and Solar projects – using 75 % OM and 25 % BM: 0.70340 tCO2/MWh
PROJECT DESIGN DOCUMENT FORM (CDM-SSC-PDD) - Version 03
CDM – Executive Board
Annex 4
MONITORING INFORMATION
The Monitoring and Verification Plan (MVP) describes the procedures for data collection, and auditing
required for the project, in order to determine and verify emissions reductions achieved by the project.
This project will require only very straightforward collection of data, described below, most of which is
already collected routinely by the staff of IANCEM, where the proposed CDM project is to be
implemented.
The MVP document fulfills the CDM Executive Board requirement that CDM projects have a clear,
credible, and accurate set of monitoring and verification procedures. The purpose of these procedures is
to direct and support continuous monitoring of project performance and periodic auditing, verification
and certification activities to determine project outcomes, in particular in terms of greenhouse gas (GHG)
emission reductions. The MVP is a vital component of project design, and as such is subject to a formal
third-party validation process —along with the project baseline and other project design features.
Managers of the project must maintain credible, transparent, and adequate data estimation, measurement,
collection, and tracking systems to successfully develop and maintain the proper set of information to
undergo an audit for a greenhouse gas (GHG) emission reduction investment. These records and
monitoring systems are needed to subsequently allow an Operational Entity to verify project performance
as part of the verification and certification process. In particular, this process reinforces the fact that
GHG reductions are real and credible to the buyers of the Certified Emissions Reductions (CERs). This
set of information will be needed to meet the evolving international reporting standards developed by the
UNFCCC.
The document must be used by the project implementers and operators of the Technical Departments of
IANCEM. Strict adherence to the guidelines set out in this monitoring plan is necessary for the project
managers and operators to successfully measure and track project impacts for audit purposes.
According to Type I, Category C of small-scale project activity categories contained in appendix B of the
Simplified M&P for CDM Small-Scale Project Activity, monitoring shall consist of metering the
electricity generated by the renewable technology and the amount of biomass.
The equipment used for monitoring the amount of electricity generated is a multifunction relay for the
management of energy GE 489 used for the internal monitoring. Also the ABB brand measuring
equipment in the Emelnorte connection could be use for metering the electricity generation in order to
have quality assurance and quality control procedure to be applied.
The calibration certificate of the ABB measuring equipment, which measures the energy purchase-sale
was requested to Emelnorte and is being processed. The 4890 multifunction relay was installed by
SINER Engenharia e Comércio Ltda., with process number SN-04292G, a firm specialized in this type of
work. The relay data and diagrams are included in the instructions manual of the charts and cubicles,
whose printed copy is kept in the Central Office of the Electric Department.
The calibration of the equipment for measuring the generated energy was performed in the testing
protocols carried out before the assembling and the copies are included in the inspection and testing
report. Annually, as from the start-up of operations, the calibration of the energy purchase-sale measuring

PROJECT DESIGN DOCUMENT FORM (CDM-SSC-PDD) - Version 03
CDM – Executive Board
equipment will be required. The organism that shall calibrate this equipment is the Empresa Eléctrica del
Norte S.A.
The maintenance of the electricity measuring equipment is considered in the IANCEM maintenance plan
for the electronic equipment, which describes the actions to be carried out. Since this is electronic
equipment without moveable parts, the maintenance involves weekly, monthly and half-yearly cleaning,
revision and adjustment, depending on each case.
The methodologies describe the procedure and equations for calculating emissions reductions from
monitored data. For the specific project, the methodologies are applied through spreadsheet model. The
staff responsible for project monitoring must complete the electronic worksheets on a shift basis. The
spreadsheets automatically provide annual totals in terms of GHG reductions achieved through the
project.
The models contain a series of worksheets with different functions:
• Data entry sheets: Electricity Generation.
• Result sheet: Emission Reductions
There are worksheets where the user is allowed to enter data. All other cells contain model fixed
parameters or computed values that cannot be modified by the staff.
A color-coded key is used to facilitate data input. The key for the code is as follows:
• Input Fields: Pale yellow fields indicate cells where project operators are required to supply data
input, as is needed to run the model;
• Result Fields: Green fields display result lines as calculated by the model.
Other sheets include fixed values, or values that are computed from data in the data entry sheets, and the
last sheet shows the resulted annual emissions reductions.
The monitored data shall be register by the operator directly from the turbogenerator indicative
instruments in the R-MIN-19, a writing file which have the responsible signature. The files shall be kept
in the file REPORTES TG 3MW in the Electric Department Central Office. When the data collection
system is implemented, the files will be kept electronically, with a back up in CDs.
In case that the monitored data related to the electric energy were missing, it is possible to take the
information from the SCHNEIDER half-tension circuit breakers, which show all the parameters to be
monitored. In case this information was lost again, the data from the SCHNEIDER low-tension circuit
breakers will be collected. That is to say, there are three options of manual data collection, making the
system more reliable.
If, for any reason (failure in TCs, TPs, other), an adjustment of data were required, the Chief of the
Electric Department will be in charge of this adjustment, considering the work regime in the sugar mill,
allowing the reconstruction of information, if necessary. As a last resort, when the information is not
reliable it shall not be considered in the emission reductions calculation.

PROJECT DESIGN DOCUMENT FORM (CDM-SSC-PDD) - Version 03
CDM – Executive Board
All electronic data will be backed up on a daily basis, and two electronic copies of each document will be
kept in different locations (each plant and its respective Head Office). These data will be archived for
two years following the end of the crediting period.
Since the registers are included in the ISO system Requirements 6.3 and 7.6 and the equipment
incorporated in the electronic maintenance plan, these shall be subject to periodical audits. These
auditing plan includes internally and externally audits according to the Ingenio Azucarero del Norte
Quality Management System ISO 9001:2000 (Sistema de Gestión de Calidad 9001:2000).
- - - - -