clean coal technology for the future power generation · clean coal technology for the future power...
TRANSCRIPT

Keiji MAKINOSenior Fellow
Japan Coal Energy Center
1
Palais des Nations, Geneva
October 29, 2015
Clean Coal Technology
for the Future Power Generation
UNECE Best Practice in Production of
Electricity from Coal

JCOAL
2
CONTENTS
1. Coal Now
2. What is Clean Coal Technology?
3. Environmental Protection
4. Global Warming
4.1 High Efficiency
4.2 CO2
Capture
4.3 Biomass Co-Combustion
5. Coal ash utilization
6. Japanese Roadmap of Clean Coal
Technology
7. Lastly-------
3
4
1. Coal Now
5
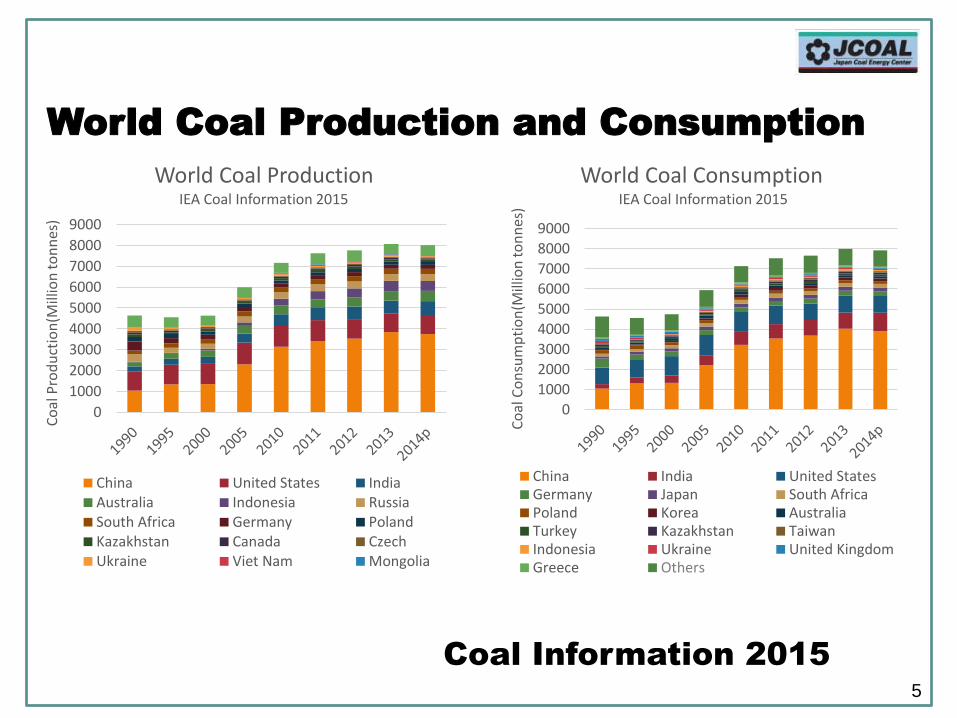
World Coal Production and Consumption
Coal Information 2015
0
1000
2000
3000
4000
5000
6000
7000
8000
9000
Co
al C
on
sum
pti
on
(Mill
ion
to
nn
es)
World Coal ConsumptionIEA Coal Information 2015
China India United StatesGermany Japan South AfricaPoland Korea AustraliaTurkey Kazakhstan TaiwanIndonesia Ukraine United KingdomGreece Others
0
1000
2000
3000
4000
5000
6000
7000
8000
9000
Co
al P
rod
uct
ion
(Mill
ion
to
nn
es)
World Coal ProductionIEA Coal Information 2015
China United States IndiaAustralia Indonesia RussiaSouth Africa Germany PolandKazakhstan Canada CzechUkraine Viet Nam Mongolia
6
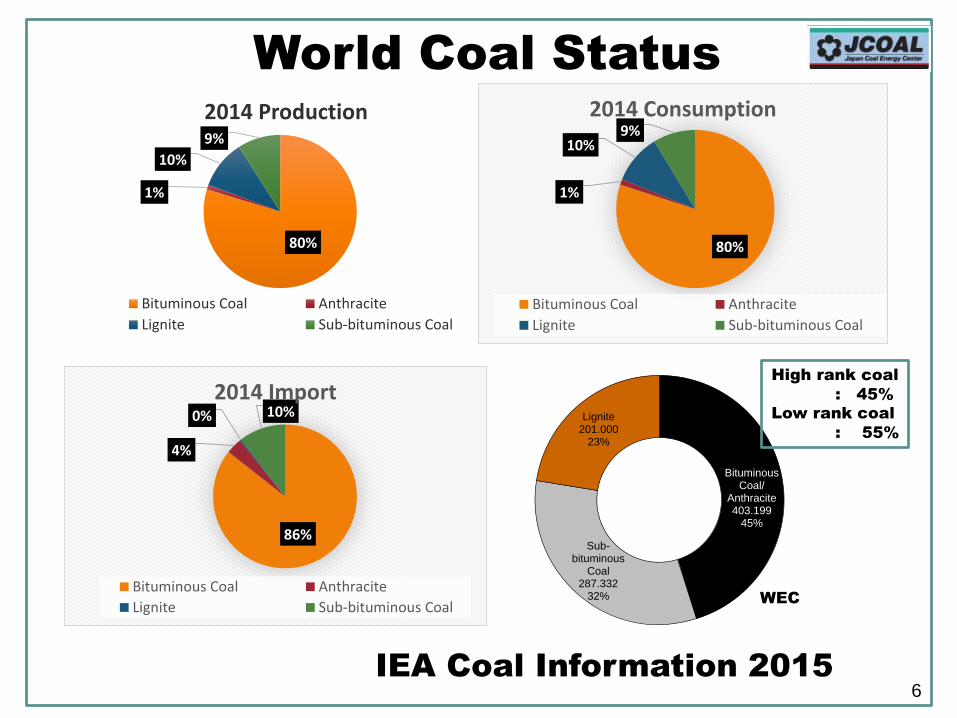
World Coal Status
80%
1%
10%
9%
2014 Production
Bituminous Coal Anthracite
Lignite Sub-bituminous Coal
80%
1%
10%9%
2014 Consumption
Bituminous Coal Anthracite
Lignite Sub-bituminous Coal
86%
4%
0% 10%2014 Import
Bituminous Coal Anthracite
Lignite Sub-bituminous Coal
IEA Coal Information 2015
Bituminous Coal/
Anthracite403.199
45%
Sub-bituminous
Coal287.332
32%
Lignite201.000
23%
WEC
High rank coal
: 45%
Low rank coal
: 55%
7
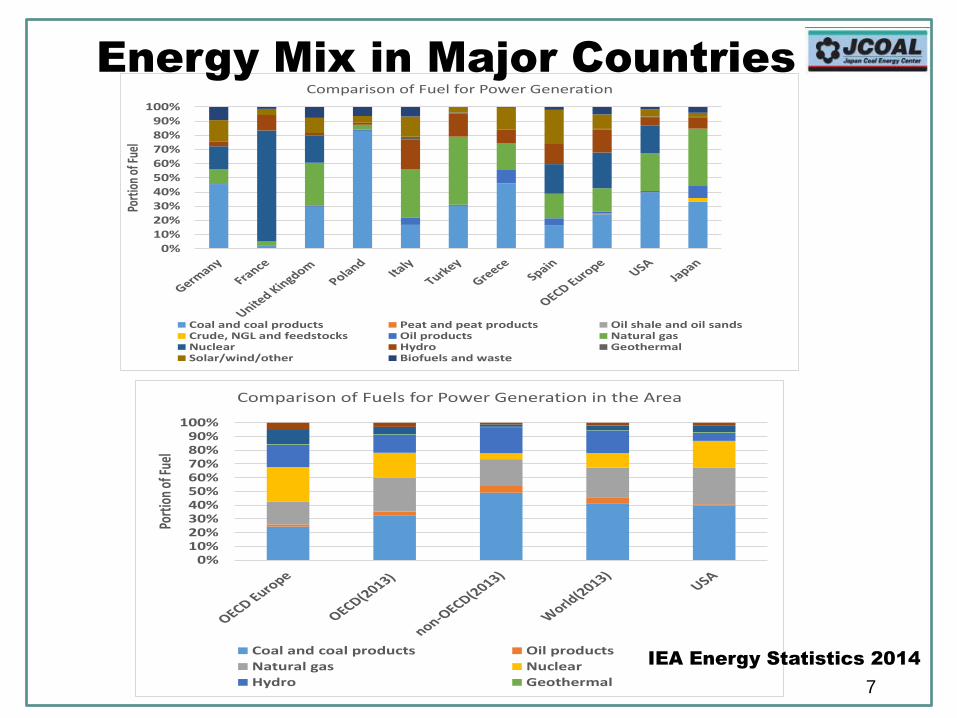
0%10%20%30%40%50%60%70%80%90%
100%
Port
ion
of Fu
el
Comparison of Fuels for Power Generation in the Area
Coal and coal products Oil products
Natural gas Nuclear
Hydro Geothermal
0%
10%
20%
30%
40%
50%
60%
70%
80%
90%
100%
Port
ion
of Fu
el
Comparison of Fuel for Power Generation
Coal and coal products Peat and peat products Oil shale and oil sandsCrude, NGL and feedstocks Oil products Natural gasNuclear Hydro GeothermalSolar/wind/other Biofuels and waste
Energy Mix in Major Countries
IEA Energy Statistics 2014
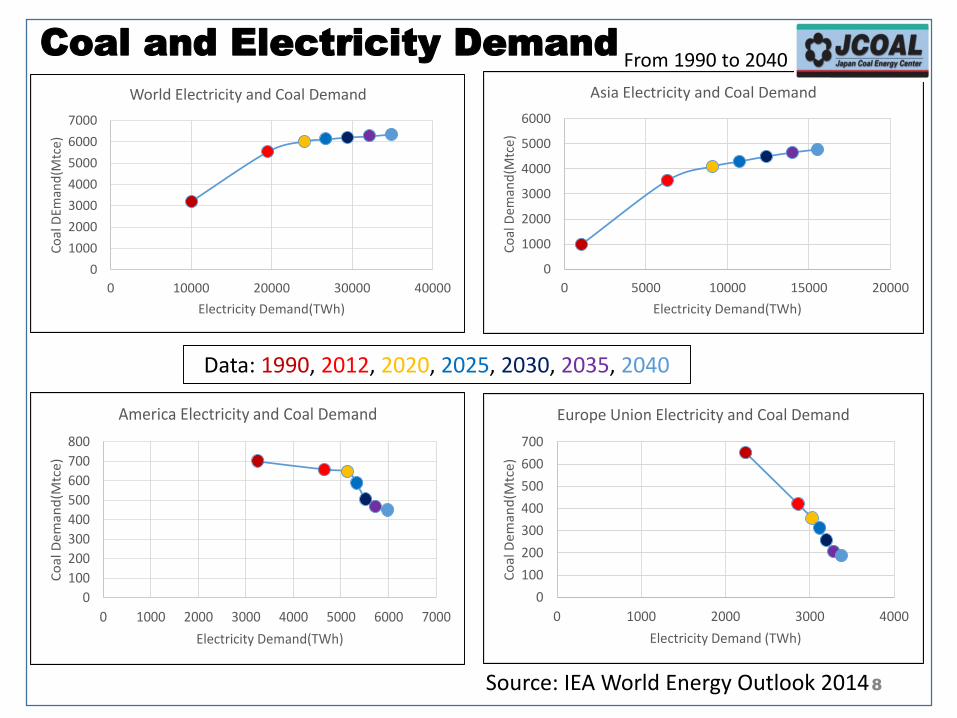
Coal and Electricity Demand
Source: IEA World Energy Outlook 2014
From 1990 to 2040
Data: 1990, 2012, 2020, 2025, 2030, 2035, 2040
0
100
200
300
400
500
600
700
800
0 1000 2000 3000 4000 5000 6000 7000
Co
al D
em
an
d(M
tce
)
Electricity Demand(TWh)
America Electricity and Coal Demand
0
1000
2000
3000
4000
5000
6000
0 5000 10000 15000 20000
Co
al D
eman
d(M
tce)
Electricity Demand(TWh)
Asia Electricity and Coal Demand
0
100
200
300
400
500
600
700
0 1000 2000 3000 4000
Co
al D
em
and
(Mtc
e)
Electricity Demand (TWh)
Europe Union Electricity and Coal Demand
0
1000
2000
3000
4000
5000
6000
7000
0 10000 20000 30000 40000
Co
al D
Eman
d(M
tce)
Electricity Demand(TWh)
World Electricity and Coal Demand
8
9
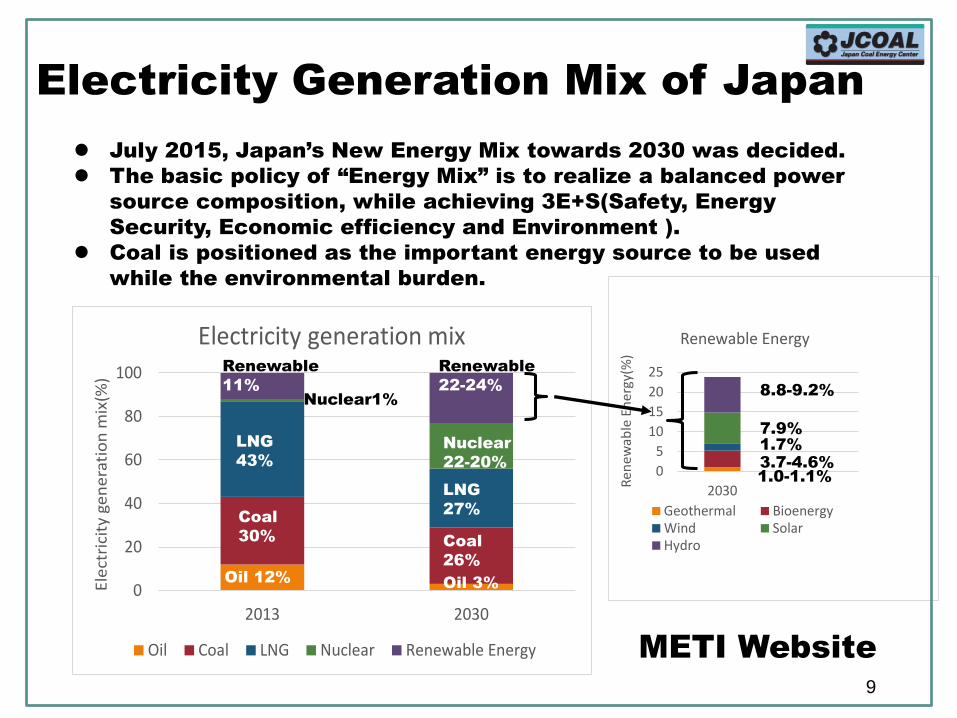
Electricity Generation Mix of Japan
July 2015, Japan’s New Energy Mix towards 2030 was decided.
The basic policy of “Energy Mix” is to realize a balanced power
source composition, while achieving 3E+S(Safety, Energy
Security, Economic efficiency and Environment ).
Coal is positioned as the important energy source to be used
while the environmental burden.
0
5
10
15
20
25
2030
Re
ne
wab
le E
ne
rgy(
%)
Renewable Energy
Geothermal BioenergyWind SolarHydro
0
20
40
60
80
100
2013 2030
Ele
ctri
city
ge
ne
rati
on
mix
(%)
Electricity generation mix
Oil Coal LNG Nuclear Renewable Energy
Oil 12%
Coal
30%
LNG
43%
Nuclear1%
Renewable
11%
Oil 3%
Coal
26%
LNG
27%
Nuclear
22-20%
Renewable
22-24%8.8-9.2%
7.9%
1.7%
3.7-4.6%
1.0-1.1%
METI Website

10
2. What is Clean Coal
Technology ?
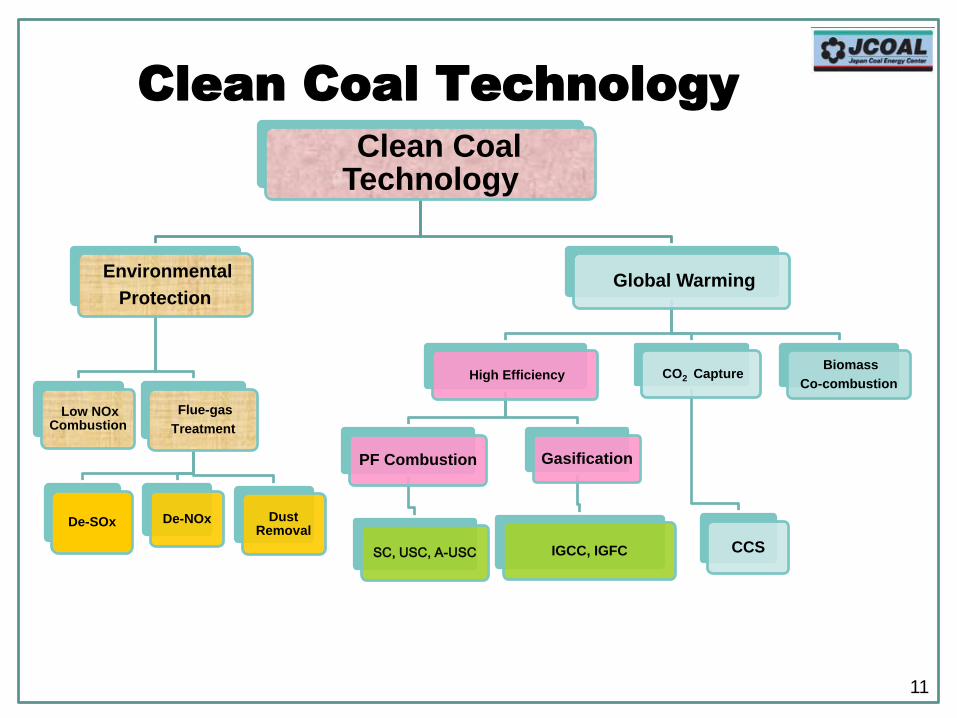
Clean Coal Technology
Clean Coal Technology
Environmental
Protection
Low NOx Combustion
Flue-gas
Treatment
De-SOx De-NOx Dust Removal
Global Warming
High Efficiency
PF Combustion
SC, USC, A-USC
Gasification
IGCC, IGFC
CO2 Capture
CCS
Biomass
Co-combustion
11
3. Environmental Protection
12
13
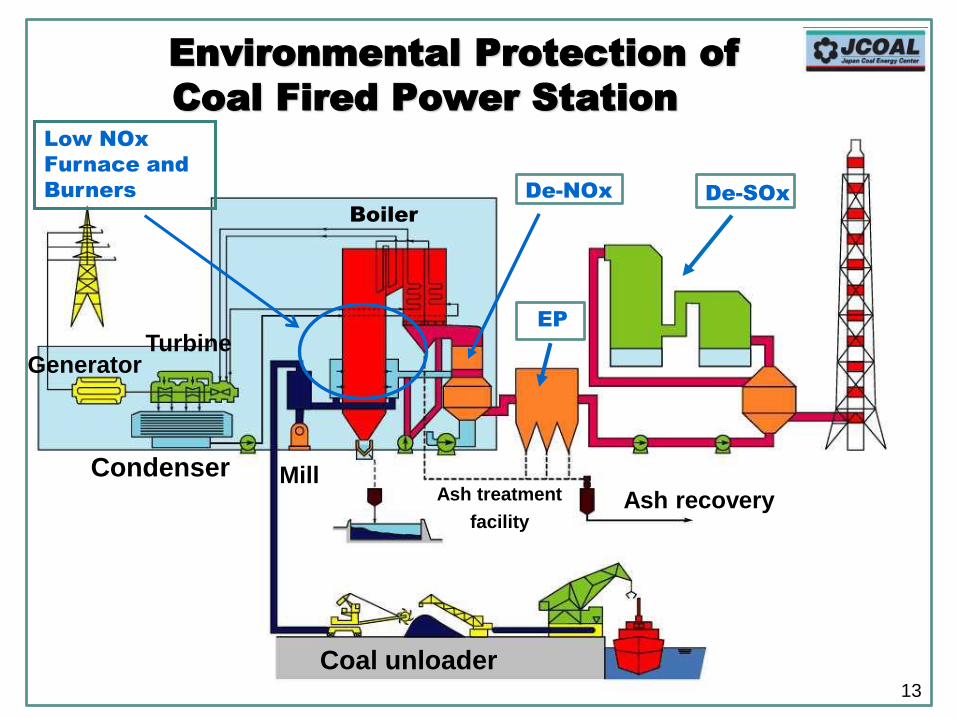
Environmental Protection of
Coal Fired Power Station
CondenserAsh treatment
facility
Turbine
Coal unloader
MillAsh recovery
Generator
Low NOx
Furnace and
Burners
Boiler
De-SOx
EP
De-NOx
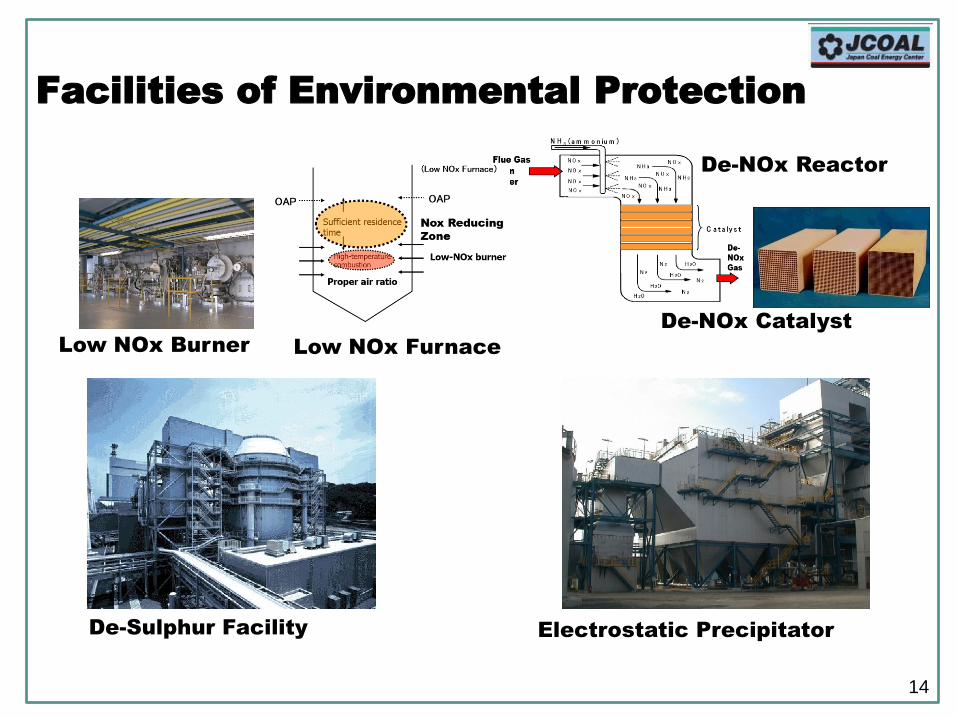
Facilities of Environmental Protection
14
De-NOx Catalyst
De-NOx Reactor
Low NOx Burner
De-Sulphur Facility Electrostatic Precipitator
Low NOx Furnace
15
4. Global Warming
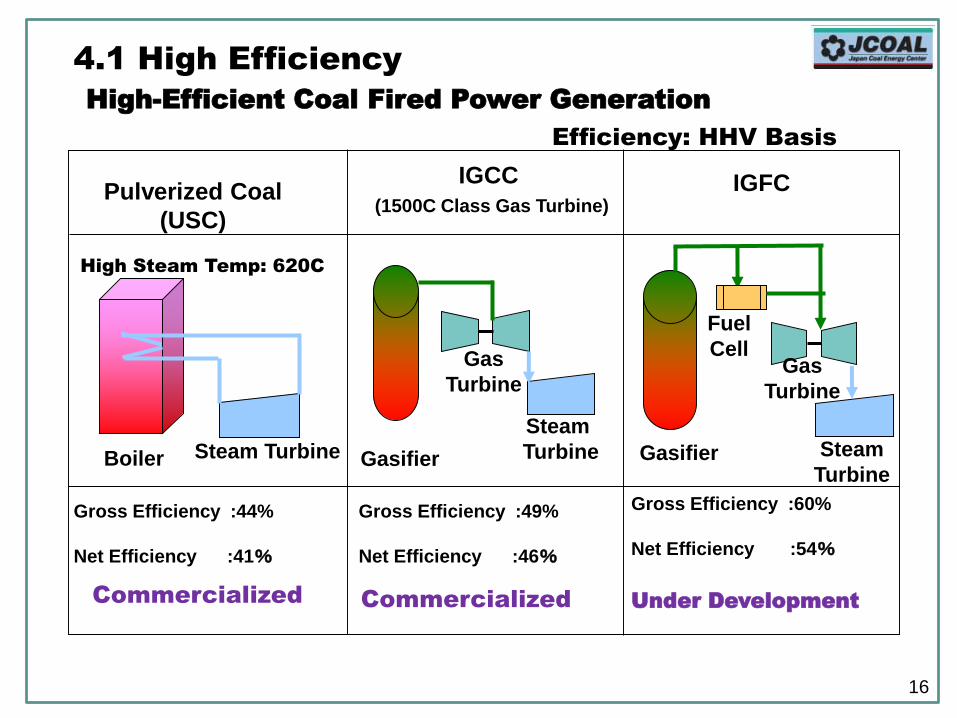
Boiler Steam Turbine Gasifier
Gas
Turbine
Steam
Turbine Gasifier
Gas
Turbine
Steam
Turbine
Fuel
Cell
Pulverized Coal
(USC)
IGCC
(1500C Class Gas Turbine)IGFC
Gross Efficiency :44%
Net Efficiency :41%
Gross Efficiency :60%
Net Efficiency :54%
Under Development
High-Efficient Coal Fired Power Generation
16
Efficiency: HHV Basis
Commercialized
Gross Efficiency :49%
Net Efficiency :46%
Commercialized
High Steam Temp: 620C
4.1 High Efficiency

Year of operation
Steam pressure
(16.6)
(24.1)
450
483485
538
566 593
(31.0)
5
10
15
20
25550
500
450
400
Ste
am
pre
ss
ure
( M
Pa
)
(4.1)
‘55 ‘60 ‘65 ‘70 ‘90 ‘95 2000
30
~~~
600
610
~~
~
Ste
am
tem
pera
ture(℃
)
620
Tem
pera
ture
/P
ress
ure
17
Hekinan No.1
Isogo No.2
Isogo No.1
Tachibanawan No.1
Steam
TemperatureUSC
Steam Temperature Increase of Boiler
(Japanese Ultra Super Critical Units)
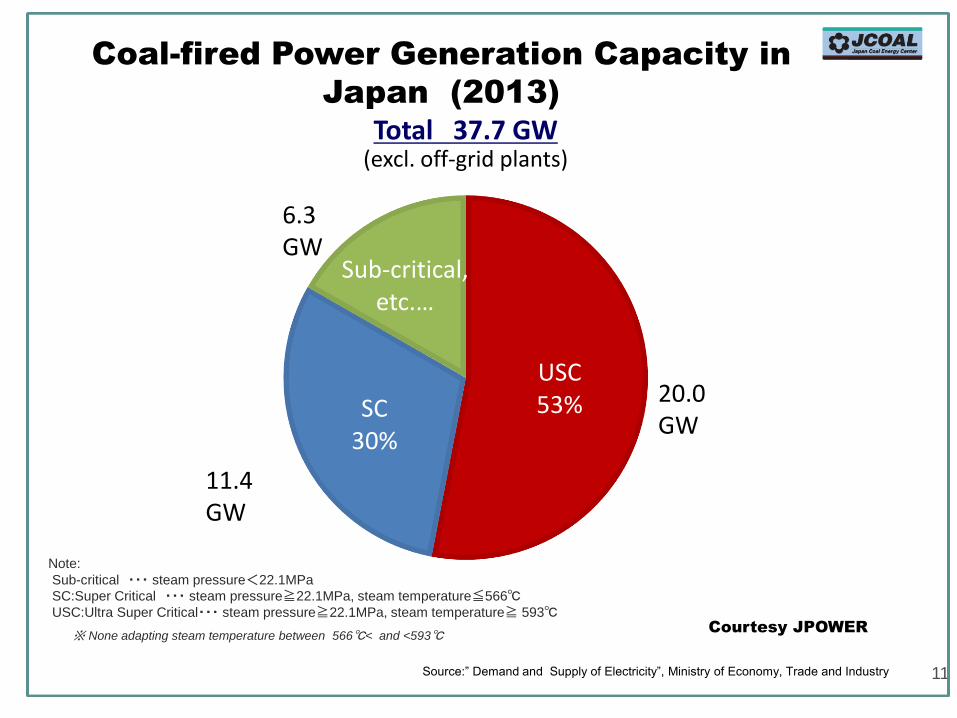
Coal-fired Power Generation Capacity in
Japan (2013)
Note:
Sub-critical ・・・ steam pressure<22.1MPa
SC:Super Critical ・・・ steam pressure≧22.1MPa, steam temperature≦566℃USC:Ultra Super Critical・・・ steam pressure≧22.1MPa, steam temperature≧ 593℃
※ None adapting steam temperature between 566℃< and <593℃
Total 37.7 GW (excl. off-grid plants)
Source:” Demand and Supply of Electricity”, Ministry of Economy, Trade and Industry
USC53%SC
30%
Sub-critical, etc.…
20.0 GW
6.3 GW
11.4 GW
11
Courtesy JPOWER
19
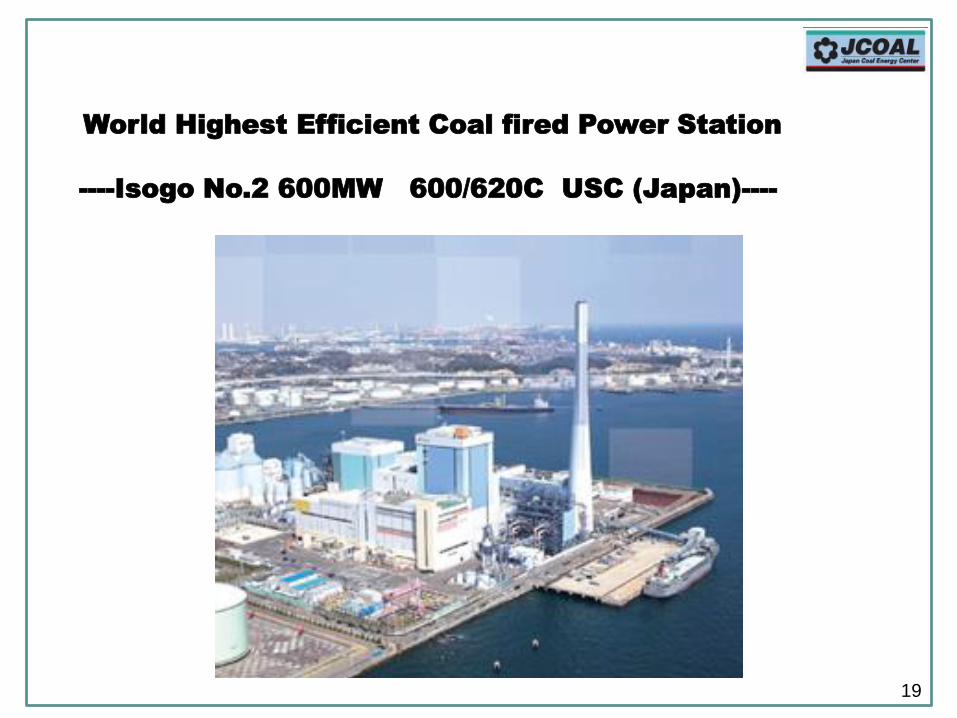
World Highest Efficient Coal fired Power Station
----Isogo No.2 600MW 600/620C USC (Japan)----

20
Installation of USC in the World
McCoy Power Reports
・Installed capacity of coal fired power generation is 100-110GW/year by 2014. ・First Ultra Super Critical Unit (USC) was installed in Japan in 1993. Since then, USC is increasing. But super critical and Sub critical units are decreasing.・60% of recent installation is USC in the world. SC is less than 10%.・Recent installation is almost USC in China.
0
10
20
30
40
50
60
70
0
20
40
60
80
100
120
Pe
rce
nt
of
US
C(%
)
Inst
all
ed
Ca
pa
cit
y (
GW
)
USC SC Sub Ratio of USC
0
10
20
30
40
50
60
70
80
90
0
20
40
60
80
100
120
Pe
rce
nt
of
US
C (
%)
INst
all
ed
Ca
pa
cit
y (
GW
)
USC SC Sub USCの割合
World installation Chinese installation
21
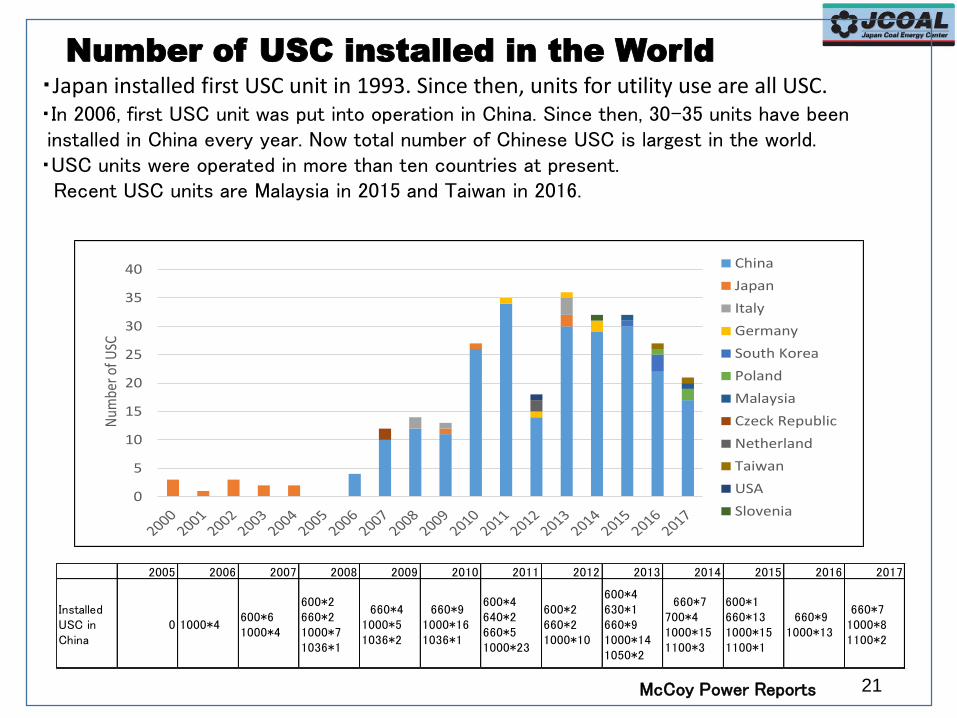
Number of USC installed in the World
McCoy Power Reports
・Japan installed first USC unit in 1993. Since then, units for utility use are all USC.・In 2006, first USC unit was put into operation in China. Since then, 30-35 units have been installed in China every year. Now total number of Chinese USC is largest in the world.・USC units were operated in more than ten countries at present.
Recent USC units are Malaysia in 2015 and Taiwan in 2016.
2005 2006 2007 2008 2009 2010 2011 2012 2013 2014 2015 2016 2017
InstalledUSC inChina
0 1000*4600*61000*4
600*2660*21000*71036*1
660*41000*51036*2
660*91000*161036*1
600*4640*2660*51000*23
600*2660*21000*10
600*4630*1660*91000*141050*2
660*7700*41000*151100*3
600*1660*131000*151100*1
660*91000*13
660*71000*81100*2
0
5
10
15
20
25
30
35
40
Num
ber o
f USC
China
Japan
Italy
Germany
South Korea
Poland
Malaysia
Czeck Republic
Netherland
Taiwan
USA
Slovenia
22
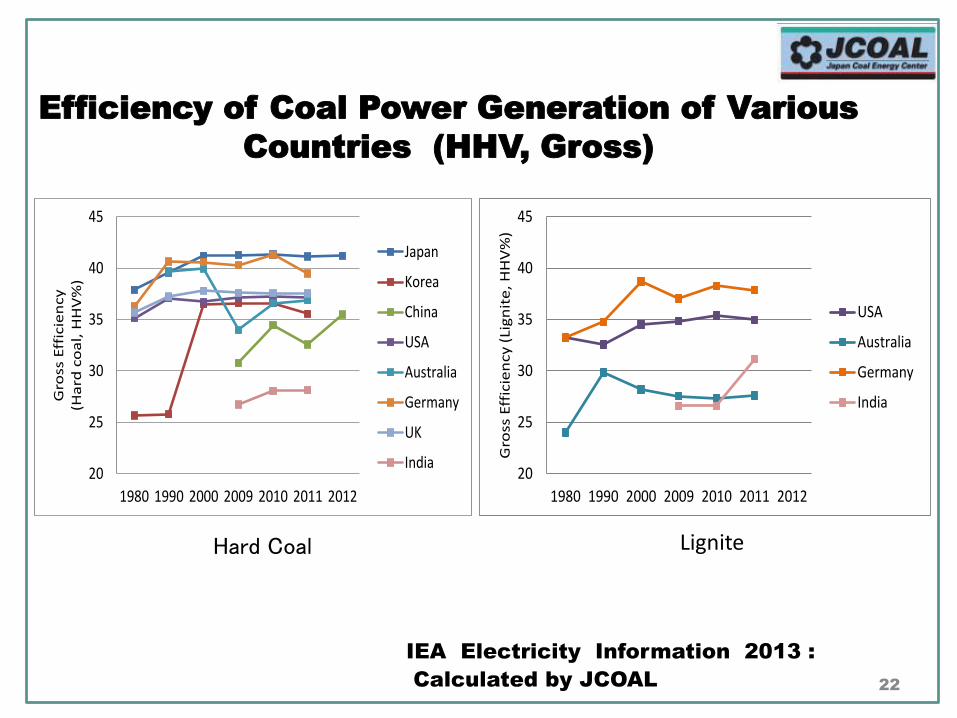
Efficiency of Coal Power Generation of Various
Countries (HHV, Gross)
IEA Electricity Information 2013 :
Calculated by JCOAL
Hard Coal Lignite
20
25
30
35
40
45
1980 1990 2000 2009 2010 2011 2012
Gro
ss E
ffic
ien
cy
(Ha
rd c
oa
l, H
HV
%)
Japan
Korea
China
USA
Australia
Germany
UK
India20
25
30
35
40
45
1980 1990 2000 2009 2010 2011 2012G
ross
Eff
icie
ncy
(Li
gn
ite
, H
HV
%)
USA
Australia
Germany
India
23
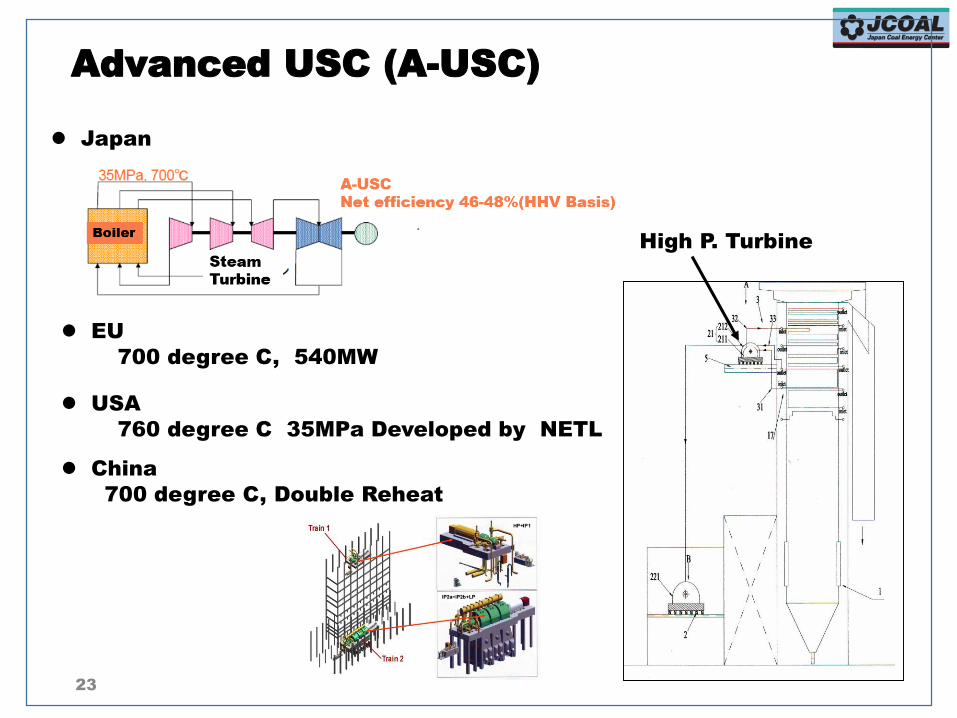
Japan
EU
700 degree C, 540MW
USA
760 degree C 35MPa Developed by NETL
China
700 degree C, Double Reheat
Advanced USC (A-USC)
High P. Turbine
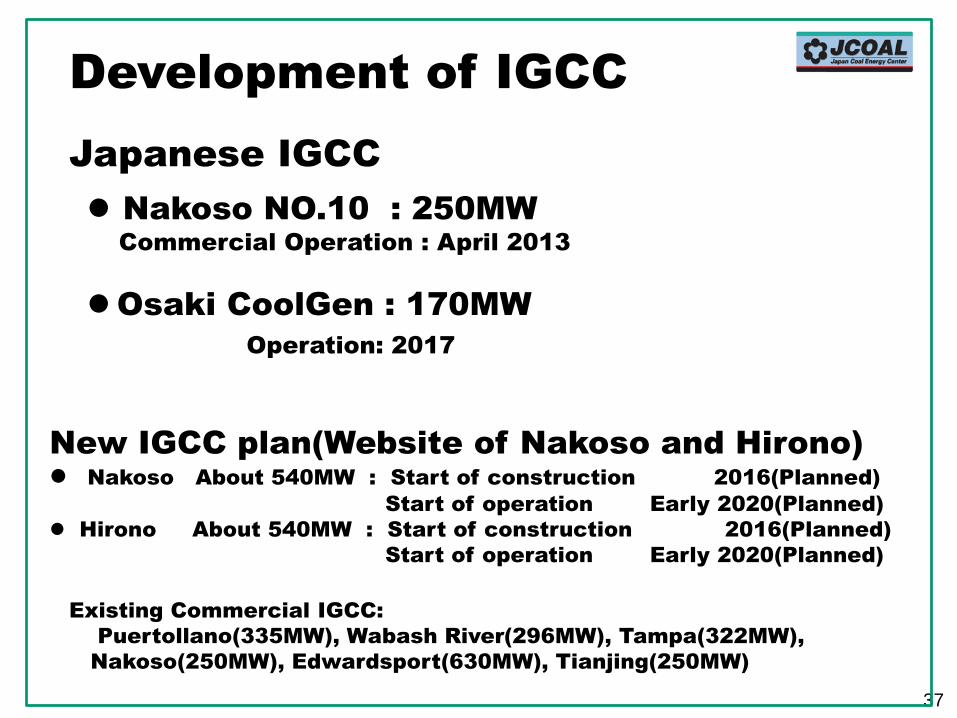
Development of IGCC
Nakoso NO.10 : 250MW
Commercial Operation : April 2013
Osaki CoolGen : 170MW
Operation: 2017
New IGCC plan(Website of Nakoso and Hirono)
Nakoso About 540MW : Start of construction 2016(Planned)
Start of operation Early 2020(Planned)
Hirono About 540MW : Start of construction 2016(Planned)
Start of operation Early 2020(Planned)
37
Japanese IGCC
Existing Commercial IGCC:
Puertollano(335MW), Wabash River(296MW), Tampa(322MW),
Nakoso(250MW), Edwardsport(630MW), Tianjing(250MW)
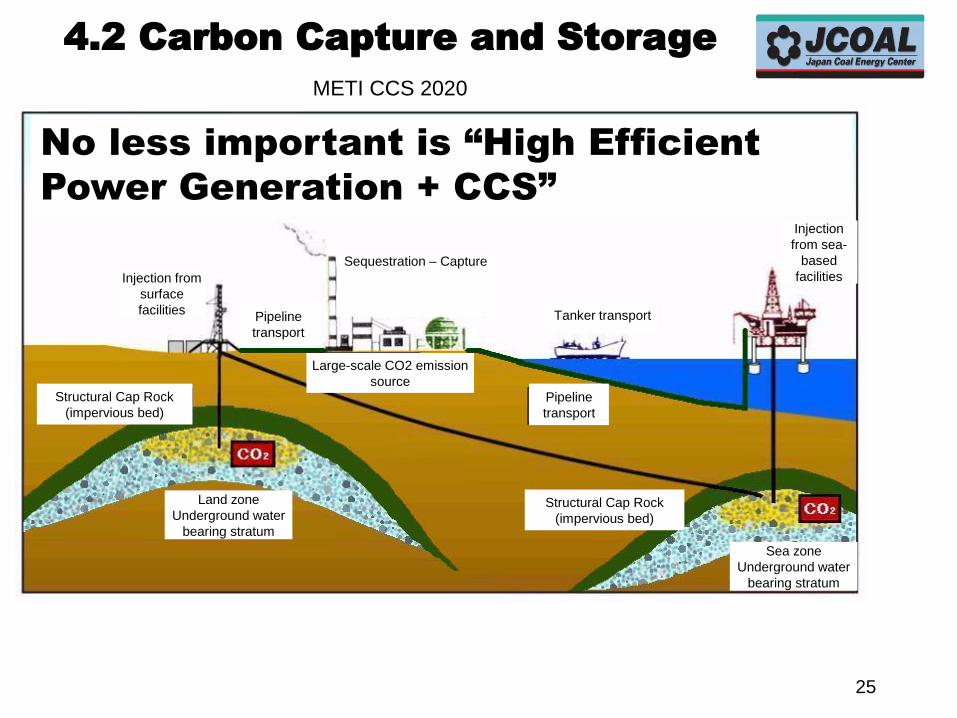
4.2 Carbon Capture and Storage
METI CCS 2020
Sequestration –
CaptureStorage Transport Injection
Injection from
surface
facilities
Sequestration – Capture
Pipeline
transport
Pipeline
transport
Tanker transport
Large-scale CO2 emission
source
Land zone
Underground water
bearing stratum
Structural Cap Rock
(impervious bed)
Structural Cap Rock
(impervious bed)
Sea zone
Underground water
bearing stratum
Injection
from sea-
based
facilities
25
No less important is “High Efficient
Power Generation + CCS”
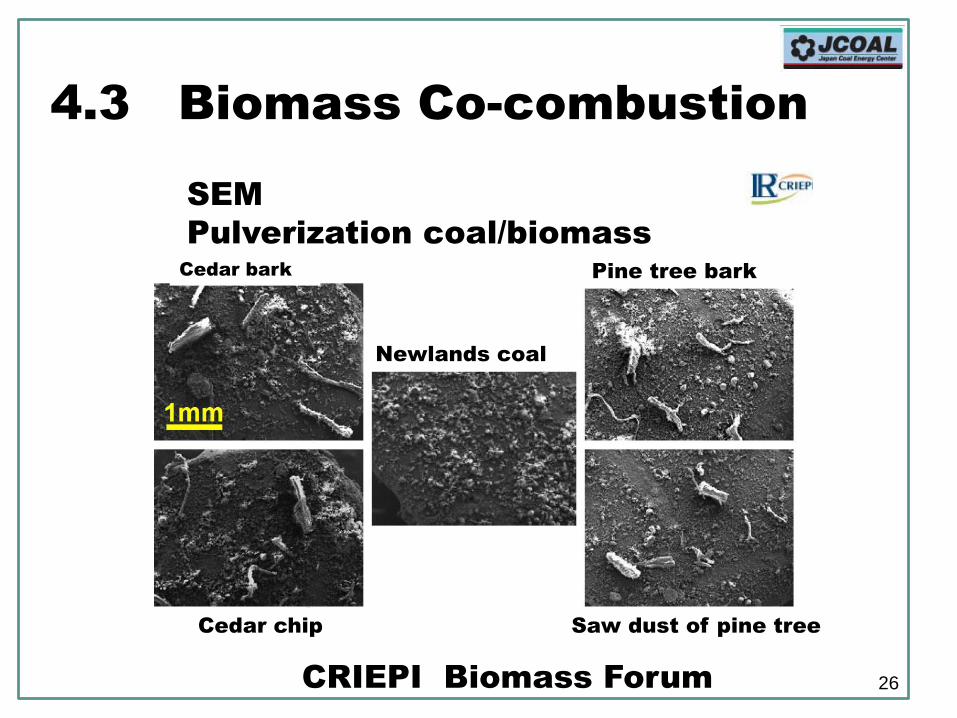
4.3 Biomass Co-combustion
26
SEM
Pulverization coal/biomass
Cedar bark
Newlands coal
Pine tree bark
Cedar chip Saw dust of pine tree
CRIEPI Biomass Forum
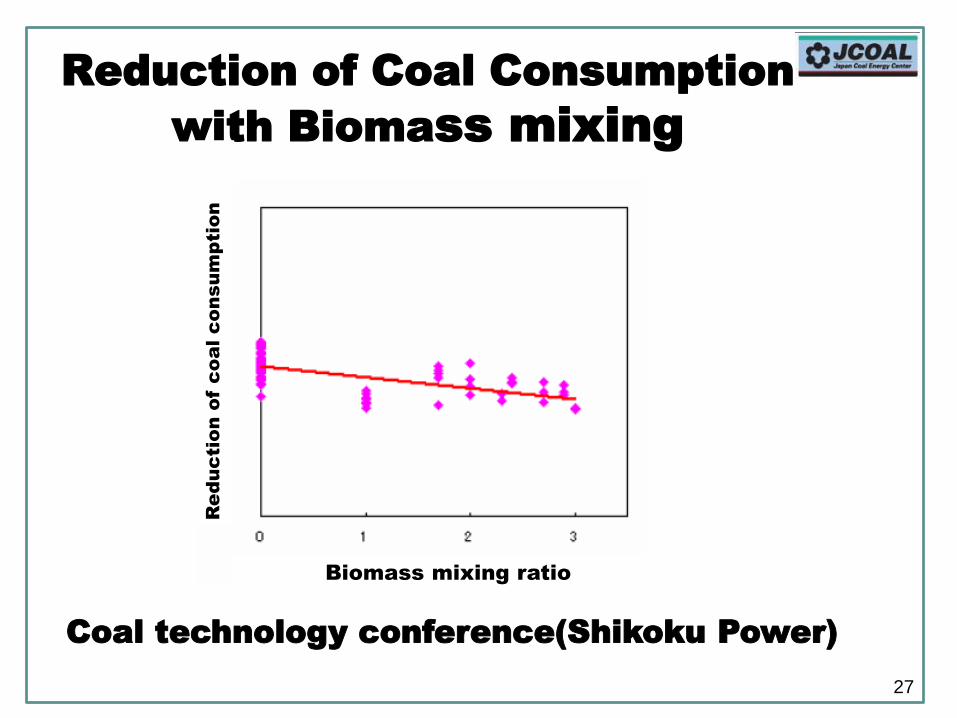
Reduction of Coal Consumption
with Biomass mixing
27
Coal technology conference(Shikoku Power)
Biomass mixing ratio
Re
du
ctio
n o
f c
oa
l c
on
su
mp
tio
n

5. Coal Ash Utilization
28
29
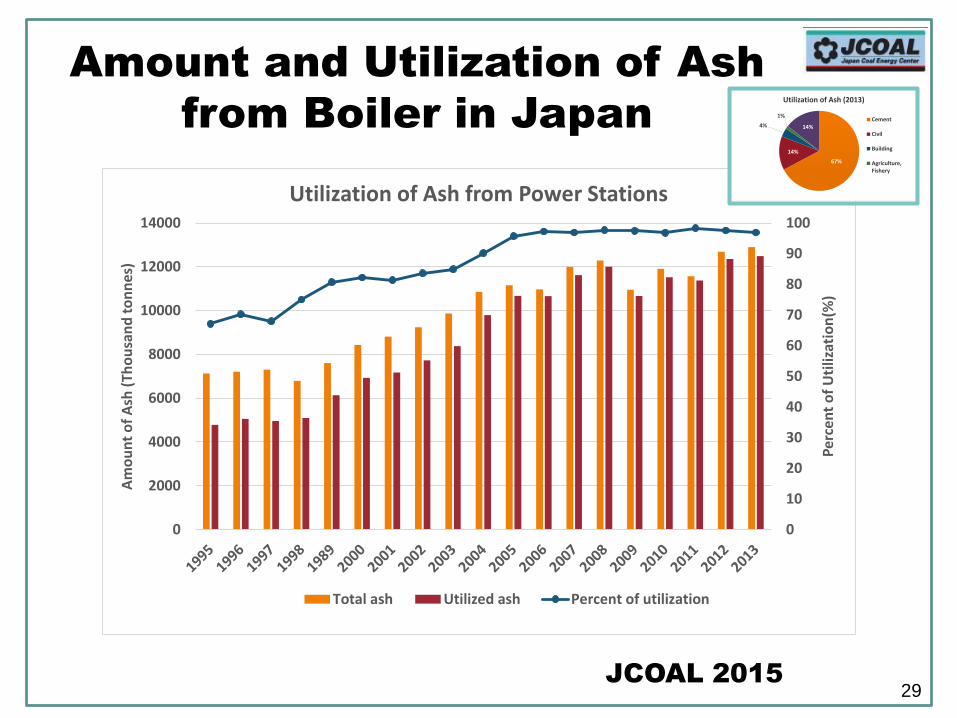
Amount and Utilization of Ash
from Boiler in Japan
JCOAL 2015
0
10
20
30
40
50
60
70
80
90
100
0
2000
4000
6000
8000
10000
12000
14000
Per
cen
t o
fU
tiliz
atio
n(%
)
Am
ou
nt
of
Ash
(Th
ou
san
d t
on
nes
)
Utilization of Ash from Power Stations
Total ash Utilized ash Percent of utilization
67%
14%
4%
1%
14%
Utilization of Ash (2013)
Cement
Civil
Building
Agriculture,Fishery
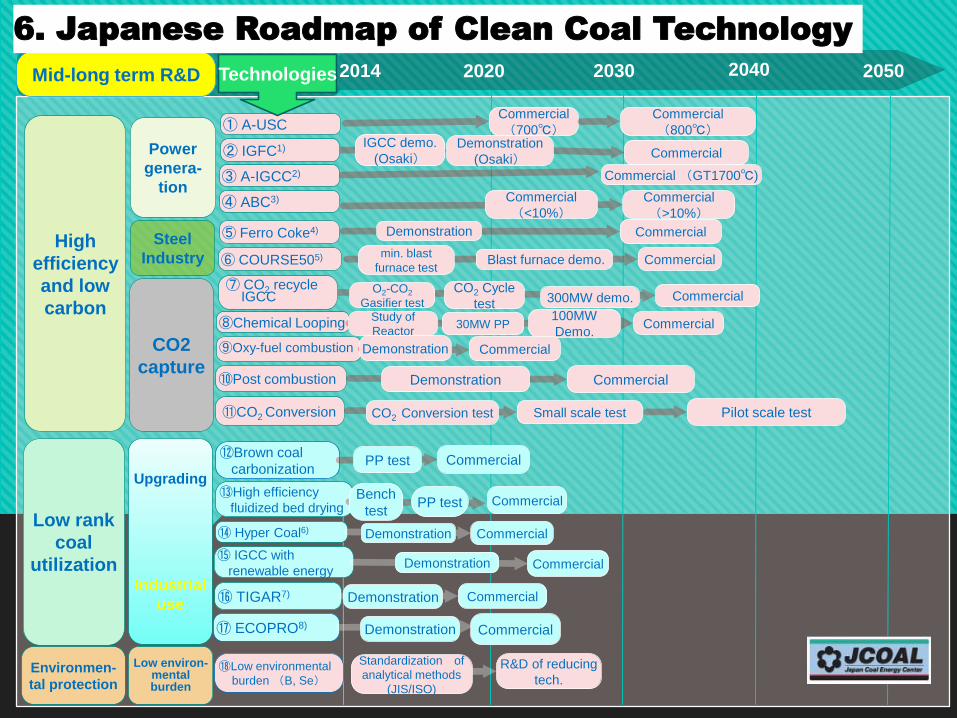
2014 2020 2030 2040 2050
① A-USCCommercial
(800℃)Commercial
(700℃)
Low rank
coal
utilization
High
efficiency
and low
carbon
Environmen-
tal protection
② IGFC1) Demonstration
(Osaki) CommercialIGCC demo.
(Osaki)
⑧Chemical Looping CommercialStudy of
Reactor30MW PP
100MW
Demo.
⑪CO2 Conversion Pilot scale testCO2 Conversion test Small scale test
⑦ CO2 recycleIGCC Commercial
CO2 Cycle
test 300MW demo.O2-CO2
Gasifier test
⑤ Ferro Coke4) Demonstration Commercial
⑯ TIGAR7) CommercialDemonstration
⑬High efficiency
fluidized bed dryingBench
testPP test Commercial
⑥ COURSE505) Commercialmin. blast
furnace test Blast furnace demo.
⑰ ECOPRO8) CommercialDemonstration
Mid-long term R&D
Steel
Industry
Power
genera-
tion
CO2
capture
Upgrading
Industrial
use
Low environ-mental burden
⑱Low environmental
burden (B, Se)
R&D of reducing
tech.
Standardization of
analytical methods
(JIS/ISO)
⑫Brown coal
carbonizationCommercialPP test
⑮ IGCC with
renewable energyCommercialDemonstration
⑭ Hyper Coal6) CommercialDemonstration
③ A-IGCC2) Commercial (GT1700℃)
⑨Oxy-fuel combustion Demonstration Commercial
⑩Post combustion Demonstration Commercial
④ ABC3) Commercial
(>10%)Commercial
(<10%)
6. Japanese Roadmap of Clean Coal Technology
Technologies
31
7. Lastly-------------
• Coal should be used as a main fuel in the
future. Non-OECD countries will use
much more coal than OECD countries in
the future.
• However, consideration should be paid to
reduce air pollution and GHG emission in
order to continue using coals.
• Now, Clean Coal Technology is essential.

Thank you
for your attention.
32