claudio erba, ceo ian kidson, cfo
TRANSCRIPT

1
Claudio Erba, CEOIan Kidson, CFO
Third Quarter 2020 Earnings
Note: All financials presented are in US$ unless otherwise noted.

GeneralThis presentation is property of Docebo Inc. (the “Company”, “Docebo”, “us” or “we”) and is strictly confidential. It cannot be circulated or forwarded without our consent.
Any graphs, tables or other information demonstrating our historical performance or that of any other entity contained in this presentation are intended only to illustrate past performance and are not necessarily indicative of our or such entities’ future performance. The information contained in this presentation is accurate only as of the date of this presentation or the date indicated. No securities regulatory authority has expressed an opinion about the securities described herein and it is an offence to claim otherwise.
All references in this presentation to dollars or “US$” or “$” are to United States dollars unless otherwise noted.
All references to “C$” are to Canadian dollars.
Cautionary Note Regarding Forward-Looking InformationThis presentation contains “forward-looking information” and “forward-looking statements” (collectively, “forward-looking information”) within the meaning of applicable securities laws. Forward looking information may relate to our financial outlook and anticipated events or results and may include information regarding our financial position, business strategy, growth strategies, addressable markets, budgets, operations, financial results, taxes, dividend policy, plans and objectives. Particularly, information regarding our expectations of future results, performance, achievements, prospects or opportunities or the markets in which we operate is forward-looking information. In some cases, forward-looking information can be identified by the use of forward-looking terminology such as “plans”, “targets”, “expects”, “is expected”, “an opportunity exists”, “budget”, “scheduled”, “estimates”, “outlook”, “forecasts”, “projection”, “prospects”, “strategy”, “intends”, “anticipates”, “believes”, or variations of such words and phrases or statements that certain actions, events or results “may”, “could”, “would”, “might” or, “will”, “occur” or “be achieved”, and similar words or the negative of these terms and similar terminology. In addition, any statements that refer to expectations, intentions, projections or other characterizations of future events or circumstances contain forward-looking information. Statements containing forward-looking information are not historical facts but instead represent management’s expectations, estimates and projections regarding future events or circumstances. This forward-looking information includes, but is not limited to, statements regarding industry trends; our growth rates and growth strategies; addressable markets for our solutions; the achievement of advances in and expansion of our platform; expectations regarding our revenue and the revenue generation potential of our platform and other products; our business plans and strategies; and our competitive position in our industry. This forward-looking information is based on our opinions, estimates and assumptions that, while considered by the Company to be appropriate and reasonable as of the date of this presentation, are subject to known and unknown risks, uncertainties, assumptions and other factors that may cause the actual results, level of activity, performance or achievements to be materially different from those expressed or implied by such forward-looking information, including but not limited to: (i) the Company’s ability to execute on its growth strategies; (ii) the impact of changing conditions in the global corporate e-learning market; (iii) increasing competition in the global corporate e-learning market in which the Company operates; (iv) fluctuations in currency exchange rates and volatility in financial markets; (v) the extent of the impact of COVID-19 and measures taken to contain the virus on our results of operations and overall financial performance; (vi) changes in the attitudes, financial condition and demand of our target market; (vii) developments and changes in applicable laws and regulations; and such other factors discussed in greater detail under the “Risk Factors” section of our Annual Information Form dated March 12, 2020 (the “AIF”), both of which are available under our profile on SEDAR at www.sedar.com. If any of these risks or uncertainties materialize, or if the opinions, estimates or assumptions underlying the forward-looking information prove incorrect, actual results or future events might vary materially from those anticipated in the forward-looking information. The opinions, estimates or assumptions referred to above and described in greater detail in “Summary of Factors Affecting our Performance” section of our Management Discussion & Analysis for the three and nine months ended September 30, 2020 (the “MD&A”) and in the “Risk Factors” section of our AIF, which is available under our profile on SEDAR at www.sedar.com, should be considered carefully by prospective investors. Although we have attempted to identify important risk factors that could cause actual results to differ materially from those contained in forward-looking information, there may be other risk factors not presently known to us or that we presently believe are not material that could also cause actual results or future events to differ materially from those expressed in such forward-looking information. There can be no assurance that such information will prove to be accurate, as actual results and future events could differ materially from those anticipated in such information. No forward-looking statement is a guarantee of future results. Accordingly, you should not place undue reliance on forward-looking information, which speaks only as of the date made. The forward-looking information contained in this presentation represents our expectations as of the date specified herein, and are subject to change after such date. However, we disclaim any intention or obligation or undertaking to update or revise any forward-looking information whether as a result of new information, future events or otherwise, except as required under applicable securities laws.
All of the forward-looking information contained in this presentation is expressly qualified by the foregoing cautionary statements. Additional information relating to Docebo can be found under our Sedar profile at www.sedar.com.
Non-IFRS Measures and Industry MetricsThis presentation makes reference to non-IFRS measures, including “Free Cash Flow”, “EBITDA”, "Adjusted EBITDA" and “Gross Margin” and other key performance indicators used by management and typically used by our competitors in the software-as-a-service (“SaaS”) industry, such as “Annual Recurring Revenue” or “ARR”, and “Recurring Revenue”.. These measures are not recognized measures under IFRS and do not have a standardized meaning prescribed by IFRS and are therefore not necessarily comparable to similar measures presented by other companies. Rather, these measures are provided as additional information to complement those IFRS measures by providing further understanding of our results of operations from management’s perspective. Accordingly, these measures should not be considered in isolation nor as a substitute for analysis of our financial information reported under IFRS. These non-IFRS measures and SaaS metrics are used to provide investors with supplemental measures of our operating performance and liquidity and thus highlight trends in our business that may not otherwise be apparent when relying solely on IFRS measures. We also believe that securities analysts, investors and other interested parties frequently use non-IFRS measures, including SaaS industry metrics, in the evaluation of companies in the SaaS industry. Management also uses non-IFRS measures and SaaS industry metrics in order to facilitate operating performance comparisons from period to period, the preparation of annual operating budgets and forecasts and to determine components of executive compensation. Please Refer to the "Non-IFRS Measures and Reconciliation of Non-IFRS Measures" in our MD&A as well as "Non-IFRS Measures and Reconciliation of Non-IFRS Measures" in our Q2 2020 Earnings Press Release for further explanation, reported basis results, a list of the items of note, and a reconciliation of non-IFRS financial measures.
Disclaimer
2

Continued ARR and Subscription Revenue Growth in Excess of 50%
2020 Third Quarter Highlights
3
ORGANIC GROWTH
▪ 54.9% year over year increase in ARR▪ 54.1% year over year increase in Subscription Revenue▪ Highest new logo sales and upsell performance in the Company's history
◦ Added Amazon Web Services, Economical Insurance, SiriusXM and the World Anti-Doping Agency◦ Customer expansions with Syngenta Group and one of the largest operators of quick-service restaurants in the
world▪ Received first revenues from a second OEM partner, just one month after completing the agreement
FINANCIAL PERFORMANCE
▪ Positive Adjusted EBITDA; positive cash flow from operations; and near-break even free cash flow
M&A
▪ Expanded product portfolio with the launch of Docebo Learing Impact through the acquisition of forMetris, a leading SaaS based learning impact platform
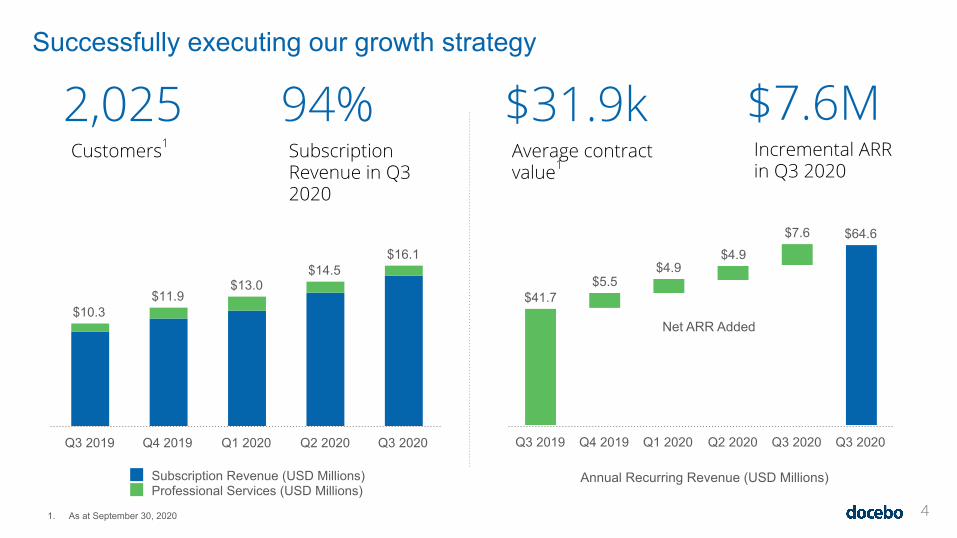
Customers1
2,025Average contract value1
$31.9kSuccessfully executing our growth strategy
4
US$19K
US$10K
US$12K
US$27K
Subscription Revenue in Q3 2020
94%Incremental ARR in Q3 2020
$7.6M
$10.3$10.3$11.9$11.9
$13.0$13.0$14.5$14.5
$16.1$16.1
Subscription Revenue (USD Millions)Professional Services (USD Millions)
Q3 2019 Q4 2019 Q1 2020 Q2 2020 Q3 2020
$64.6$64.6
$41.7$5.5
$4.9$4.9
$7.6
Q3 2019 Q4 2019 Q1 2020 Q2 2020 Q3 2020 Q3 2020
Net ARR Added
Annual Recurring Revenue (USD Millions)
1. As at September 30, 2020

Strong Yr/Yr Growth and Improved Gross Margins
5
~$18M
~$30M
~$47MARR Growth1
55%Revenue Growth1
52%Gross Profit Margin1
82%
$41.7
$64.6
Annual Recurring Revenue (USD Millions)
Q3 2019 Q3 2020
$10.6
$16.1
80.1%
82.1%
Revenue (USD Millions)Gross Profit Margin
Q3 2019 Q3 2020
Q3 2020 Revenue byGeography
EMEA, 28%
NorthAmerica,72%
1. For the three months ended September 30, 2020

METRIC (USD ‘000) Q3 2020 Q3 2019 Change
$ % of Rev. $ % of Rev. $ %
Revenue 16,096 --- 10,586 --- 5,510 52.0%
Cost of Revenue 2,883 17.9% 2,110 19.9% 773 36.6%
Gross Profit 13,213 82.1% 8,476 80.1% 4,737 55.9%
General & Administrative 3,575 22.2% 3,219 30.4% 356 11.1%
Sales & Marketing 5,796 36.0% 5,711 53.9% 85 1.5%
Research & Development 3,265 20.3% 2,175 20.5% 1,090 50.1%
Operating Expense 13,867 86.2% 11,559 109.2% 2,308 20.0%
Adjusted EBITDA 577 3.6% (1,388) (13.1)% 1,965 ---
Net Income (Loss) (1,158) --- (3,742) --- 2,584 ---
Income (loss) per share - diluted 0.02 --- (0.11) --- 0.13 ---
Free Cash Flow (140) --- (1,986) --- 1,846 ---
Comments• Gross margin improvement to
82.1% driven by benefits of scale
• Operating expense of $13.4M excluding a $0.4M (largely unrealized) foreign exchange loss , compared to $13.3M (excluding foreign exchange impacts) in the second quarter of 2020
• Positive Adjusted EBITDA of $0.6M and near break even Free Cash Flow
Improved Operating Leverage
66Positive Adjusted EBITDA with operating expenses consistent with Q2 2020

Docebo: Bringing AI Innovation to Enterprise Learning
77
Strong KPI’sCapital Efficient Business Model
Large Global Addressable Market
Customer Momentum and Leading Innovation