classroom slides - food standards agency
TRANSCRIPT

GCE Topic 3 Interpreting nutrition information on labels
1
Heading
Interpreting
nutrition information
on labels
Endorsed by

GCE Topic 3 Interpreting nutrition information on labels
1
The eatwell plate
GCE Topic 3 Interpreting nutrition information on labels
2
Making healthy food choices – the label link
Food labels give information that allows the consumer to compare one food with another and make wise food choices within each food group.
For example, the consumer can use labels to choose:
•a ham sandwich with a higher fibre and lower salt content
•a pizza with lower salt content
•a cheddar cheese with lower fat content
•a breakfast cereal with a higher fibre and lower sugar content.

GCE Topic 3 Interpreting nutrition information on labels
3
Front of Pack labelling schemes
Most of the big supermarkets and many food manufacturers display nutritional information on the front of pre-packed food – this is referred to as Front of Pack labelling (FoP).
•FoP labelling is not mandatory (not required by law)
• It is very useful for comparing similar food products at a glance
Traffic light labelling Guideline Daily Amount
LOW FAT
7.7gPer serving
HIGH MEDIUM LOW
7.7g per serving
LOW SATURATES2.0g per serving
HIGH SUGAR42.0g per serving
SALT2.0g per serving
Per serve7.7g
Per serve2.0g
Per serve42.2g
Per serve2.0g
2.0g
42.2g
2.0gMED
LOWFAT
LOWSAT FAT
HIGHSUGAR
MEDSALT
FAT
SATURATES
SUGAR
SALT
Per pack provides...
of your guideline daily amount
286
14%Calories
2g
2.2%Sugar
8g
11%Fat
3.6g
18%Saturates
1.5g
25%Salt

GCE Topic 3 Interpreting nutrition information on labels
4
Front of Pack (FoP) labelling
Pick the healthier optionPizza Thin & Crisply Cajun Chicken Italian Pepperoni
Half a pizza contains Half a pizza contains
Of your guideline daily amount Of your guideline daily amount
Breakfast Cereals Shredded Wheat Coco Pops
Each 45g serving with 125ml semi skimmed milk contains Each 30g serving contains
Of your guideline daily amount Of your guideline daily amount
9.1gPer serve
MEDIUM Fat
Calories391
20%
Sugars4.8g
5%
Fat9.1g
13%
Saturates4.8g
24%
Salt1.4g
23%
4.8gPer serve
MEDIUM Sat Fat
1.4gPer serve
MEDIUM Salt
4.8gPer serve
LOW Sugars
25.2gPer serve
HIGH Fat
8.7gPer serve
HIGH Sat Fat
3gPer serve
HIGH Salt
4.5gPer serve
LOW Sugars
Calories545
27%
Sugars4.5g
5%
Fat25.2g
36%
Saturates8.7g
44%
Salt3g
50%
0.7gPer serve
LOW Fat
Calories217
11%
Sugars6.3g
7%
Fat3.2g
5%
Saturates1.4g
7%
Salt0.2g
3.3%
0.2gPer serve
LOW Sat Fat
TracePer serve
LOW Salt
0.2gPer serve
LOW Sugars
0.8gPer serve
LOW Fat
0.3gPer serve
LOW Sat Fat
0.3gPer serve
MEDIUM Salt
11.8gPer serve
HIGH Sugars
Calories161
6%
Sugars11.8g
13%
Fat0.8g
1%
Saturates0.3g
2%
Salt0.3g
5%
Q. Name the two types of Front of Pack labelling systems shown here

GCE Topic 3 Interpreting nutrition information on labels
5
Traffic light labelling
LOW FAT
7.7gPer serving
HIGH MEDIUM LOW
7.7g per serving
LOW SATURATES2.0g per serving
HIGH SUGAR42.0g per serving
SALT2.0g per serving
Per serve7.7g
Per serve2.0g
Per serve42.2g
Per serve2.0g
2.0g
42.2g
2.0gMED
LOWFAT
LOWSAT FAT
HIGHSUGAR
MEDSALT
FAT
SATURATES
SUGAR
SALT
HIGH HIGH LOW MED FAT SAT FAT SUGAR SALT CALS
22.1g 9.7g 0.7g 0.7g 342
32% 48% 1% 11% 17%
% of your Guideline Daily AmountPer 135g serving Oven Cooked
% of your Guideline Daily AmountPer 165g serving Oven Cooked
MED LOW LOW MED
FAT SAT FAT SUGAR SALT CALS 5.1g 0.8g 0.8g 0.8g 252
7% 4% 1% 14% 13%
Developed by the Food Standards Agency
Compare these two labels found on oven chips and discuss

GCE Topic 3 Interpreting nutrition information on labels
6
Guideline Daily Amounts (GDAs)
Per pack provides...
of your guideline daily amount
286
14%Calories
2g
2.2%Sugar
8g
11%Fat
3.6g
18%Saturates
1.5g
25%Salt
Developed by the Institute of Grocery Distribution
Number of calories
Grammes of sugar
Grammes of fat
Of whichsaturates
Grammes of salt
Percentage GDA
GCE Topic 3 Interpreting nutrition information on labels
7
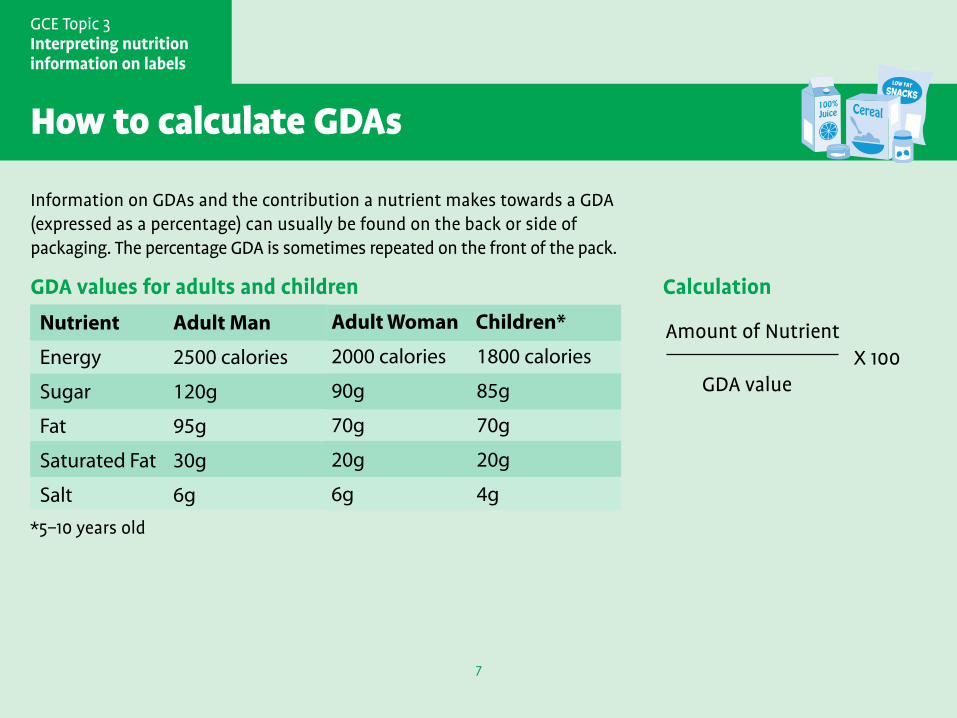
How to calculate GDAs
Information on GDAs and the contribution a nutrient makes towards a GDA (expressed as a percentage) can usually be found on the back or side of packaging. The percentage GDA is sometimes repeated on the front of the pack.
GDA values for adults and children Calculation
Amount of Nutrient X 100 GDA value
Nutrient Adult Man
Energy 2500 calories
Sugar 120g
Fat 95g
Saturated Fat 30g
Salt 6g
Adult Woman Children*
2000 calories 1800 calories
90g 85g
70g 70g
20g 20g
6g 4g* 5-10 years old*5–10 years old
GCE Topic 3 Interpreting nutrition information on labels
8
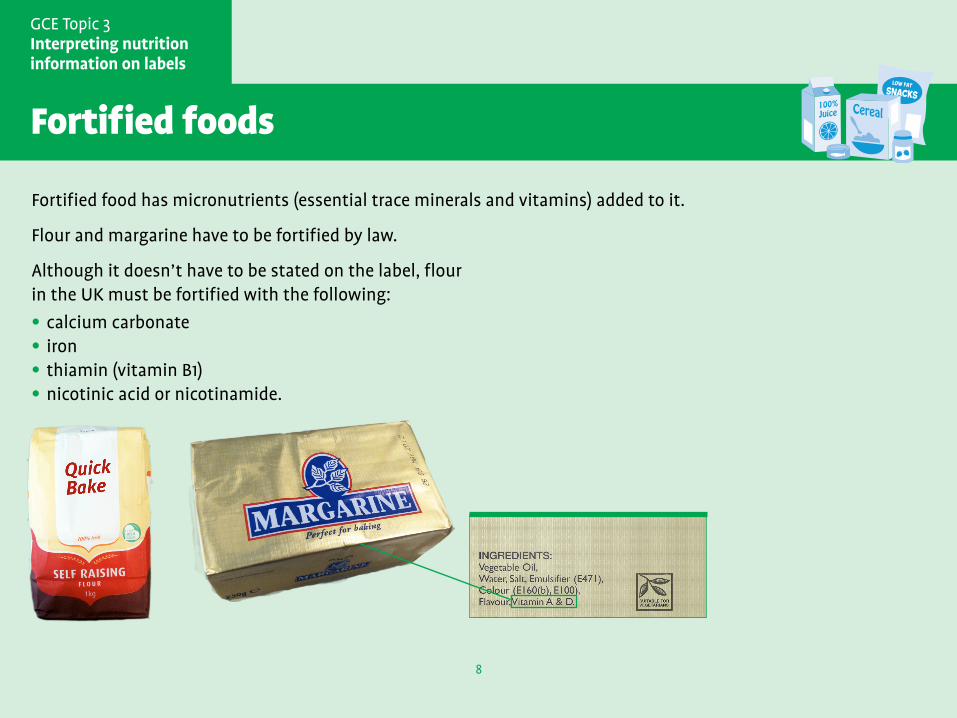
Fortified foods
Fortified food has micronutrients (essential trace minerals and vitamins) added to it.
Flour and margarine have to be fortified by law.
Although it doesn’t have to be stated on the label, flour in the UK must be fortified with the following:
•calcium carbonate• iron•thiamin (vitamin B1)•nicotinic acid or nicotinamide.
GCE Topic 3 Interpreting nutrition information on labels
9
HeadingResponsible food advertising – nutrient profiling model
The Food Standards Agency (FSA) developed a nutrient profiling model to distinguish foods that were high in fat, salt or sugar from those which were not.
The model was developed as a tool to differentiate foods that were high in fat, salt or sugar. This enabled Ofcom to improve the balance of television advertising to children by introducing restrictions on foods that are high in fat, salt or sugar, while continuing to promote healthier alternatives. Ofcom is the communication regulator for the UK. They regulate the TV and radio sectors, fixed line telecoms, mobiles, postal services, plus the airwaves over which wireless devices operate.
The nutrient profiling model was developed as a tool to address the bias towards foods that are high in fat, salt or sugar in the television promotion of foods to children. It is not intended to give dietary advice to consumers. The FSA is not promoting the model for any other use.
GCE Topic 3 Interpreting nutrition information on labels
10
New European Union Food Information Regulation
A new Food Information Regulation (FIR) was published in the Official Journal of the European Union (EU) on 22 November 2011.
Many of the current food labelling requirements of the Food Labelling Regulations (Northern Ireland) 1996 will remain but there are some significant changes.
The additional requirements will come in over a 3–to–5 year period.