classification of chemicals based on concentration ...1.pdfclassification of chemicals based on...
TRANSCRIPT
Classification of Chemicals Basedon Concentration-DependentToxicological Data Using ToxClustX I A O W E I Z H A N G , * , † J O H N L . N E W S T E D , ‡
M A R K U S H E C K E R , † , § E R I C B . H I G L E Y , †
P A U L D . J O N E S , † , ⊥ A N DJ O H N P . G I E S Y † , | , ⊥ , # , ∇ , O
Toxicology Centre, University of Saskatchewan, 44 CampusDrive, Saskatoon SK S7N 5B3 Canada, ENTRIX, Inc., Okemos,MI, ENTRIX, Inc., Saskatoon, Saskatchewan, Canada,Department of Biomedical Veterinary Sciences, University ofSaskatchewan, Saskatoon, Saskatchewan, Canada, Centre forCoastal Pollution and Conservation and Department ofBiology and Chemistry, City University of Hong Kong,Kowloon, Hong Kong, SAR China, Department of Zoology,Michigan State University, East Lansing, MI, State KeyLaboratory of Pollution Control and Resource Reuse, School ofthe Environment, Nanjing University, Nanjing, and State KeyLaboratory of Marine Environmental Science, College ofOceanography and Environmental Science, XiamenUniversity, Xiamen, P R China
Received November 22, 2008. Revised manuscript receivedMarch 24, 2009. Accepted March 26, 2009.
Concentration-dependent response relationships provideessential information on the characteristics of chemical-induced effects on toxicological end points, which includeeffect (inhibition or induction), potency, and efficacy of thechemical. Recent developments in systems biology and highthroughput technologies have allowed simultaneous examinationof many chemicals at multiple end point levels. While thisincrease in the quantity of information generated offers greatpotential, it also poses a significant challenge to environmentalscientists to efficiently manage and interpret these largedata sets. Here we present a novel method, ToxClust, thatallows clustering of chemicals on the basis of concentration-response data derived with single or multiple end points.This method utilizes a least distance-searching algorithm(LDSA) to measure the pattern dissimilarity of concentration-response curves between chemicals and their relative toxicpotency. ToxClust was tested using simulated data and chemicaltest data collected from the human H295R cell-based in vitrosteroidogenesis assay. ToxClust effectively identified similarpatterns of simulated data and responses to the exposure withthe five model chemicals and separated them into differentgroups on the basis of their dissimilarities. These observations
demonstrate that ToxClust not only provides an effective dataanalysis and visualization tool, but also has value in hypothesisgeneration and mechanism-based chemical classification.
IntroductionThere is urgent need for methods that allow evaluation oflarge numbers chemicals for their potential toxicity and toprioritize these chemicals for further testing (1). Recentdevelopments in toxicogenomics and high-throughput screen-ing techniques, including among others those broadly definedas genomics, transcriptomics, proteomics, and metabonom-ics utilizing multiple molecular and cellular end points hasenabled testing of large numbers of chemicals (2). Thesenew techniques are increasingly being used in prioritychemical screening programs such as Tier 1 of the EndocrineDisruptor Screening Program of U.S. Environmental Protec-tion Agency (EPA) (1). During these screening initiatives,researchers collect large amounts of multidimensional data(e.g., gene transcripts, proteins, and enzyme products) forvarious concentrations of each chemical analyzed (2). Oneof the major remaining challenges is the prioritization ofchemicals for further testing based on the informationobtained during Tier I (3). However, because of the lack ofappropriate data evaluation techniques that effectively handlelarge quantities of diverse data, progress in the classificationof chemicals by mode-of-action has been slow and is not yetpart of many regulatory programs entrusted with this action(4). To accurately classify chemicals based on their criticalmechanism of action so that they can be grouped for riskassessments (2) and to take advantage of detailed informationon a few model chemicals, we must know the mechanismof action. However, few if any chemicals act through a singlemechanism of action but rather cause multiple direct andindirect effects such that the predominant mechanism oftoxicity can differ with duration and or magnitude (con-centration) of exposure (5). In addition, the pattern of changesin the measurement end points can be different at differentdoses or durations of exposure. The pattern of response isoften restricted to investigations of a single dose and timepoint, thus, losing valuable information on the complexchanges in pattern as a function of duration and intensityof exposure.
Concentration-response relationships of molecular orcellular end points provide essential information for de-scribing the mechanism of a chemical-induced effect.Traditional concentration/dose-response relationship theoryis based on the response of a single end point such asmetabolite concentration, enzyme activity, hormone level,etc. The concentration-response relationship providesinformation that is characteristic for the chemical inducedtoxicity such as no observable adverse effect levels (NOAELs)and effective concentrations (e.g., EC50). The potency of achemical relative to that of a reference chemical (REP) canbe calculated by comparing, for example, doses at which50% of the maximum effect is observed (EC50) (6). Concen-tration-response relationships for different end pointsprovide the basis for chemical risk assessment. However, itis often difficult to include all of the possible concen-tration-response relationships for multiple end points atmultiple biological levels of organization in a single index.For these reasons, end points are generally independentlyconsidered when calculating indices of relative effects suchas the EC50 and NOAEL. However, concentration-responserelationships associated with multiple end points can provideuseful information as well as possibly identifying a unique
* Corresponding author phone: 306-966-1204; fax: 306-966-4796;e-mail: [email protected].
† Toxicology Centre, University of Saskatchewan.‡ ENTRIX, Inc., Michigan.§ ENTRIX, Inc., Saskatchewan.⊥ Department of Biomedical Veterinary Sciences, University of
Saskatchewan.| City University of Hong Kong.# Michigan State University.∇ Nanjing University.O Xiamen University.
Environ. Sci. Technol. 2009, 43, 3926–3932
3926 9 ENVIRONMENTAL SCIENCE & TECHNOLOGY / VOL. 43, NO. 10, 2009 10.1021/es8029472 CCC: $40.75 2009 American Chemical SocietyPublished on Web 04/23/2009
toxicological signature of a chemical, which can then be usedto understand its mechanism of action. For this reason, usefulinformation is lost when end points are assessed separately.Conversely, some of the end points will be interrelated suchthat they represent redundant information relative to clas-sifying the critical mechanism of action. Here, we define thecritical mechanism of action as an adverse effect or anindicator of an adverse effect that occurs at the leastconcentration. While some chemicals can cause differenteffects at different concentrations, there is one primary orcritical effect that occurs at the least concentration. For anexample of this concept, see the review by Giesy and Kannan(7).
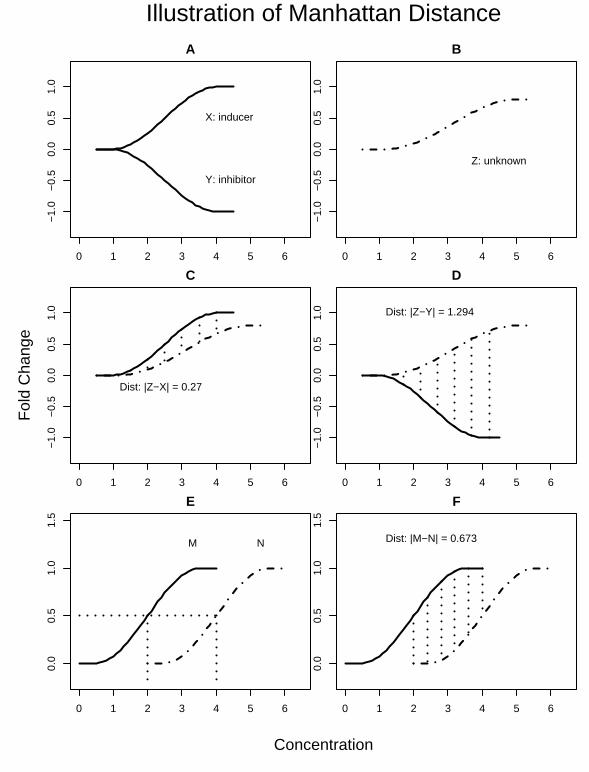
The primary goal of this research was to develop a novelcomputational approach to analyze concentration-depend-ent effect curves for single or multiple end points and to usethis information to classify chemicals based on their predictedmechanisms of action. Chemicals with similar effects forcertain end points can be depicted as having similarconcentration-effect patterns. An inducer (X) is defined asa chemical that increases a biological response in a con-centration-dependent manner, while an inhibitor (Y) isdefined as a chemical that inhibits a biological response ina concentration-dependent manner (Figure S1A of theSupporting Information). If the dissimilarity of two chemicalsis depicted using a Minkowski metric such as the Manhattandistance (the average absolute vertical distance of the pointson the two curves), the mechanism of the unknown chemicalZ can then be determined by comparing the distancesbetween its concentration response curve to that of thechemicals with known mechanisms, i.e., inducer X andinhibitor Y (Figure S1B of the Supporting Information). Ifchemical Z has a less than average Manhattan distance whencompared to X rather than when compared to Y, it wouldindicate that the concentration-response function of Z ismore similar to inducer X than to Y (Figure S1C,D of theSupporting Information). There are situations where chemi-
cals have the same concentration-response curves butdifferent potency (Figure S1E of the Supporting Informa-tion). For instance, chemical M has the exact same shape fora concentration-response curve as chemical N, but its EC50
is less than the EC50 for chemical N. However, because of thedifferences in potency, the average Manhattan distancebetween concentration-response curves of chemical M andchemical N would be nonzero (Figure S1F of the SupportingInformation). To capture the dissimilarity in concentration-response curves between chemicals based on realisticconcentration-response data, we introduced a new algo-rithm to account for relative potency.
Materials and MethodsDistance Calculating Model. In an experiment, concentra-tion-dependent response data of m different biological endpoints can be measured for each chemical, and the dis-similarity (distance) between any chemical 1 and chemical2 can be defined as a least Manhattan distance of theirconcentration-response curves, D ) least (d)
d)∑i)1
m ∫b
a|f1,i(x)- f2,i(x+ c)|dx (1)
where m is the total number of measured end points; f1 isthe concentration-response function of the first chemical;f2 is the concentration-response function of the secondchemical; a, b is the the concentration range; c is thehorizontally moved distance of the second concentrationresponse function; and c is the relative potency C of thesecond chemical when the least distance is achieved.
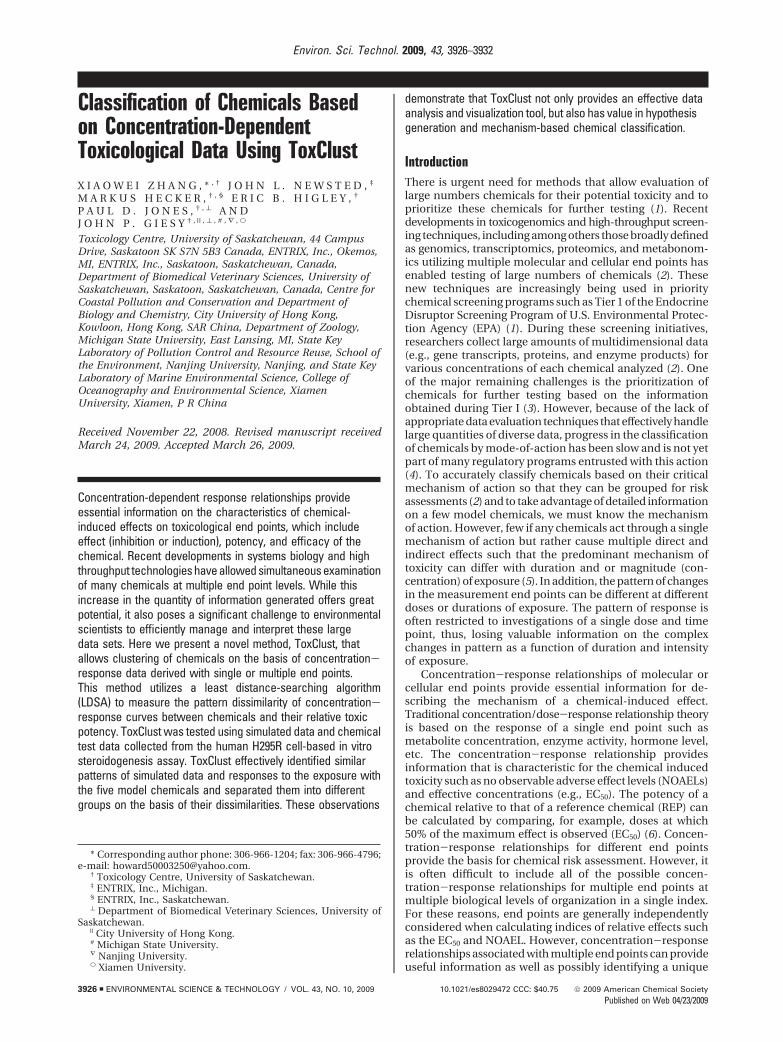
The least Manhattan distance can then be calculated usinga least distance-searching algorithm (LDSA) (Figure 1). Fora single end point (m ) 1), a spline function is fitted for theconcentration-response data for each chemical; the splinedfunction for the chemical with the greater tested-dosing range
FIGURE 1. Least distance searching algorithm. For a single end point the steps are as follows: (1) Fit spline functions for thedose-response relationship for each chemical pair. (2) Fix the spline function (A) of the first chemical. (3) Move the function of thesecond chemical from the left to right and calculate the average distance between the two functions under the common area (B-D).(4) Identify the least distance and the position achieving this. (5) Calculate the relative potency of the two chemicals.
VOL. 43, NO. 10, 2009 / ENVIRONMENTAL SCIENCE & TECHNOLOGY 9 3927
is fixed on the abscissa. The function of the other chemicalis then moved from the left to right with the overlappedconcentration range equal or greater than half of the lesserdosing range of the two chemicals. The averaged verticaldistance d between the two curves under the common x axisarea is then calculated at each moving step. The bandwidthand step size were 1/20 of log transformed concentration.The overall moved distance c and the corresponding distanced were stored in two vectors. The least distance D betweenthe two functions is then identified and the correspondinglyhorizontally moved distance is reported as the relativepotency C of the second chemical when compared to thefirst chemical. Finally, a distance matrix and a relative potencymatrix can be calculated for all of the chemicals that havebeen tested.
The distance matrix (also called dissimilarity matrix)describes pairwise dissimilarity between N chemicals. It isa square symmetrical N × N matrix with the (i, j) elementequal to the least distance value (D) between the i and thej chemicals. The diagonal elements are equal to zero, i.e.,the distance between an object and itself is postulated aszero. Similarly, the relative potency matrix is a squaresymmetrical N × N matrix but with the (i, j) element equalto the relative potency (C) between the i and the j chemicals.
Simulation of Chemicals with a Single End Point. Forpurposes of illustration, 100 different concentration-response curves were simulated using kernel density esti-mates (Supporting Information). Briefly, the shape of theresponse curves was based on the cumulative distributionfunction of a different sample X1...X50 from the standardnormal distribution. The relative potencies (EC50) were froma uniform distribution [-4, 4] and the efficacies weresimulated using a uniform distribution [-5, 5]. The valuesof 4 and 5 were randomly picked to mimic an ordinarysituation. The simulated response data were analyzed usingthe LDSA, principal component analysis (PCA), and hier-archical clustering.
Chemicals Testing the Experiment Using H295R Cell-Based Steroidogenesis Assays. To validate the ToxClustapproach in the classification of chemicals by mode ofaction, we tested five chemicals in the H295R cell ste-roidogenesis assay (Figure S2 of the Supporting Informa-tion). The chemicals were chosen based on their knowneffects on steroid biosynthesis and steroidogenic geneexpression and included prochloraz, fadrozole, amino-glutethimide, forskolin, and trilostane (Supporting Infor-mation). The H295R human adrenocortical carcinoma cellline was obtained from the American type Culture Col-lection (ATCC CRL-2128; ATCC, Manassas, VA) and wasgrown at 37 °C with a 5% CO2 atmosphere as previouslydescribed (8-11). Cells were exposed to different con-centrations of chemicals for 48 h in 24-well plates (COSTAR,Bucks, U.K.). DMSO was used as a carrier solvent and didnot exceed 0.1% v/v. Test plates included six chemicalconcentrations, a solvent control (SC), and a blank control(CTR) in triplicate. Cytotoxic chemical concentrations werenot included in the hormone concentration measurementsas indicated by the MTT (3-[4,5-dimethylthiazol-2-yl]-2,5-diphenyl tetrazolium bromide) bioassay. Progesterone,androstenedione, estradiol, and testosterone were mea-sured in ether extracts of culture medium by competitiveELISA using the manufacturer’s recommendations [proges-terone [Cat # 582601], testosterone [Cat # 582701] and17ß-estradiol [Cat # 582251] were from Cayman ChemicalCompany, Ann Arbor, MI; androstenedione [Cat # DSL-10-3800] was from Diagnostic Systems Laboratories, Inc.Webster, TX] (11). For gene expression measurement, real-time quantitative RT-PCR was conducted by amplifying 2µL of cDNA with SYBR Green Supermix (Applied Biosys-tems) on an ABI Prism high throughput 7900HT system
using the primers previously described (8). Chemical-induced concentration-dependent response curves ofhormone production and mRNA levels are provided inTables S1 and S2 of the Supporting Information.
Statistical Procedures. Hierarchical cluster analysis wasperformed for the chemicals (when n>3) and end points (whenm > 3) using their corresponding distance matrices. Thedistance(dissimilarity)matrixbetweenchemicalswascalculatedusing the LDSA described above. In the case of multiple endpoints (m > 1), the distance between two chemicals wascalculated by summing the curve distances of m end points atevery moving step. When clustering of multiple end points wasnecessary, correlations of the responses between the variables(end points) were used as the distance. Dendrograms ofchemicals and end points were vertically plotted against eachother in the sample graph. The visualization of the concentra-tion-dependent response curves was implemented using a“striped view” method and plotted in an N × M matrix formaton the right side of the graph. The (i, j) element of the matrixcorresponds to the response curve of the i chemical at the j endpoint levels. The color gradient from left to right displayed theconcentration response curves from lower to higher concen-tration. The relative potency matrices within each chemicalcluster provide relative potency estimations among thesechemicals. The principal component analysis (PCA) on thepotency matrices was conducted to select for display only thosefew curves that best reflect the important modes of variationsusing the protocol previously described (12). Three pickedcurves included the curve corresponding to the medianprincipal component score together with those correspondingto two extreme quantiles, one at each end. To ensure selectionof particular curves, we define the 100R% quantile to be p([NR]+ 1) where p(r) is the rth order statistic of the principalcomponent scores and [x] is the integer part of x. A program,ToxClust, was written in the R language (www.r-project.com)to perform the LDSA calculation and hierarchical clustering.
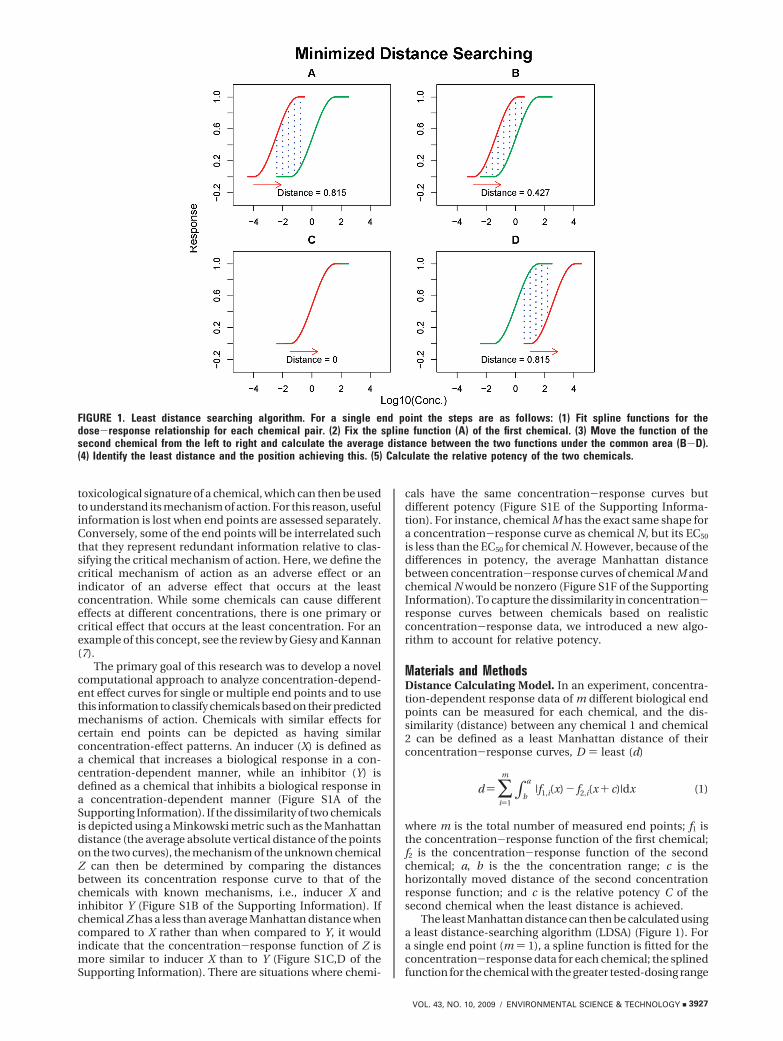
ResultsClustering Analysis of Simulated Data. To illustrate theconcept and the performance of ToxClust in a simplecondition, we conducted a clustering analysis of 100 simu-lated concentration-dependent response curves. These 100different sigmoid curves varied in their shapes, potencies(EC50), and efficacies (Figure 2A). Using the LDSA approach,a 100 × 100 relative potency matrix and a100 × 100 distancematrix were computed using the simulated curves. The firstprincipal component of the potency matrix accounted for79% of the overall variance of the matrix and displayed alinear relationship with the potency (EC50) of the curves(Figure 2B). The first principal component of the distancematrix accounted for 76% of the overall variance of the matrixand displayed a linear relationship with the efficacies of thecurves (Figure 2C). The first several principal componentsare important in the sense of explaining most of the variation.Because these 100 curves were from fairly well-behavedoriginal functions, only three typical curves correspondingto p(1), p(100), and p(51) were displayed. It can be seen fromFigure 2D that the contrast between curves is most important;the curve on the top has a concentration dependent“induction”, and the curve at the bottom displays an“inhibition” effect, following the increase of concentration,while the curve in the middle has “no” obvious effects.
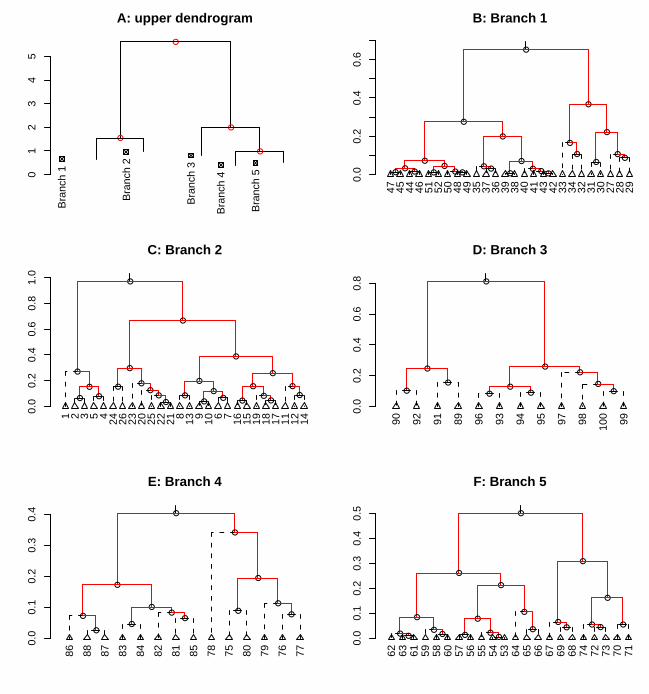
Besides PCA, hierarchical clustering is another exploratoryanalysis tool for the identification of data patterns. Hierar-chical clustering analysis based on the calculated distancematrix further separated the 100 curves into two large clustersor five smaller branches (Figure S3A of the SupportingInformation). The curves were labeled by the correspondingrank from least to greatest of their efficacies. The first clusterconsisted of branch 1 and branch 2, which had curves ranked
3928 9 ENVIRONMENTAL SCIENCE & TECHNOLOGY / VOL. 43, NO. 10, 2009
from 27 to 52 and 1 to 26, respectively (Figure S3B-C of theSupporting Information). In the second cluster, the threebranches contained the curves ranking from 53 to 74, 75 to88, and 89 to 100, respectively (Figure S3D-F of theSupporting Information).
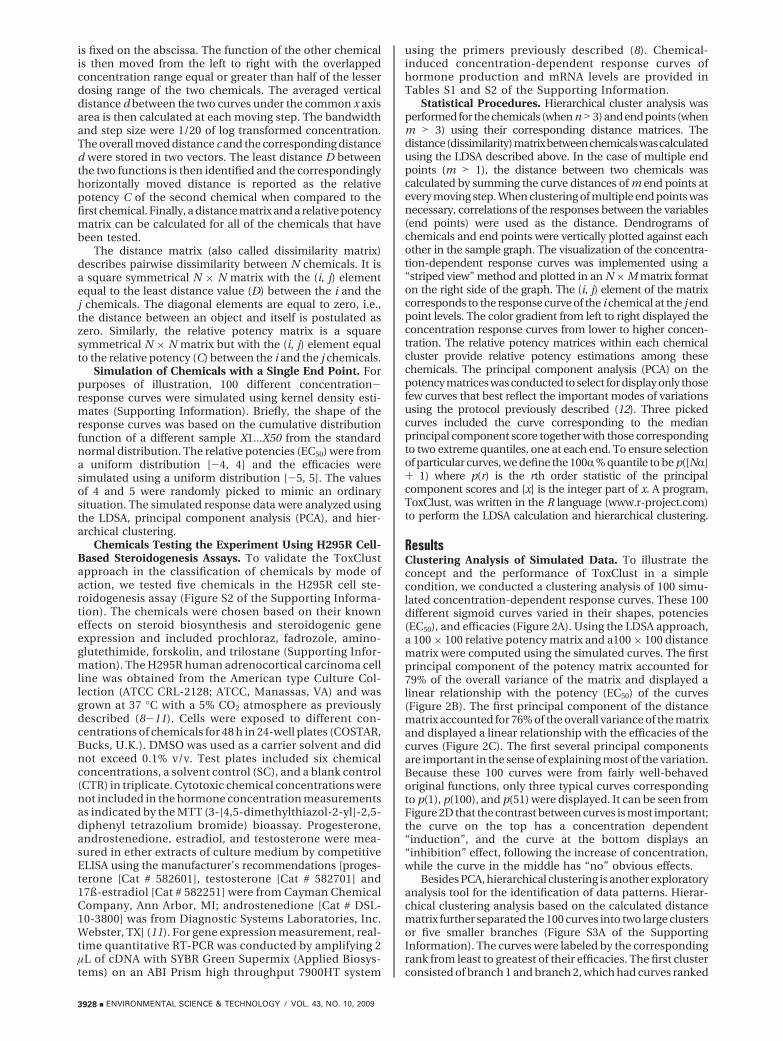
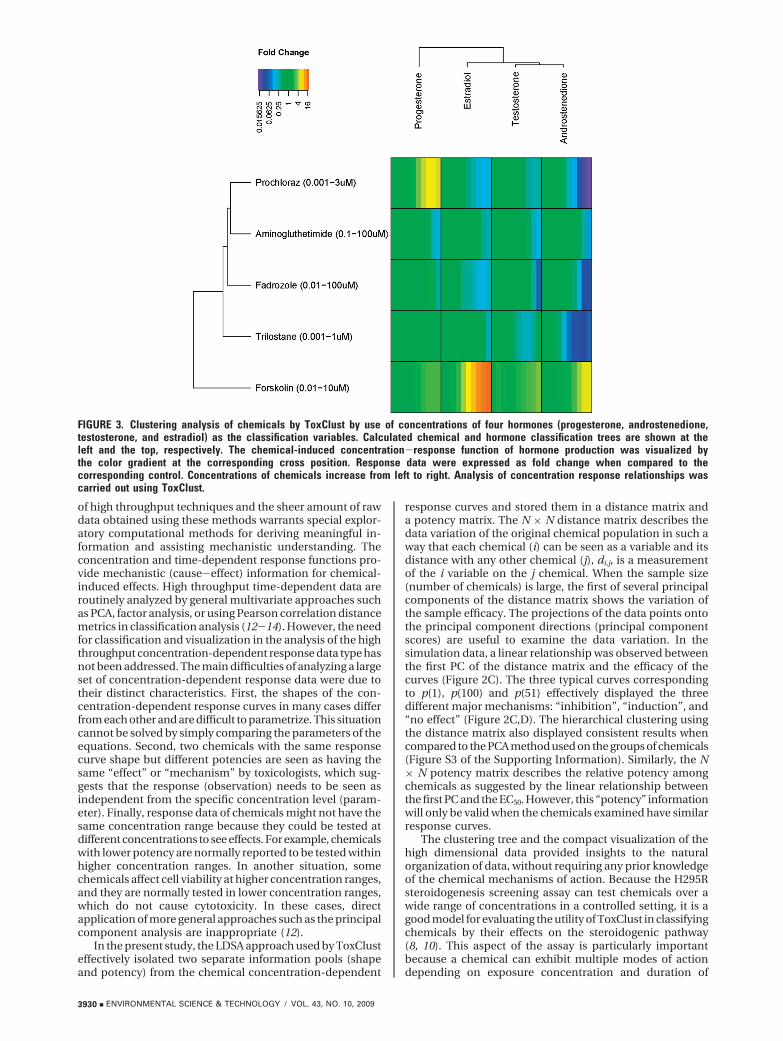
Clustering Analysis of Chemicals Using Four Hormones.Using the LDSA approach, we first computed a distance anda relative potency matrix using the concentration-dependenthormone production curves for the five model chemicals,and then a divisive hierarchical clustering was computed onthe basis of the calculated distance matrix. The responsedata, expressed as a fold change compared to a control, andthe clusters are illustrated in a vertical dendogram (Figure3). Forskolin was the first chemical separated; it showedconcentration-dependent induction of the production of thefour hormones. The greatest fold change by forskolin wasobserved for estradiol. The other four chemicals had verysmall distances; all had concentration-dependent inhibitoryeffects on the production of testosterone, estradiol, andandrostenedione. Prochloraz was the only chemical besideforskolin that increased progesterone production in aconcentration-dependent manner. Androstenedione was theend point observed to have the highest inhibition. Thehormone end points were classified using the correlation-based distance metric. The two hormone clusters consistedof progesterone as a single cluster and the other threehormones as a cluster, including testosterone, estradiol, andandrostenedione.
Clustering Analysis of Chemicals Using an Concentra-tion-Dependent mRNA Expression. As was observed withhormone production, the use of CYP19A, 3�HSD2, CYP17A,and CYP11B2 gene expression resulted in the chemicals beingseparated into an inducer cluster and an inhibitor cluster,with the inhibitor cluster further dividing into two subclusters(Figure S4 of the Supporting Information). The inducer-related cluster contained only forskolin and was characterizedby the up regulation of all four genes in a concentration-dependent manner. The inhibitor cluster consisted of twomajor groups with one group containing fadrozole andaminogluthetimide, while the second group containedprochloraz and trilostane. Fadrozole and aminogluthetimidewere characterized by slight (less than 3-fold) changes ingene expression that were not monotonic or always con-centration dependent. Prochloraz and trilostane were char-acterized by a general concentration-dependent decrease inthe expression of CYP17A, CYP11B2, and 3�HSD2, while thealterations in the expression of CYP19A for these twochemicals were relatively slight; chemical-related changesin gene expression observed in the controls were typicallyless than 2-fold.
DiscussionAnalysis of large sets of molecular and cellular response datais essential for understanding the underlying mechanism ofchemical-induced effects in living organisms. The availability
FIGURE 2. Analysis on the simulated concentration response curves using the least distance search algorithm (LDSA). (A) Collectionof 100 sigmoid curves, which were based on the cumulative density function of 100 kernel density estimates. The kernel densityestimates were based on an independent s from the standard normal distribution. (B) Plot of the first principal component of thepotency matrix against the potency (EC50) of the curve (the mean of the independent normal distribution). (C) Plot of the first principalcomponent of the dissimilarity matrix against the efficacy of the corresponding curves. (D) Display of the three curves correspondingto p(1), p(100), and p(51) of the first principal component, which accounts for 76% of the total variation of the distance matrix.
VOL. 43, NO. 10, 2009 / ENVIRONMENTAL SCIENCE & TECHNOLOGY 9 3929
of high throughput techniques and the sheer amount of rawdata obtained using these methods warrants special explor-atory computational methods for deriving meaningful in-formation and assisting mechanistic understanding. Theconcentration and time-dependent response functions pro-vide mechanistic (cause-effect) information for chemical-induced effects. High throughput time-dependent data areroutinely analyzed by general multivariate approaches suchas PCA, factor analysis, or using Pearson correlation distancemetrics in classification analysis (12-14). However, the needfor classification and visualization in the analysis of the highthroughput concentration-dependent response data type hasnot been addressed. The main difficulties of analyzing a largeset of concentration-dependent response data were due totheir distinct characteristics. First, the shapes of the con-centration-dependent response curves in many cases differfrom each other and are difficult to parametrize. This situationcannot be solved by simply comparing the parameters of theequations. Second, two chemicals with the same responsecurve shape but different potencies are seen as having thesame “effect” or “mechanism” by toxicologists, which sug-gests that the response (observation) needs to be seen asindependent from the specific concentration level (param-eter). Finally, response data of chemicals might not have thesame concentration range because they could be tested atdifferent concentrations to see effects. For example, chemicalswith lower potency are normally reported to be tested withinhigher concentration ranges. In another situation, somechemicals affect cell viability at higher concentration ranges,and they are normally tested in lower concentration ranges,which do not cause cytotoxicity. In these cases, directapplication of more general approaches such as the principalcomponent analysis are inappropriate (12).
In the present study, the LDSA approach used by ToxClusteffectively isolated two separate information pools (shapeand potency) from the chemical concentration-dependent
response curves and stored them in a distance matrix anda potency matrix. The N × N distance matrix describes thedata variation of the original chemical population in such away that each chemical (i) can be seen as a variable and itsdistance with any other chemical (j), di,j, is a measurementof the i variable on the j chemical. When the sample size(number of chemicals) is large, the first of several principalcomponents of the distance matrix shows the variation ofthe sample efficacy. The projections of the data points ontothe principal component directions (principal componentscores) are useful to examine the data variation. In thesimulation data, a linear relationship was observed betweenthe first PC of the distance matrix and the efficacy of thecurves (Figure 2C). The three typical curves correspondingto p(1), p(100) and p(51) effectively displayed the threedifferent major mechanisms: “inhibition”, “induction”, and“no effect” (Figure 2C,D). The hierarchical clustering usingthe distance matrix also displayed consistent results whencompared to the PCA method used on the groups of chemicals(Figure S3 of the Supporting Information). Similarly, the N× N potency matrix describes the relative potency amongchemicals as suggested by the linear relationship betweenthe first PC and the EC50. However, this “potency” informationwill only be valid when the chemicals examined have similarresponse curves.
The clustering tree and the compact visualization of thehigh dimensional data provided insights to the naturalorganization of data, without requiring any prior knowledgeof the chemical mechanisms of action. Because the H295Rsteroidogenesis screening assay can test chemicals over awide range of concentrations in a controlled setting, it is agood model for evaluating the utility of ToxClust in classifyingchemicals by their effects on the steroidogenic pathway(8, 10). This aspect of the assay is particularly importantbecause a chemical can exhibit multiple modes of actiondepending on exposure concentration and duration of
FIGURE 3. Clustering analysis of chemicals by ToxClust by use of concentrations of four hormones (progesterone, androstenedione,testosterone, and estradiol) as the classification variables. Calculated chemical and hormone classification trees are shown at theleft and the top, respectively. The chemical-induced concentration-response function of hormone production was visualized bythe color gradient at the corresponding cross position. Response data were expressed as fold change when compared to thecorresponding control. Concentrations of chemicals increase from left to right. Analysis of concentration response relationships wascarried out using ToxClust.
3930 9 ENVIRONMENTAL SCIENCE & TECHNOLOGY / VOL. 43, NO. 10, 2009
exposure, and any model that can evaluate multiple lines ofevidence relative to classifying a chemical will reduce theprobability of misclassifying a chemical as an endocrinedisruptor. Integrating the concentration-dependent responsedata of the four hormones, ToxClust was able to classifythe model chemicals into two clusters: “inducers” and“inhibitors”. Similar clustering results were observed to thosederived by use of the concentration-dependent gene expres-sion data. For example, forskolin was the only chemical thatinduced the production of all four measured hormones ina concentration-dependent manner. Androstenedione is theprecursor of testosterone and estradiol and is directlyconverted from dehydroepiandrosterone by 3�HSD or from17R hydroxy progesterone by CYP17A. The increase of themRNA level of 3�HSD and CYP17A suggested that theenhanced hormone production caused by forskolin resultedfrom the transcriptional activation of the steroidogenicpathway. The response profile was also consistent with theprevious finding that forskolin acts through stimulatingadenyl cyclase and increasing cAMP concentrations inadrenal cells (9, 15, 16). Trilostane was the first inhibitorseparated from the remaining three chemicals because itreduced the hormone production of androstenedione, tes-tosterone, and estradiol but not progesterone (Figure 3). FromFigure 3 developed by ToxClust, the inhibition on theproduction of either testosterone or estradiol by trilostanehad less potency and efficacy than that on their precursorandrostenedione, which is consistent with the previous reportthat trilostane is a 3�HSD inhibitor (17). In contrast, theinhibition of estradiol production by fadrozole was morepotent than that of androstenedione or testosterone. Al-though fadrozole had been suggested to be an aromataseinhibitor, it might also inhibit the enzyme 3�HSD that candirectly convert progesterone, androstenedione, and test-osterone. The computational approach ToxClust was able tonot only classify chemicals on the basis of multiple responsefactors, but also examine the relationships between endpoints used in the classification. For example, androstene-dione, testosterone, and estradiol were separated into acluster from progesterone, which is probably because of theirproximity on the metabolic pathway.
ToxClust is a promising new exploratory analysis toolfor the analysis of concentration-dependent response datain toxicological research. First, the concept of the LDSAis to identify the dissimilarity between any two chemicalsor two end points by comparing their concentration-dependent curve patterns. The dissimilarity calculated byLDSA significantly reduced the data dimension andprovided a uniform distance measure that can be adoptedby available classification algorithms. ToxClust introducedin this paper utilized an unsupervised algorithm that doesnot require prior knowledge of the samples. With the useof a LDSA-based chemical distance calculation, supervised,knowledge-based machine learning methods can also beapplied together to extract more meaningful informationabout the experiments. Second, ToxClust allows thevisualization of high-dimensional concentration-depend-ent data in a single graph, which provides a new way tofacilitate the study and understanding of large concentra-tion-dependent toxicological data sets. However, the resultof the chemical classification is meaningful only when theselection of the end points is relevant to a toxicity pathway.Toxicological pathways have been defined as a subset ofadverse outcome pathways extending only to the cellularor extracellular level and easily modeled in vitro. A cellularor extracellular response pathway, when sufficientlyperturbed, is expected to result in adverse health effects(18). When these cellular or extracellular end points arecoordinately examined in the test of a large number ofchemicals, chemicals classified in each cluster tend to have
similar patterns of concentration response curves andtherefore might hypothetically have the same mode ofaction.
While ToxClust proved to be an effective exploratorydata analysis tool, there are outstanding issues that stillneed to be addressed. These include (1) developing asystem to weight the different data (gene expression,protein expression, hormone production, etc.) accordingto their impact on the final classification of chemicals bymode of action, and (2) accounting for potency in thederivation distances to better classify chemicals with thesame mode of action.
Overall, ToxClust, as an exploratory data analysis tool,greatly facilitates analysis of complex data matrices, identifiespatterns of selected biological end points, and allowsmechanistic understanding of chemical-induced toxicity.
AcknowledgmentsData used in this paper to validate ToxClust had beencollected from projects that were conducted with fundingfrom the U.S. Environmental Protection Ageny (U.S. EPA),Office of Research and Development (ORD) Service Center/National Health, and Environmental Effects ResearchLaboratory(NHEERL), Contract GS-10F-0041 L; and fromthe computational Toxicology Program of the U.S. EPA,ORD, and the Office of Science Coordination and Policy(OSCP); and the U.S. EPA ORD Service Center/NHEERL,Contract GS-10F-0041 L. The research was supported bya Discovery Grant from the National Science and Engi-neering Research Council of Canada (Project 6807) andfrom the Western Economic Diversification Canada(Projects 6971 and 6807). The authors acknowledge thesupport of an instrumentation grant from the CanadaFoundation for Infrastructure. John P. Giesy was supportedby the Canada Research Chair Program and an at largeChair Professorship at the Department of Biology andChemistry and Research Centre for Coastal Pollution andConservation, City University of Hong Kong.
Supporting Information AvailableSimulation of concentration-dependent curves, informa-tion on the model chemicals, and chemical-induced foldchanges on hormone productions and on gene expressions.This material is available free of charge via the Internet athttp://pubs.acs.org.
Literature Cited(1) Endocrine Disruptor Screening and Testing Advisory Com-
mittee (EDSTAC) Final Report. http://epa.gov/endo/pubs/edspoverview/finalrpt.htm, U.S. Environmental ProtectionAgency: Washington, DC, 1998.
(2) Ankley, G. T.; Daston, G. P.; Degitz, S. J.; Denslow, N. D.; Hoke,R. A.; Kennedy, S. W.; Miracle, A. L.; Perkins, E. J.; Snape, J.;Tillitt, D. E.; Tyler, C. R.; Versteeg, D. Toxicogenomics inregulatory ecotoxicology. Environ. Sci. Technol. 2006, 40 (13),4055–4065.
(3) Kavlock, R. J.; Ankley, G. T. A perspective on the risk assessmentprocess for endocrine-disruptive effects on wildlife and humanhealth. Risk Anal. 1996, 16 (6), 731–739.
(4) Dix, D. J.; Houck, K. A.; Martin, M. T.; Richard, A. M.; Setzer,R. W.; Kavlock, R. J. The ToxCast program for prioritizing toxicitytesting of environmental chemicals. Toxicol. Sci. 2007, 95 (1),5–12.
(5) Gracia, T.; Hilscherova, K.; Jones, P. D.; Newsted, J. L.; Zhang,X.; Hecker, M.; Higley, E. B.; Sanderson, J. T.; Yu, R. M. K.; Wu,R. S. S.; Giesy, J. P. The H295R system for evaluation of endocrine-disrupting effects. Ecotoxicol. Environ. Saf. 2006, 65 (3), 293–305.
(6) Villeneuve, D. L.; Khim, J. S.; Kannan, K.; Giesy, J. P. Relativepotencies of individual polycyclic aromatic hydrocarbons toinduce dioxinlike and estrogenic responses in three cell lines.Environ. Toxicol. Chem. 2002, 17 (2), 128–137.
VOL. 43, NO. 10, 2009 / ENVIRONMENTAL SCIENCE & TECHNOLOGY 9 3931
(7) Giesy, J. P.; Kannan, K. Dioxin-like and non-dioxin-like toxiceffects of polychlorinated biphenyls (PCBs): Implications forrisk assessment. Crit. Rev. Toxicol. 1998, 28, 511–569.
(8) Zhang, X.; Yu, R. M.; Jones, P. D.; Lam, G. K.; Newsted, J. L.;Gracia, T.; Hecker, M.; Hilscherova, K.; Sanderson, T.; Wu, R. S.;Giesy, J. P. Quantitative RT-PCR methods for evaluating toxicant-induced effects on steroidogenesis using the H295R cell line.Environ. Sci. Technol. 2005, 39 (8), 2777–2785.
(9) Sanderson, J. T.; Boerma, J.; Lansbergen, G.; Van den Berg,M. Induction and Inhibition of aromatase (CYP19) activityby various classes of pesticides in H295R human adreno-cortical carcinoma cells. Toxicol. Appl. Pharmacol. 2002, 182,44–54.
(10) Hilscherova, K.; Jones, P. D.; Gracia, T.; Newsted, J. L.; Zhang,X. W.; Sanderson, J. T.; Yu, R. M. K.; Wu, R. S. S.; Giesy, J. P.Assessment of the effects of chemicals on the expression of tensteroidogenic genes in the H295R cell line using real-time PCR.Toxicol. Sci. 2004, 81 (1), 78–89.
(11) Hecker, M.; Newsted, J. L.; Murphy, M. B.; Higley, E. B.; Jones,P. D.; Wu, R.; Giesy, J. P. Human adrenocarcinoma (H295R)cells for rapid in vitro determination of effects on steroido-genesis: Hormone production. Toxicol. Appl. Pharmacol. 2006,217 (1), 114–124.
(12) Jones, M. C.; Rice, J. A. Displaying the important features oflarge collections of similar curves. J. Amer. Stat. Assoc. 1992, 46,140–5.
(13) Zhang, X.; Hecker, M.; Jones, P. D.; Newsted, J.; Au, D.; Kong,R.; Wu, R. S. S.; Giesy, J. P. Responses of the Medaka HPG axisPCR array and reproduction to prochloraz and ketoconazole.Environ. Sci. Technol. 2008, 42 (17), 6762–6769.
(14) Franke, R.; Gruska, A. Decomposition of time dependentresponse data by factor analysis. QSAR & Combin. Sci. 1994, 13(2), 148–15.
(15) Bird, I. M.; Hanley, N. A.; Word, R. A.; Mathis, J. M.; Mccarthy,J. L.; Mason, J. I.; Rainey, W. E. Human Nci-H295 adrenocorticalcarcinoma cells: A model for angiotensin-II-responsive aldos-terone secretion. Endocrinology 1993, 133, 1555–1561.
(16) Momoi, K.; Waterman, M. R.; Simpson, E. R.; Zanger, U. M.3′,5′-cyclic adenosine monophosphate-dependent transcriptionof the CYP11A (cholesterol side chain cleavage cytochrome P450)gene involves a DNA response element containing a putativebinding site for transcription factor Sp1. Mol. Endocrinol. 1992,6 (10), 1682–1690.
(17) Malouitre, S. D.; Baker, S.; Puddlefoot, J. R.; Jalili, J.; Glover,H. R.; Vinson, G. P. Regulation of hepatic steroid receptors andenzymes by 3beta-hydroxysteroid dehydrogenase inhibitortrilostane. J. Steroid Biochem. Mol. Biol. 2006, 101 (2-30), 97–105.
(18) Toxicity Testing Environmental in the 21st Century: A Visionand a Strategy; National Academies Press: Washington, DC, 2007.
ES8029472
3932 9 ENVIRONMENTAL SCIENCE & TECHNOLOGY / VOL. 43, NO. 10, 2009
Supporting Information
Title: Classification of Chemicals Based on Concentration-Dependent
Toxicological Data Using “ToxClust©” Authors: Xiaowei Zhang*1, John L. Newsted2, Markus Hecker1,3, Eric B. Higley1,
Paul D. Jones1,5and John P. Giesy1,4,5,6,7,8 1Toxicology Centre, University of Saskatchewan, Saskatoon, Saskatchewan, Canada 2ENTRIX, Inc., Okemos, MI, USA
3ENTRIX, Inc., Saskatoon, SK, Canada 4 Dept. Biomedical Veterinary Sciences, University of Saskatchewan, Saskatoon, Saskatchewan, Canada 5Centre for Coastal Pollution and Conservation and Department of Biology and Chemistry, City University of HongKong, Kowloon, HongKong, SAR China 6Department of Zoology, Michigan State University, East Lansing, MI, USA 7State Key Laboratory of Pollution Control and Resource Reuse, School of the Environment, Nanjing University, Nanjing 8State Key Laboratory of Marine Environmental Science, College of Oceanography and Environmental Science, Xiamen University, Xiamen, P R China
Corresponding Author:
Xiaowei Zhang, PhD.
44 Campus Drive, University of Saskatchewan Saskatoon SK S7N 5B3 Canada Tel: 306-966-1204 Fax: 306-966-4796 E-mail: [email protected]
Submitted to: Environmental Science and Technology Number of page: 12 Number of table: 2 Number of figure: 4
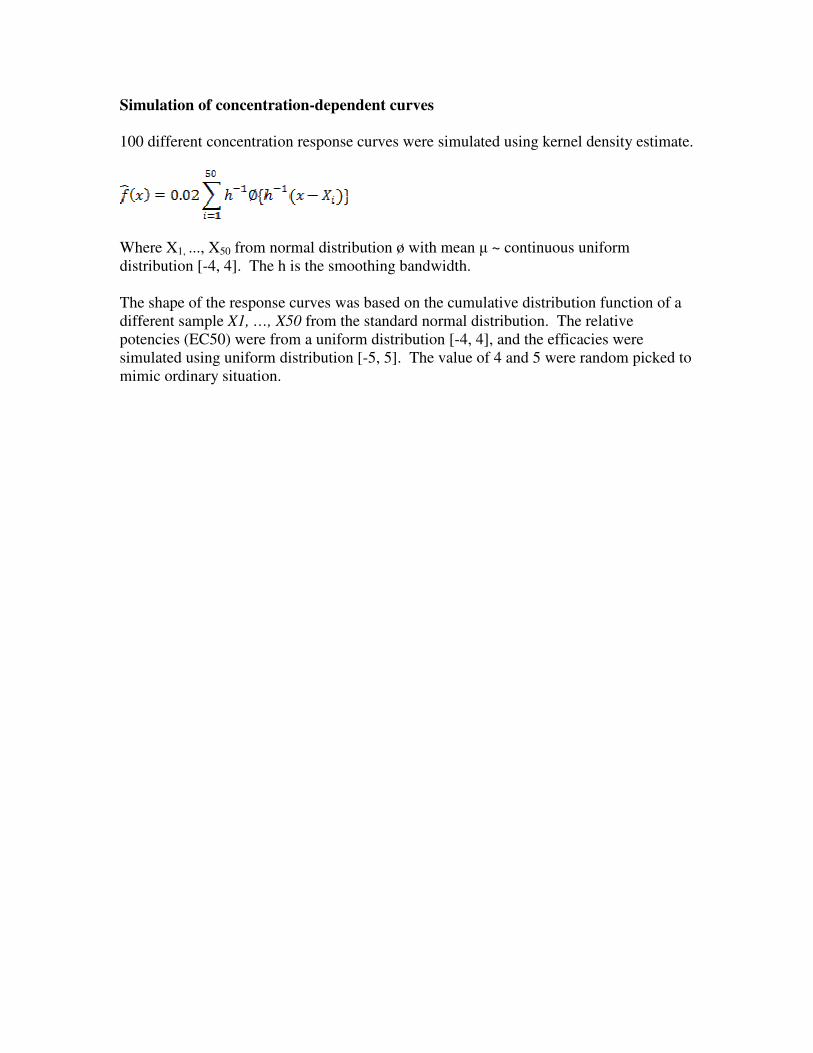
Simulation of concentration-dependent curves
100 different concentration response curves were simulated using kernel density estimate.
Where X1, ..., X50 from normal distribution ø with mean µ ~ continuous uniform
distribution [-4, 4]. The h is the smoothing bandwidth.
The shape of the response curves was based on the cumulative distribution function of a
different sample X1, …, X50 from the standard normal distribution. The relative
potencies (EC50) were from a uniform distribution [-4, 4], and the efficacies were
simulated using uniform distribution [-5, 5]. The value of 4 and 5 were random picked to
mimic ordinary situation.

Model chemicals
The model chemicals were chosen based on their known effects on steroid biosynthesis
and steroidogenic gene expression and included prochloraz, fadrozole, aminoglutethimide
forskolin, and trilostane. Prochloraz is an agricultural imidiazol fungicide that inhibits a
cytochrome P450 (CYP) enzyme involved in ergosterol synthesis, but has also been
reported to inhibit other CYP enzymes, and to act as a potent aromatase inhibitor (1-3).
Fadrozole is a non-steroidal reversible and competitive inhibitor of aromatase (CYP19)
as well as of enzymatic activities associated with CYP11B (4,5). Aminoglutethimide is
an aromatase inhibitor that was also reported to interact with several other steroidogenic
protein/enzymes such as steroidogenic acute regulatory protein (StAR), CYP11A
(P450scc, cholesterol side-chain cleavage enzyme) and 17 beta-hydroxy-steroid
dehydrogenase (17β-HSD) (6,7). Forskolin is a general inducer of steroidogenesis that
acts via the activation of cAMP pathways (6). Trilostane a specific inhibitor of 3βHSD
and has been shown to alter the production of progesterone in several animal models (8-
10). Forskolin, aminoglutethimide and prochloraz were obtained from Aldrich-Sigma
Chemical Co. (St. Louis, MO, USA). Fadrazole was obtained from Novartis Pharma AG
(Basel, CH). Trilostane was contributed by Dr. Michael A. Parrish from Parrish Business
Development (Northumberland, UK)
Reference (1) Mason, J. I., Carr, B. R., and Murry, B. A. Imidiazole antimyotics: selective
inhibitors of steroid aromatization and progesterone hydroxylation. Steroids 1987, 50,
179-189.
(2) Laignelet, L., Narbonne, J.-F., Lhuguenot, J.-C., and Riviere, J.-L.. Induction and
inhibition of rat liver cytochrome(s) P-450 by an imidiazole fungicide (prochloraz).
Toxicology 1989, 59, 271-284.
(3) Troesken, E.R., Fischer, K., Voelkel, W., Lutz, W.K. Inhibition of human CYP19
by azoles used as antifungal agents and aromatase inhibitors, using a new LC–MS/MS
method for the analysis of estradiol product formation. Toxicol. 2006, 219, 33-40.
(4) Steele, R.E., Mellor, L.B., Sawyer, W.K., Wasvary, J.M., Browne, L.J. In vitro
and in vivo studies demonstrating potent and selective estrogen inhibition with the
nonsteroidal aromatase inhibitor CGS 16949A. Steroids 1987, 50, 147-161.
(5) Muller-Vieira, U., Angotti, M., Hartmann, R.W. The adrenocortical tumor cell
line NCI-H295R as an in vitro screening system for the evaluation of CYP11B2
(aldosterone synthase) and CYB11B1 (steroid-11 beta-hydroxylase) inhibitors. J. Steroid
Biochem. Mol. Biol. 2005, 96, 259-270.
(6) Hilscherova, K., Jones, P. D., Gracia, T., Newsted, J. L., Zhang, X. W., Sanderson,
J. T., Yu, R. M. K., Wu, R. S. S., and Giesy, J. P. Assessment of the effects of chemicals
on the expression of ten steroidogenic genes in the H295R cell line using real-time PCR.
Toxicol. Sci. 2004, 81(1), 78-89.
(7) Johansson, M. K., Sanderson, J. T., and Lund, B. O. Effects of 3-MeSO2-DDE
and some CYP inhibitors on glucocorticoid steroidogenesis in the H295R human
adrenocortical carcinoma cell line. Toxicol. In Vitro 2002, 16, 113-121.
(8) Cooke, G.M. Differential effects of trilostane and cyanoketone on the 3 beta-
hydroxysteroid dehydrogenase-isomerase reactions in androgen and 16-androstene
biosynthetic pathways in the pig testis. J. Steroid Biochem. Mol. Biol. 1996, 58(1), 95-
101.
(9) Malouitre, S.D., Baker, S., Puddlefoot, J.R., Jalili, J., Glover, H.R., and Vinson,
G.P. Regulation of hepatic steroid receptors and enzymes by 3beta-hydroxysteroid
dehydrogenase inhibitor trilostane. J. Steroid Biochem. Mol. Biol. 2006, 101(2-30, 97-
105.
(10) Potts, G.O., Creange, J.E., Hardomg, H.R., and Schane, H.P. Trilostane, an orally
active inhibitor of steroid biosynthesis. Steroid 1978, 32(2), 257-267.

Table Legends
Table S1 Chemical-induced fold changes on hormone productions in H295R cells Table S2 Chemical-induced fold changes on gene expression in H295R cells

Table S1 Chemical-induced fold changes on hormone productions in H295R cells
Chemical Conc. (μM) Progesterone Testosterone Estradiol AndrostenedioneAminogluthetimide 0.1 1.248 0.979 1.242 1.0000 Aminogluthetimide 0.3 0.985 0.812 0.879 0.9119 Aminogluthetimide 1 1.063 0.912 0.916 0.9270 Aminogluthetimide 3 1.189 0.805 0.776 1.0255 Aminogluthetimide 10 0.792 0.757 0.879 0.8849 Aminogluthetimide 30 0.355 0.366 0.431 0.4526 Aminogluthetimide 100 0.217 0.188 0.289 0.1361 Fadrozole 0.01 0.500 1.331 0.844 1.0000 Fadrozole 0.1 0.524 1.277 0.609 0.9792 Fadrozole 1 0.509 0.861 0.349 0.7523 Fadrozole 3 0.529 0.580 0.332 0.5961 Fadrozole 10 1.229 0.513 0.216 0.1861 Fadrozole 100 0.333 0.086 0.244 0.0621 Forskolin 0.01 0.855 1.520 1.214 1.0000 Forskolin 0.03 1.249 1.874 1.457 0.9523 Forskolin 0.1 1.246 1.448 2.176 1.4001 Forskolin 0.3 1.600 1.709 4.133 1.5713 Forskolin 1 2.105 2.191 6.993 2.3241 Forskolin 3 2.296 2.318 9.865 3.8657 Forskolin 10 2.320 2.775 11.873 4.5781 Prochloraz 0.001 0.912 0.847 1.013 1.0000 Prochloraz 0.01 1.331 0.765 0.940 0.8437 Prochloraz 0.03 1.714 0.677 0.679 0.4828 Prochloraz 0.1 2.843 0.593 0.374 0.2436 Prochloraz 0.3 4.509 0.418 0.263 0.1121 Prochloraz 1 4.878 0.292 0.165 0.0382 Prochloraz 3 4.078 0.307 0.182 0.0239 Trilostane 0.001 1.000 0.906 1.297 0.9965 Trilostane 0.01 0.887 0.648 1.215 0.4249 Trilostane 0.1 0.957 0.260 0.866 0.0633 Trilostane 1 0.991 0.646 0.299 0.0854
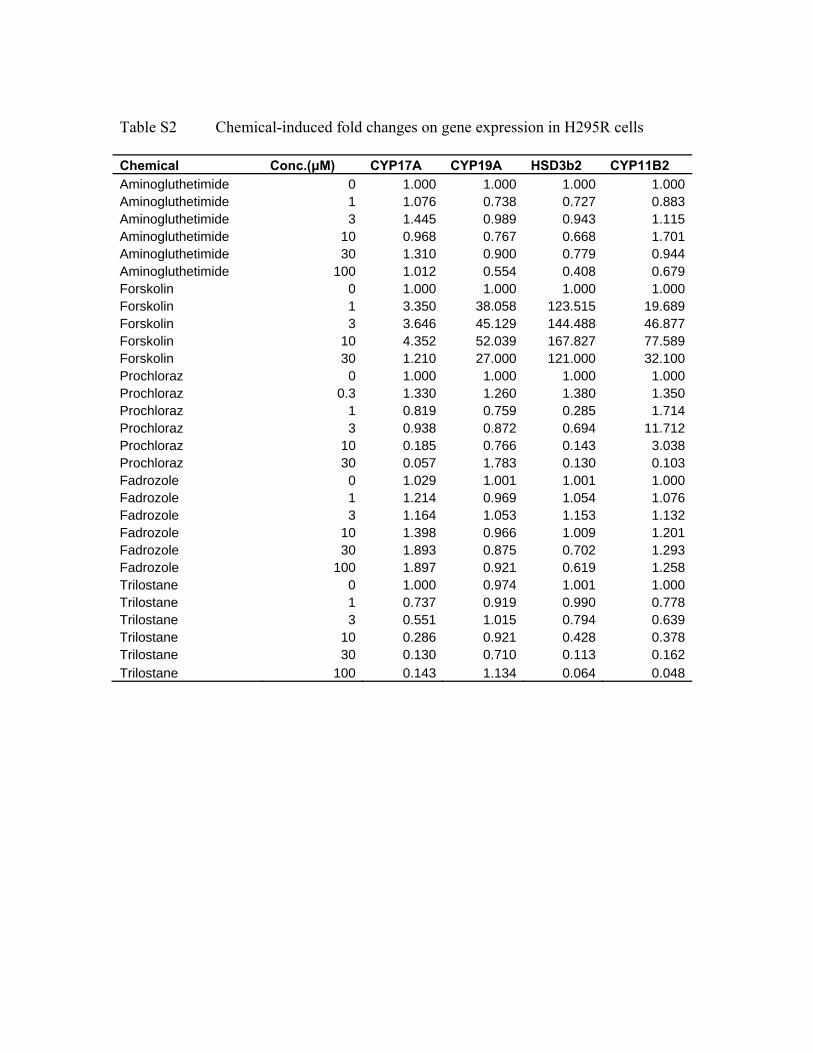
Table S2 Chemical-induced fold changes on gene expression in H295R cells Chemical Conc.(μM) CYP17A CYP19A HSD3b2 CYP11B2 Aminogluthetimide 0 1.000 1.000 1.000 1.000Aminogluthetimide 1 1.076 0.738 0.727 0.883Aminogluthetimide 3 1.445 0.989 0.943 1.115Aminogluthetimide 10 0.968 0.767 0.668 1.701Aminogluthetimide 30 1.310 0.900 0.779 0.944Aminogluthetimide 100 1.012 0.554 0.408 0.679Forskolin 0 1.000 1.000 1.000 1.000Forskolin 1 3.350 38.058 123.515 19.689Forskolin 3 3.646 45.129 144.488 46.877Forskolin 10 4.352 52.039 167.827 77.589Forskolin 30 1.210 27.000 121.000 32.100Prochloraz 0 1.000 1.000 1.000 1.000Prochloraz 0.3 1.330 1.260 1.380 1.350Prochloraz 1 0.819 0.759 0.285 1.714Prochloraz 3 0.938 0.872 0.694 11.712Prochloraz 10 0.185 0.766 0.143 3.038Prochloraz 30 0.057 1.783 0.130 0.103Fadrozole 0 1.029 1.001 1.001 1.000Fadrozole 1 1.214 0.969 1.054 1.076Fadrozole 3 1.164 1.053 1.153 1.132Fadrozole 10 1.398 0.966 1.009 1.201Fadrozole 30 1.893 0.875 0.702 1.293Fadrozole 100 1.897 0.921 0.619 1.258Trilostane 0 1.000 0.974 1.001 1.000Trilostane 1 0.737 0.919 0.990 0.778Trilostane 3 0.551 1.015 0.794 0.639Trilostane 10 0.286 0.921 0.428 0.378Trilostane 30 0.130 0.710 0.113 0.162Trilostane 100 0.143 1.134 0.064 0.048

Figure Legends Figure S1 Illustration of Manhattan distance. A) dose-response function of inducer X
and inhibitor Y; B) dose-response function of unknown chemical Z; C) average Manhattan distance between dose response curves of chemical C and inducer A: |Z-A|= 0.270; D) average Manhattan distance between dose response curves of chemical Z and inhibitor Y: |Z-Y|= 1.294. |Z-X| < |Z-Y| suggesting dose-response function of Z is more similar to that of chemical X than Y; E-F) Chemical M and N have the same shape dose-response curve with M being more potent than N. EC50 of chemical M and N can be obtained based on their dose-response functions, which are 2 and 4 respectively. Average Manhattan distance between dose-response functions of chemical M and inhibitor N: |M-N|= 0.673.
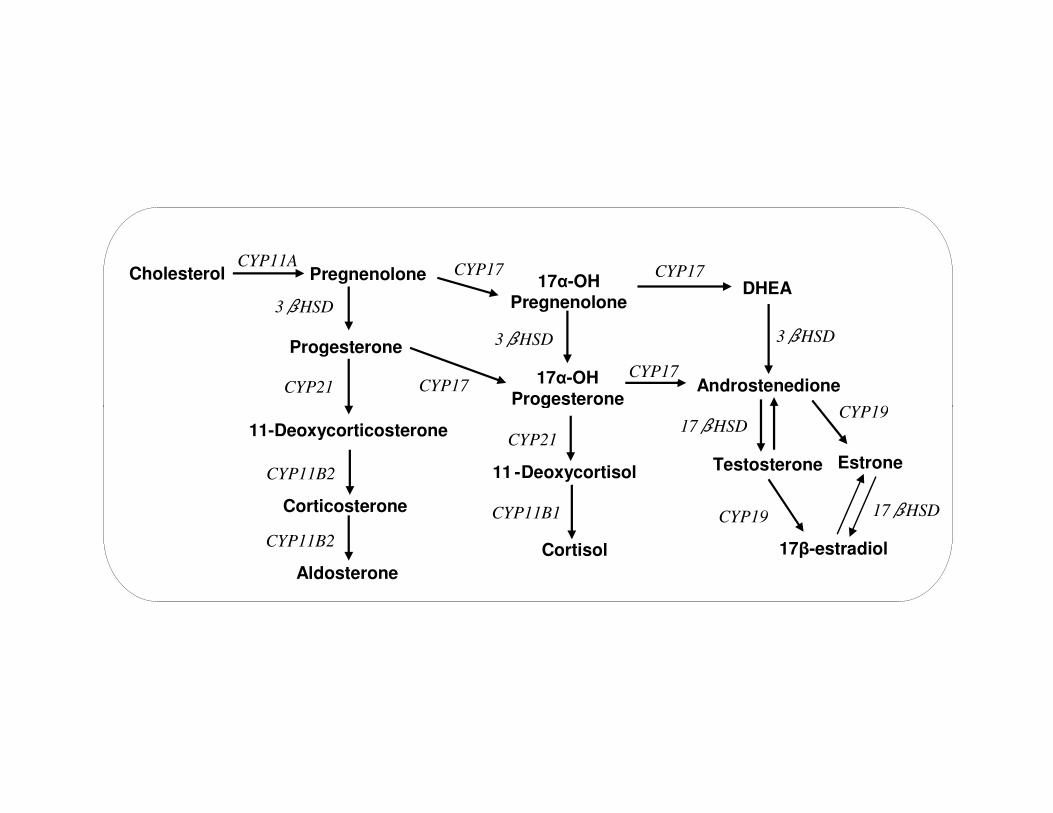
Figure S2 Steroidogenic pathway in H295R cells. Enzymes are in italics, hormones
are bolded and arrows indicate the direction of synthesis. Figure S3 Hierarchical clustering analysis of the 100 simulated concentration
dependent curves. The curves were labeled by the corresponding rank of their efficacies. The original tree structure was demonstrated by the upper and lower parts of the dendrogram separately. A) upper dendrogram; B-F) branch 1-5 of the lower dendrograms.
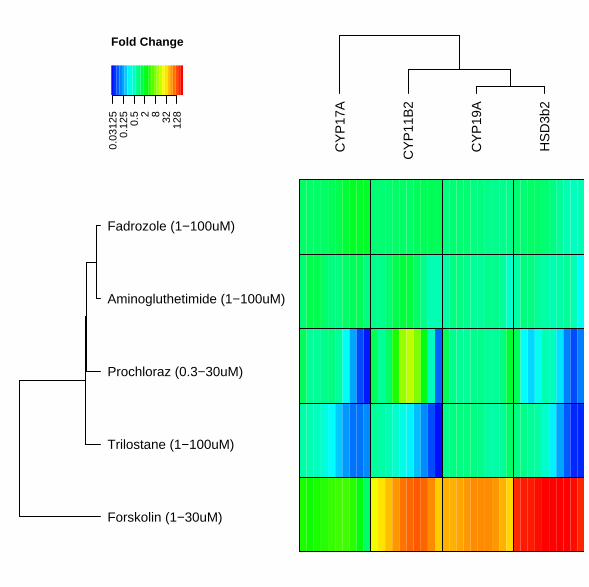
Figure S4 Clustering analysis of chemicals by ToxClust©, by use of the four mRNA
level (CYP19A, 3βHSD2, CYP17A and CYP11B2) as classification variables. Chemicals were shown in row and endpoints were in column. Chemical induced concentration response curve was visualized by the color gradient at the corresponding cross position. Response data were expressed as fold change comparing to the corresponding control (not shown here). The increase of chemical concentration was from left to right.
0 1 2 3 4 5 6
−1.
0−
0.5
0.0
0.5
1.0
A
Conc.
Log2
Fol
d C
hang
e
X: inducer
Y: inhibitor
0 1 2 3 4 5 6
−1.
0−
0.5
0.0
0.5
1.0
B
Conc.Lo
g2 F
old
Cha
nge
Z: unknown
0 1 2 3 4 5 6
−1.
0−
0.5
0.0
0.5
1.0
C
Conc.
Log2
Fol
d C
hang
e
Dist: |Z−X| = 0.27
0 1 2 3 4 5 6
−1.
0−
0.5
0.0
0.5
1.0
D
Conc.
Log2
Fol
d C
hang
e
Dist: |Z−Y| = 1.294
0 1 2 3 4 5 6
0.0
0.5
1.0
1.5
E
Conc.
Log2
Fol
d C
hang
e
M N
0 1 2 3 4 5 6
0.0
0.5
1.0
1.5
F
Conc.
Log2
Fol
d C
hang
e
Dist: |M−N| = 0.673
Illustration of Manhattan Distance
Concentration
Fol
d C
hang
e
3β-HSD
CYP21
DHEA
Androstenedione
CYP17PregnenoloneCYP11A
Cholesterol
Progesterone
CYP19
3β-HSD
CYP17
CYP17
3β-HSD
17α-OHPregnenolone
17α-OH
Progesterone
CYP17
3β-HSD
CYP21
DHEA
Androstenedione
CYP17PregnenoloneCYP11A
Cholesterol
Progesterone
CYP19
3β-HSD
CYP17
CYP17
3β-HSD
17α-OHPregnenolone
17α-OH
Progesterone
CYP17
Corticosterone
Aldosterone
CYP11B2
CYP19
CYP21
11 -Deoxycortisol
CYP11B1
Cortisol
Testosterone Estrone
CYP19
CYP11B2
Progesterone
11-Deoxycorticosterone 17β-HSD
17β-estradiol
17β-HSDCorticosterone
Aldosterone
CYP11B2
CYP19
CYP21
11 -Deoxycortisol
CYP11B1
Cortisol
Testosterone Estrone
CYP19
CYP11B2
Progesterone
11-Deoxycorticosterone 17β-HSD
17β-estradiol
17β-HSD
01
23
45
●
●
Bra
nch
1
Bra
nch
2●
Bra
nch
3
●
Bra
nch
4
Bra
nch
5
A: upper dendrogram
0.0
0.2
0.4
0.6 ●
●
●●
●
47 45
●
44 46
●●
51 52
●
50
●
48 49
●
●
35
●
37 36
●
●
39 38
●
40
●
41
●
43 42
●
●
33
●
34 32
●
●
31 30
●
27
●
28 29
B: Branch 10.
00.
20.
40.
60.
81.
0
●
●
1
●
●
2 3
●
5 4
●
●
●
24 26
●
23
●
20
●
25
●
22 21
●
●
●
8 13
●
●
9 10
●
6 7
●
●
●
16 15
●
19
●
18 17
●
11
●
12 14
C: Branch 2
0.0
0.2
0.4
0.6
0.8 ●
●
●90 92
●
91 89
●
●●
96 93
●
94 95
●
97
●
98
●
100 99
D: Branch 3
0.0
0.1
0.2
0.3
0.4 ●
●
●
86
●
88 87
●
●
83 84
●
82
●
81 85
●
78
●
●
75 80
●
79
●
76 77
E: Branch 4
0.0
0.1
0.2
0.3
0.4
0.5
●
●
●
●
62
●
63 61
●
59
●
58 60
●
●
●
57 56
●
55
●
54 53
●
64
●
65 66
●
●
67
●
69 68
●
●
74
●
72 73
●70 71
F: Branch 5
Forskolin (1−30uM)
Trilostane (1−100uM)
Prochloraz (0.3−30uM)
Aminogluthetimide (1−100uM)
Fadrozole (1−100uM)
Fold Change
0.03
125
0.12
50.
5 2 8 32 128
CY
P17
A
CY
P11
B2
CY
P19
A
HS
D3b
2