classification of small boats in infrared images for...
TRANSCRIPT
Classification of small Boats in Infrared Images formaritime Surveillance
Michael TeutschFraunhofer Institute of Optronics, System
Technologies and Image Exploitation (IOSB)Fraunhoferstrasse 1, 76131 Karlsruhe, Germany
Email: [email protected]
Wolfgang KrugerFraunhofer Institute of Optronics, System
Technologies and Image Exploitation (IOSB)Fraunhoferstrasse 1, 76131 Karlsruhe, Germany
Email: [email protected]
Abstract—Autonomous round-the-clock observation of widecritical maritime areas can be a powerful support for borderprotection agencies to avoid criminal acts like illegal immigra-tion, piracy or drug trafficking. These criminal acts are oftenaccomplished by using small boats to decrease the probability ofbeing uncovered. In this paper, we present an image exploitationapproach to detect and classify maritime objects in infraredimage sequences recorded from an autonomous platform. Wefocus on high robustness and generality with respect to variationsof boat appearance, image quality, and environmental condition.A fusion of three different detection algorithms is performedto create reliable alarm hypotheses. In the following, a set ofwell-investigated features is extracted from the alarm hypothesesand evaluated using a two-stage-classification with support vectormachines (SVMs) in order to distinguish between three objectclasses: clutter, irrelevant objects and suspicious boats. On thegiven image data we achieve a rate of 97 % correct classifications.
I. INTRODUCTION
Criminal activities at sea such as illegal immigration, piracyor trafficking of drugs, weapons and illicit substances havebecome an uprising issue in the recent years. Often, small andmidsize boats, which are difficult to detect, are used for suchactivities. Until now, border agencies observe and protect thecritical maritime areas by ships, planes or helicopters, whichis very expensive and full coverage is difficult to obtain.
To improve this situation, the European research projectAMASS (Autonomous MAritime Surveillance System) inves-tigates to use a network of unmanned surveillance platformslocated in a considerable distance from shore. The platformsare equipped with different sensors, the optical sensors beinguncooled thermal infrared cameras. In order to exploit the datadelivered by the camera, detection and tracking algorithmswhich are able to work with a moving sensor under a varietyof weather and visibility conditions are required.
In our work, we focus exactly on this topic to investigateand implement approaches for a robust detection of maritimeobjects, reliable generation of alarms with low rate of falsepositives and a final classification of these alarms with theaim of distinguishing between irrelevant objects like bigships, buoys or animals, and small, suspicious boats. Thus,a human operator is strongly supported not only due to theautonomous round-the-clock monitoring, but also due toa prior selection of alarms, which are really worth to be
transmitted.
Related work for detection approaches includes for exam-ple template-based cross-correlation along the prior detectedhorizon in infrared images [1], edge-detection and -groupingabove the prior detected horizon in visual color images [2]and anomaly detection using pixel-wise Mahalanobis distanceand mean shift in visual and infrared images [3].
As classification is the main topic of this paper, we gomore into detail for the related work in this field of research.In [4], small boats are to be classified in visual and infraredimage data. Therefore, a precise segmentation is performedusing adaptive progressive thresholding (APT) on the visualand graph-cuts on the infrared images. The object’s shape isthe crucial classification information which is extracted byapplying a principal component analysis (PCA) directly onthe image pixels. Correct classification rates of 84 % for visualand 77 % for infrared data are achieved.
In [5], an on-shore visual camera is used for classificationof suspicious boats and ships in a harbor environment. Againprecise segmentation and object shape are the main issues.After a background subtraction and hysteresis thresholding,the MPEG-7 region-based shape descriptor [6] is extractedand classified with k-Nearest-Neighbor (k-NN). About 90 %of the given data is correctly classified.
The next approaches only consider big ships to distinguishbetween different ship types like tanker, cargo ships, carrieror cruiser. For all classes to be found, three-dimensional shipmodels are available e.g. for training or to create silhouettetemplates. In [7], two experimental systems are developed forinfrared images. The first is working with edge-histogramsand the second with invariant moments (Hu moments) onthe silhouette and a neural network. Classification rates of80 % respectively 70 % are obtained. In [8], the usage ofa more precise segmentation approach, Hu moments anda support vector machine (SVM) for classification performbetter than in [7] on infrared data. Finally, in [9] the PCAis discovered to produce better classification results usingsilhouette information than Hu moments in combination withneural networks.
All presented approaches use the shape of the detectedobjects for classification. This is only possible, if the object is
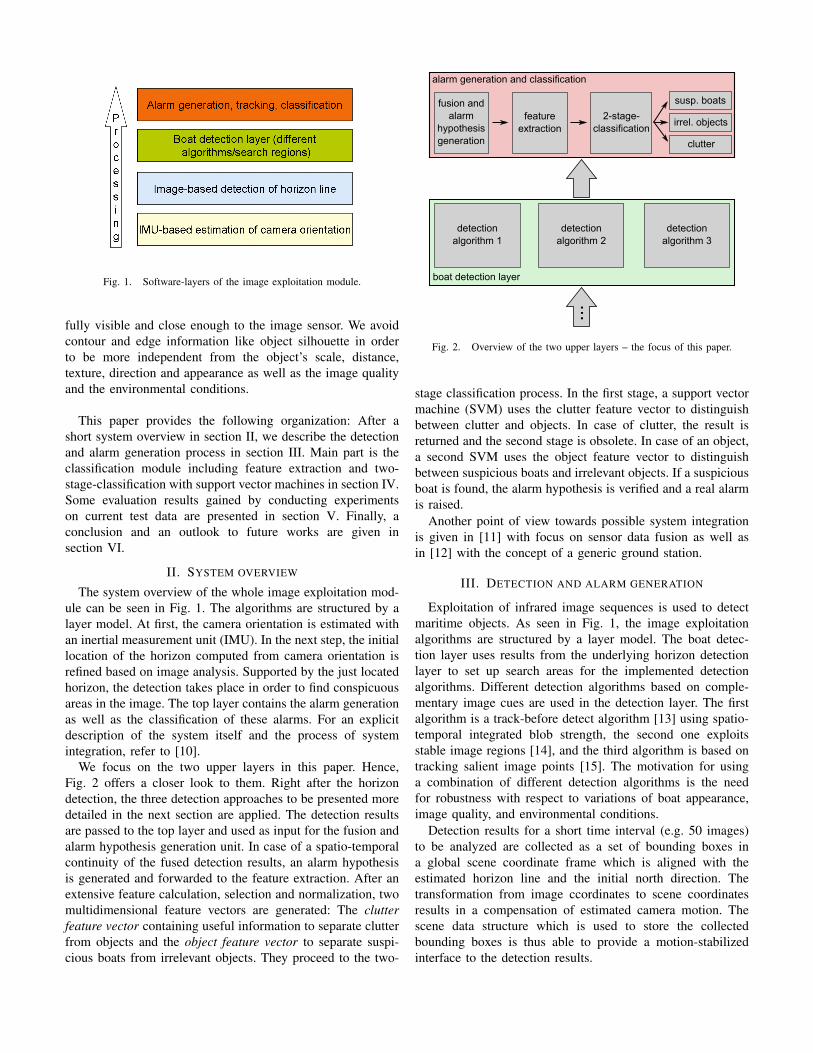
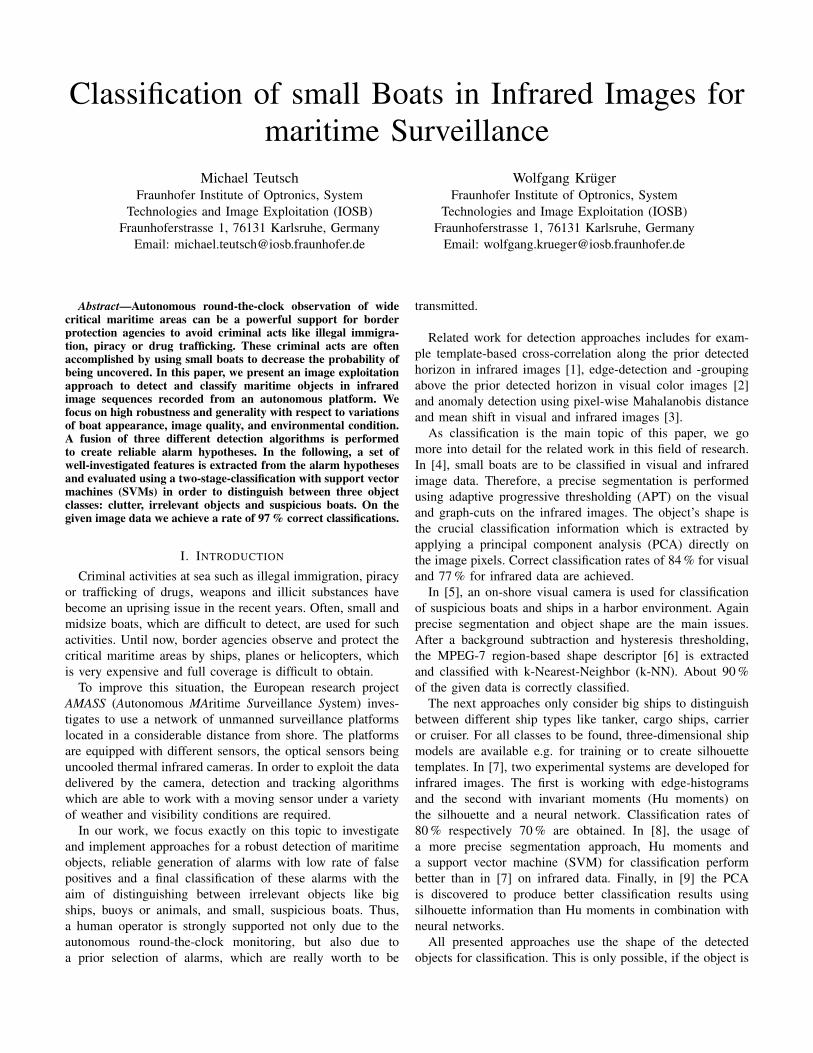
Fig. 1. Software-layers of the image exploitation module.
fully visible and close enough to the image sensor. We avoidcontour and edge information like object silhouette in orderto be more independent from the object’s scale, distance,texture, direction and appearance as well as the image qualityand the environmental conditions.
This paper provides the following organization: After ashort system overview in section II, we describe the detectionand alarm generation process in section III. Main part is theclassification module including feature extraction and two-stage-classification with support vector machines in section IV.Some evaluation results gained by conducting experimentson current test data are presented in section V. Finally, aconclusion and an outlook to future works are given insection VI.
II. SYSTEM OVERVIEW
The system overview of the whole image exploitation mod-ule can be seen in Fig. 1. The algorithms are structured by alayer model. At first, the camera orientation is estimated withan inertial measurement unit (IMU). In the next step, the initiallocation of the horizon computed from camera orientation isrefined based on image analysis. Supported by the just locatedhorizon, the detection takes place in order to find conspicuousareas in the image. The top layer contains the alarm generationas well as the classification of these alarms. For an explicitdescription of the system itself and the process of systemintegration, refer to [10].
We focus on the two upper layers in this paper. Hence,Fig. 2 offers a closer look to them. Right after the horizondetection, the three detection approaches to be presented moredetailed in the next section are applied. The detection resultsare passed to the top layer and used as input for the fusion andalarm hypothesis generation unit. In case of a spatio-temporalcontinuity of the fused detection results, an alarm hypothesisis generated and forwarded to the feature extraction. After anextensive feature calculation, selection and normalization, twomultidimensional feature vectors are generated: The clutterfeature vector containing useful information to separate clutterfrom objects and the object feature vector to separate suspi-cious boats from irrelevant objects. They proceed to the two-
susp. boats
irrel. objects
clutter
2-stage-classification
fusion andalarm
hypothesisgeneration
featureextraction
boat detection layer
alarm generation and classification
detection algorithm 1
detection algorithm 2
detection algorithm 3
...
Fig. 2. Overview of the two upper layers – the focus of this paper.
stage classification process. In the first stage, a support vectormachine (SVM) uses the clutter feature vector to distinguishbetween clutter and objects. In case of clutter, the result isreturned and the second stage is obsolete. In case of an object,a second SVM uses the object feature vector to distinguishbetween suspicious boats and irrelevant objects. If a suspiciousboat is found, the alarm hypothesis is verified and a real alarmis raised.
Another point of view towards possible system integrationis given in [11] with focus on sensor data fusion as well asin [12] with the concept of a generic ground station.
III. DETECTION AND ALARM GENERATION
Exploitation of infrared image sequences is used to detectmaritime objects. As seen in Fig. 1, the image exploitationalgorithms are structured by a layer model. The boat detec-tion layer uses results from the underlying horizon detectionlayer to set up search areas for the implemented detectionalgorithms. Different detection algorithms based on comple-mentary image cues are used in the detection layer. The firstalgorithm is a track-before detect algorithm [13] using spatio-temporal integrated blob strength, the second one exploitsstable image regions [14], and the third algorithm is based ontracking salient image points [15]. The motivation for usinga combination of different detection algorithms is the needfor robustness with respect to variations of boat appearance,image quality, and environmental conditions.
Detection results for a short time interval (e.g. 50 images)to be analyzed are collected as a set of bounding boxes ina global scene coordinate frame which is aligned with theestimated horizon line and the initial north direction. Thetransformation from image ccordinates to scene coordinatesresults in a compensation of estimated camera motion. Thescene data structure which is used to store the collectedbounding boxes is thus able to provide a motion-stabilizedinterface to the detection results.

In the next software layer, spatio-temporal fusion of thedetection results is performed on the scene data structure usinga voting procedure. Voting results in a set of bounding boxclusters which extend both in space and time. To generatealarm hypotheses and to provide input for the classificationalgorithm, a representative image has to be determined foreach detected cluster. From the images used to build the scenedata structure, we select for each spatio-temporal cluster theimage which provides the maximum support for this cluster.Support is defined by the number of detections covered bya cluster. From the supporting detections a final boundingbox is computed which, together with the selected image,represents an alarm hypothesis that has to be validated bythe classification component. In Fig. 3 an example for thedetection process is visualized.
(a) Detected horizon line and bounding boxes resulting from differentdetection algorithms. Shown is the automatically selected image with themaximum number of supporting detections. Different colors (red, green,and yellow) are used for different detection algorithms.
(b) Final bounding box (red) computed from the detections in Fig. 3(a).Image and bounding box form a detection hypothesis used as input forclassification and alarm generation.
Fig. 3. Visualization of an example for the detection process.
IV. CLASSIFICATION
This section is divided in two subsections: The extensiveresearch on feature extraction and the two-stage-classificationwith SVMs.
A. Feature extraction
The feature extraction consists of a pre-processing step,where a background subtraction is performed, the featurecalculation, where a high-dimensional feature vector is createdcontaining information of several feature classes, and finallythe feature evaluation, where the features are normalized,analyzed and finally reduced in their dimensionality for betterseparability and faster computation time.
1) Pre-processing: As some of the features to be calculatedneed an object segmentation first, a background subtractionbased on a single intensity-threshold is conducted. Four dif-ferent approaches for an easy and fast background subtractionhave been investigated:
• Bounding box difference image: The given bounding boxis mirrored at the vertical image center axis to createa new bounding box which is assumed to contain onlybackground. The new bounding box image is subtractedfrom the given one and just the object area itself is left.Its advantage is the high possibility to adapt to eachbackground appearance, but in heavy sea with strongwaves, the background is too irregular and some waveareas survive the subtraction as well.
• Bounding box histogram difference: Like in the firstapproach a new bounding box is generated by mirroringthe given one. For both bounding box areas the histogramis calculated. The new bounding box histogram is sub-tracted bin-wise from the given one and the first bin ofthe difference histogram containing enough elements istaken as gray-value threshold. This way, the backgroundappearance is not a problem anymore, but specific effectslike an unequal distribution of sea and sky in the bothbounding-boxes can affect the background subtractionnegatively.
• Image histogram difference: The histograms of thebounding box and the whole image are created. After thewhole image histogram has been downscaled bin-wise byusing one experimentally determined scale-factor, againthe histogram difference is calculated and the first bincontaining enough elements is taken as threshold. Thisapproach is more robust against unequal distributions ofsea and sky.
• Row-wise image histogram difference: Row-wise appli-cation of the same approach as described for imagehistogram difference right before. This can be performedeither in parallel to the horizontal image coordinateaxis or to the horizon. Hence, we receive one gray-value threshold per row, which is more robust againstbackground irregularities. On the other hand we need avery precise horizon estimation in order to avoid severe

Fig. 4. Some examples for the segmentation with image histogram difference.
segmentation mistakes in some rows, where sea and skymerge.
During the evaluation with some experiments, it has beenshown, that the image histogram difference performs best.Some examples are presented in Fig. 4.
2) Feature calculation: Without any special considerationor expectation towards the given data, a huge, but very gen-eralized set of features was implemented. With the adjectivegeneralized, we want to emphasize, that no prior knowledgeabout the target class “suspicious boats” like contour, edgeconstellation, expected texture, scaling, distance, size, direc-tion, etc. was used. This way we want to avoid specializationand to pay attention to heavy variations of boat appearance,image quality, and environmental conditions. The resultingfeature vector had a dimensionality of 342 before the eval-uation. To keep track of this complexity, the features weredivided in several feature classes. The vector is created simplyby concatenating all calculated features. An overview of thechosen feature classes is shown in Fig. 5 and a description ofeach class is given in the following:
• Invariant moments: Hu moments [16][17] are calculatedon the bounding box image both with and without back-ground subtraction.
• Co-occurrence matrices: According to [18], the gray-tone spatial-dependence matrices (co-occurrence matri-ces) for the bounding box image are calculated andfeatures extracted like variance, contrast, entropy, sumvariance, sum difference.
• Texture analysis: Mainly the same features like for theco-occurrence matrices are extracted, but directly on thegray-value bounding box image.
• Kernel analysis: After background subtraction, the ob-ject blob (kernel) is compared to its surrounding area(frame). Some area next to the object blob is not consid-ered in order to avoid merging effects. Feature extractionconsists of calculating relations between the kernel andthe frame like means difference, means ratio, variancesdifference, variances ratio.
• Row analysis: For each single row, data like gray-valuemean, variance and standard deviation are computed.Features are created e.g. by comparing this data row-wiseor by grouping it together to calculate ratios between theupper and lower half of the bounding box for example.This way, the vertical spatial information of the featuresis kept alive.
• Blob analysis: After background subtraction it is as-sumed that only the object blob is left. This object blob
invariantmoments
...
co-occur.matrices
textureanalysis
kernelanalysis
gradientanalysis
kernelframe
relationskernel <=> frame
texture
co-occ. matrix
Hu moments
mean, variance,contrast, correlation,
entropy, power, ...
absolute / oriented gradients+
histogram ofmax oriented
gradients
blobanalysis
LBPanalysis
blobmean, variance,centroid, central
moments, ...
LBP image
statisticalevaluation
rowanalysisimage row histogram
meansmediansvariances
mean, variance,contrast, correlation,
entropy, power, ...
LBP histogram
Fig. 5. Overview of the feature extraction process and the feature classes.
is analyzed by calculating its mean, variance, centroid,central moments.
• Gradient analysis: Several filters like Sobel or Normal-ized Gradients of Gaussians [19] have been tested tocreate histograms of oriented gradients (HOGs) as wellas absolute and oriented gradient images of maximumgradients using an absolute threshold, and all gradients.Various statistical histogram-features are extracted anda texture analysis directly on the gradient images isconducted.
• Local Binary Pattern analysis: We follow the investi-gations of T. Ojala [20] to create circular and “uniform”Local Binary Pattern (LBPs). Feature extraction containsvarious statistical features of LBP-histograms as well asa texture analysis directly on the LBP-image.
Row analysis, invariant moments, gradient analysis and LBPanalysis are performed on both with and without backgroundsubtraction. The resulting feature vector containing 342features is now to be evaluated.
3) Feature evaluation: The feature evaluation aims to findthe features with best separability and to discard featureswith weak separability in order to reduce the feature vector’sdimensionality. This way, the calculation becomes faster, asnot all features have to be extracted, and the upcomingclassification becomes faster as well, as the input-vector isof lower dimensionality.
At first, the features need to be normalized. Thus, theirinfluence towards the classification task is equalized and thedomination of few features with high value range is avoided.Normalization is performed by using standard deviation ofeach feature. Only the positive samples are used for normaliza-tion in order to create a model of the target object’s expectedvalue range.
For evaluation we use a linear discriminant analysis (LDA)to figure out the features with highest variance for the given la-
features classes feature vectors 2-stage-classification result
class 2:irrel. objects
class 3:susp. boats
stage 1
stage 2
co-occurrence matrices
invariant moments
kernel analysis
blob analysis
row analysis
gradient analysis
LBP analysis
texture analysis
class 1:clutter
SVM 2
stage 2
SVM 1
stage 1
object
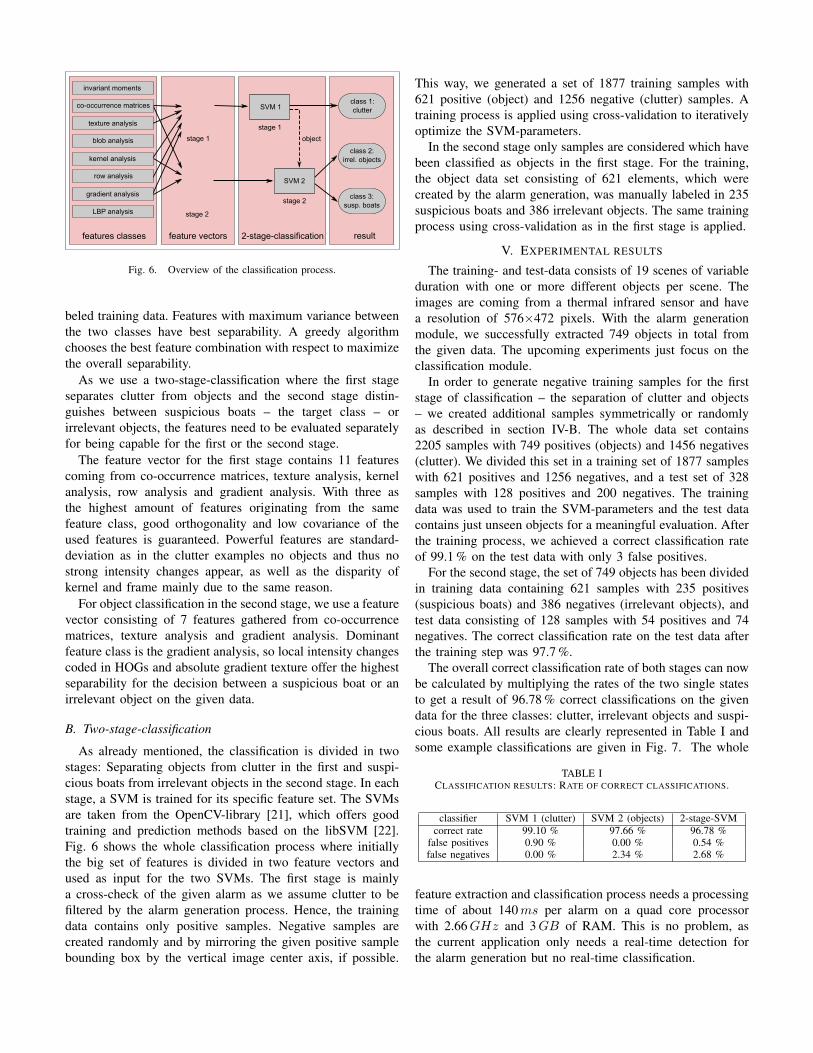
Fig. 6. Overview of the classification process.
beled training data. Features with maximum variance betweenthe two classes have best separability. A greedy algorithmchooses the best feature combination with respect to maximizethe overall separability.
As we use a two-stage-classification where the first stageseparates clutter from objects and the second stage distin-guishes between suspicious boats – the target class – orirrelevant objects, the features need to be evaluated separatelyfor being capable for the first or the second stage.
The feature vector for the first stage contains 11 featurescoming from co-occurrence matrices, texture analysis, kernelanalysis, row analysis and gradient analysis. With three asthe highest amount of features originating from the samefeature class, good orthogonality and low covariance of theused features is guaranteed. Powerful features are standard-deviation as in the clutter examples no objects and thus nostrong intensity changes appear, as well as the disparity ofkernel and frame mainly due to the same reason.
For object classification in the second stage, we use a featurevector consisting of 7 features gathered from co-occurrencematrices, texture analysis and gradient analysis. Dominantfeature class is the gradient analysis, so local intensity changescoded in HOGs and absolute gradient texture offer the highestseparability for the decision between a suspicious boat or anirrelevant object on the given data.
B. Two-stage-classification
As already mentioned, the classification is divided in twostages: Separating objects from clutter in the first and suspi-cious boats from irrelevant objects in the second stage. In eachstage, a SVM is trained for its specific feature set. The SVMsare taken from the OpenCV-library [21], which offers goodtraining and prediction methods based on the libSVM [22].Fig. 6 shows the whole classification process where initiallythe big set of features is divided in two feature vectors andused as input for the two SVMs. The first stage is mainlya cross-check of the given alarm as we assume clutter to befiltered by the alarm generation process. Hence, the trainingdata contains only positive samples. Negative samples arecreated randomly and by mirroring the given positive samplebounding box by the vertical image center axis, if possible.
This way, we generated a set of 1877 training samples with621 positive (object) and 1256 negative (clutter) samples. Atraining process is applied using cross-validation to iterativelyoptimize the SVM-parameters.
In the second stage only samples are considered which havebeen classified as objects in the first stage. For the training,the object data set consisting of 621 elements, which werecreated by the alarm generation, was manually labeled in 235suspicious boats and 386 irrelevant objects. The same trainingprocess using cross-validation as in the first stage is applied.
V. EXPERIMENTAL RESULTS
The training- and test-data consists of 19 scenes of variableduration with one or more different objects per scene. Theimages are coming from a thermal infrared sensor and havea resolution of 576×472 pixels. With the alarm generationmodule, we successfully extracted 749 objects in total fromthe given data. The upcoming experiments just focus on theclassification module.
In order to generate negative training samples for the firststage of classification – the separation of clutter and objects– we created additional samples symmetrically or randomlyas described in section IV-B. The whole data set contains2205 samples with 749 positives (objects) and 1456 negatives(clutter). We divided this set in a training set of 1877 sampleswith 621 positives and 1256 negatives, and a test set of 328samples with 128 positives and 200 negatives. The trainingdata was used to train the SVM-parameters and the test datacontains just unseen objects for a meaningful evaluation. Afterthe training process, we achieved a correct classification rateof 99.1 % on the test data with only 3 false positives.
For the second stage, the set of 749 objects has been dividedin training data containing 621 samples with 235 positives(suspicious boats) and 386 negatives (irrelevant objects), andtest data consisting of 128 samples with 54 positives and 74negatives. The correct classification rate on the test data afterthe training step was 97.7 %.
The overall correct classification rate of both stages can nowbe calculated by multiplying the rates of the two single statesto get a result of 96.78 % correct classifications on the givendata for the three classes: clutter, irrelevant objects and suspi-cious boats. All results are clearly represented in Table I andsome example classifications are given in Fig. 7. The whole
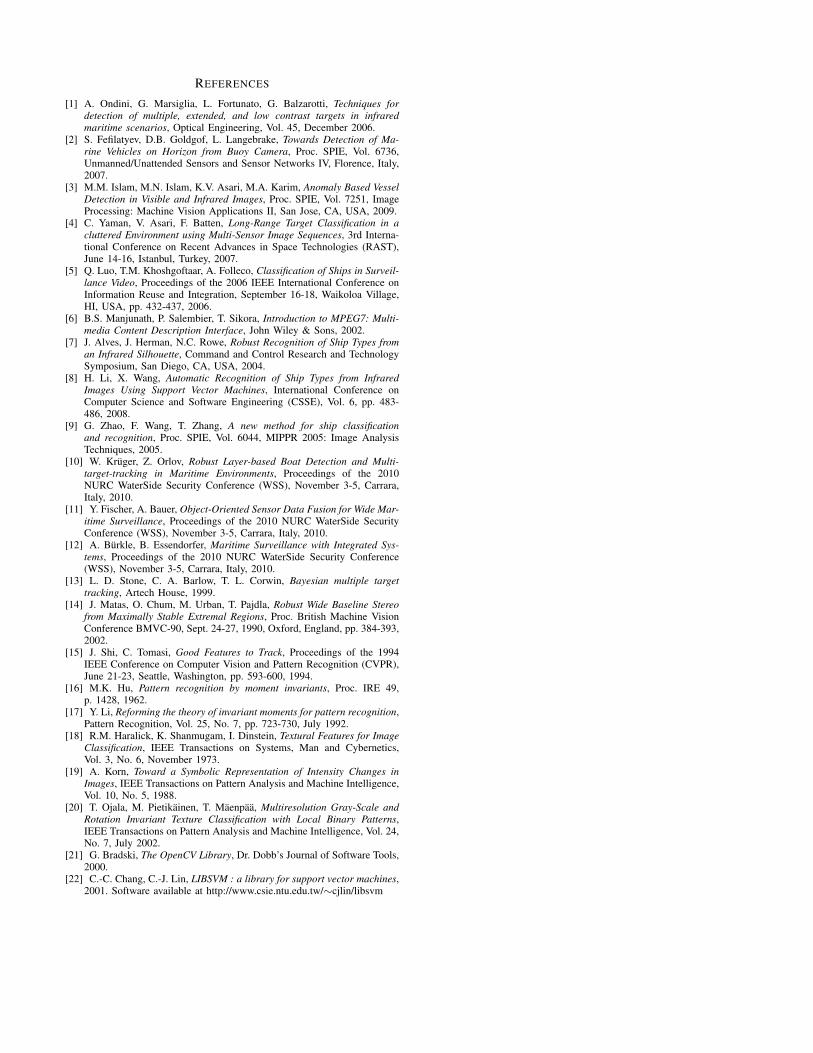
TABLE ICLASSIFICATION RESULTS: RATE OF CORRECT CLASSIFICATIONS.
classifier SVM 1 (clutter) SVM 2 (objects) 2-stage-SVMcorrect rate 99.10 % 97.66 % 96.78 %
false positives 0.90 % 0.00 % 0.54 %false negatives 0.00 % 2.34 % 2.68 %
feature extraction and classification process needs a processingtime of about 140 ms per alarm on a quad core processorwith 2.66 GHz and 3 GB of RAM. This is no problem, asthe current application only needs a real-time detection forthe alarm generation but no real-time classification.

small boat, few people small boat, many people small boat, many people
small boat, higher distance small boat, partly occluded
small boat, rotated
irrelevant object: buoy
irrelevant object: big boatirrelevant object: big boatirrelevant object: big shipirrelevant object: big ship
irrelevant object: buoy
clutter in waves clutter at horizon clutter at horizon clutter at horizon
Fig. 7. Correct classification examples. Suspicious boats in red, irrelevant objects in yellow and clutter in green.
VI. CONCLUSION AND FUTURE WORKS
In this work, we presented an image exploitation approachto detect, verify and classify maritime objects in order toidentify small boats, which are often used for criminalactivities. Three different detection methods have beenfused for high robustness and checked for spatio-temporalstability of the detection results to generate reliable alarmsfor maritime objects. These alarms are used to extractadditional features for a two-stage-classification with SVMsfor separating clutter and objects in the first as well asirrelevant objects and suspicious boats in the second stage.We achieved a very promising correct classification rate ofabout 97 % on the currently available data.
Future works will include recording and creating more
training and test data including ground-truth of the object’sdistance, velocity and direction. This way, we will be able toestimate the distance range for reliable alarms and classifica-tions.
Another topic is the usage of temporal information for theclassification process. With a tightly coupled object trackingand classification, temporal and reliable physical features canbe extracted and evaluated for their applicability towards thepresented classification task.
ACKNOWLEDGMENT
This work has been done in cooperation with CarlZeiss Optronics GmbH and was supported with fundsfrom the European Community’s Seventh Framework Pro-gramme (FP7/2007-2013) under grant agreement No. SP1-Cooperation-218290.
REFERENCES
[1] A. Ondini, G. Marsiglia, L. Fortunato, G. Balzarotti, Techniques fordetection of multiple, extended, and low contrast targets in infraredmaritime scenarios, Optical Engineering, Vol. 45, December 2006.
[2] S. Fefilatyev, D.B. Goldgof, L. Langebrake, Towards Detection of Ma-rine Vehicles on Horizon from Buoy Camera, Proc. SPIE, Vol. 6736,Unmanned/Unattended Sensors and Sensor Networks IV, Florence, Italy,2007.
[3] M.M. Islam, M.N. Islam, K.V. Asari, M.A. Karim, Anomaly Based VesselDetection in Visible and Infrared Images, Proc. SPIE, Vol. 7251, ImageProcessing: Machine Vision Applications II, San Jose, CA, USA, 2009.
[4] C. Yaman, V. Asari, F. Batten, Long-Range Target Classification in acluttered Environment using Multi-Sensor Image Sequences, 3rd Interna-tional Conference on Recent Advances in Space Technologies (RAST),June 14-16, Istanbul, Turkey, 2007.
[5] Q. Luo, T.M. Khoshgoftaar, A. Folleco, Classification of Ships in Surveil-lance Video, Proceedings of the 2006 IEEE International Conference onInformation Reuse and Integration, September 16-18, Waikoloa Village,HI, USA, pp. 432-437, 2006.
[6] B.S. Manjunath, P. Salembier, T. Sikora, Introduction to MPEG7: Multi-media Content Description Interface, John Wiley & Sons, 2002.
[7] J. Alves, J. Herman, N.C. Rowe, Robust Recognition of Ship Types froman Infrared Silhouette, Command and Control Research and TechnologySymposium, San Diego, CA, USA, 2004.
[8] H. Li, X. Wang, Automatic Recognition of Ship Types from InfraredImages Using Support Vector Machines, International Conference onComputer Science and Software Engineering (CSSE), Vol. 6, pp. 483-486, 2008.
[9] G. Zhao, F. Wang, T. Zhang, A new method for ship classificationand recognition, Proc. SPIE, Vol. 6044, MIPPR 2005: Image AnalysisTechniques, 2005.
[10] W. Kruger, Z. Orlov, Robust Layer-based Boat Detection and Multi-target-tracking in Maritime Environments, Proceedings of the 2010NURC WaterSide Security Conference (WSS), November 3-5, Carrara,Italy, 2010.
[11] Y. Fischer, A. Bauer, Object-Oriented Sensor Data Fusion for Wide Mar-itime Surveillance, Proceedings of the 2010 NURC WaterSide SecurityConference (WSS), November 3-5, Carrara, Italy, 2010.
[12] A. Burkle, B. Essendorfer, Maritime Surveillance with Integrated Sys-tems, Proceedings of the 2010 NURC WaterSide Security Conference(WSS), November 3-5, Carrara, Italy, 2010.
[13] L. D. Stone, C. A. Barlow, T. L. Corwin, Bayesian multiple targettracking, Artech House, 1999.
[14] J. Matas, O. Chum, M. Urban, T. Pajdla, Robust Wide Baseline Stereofrom Maximally Stable Extremal Regions, Proc. British Machine VisionConference BMVC-90, Sept. 24-27, 1990, Oxford, England, pp. 384-393,2002.
[15] J. Shi, C. Tomasi, Good Features to Track, Proceedings of the 1994IEEE Conference on Computer Vision and Pattern Recognition (CVPR),June 21-23, Seattle, Washington, pp. 593-600, 1994.
[16] M.K. Hu, Pattern recognition by moment invariants, Proc. IRE 49,p. 1428, 1962.
[17] Y. Li, Reforming the theory of invariant moments for pattern recognition,Pattern Recognition, Vol. 25, No. 7, pp. 723-730, July 1992.
[18] R.M. Haralick, K. Shanmugam, I. Dinstein, Textural Features for ImageClassification, IEEE Transactions on Systems, Man and Cybernetics,Vol. 3, No. 6, November 1973.
[19] A. Korn, Toward a Symbolic Representation of Intensity Changes inImages, IEEE Transactions on Pattern Analysis and Machine Intelligence,Vol. 10, No. 5, 1988.
[20] T. Ojala, M. Pietikainen, T. Maenpaa, Multiresolution Gray-Scale andRotation Invariant Texture Classification with Local Binary Patterns,IEEE Transactions on Pattern Analysis and Machine Intelligence, Vol. 24,No. 7, July 2002.
[21] G. Bradski, The OpenCV Library, Dr. Dobb’s Journal of Software Tools,2000.
[22] C.-C. Chang, C.-J. Lin, LIBSVM : a library for support vector machines,2001. Software available at http://www.csie.ntu.edu.tw/∼cjlin/libsvm

Year:2010
Author(s):Teutsch, M.; Krüger, W.
Title:Classification of small boats in infrared images for maritime surveillance
DOI: 10.1109/WSSC.2010.5730289 (http://dx.doi.org/10.1109/WSSC.2010.5730289)
© 2010 IEEE. Personal use of this material is permitted. However, permission to reprint/republish this material for advertising or promotional purposes or for creating new collective works for resale or redistribution to servers or lists, or to reuse any copyrighted component of this work in other works must be obtained from the IEEE.
Details:Institute of Electrical and Electronics Engineers -IEEE-:WaterSide Security. 2nd International Conference WSS 2010 : 3-5 november 2010, Marina di Carrara, ItalyNew York, NY: IEEE, 2010ISBN: 978-1-4244-8894-0ISBN: 1-4244-8894-X7 pp.