classification of peterson & barney's vowels using weka
TRANSCRIPT

See discussions, stats, and author profiles for this publication at: https://www.researchgate.net/publication/2488601
Classification of Peterson & Barney's vowels using Weka
Article · March 2002
Source: CiteSeer
CITATIONS
11READS
239
1 author:
Some of the authors of this publication are also working on these related projects:
Structural Health Monitoring View project
ata Mining Applied to the Electric Power Industry View project
Aldebaro Klautau
Federal University of Pará
178 PUBLICATIONS 2,127 CITATIONS
SEE PROFILE
All content following this page was uploaded by Aldebaro Klautau on 24 January 2014.
The user has requested enhancement of the downloaded file.
Classification of Peterson & Barney's vowels using Weka
Aldebaro KlautauUC San Diego - EBU - ILa Jolla, CA 92093-0407
Email: [email protected] 29, 2002
1. IntroductionGordon Peterson and Harold Barney describe a detailed investigation of sustained
American English vowels in [1]. The article presents acoustic measurements of fundamentalfrequency (F0) and first three formant frequencies (F1-F3). The authors also conductedexperiments where listeners were asked to identify words.
Raymond Watrous [2] re-organized the database collected in [1] and made it temporarilyavailable from University of Pennsylvania. In 1994, Murray Spiegel posted a message oncomp.speech news group1 indicating the database had been made available again, but fromBellcore. Later, Tony Robinson made it permanently available from Cambridge University2. Nowthe database, formatted for Weka [3], is also available from [4]. It is called the pbvowel databasebecause Robison has made available another database that is usually identified as vowel in [5].
The vowel database consists of eleven sustained vowels of British English collected byDavid Deterding and represented by log-area ratio (LAR) parameters. When using the standardpartitions into test and train sets3, the error rates for the vowel database are usually higher (aroundtwice) than for pbvowel. Besides being based on different English accents, the vowel and pbvoweldatabases were not obtained through the same experimental procedures. Also, formants can beseen as a more efficient representation of vowels than LAR parameters. LAR is a well-known,but outdated parameterization of speech [6]. In speech coding the LARs were substituted by theline spectral frequencies [7] and in speech recognition, parameters obtained through cepstrumanalysis are more popular [8].
The motivations for writing this report about pbvowel were:- it has been used by several researchers (e.g. [9], [10], [11]) but their results can not be easily
compared due to the lack of a standard experimental procedure;- the open-source Weka machine learning package [3] provides implementations of several
classical pattern recognition techniques. The command lines for Weka are provided here, sothe reported results can be easily reproduced;
- the conventional nomenclature for formants (F1, F2 and F3) and fundamental frequency (F0)is confusing. Some publications mistakenly mention that pbvowel contains four formants (e.g.[11], [2]). It seems important to present their definitions and emphasize the distinctionbetween F0 and formants;
- [1] completes 50 years in 2002 and deserves a celebration!
1 This group was later split in comp.speech.users and comp.speech.research.2 The file is called PetersonBarney.tar.Z and is available at ftp://svr-ftp.eng.cam.ac.uk/pub/comp.speech/data/.3 The error rate when using n-fold cross-validation is usually considerably smaller.

This report is organized as follows. Section 2 presents a brief description of the conceptsof formants and fundamental frequency, the numerical attributes of the pbvowel database. Section3 reviews the work reported in [1]. A partition of the database is presented in section 4. Theresults of vowel classification using Weka are reported in section 5. Section 6 shows some plotsobtained considering only the first two formants. The final considerations are in section 7.
2. Speech formants and fundamental frequencyIn the Fifties, Gunnar Fant made significant contributions to the development of an
acoustic theory of speech where the speech wave is seen as the response of the vocal tract filtersystems to one or more sound sources. This is the basic principle of the so-called source-filtermodel of the speech production process. A detailed description of this model can be found in[12]. Given the scope of pbvowel, it suffices to consider here only the production of vowels.
Fundamental frequency (F0):When a vowel is produced, the vocal cords vibrate on a rate called fundamental frequency
or F0. In practice, F0 is not exactly the same over time but varies intentionally or unintentionally(machines can produce a monotonic F0 though). The average F0 values of children are higherthan of adults, and women have higher F0 than men, as can be inferred from pbvowel. F0 is aparameter related to the source (as discussed later, the formants are related to the filter).
The pitch frequency is closely related to F0 and in many cases these terms are usedinterchangeably. In more strict terminology, pitch is a tonal sensation and frequency a property ofthe sound stimulus [12]. It is not an easy task to estimate F0, but it is harder to quantify thesubjective sensation of pitch. The mel scale [13], which is popular in speech recognition, is anattempt to relate frequency and pitch.
The method used for estimating F0 in [1] is not discussed by the authors (neither in thecompanion paper [14]).
Formants:The main articulators involved in vowel production are tongue and lips. Depending on
their configuration the vocal tract imposes different shapes to the resultant speech spectrum. Thesource-filter model assumes the source spectrum S(f) is modified by the filter (vocal tract)function T(f), leading to a speech spectrum P(f) = S(f) T(f). For vowels, S(f) is basically composedby harmonics of F0. The speech formants can be defined either as the peaks of |S(f)| or |T(f)|,which generates some confusion. From [12] (page 20):
"The spectral peaks of the sound spectrum |P(f)| are called formants. (…) it may be seen that onesuch resonance has its counterpart in a frequency region of relatively effective transmissionthrough the vocal tract. This selective property of |T(f)| is independent of the source. Thefrequency location of a maximum in |T(f)|, i.e., the resonance frequency, is very close to thecorresponding maximum in spectrum P(f) of the complete sound. Conceptually these should beheld apart but in most instances resonance frequency and formant frequency may be usedsynonymously. Thus, for technical applications dealing with voiced sounds it is profitable todefine formant frequency as a property of T(f)."

Modern textbooks4 define formants as the resonance frequencies associated to T(f) [16](page 18), [8] (page 27). As pointed out by Fant, this definition is sensible because eliminates theinfluence of the source characteristics, which are speaker-dependent (e.g. different people say thesame vowel with potentially different values of F0). On the other hand, it raises the problem thatresonances of T(f) are sometimes undetermined given that usually only a measure of P(f) isavailable. For example, a person (e.g. child) with high F0 would produce S(f) with harmonics ofF0 highly separated in frequency, so the peaks of T(f) would be hardly visualized if they were farfrom any harmonic.
There are many techniques for estimating formants. A survey of formant estimationmethods used in the past is given in [17] (page 165). A popular modern approach is to obtainformants from the roots of a filter calculated through linear prediction techniques [6]. Fig. 1 andFig. 2 show spectrograms [6] with formant tracks (F1-F3) superimposed. The first sentence iscomposed basically by vowels and the method gives fairly good results. The sentencecorrespondent to Figure 2 has more phonetic variation (fricatives, nasals, etc.) and the results arenot so good as in Figure 1. In fact, under realistic conditions (noise, etc.), formants estimation is adifficult task.
Time (sec)
Fre
quen
cy (
Hz)
0 0.1 0.2 0.3 0.4 0.5 0.6 0.7 0.8 0.9 10
500
1000
1500
2000
2500
3000
3500
4000
Fig. 1. First three formants F1- F3 estimated from the roots of linear prediction filters of order 8. Thesentence is "We were away" spoken by a male speaker with low F0.
4 Kenneth Stevens observes that the concept of a formant should be restricted to natural frequencies of the vocal tractwhen there is no coupling to the nasal cavities [15] (page 131).

Fig. 2. First three formants F1-F3 estimated from the roots of linear prediction filters of order 8. The sentenceis "In wage negotiations, the industry bargains as a unit with a single union".
The method for estimating formants used in [1] is described, though not thoroughly, in[14]. It consists of calculating a weighted average of the spectrum components. This approach isknown as "peak-picking" and, as other formant estimation methods, is error prone and usuallyrequires the supervision of an expert for eventual corrections.
3. Peterson & Barney's paper
Data collectionA list of ten words was presented to 76 speakers, each word beginning with [h] and
ending with [d], and differing only in the vowel. The words are listed in Table I. Each speakerwas asked to pronounce two different lists, each list corresponding to a random permutation ofthe 10 words. Therefore, the total number of recorded words was 1520.
The first formant F1 can be related to how far the tongue is raised and F2 to which part ofthe tongue is raised. Therefore, vowels can be organized according to the tongue's position inplots as Fig. 3. Nowadays phoneticians point out that pictorial representations as Fig. 3 should beseen as first-order approximations, given that it is actually possible to produce a vowel with aconfiguration radically different from the one suggested by Fig. 3 [18].

Fig. 3. Relations between formants and tongue's positions. Note that the F1 and F2 axes should have thedirections indicated by Figure 2 in order to provide the picture popular among phoneticians.
The vowels are identified in Fig. 3 by symbols defined in the International PhoneticAlphabet (IPA). The IPA makes extensive use of letters not available on computers. TheARPABET is one of the proposed mappings from IPA to ASCII symbols. The vowels in pbvowelwere labeled according to the two-characters representation of the ARPABET5. Table I shows thewords and correspondent vowels. More details about these phonetic symbols can be found in [18](page 29).
Table I - Words used in [1] and the correspondent vowels. The actual sounds can be heard at [20]. The IPAdiacr itic � indicates the vowel has longer duration and the " hook" diacr itic � indicates the vowel � is
influenced (" colored" ) by [r ].
Word usedin [1]
IPAsymbol forthe vowel
Moredetailed IPAtranscription
ARPABETsymbol
Example incontext /h_/
Example incontext/b_d/
Example incontext/h_t/
Example incontext/k_d/
heed � ��� IY he bead heat keyed
hid � � IH − bid hit kid
head � � EH − bed − −had � � AE − bad hat cad
hod � AA − bod hot cod
hawed �� AO haw bawd − cawed
hood � � UH − − − could
who'd �� UW who booed hoot cooed
hud � � AH − bud hut cud
heard � � � � ER her bird hurt curd
5 An on-line version of the ARPABET can be found at [19].
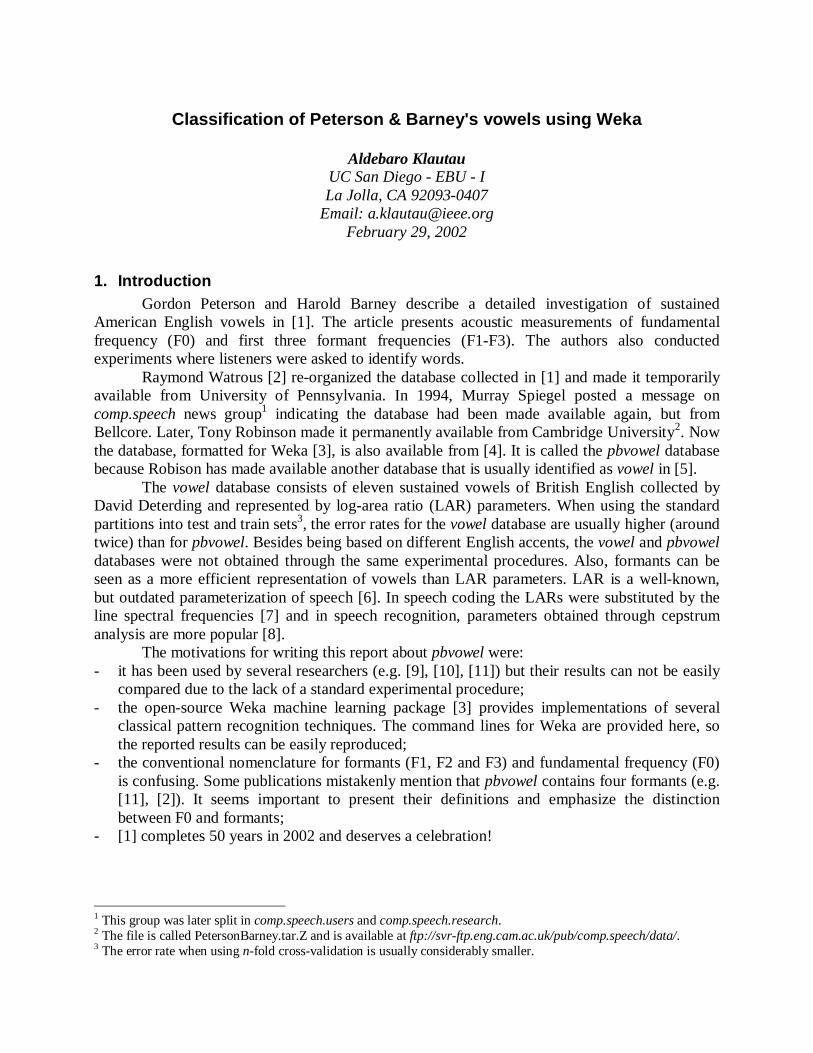
Listening testsThe 1,520 recorded words were presented to a group of 70 adult observers. Thirty-two of
the 76 speakers were also among the observers. The experiment was conducted in seven sessions.The general purpose of these tests was to obtain an aural classification of each vowel. Eachobserver would mark the word he heard. For each vowel, all correspondent 152 words werepresented to the observers. The ease with which the observers classified the various vowelsvaried significantly. Of all IY sounds, for instance, 143 were unanimously classified by allobservers as IY. On the other hand, only 9 when the intended vowel was AA. This result issummarized in Fig. 4. From [1]: "The very low scores of AA and AO result primarily from the factthat some members of the speaking group and many members of the listening group speak one ofthe forms of American dialects in which AA and AO are not differentiated."
% recognized unanimously by 70 listeners
94.08
48.68
34.21
75.66
5.92
22.37
50.00
71.71
50.00
90.79
0.0010.0020.0030.0040.0050.0060.0070.0080.0090.00
100.00
IY IH EH AE AA AO UH UW AH ER
Fig. 4. The percentage unanimously identified by all 70 listeners of 152 repetitions for each vowel.
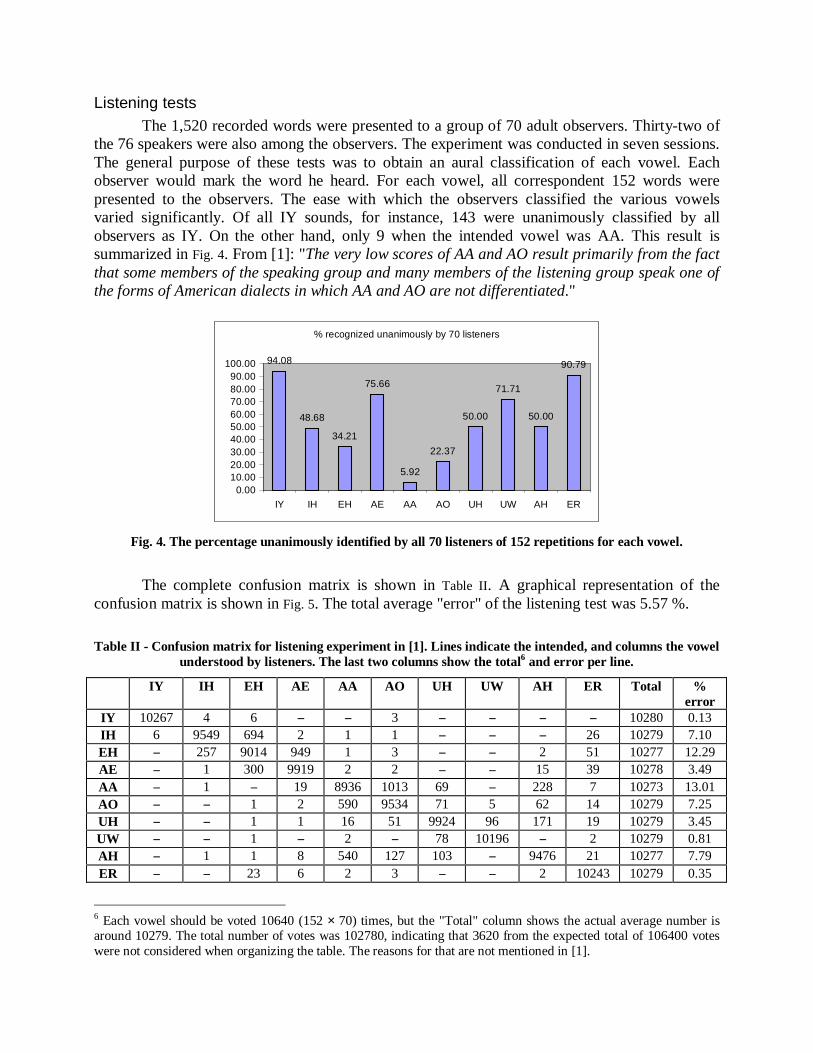
The complete confusion matrix is shown in Table II. A graphical representation of theconfusion matrix is shown in Fig. 5. The total average "error" of the listening test was 5.57 %.
Table II - Confusion matrix for listening experiment in [1]. Lines indicate the intended, and columns the vowelunderstood by listeners. The last two columns show the total6 and error per line.
IY IH EH AE AA AO UH UW AH ER Total %error
IY 10267 4 6 − − 3 − − − − 10280 0.13IH 6 9549 694 2 1 1 − − − 26 10279 7.10EH − 257 9014 949 1 3 − − 2 51 10277 12.29AE − 1 300 9919 2 2 − − 15 39 10278 3.49AA − 1 − 19 8936 1013 69 − 228 7 10273 13.01AO − − 1 2 590 9534 71 5 62 14 10279 7.25UH − − 1 1 16 51 9924 96 171 19 10279 3.45UW − − 1 − 2 − 78 10196 − 2 10279 0.81AH − 1 1 8 540 127 103 − 9476 21 10277 7.79ER − − 23 6 2 3 − − 2 10243 10279 0.35
6 Each vowel should be voted 10640 (152 × 70) times, but the "Total" column shows the actual average number isaround 10279. The total number of votes was 102780, indicating that 3620 from the expected total of 106400 voteswere not considered when organizing the table. The reasons for that are not mentioned in [1].

Some instances in pbvowel are labeled as being unanimously classified by all observers. Itshould be noticed that the documentation available with the pbvowel version distributed byCambridge University mentions only 26 observers, while 70 were reported in [1]. In fact, thestatistics of the vowels in pbvowel that were labeled as unanimously classified does not match theresults in [1]. In pbvowel, only 321 vowels were labeled as not unanimously identified byobservers. The reason for this discrepancy on the number of observers is unknown.
Fig. 5. Graphical representation of the confusion matrix for the listening test in [1]. The columns indicate therecognized vowel. The radii are proportional to the entries in Table II. The last column illustrates the
difficulty on recognizing each vowel.
Acoustic measurementsBesides F0 and three formants, the formant amplitudes in dB were also reported in [1],
but are missing in pbvowel. The statistics for F0 and formants F1-F3 are listed in Table III.
Table III- Statistics of the numerical attributes in pbvowel: minimum, maximum, average and standarddeviation for all 1,520 instances.
Min Max Average StdF0 91 350 191.29 60.36F1 190 1300 563.30 201.25F2 560 3610 1624.38 637.01F3 1400 4380 2707.81 519.45
4. Partitioning the databaseThe attributes for the version of pbvowel distributed by [5] are listed in Table IV. In
classification experiments, the attributes speaker_number and confidence should not be used.A partition of pbvowel into four subsets based on the speaker identity is presented in this
section. All subsets have 19 speakers, corresponding approximately to the same number of males,females and children. An open test set framework is adopted, i.e., speakers in the train do notbelong to the test set. The standard partition is a train set corresponding to the union of A and B

(with C and D corresponding to the test set). Eventually, if a given algorithm demands moretraining data, set C can be used for training and the situation properly reported. Alternatively, setC can be used as a validation set.
Table IV- Attributes of pbvowel.
Attribute name Typegender_age nominal: {male, female, child}speaker_number numerical, integer ∈ [1, 76]confidence nominal: {low, high}F0 numerical, integerF1 numerical, integerF2 numerical, integerF3 numerical, integervowel nominal: {IY,IH,EH,AE,AA,AO,UH,UW,AH,ER}
Table V- Partition of pbvowel into four disjoint subsets according to speaker identity. All sets have 380 vowels,corresponding to 19 speakers.
Set Males Females ChildrenA 1-8 34-40 62-65B 9-16 41-47 66-69C 17-24 48-54 70-73D 25-33 55-61 74-76
It may be interesting to consider only the instances that were labeled as unanimouslyidentified by the listeners, i.e., those with attribute confidence equal to high. A suffix "u", asshown in Table VI, identifies the corresponding subsets. The training set composed by A_u andB_u contains 599 instances, while the test set (C_u and D_u) contains 600. The distribution ofvowels is not uniform when considering only the ones unanimously identified.
Table VI- Number of vowels unanimously identified by listeners in each set in Table V.
Set A_u B_u C_u D_u# of vowels 289 310 295 305
Table VII- Identifiers for simulations using different combinations of the attributes in pbvowel.
Identifier Used attributes (besides the vowel)gF0-3 gender_age, F0, F1, F2, F3F0-3 F0, F1, F2, F3F1-3 F1, F2, F3F1-2 F1, F2u (as prefix, e.g., uF0-F3) only instances with confidence equal to high
This report presents simulations with different combinations of the attributes in pbvowel.Table VII summarizes these combinations. For example, a simulation identified by uF1-3 uses atrain set composed by instances for which confidence is high, and discarding attributesgender_age, speaker_number, confidence and F0.

5. Classification using WekaThis section presents results obtained with Weka, version 3.2. Weka can be obtained at
[3] and the source code in Java is also available. Table VIII shows results obtained with 20different classifiers, for 5 different combinations of attributes as described in Table VII. Thecommand lines for reproducing these results are given in the Appendix. The best results in TableVIII are also the best in the literature that the author is aware of. However, some classifiers werenot tuned, as Table VIII was designed to serve simply as basis for comparisons. For example, thedefault in Weka's multilayer perceptron is a number of units in the hidden layer given by theaverage between the number of attributes and classes (e.g., (4+10)/2 = 7 units for the first columnF0-3). Tuning the network topology leads to improvements. However, it is questionable to usethe test set to validate parameters, i.e., choosing the parameters that lead to the best results for thetest set, implies the performance on this set does not necessarily indicate the generalizationcapability of the classifier. A better approach in this case would be to use set C as a validation setand report results on set D. Here, the default values were used for most classifiers and avalidation set was not adopted.
It can be seen from Table VIII that the extra attribute gender_age in ugF0-3 does notbring better results when compared to uF0-3. In fact, as discussed in section 2, F0 alone does notbring information about vowel identity. However, F0 is related to attribute gender_age. Giventhat vowels (and consequently F1-F3) vary depending if the speaker is a man, woman or child,F0 or gender_age can improve classification accuracy if the classifier effectively uses thisinformation. For classifiers as Naïve Bayes, which assumes independence among attributes giventhe class, F0 and gender_age do not help.
For an easier visualization, the results of Table VIII are also shown in Fig. 6. The reader isrefereed to the Weka documentation for an explanation of acronyms as ECOC (error-correctingoutput code), etc.

Table VIII - Misclassification rate for 20 classifiers designed with Weka. The columns are labeled according toTable VII. The best result for each data set is indicated in bold.
# Algorithm and configuration F0-3 ugF0-3 uF0-3 uF1-3 uF1-21 Naïve Bayes - simpler implementation 24.74 21.33 21.00 21.33 26.832 Naïve Bayes 24.60 21.17 21.50 22.00 27.173 Naïve Bayes with kernel estimation 22.10 19.00 17.83 19.50 25.004 Kernel density estimator 17.37 13.50 13.17 13.33 18.675 K-nearest neighbor with K = 5 16.58 13.50 13.17 14.33 21.506 K-nearest neighbor with entropic distance (KStar) 16.84 11.83 12.33 12.67 18.337 Multilayer perceptron 13.42 12.83 9.83 15.50 19.678 C4.5 decision tree with reduced error pruning 23.29 20.5 21.5 19.83 27.839 Bagging 10 iterations using C4.5 with reduced error
pruning19.08 14.67 14.33 16.00 20.33
10 Bagging 50 iterations using C4.5 with reduced errorpruning
17.89 14.33 14.67 17.83 22.00
11 AdaBoost M1 using C4.5 without reduced errorpruning
16.05 14.33 14.00 16.17 29.50
12 AdaBoost M1 using C4.5 with reduced error pruning 18.29 17.50 16.83 19.17 26.8313 Boosted stumps with LogitBoost 20.00 18.33 18.50 19.50 24.1714 10 binary classifiers (one-against-all): SVM with
polynomial kernel of order 515.92 11.17 11.50 17.17 28.83
15 10 binary classifiers (one-against-all): 50 iterations ofAdaBoost using stumps
19.34 16.50 17.83 19.50 27.83
16 10 binary classifiers (one-against-all): 50 iterations ofLogitBoost using stumps
19.60 15.83 15.67 18.67 23.50
17 10 binary classifiers (one-against-all): multilayerperceptron
12.89 10.50 10.33 11.00 21.17
18 20 binary classifiers (random code): multilayerperceptron
14.60 11.33 9.83 22.83 30.83
19 20 binary classifiers (random code): 100 iterations ofAdaBoost using stumps
31.58 22.50 22.33 27.83 30.00
20 20 binary classifiers (random code): 10 iterations ofAdaBoost using multilayer perceptrons
12.63 10.00 10.00 11.67 22.33

0 5 10 15 20 25 30 35
1- Naïve Bayes
2- Naïve Bayes
3- Naïve Bayes
4- Kernel estimator
5- KNN
6- KNN
7- ANN
8- C4.5
9- Bagged 10 C4.5
10- Bagged 50 C4.5
11- Boosted C4.5
12- Boosted C4.5
13- LogitBoosted stumps
14- SVM
15- ECOC boosted stumps
16- ECOC boosted stumps
17- ECOC ANN
18- ECOC ANN
19- ECOC boosted stumps
20- ECOC boosted ANN
uF1-2
uF1-3
uF0-3
ugF0-3
F0-3
Fig. 6. Illustration of misclassification rates shown in Table VIII.
Fig. 7 compares the results obtained with the neural network classifier correspondent tonumber 17 in Table VIII with the listening experiments in [1]. The pattern of errors is not exactlythe same, but there are coincidences as, for example, vowels IY and ER are recognized with highaccuracy in both cases. In relative terms, the machine has more troubles with UH, while listenershave with AA.

Fig. 7- Confusion matrices for listening test (Fig. 5) at the left and results with neural network (number 17 inTable VIII) at the right. The columns indicate the recognized vowel. The radii are proportional to the entries.
6. Visualization of results on F1 x F2 planeAs shown in this section, illustrative plots can be obtained when using only the first two
formants. The figures in this section use color for an easier visualization.Fig. 8 shows the instances used for training and testing the classifiers discussed in this
section (see the appendix for other plots) Note that the regions overlap significantly in the F1 xF2 plane, especially for vowel ER. In spite of being perceptually less important than F1 and F2,the third formant F3 is useful for distinguishing ER from the others. In fact, according to Table II,ER can be easily recognized by listeners.
Fig. 8. Plot of all instances for which confidence is high (identified unanimously).

iyiy
ihiheh
ae
ahah
aa aauhuhuwuw
er
er
iyiy
ihiheh
aeae
aaaa
aoao
uhuh
uwuw
erer
iyiy
ihih
ehehaeae
ahaa aa
aoao
uhuh
uw
erer
iy
iy
ih
eheh
aeae
ahaa aa
aoaouhuhuw
uw
erer
iyiy
ih
ih eheh aeae
ahah aa
aoao
uhuhuwuw
erer
iyiy
ihiheheh
ae ae
ah
aauhuh
uwuw
erer
iyiy
ih
eh aeae
ah
aa
aoao
uw
erer
iy
ih
ahah
aouhuh
uwuw
erer
iyiy
ihihehehae
ah aa
aoaouhuh
uwuw
erer
iyiy
ihiheheh
aeae
ahah
aaaa
aoao
uhuwuw
erer
iyiy
ihih
aeae
ah
ao
uhuh
uwuw
erer
iyiy
ihih
eheh aeae
aauhuh
uwuw
erer
iy
ihih
eheh
ae ae
ah ah aa
aouhuhuw
erer
iyiy
ihih
ehehaeae
ahah
aaaa
aouhuhuw
uw
erer
iyiy
ih
aeae
ah
aaaa
aoao
uhuh
uwuw
erer
iyiy
ihih
aeae
ah
aoao
uh
uwuw
erer
iyiy
ihih
eheh
aeae
ah
aoao
uh uh
uwuw
er
iyiy
ihih
eh
eh
aeae
ahah
aa
ao
uhuh
uwuw
erer
iy
ihih eh
aeae
ah
aa
ao aouw
erer
iyiy
ihih eh eh
ah
aa aa
aoao
uhuh
uwuw
er er
iyiy
ih eheh
aeae
ah
ah aa
aoao
uw
uw
erer
iyiy
ih eheh
aeae
ah ah
aa
ao
aouh
uwuw
erer
iyiy
ihih
eheh
aeae
ahah
aaaa
aoao
uh
uh
uwuw
erer
iyiy
ihih
eheh
aeae
ah
ahaa
aa
ao ao
uhuw
uw
erer
iyiy
ihih
eh
ae
ae
ahahaa
aouhuh
uwuw
erer
iyiy
ih
ehehae ae
ahah aa
aoaouhuh
uwuw
erer
iyiy
ae
ah
ao
uh
uw
uw
erer
iyiy
ih
iheh
ae
ae
ahah
uhuh
uwuw
er
iy
iy
ih
ah
ah
aaaa
ao
ao
uhuh
uw uw
erer
iy
iy
aeae
aauh
uw uw
er
er
iyiy
ae ae
ahah
aauhuh
uw
erer
iy
iy
ih
eh
aeae
ahaa
aoao
uhuh
uw
uw
erer
iyiy
aeae
ahahaa
aoao
uhuh
uwuw
erer
iy
iy
iheh
eh aeae
ah
ao
uhuh
uw
uw
er
er
F1 (Hz)
F2
(Hz)
C4.5 decision tree. Misclassification error: 27.83%
0 200 400 600 800 1000 1200 1400500
1000
1500
2000
2500
3000
3500
4000
Fig. 9. Decision boundaries obtained with a C4.5 decision tree (number 8 in Table VIII). The colors are thesame as in Fig. 8. The test instances are superimposed with their corresponding colors, such that errors can be
identified.
A decision tree as C4.5 leads to boundaries that are parallel to the axes as shown in Fig. 9.This limitation is clearly problematic in this case. Some classifiers that are capable of arbitrarydecision boundaries as K-nearest neighbor and neural networks led to better results, as shown inFig. 10 and Fig. 11, respectively. Note that the K-nearest neighbor established a non-contiguousregion for ER.

iyiy
ihiheh
ae
ahah
aa aauhuhuwuw
er
er
iyiy
ihiheh
aeae
aaaa
aoao
uhuh
uwuw
erer
iyiy
ihih
ehehaeae
ahaa aa
aoao
uhuh
uw
erer
iy
iy
ih
eheh
aeae
ahaa aa
aoaouhuhuw
uw
erer
iyiy
ih
ih eheh aeae
ahah aa
aoao
uhuhuwuw
erer
iyiy
ihiheheh
ae ae
ah
aauhuh
uwuw
erer
iyiy
ih
eh aeae
ah
aa
aoao
uw
erer
iy
ih
ahah
aouhuh
uwuw
erer
iyiy
ihihehehae
ah aa
aoaouhuh
uwuw
erer
iyiy
ihiheheh
aeae
ahah
aaaa
aoao
uhuwuw
erer
iyiy
ihih
aeae
ah
ao
uhuh
uwuw
erer
iyiy
ihih
eheh aeae
aauhuh
uwuw
erer
iy
ihih
eheh
ae ae
ah ah aa
aouhuhuw
erer
iyiy
ihih
ehehaeae
ahah
aaaa
aouhuhuw
uw
erer
iyiy
ih
aeae
ah
aaaa
aoao
uhuh
uwuw
erer
iyiy
ihih
aeae
ah
aoao
uh
uwuw
erer
iyiy
ihih
eheh
aeae
ah
aoao
uh uh
uwuw
er
iyiy
ihih
eh
eh
aeae
ahah
aa
ao
uhuh
uwuw
erer
iy
ihih eh
aeae
ah
aa
ao aouw
erer
iyiy
ihih eh eh
ah
aa aa
aoao
uhuh
uwuw
er er
iyiy
ih eheh
aeae
ah
ah aa
aoao
uw
uw
erer
iyiy
ih eheh
aeae
ah ah
aa
ao
aouh
uwuw
erer
iyiy
ihih
eheh
aeae
ahah
aaaa
aoao
uh
uh
uwuw
erer
iyiy
ihih
eheh
aeae
ah
ahaa
aa
ao ao
uhuw
uw
erer
iyiy
ihih
eh
ae
ae
ahahaa
aouhuh
uwuw
erer
iyiy
ih
ehehae ae
ahah aa
aoaouhuh
uwuw
erer
iyiy
ae
ah
ao
uh
uw
uw
erer
iyiy
ih
iheh
ae
ae
ahah
uhuh
uwuw
er
iy
iy
ih
ah
ah
aaaa
ao
ao
uhuh
uw uw
erer
iy
iy
aeae
aauh
uw uw
er
er
iyiy
ae ae
ahah
aauhuh
uw
erer
iy
iy
ih
eh
aeae
ahaa
aoao
uhuh
uw
uw
erer
iyiy
aeae
ahahaa
aoao
uhuh
uwuw
erer
iy
iy
iheh
eh aeae
ah
ao
uhuh
uw
uw
er
er
F1 (Hz)
F2
(Hz)
KStar (-B 20 -M a). Misclassification error: 18.33%
0 200 400 600 800 1000 1200 1400500
1000
1500
2000
2500
3000
3500
4000
Fig. 10. Decision boundaries and errors obtained with a K-nearest neighbor classifier (number 6 in TableVIII).
iyiy
ihiheh
ae
ahah
aa aauhuhuwuw
er
er
iyiy
ihiheh
aeae
aaaa
aoao
uhuh
uwuw
erer
iyiy
ihih
ehehaeae
ahaa aa
aoao
uhuh
uw
erer
iy
iy
ih
eheh
aeae
ahaa aa
aoaouhuhuw
uw
erer
iyiy
ih
ih eheh aeae
ahah aa
aoao
uhuhuwuw
erer
iyiy
ihiheheh
ae ae
ah
aauhuh
uwuw
erer
iyiy
ih
eh aeae
ah
aa
aoao
uw
erer
iy
ih
ahah
aouhuh
uwuw
erer
iyiy
ihihehehae
ah aa
aoaouhuh
uwuw
erer
iyiy
ihiheheh
aeae
ahah
aaaa
aoao
uhuwuw
erer
iyiy
ihih
aeae
ah
ao
uhuh
uwuw
erer
iyiy
ihih
eheh aeae
aauhuh
uwuw
erer
iy
ihih
eheh
ae ae
ah ah aa
aouhuhuw
erer
iyiy
ihih
ehehaeae
ahah
aaaa
aouhuhuw
uw
erer
iyiy
ih
aeae
ah
aaaa
aoao
uhuh
uwuw
erer
iyiy
ihih
aeae
ah
aoao
uh
uwuw
erer
iyiy
ihih
eheh
aeae
ah
aoao
uh uh
uwuw
er
iyiy
ihih
eh
eh
aeae
ahah
aa
ao
uhuh
uwuw
erer
iy
ihih eh
aeae
ah
aa
ao aouw
erer
iyiy
ihih eh eh
ah
aa aa
aoao
uhuh
uwuw
er er
iyiy
ih eheh
aeae
ah
ah aa
aoao
uw
uw
erer
iyiy
ih eheh
aeae
ah ah
aa
ao
aouh
uwuw
erer
iyiy
ihih
eheh
aeae
ahah
aaaa
aoao
uh
uh
uwuw
erer
iyiy
ihih
eheh
aeae
ah
ahaa
aa
ao ao
uhuw
uw
erer
iyiy
ihih
eh
ae
ae
ahahaa
aouhuh
uwuw
erer
iyiy
ih
ehehae ae
ahah aa
aoaouhuh
uwuw
erer
iyiy
ae
ah
ao
uh
uw
uw
erer
iyiy
ih
iheh
ae
ae
ahah
uhuh
uwuw
er
iy
iy
ih
ah
ah
aaaa
ao
ao
uhuh
uw uw
erer
iy
iy
aeae
aauh
uw uw
er
er
iyiy
ae ae
ahah
aauhuh
uw
erer
iy
iy
ih
eh
aeae
ahaa
aoao
uhuh
uw
uw
erer
iyiy
aeae
ahahaa
aoao
uhuh
uwuw
erer
iy
iy
iheh
eh aeae
ah
ao
uhuh
uw
uw
er
er
F1 (Hz)
F2
(Hz)
Backpropagation neural network. Misclassification error: 19.67%
0 200 400 600 800 1000 1200 1400500
1000
1500
2000
2500
3000
3500
4000
Fig. 11. Decision boundaries and errors obtained with a multilayer perceptron (number 7 in Table VIII).
Some classifiers, as the implementation of support vector machines (SVM) in Weka, cannot deal with more than two classes. One alternative is to break down the multiclass problem intoseveral binary problems. Fig. 12 shows the results obtained by training 10 binary classifiers usinga one-versus-all methodology [11].

iyiy
ihiheh
ae
ahah
aa aauhuhuwuw
er
er
iyiy
ihiheh
aeae
aaaa
aoao
uhuh
uwuw
erer
iyiy
ihih
ehehaeae
ahaa aa
aoao
uhuh
uw
erer
iy
iy
ih
eheh
aeae
ahaa aa
aoaouhuhuw
uw
erer
iyiy
ih
ih eheh aeae
ahah aa
aoao
uhuhuwuw
erer
iyiy
ihiheheh
ae ae
ah
aauhuh
uwuw
erer
iyiy
ih
eh aeae
ah
aa
aoao
uw
erer
iy
ih
ahah
aouhuh
uwuw
erer
iyiy
ihihehehae
ah aa
aoaouhuh
uwuw
erer
iyiy
ihiheheh
aeae
ahah
aaaa
aoao
uhuwuw
erer
iyiy
ihih
aeae
ah
ao
uhuh
uwuw
erer
iyiy
ihih
eheh aeae
aauhuh
uwuw
erer
iy
ihih
eheh
ae ae
ah ah aa
aouhuhuw
erer
iyiy
ihih
ehehaeae
ahah
aaaa
aouhuhuw
uw
erer
iyiy
ih
aeae
ah
aaaa
aoao
uhuh
uwuw
erer
iyiy
ihih
aeae
ah
aoao
uh
uwuw
erer
iyiy
ihih
eheh
aeae
ah
aoao
uh uh
uwuw
er
iyiy
ihih
eh
eh
aeae
ahah
aa
ao
uhuh
uwuw
erer
iy
ihih eh
aeae
ah
aa
ao aouw
erer
iyiy
ihih eh eh
ah
aa aa
aoao
uhuh
uwuw
er er
iyiy
ih eheh
aeae
ah
ah aa
aoao
uw
uw
erer
iyiy
ih eheh
aeae
ah ah
aa
ao
aouh
uwuw
erer
iyiy
ihih
eheh
aeae
ahah
aaaa
aoao
uh
uh
uwuw
erer
iyiy
ihih
eheh
aeae
ah
ahaa
aa
ao ao
uhuw
uw
erer
iyiy
ihih
eh
ae
ae
ahahaa
aouhuh
uwuw
erer
iyiy
ih
ehehae ae
ahah aa
aoaouhuh
uwuw
erer
iyiy
ae
ah
ao
uh
uw
uw
erer
iyiy
ih
iheh
ae
ae
ahah
uhuh
uwuw
er
iy
iy
ih
ah
ah
aaaa
ao
ao
uhuh
uw uw
erer
iy
iy
aeae
aauh
uw uw
er
er
iyiy
ae ae
ahah
aauhuh
uw
erer
iy
iy
ih
eh
aeae
ahaa
aoao
uhuh
uw
uw
erer
iyiy
aeae
ahahaa
aoao
uhuh
uwuw
erer
iy
iy
iheh
eh aeae
ah
ao
uhuh
uw
uw
er
er
F1 (Hz)
F2
(Hz)
SVM organized as 10 binary classifiers. Misclassification error: 28.83%
0 200 400 600 800 1000 1200 1400500
1000
1500
2000
2500
3000
3500
4000
Fig. 12. Decision boundaries and errors obtained with support vector machines (number 14 in Table VIII).
iyiy
ihiheh
ae
ahah
aa aauhuhuwuw
er
er
iyiy
ihiheh
aeae
aaaa
aoao
uhuh
uwuw
erer
iyiy
ihih
ehehaeae
ahaa aa
aoao
uhuh
uw
erer
iy
iy
ih
eheh
aeae
ahaa aa
aoaouhuhuw
uw
erer
iyiy
ih
ih eheh aeae
ahah aa
aoao
uhuhuwuw
erer
iyiy
ihiheheh
ae ae
ah
aauhuh
uwuw
erer
iyiy
ih
eh aeae
ah
aa
aoao
uw
erer
iy
ih
ahah
aouhuh
uwuw
erer
iyiy
ihihehehae
ah aa
aoaouhuh
uwuw
erer
iyiy
ihiheheh
aeae
ahah
aaaa
aoao
uhuwuw
erer
iyiy
ihih
aeae
ah
ao
uhuh
uwuw
erer
iyiy
ihih
eheh aeae
aauhuh
uwuw
erer
iy
ihih
eheh
ae ae
ah ah aa
aouhuhuw
erer
iyiy
ihih
ehehaeae
ahah
aaaa
aouhuhuw
uw
erer
iyiy
ih
aeae
ah
aaaa
aoao
uhuh
uwuw
erer
iyiy
ihih
aeae
ah
aoao
uh
uwuw
erer
iyiy
ihih
eheh
aeae
ah
aoao
uh uh
uwuw
er
iyiy
ihih
eh
eh
aeae
ahah
aa
ao
uhuh
uwuw
erer
iy
ihih eh
aeae
ah
aa
ao aouw
erer
iyiy
ihih eh eh
ah
aa aa
aoao
uhuh
uwuw
er er
iyiy
ih eheh
aeae
ah
ah aa
aoao
uw
uw
erer
iyiy
ih eheh
aeae
ah ah
aa
ao
aouh
uwuw
erer
iyiy
ihih
eheh
aeae
ahah
aaaa
aoao
uh
uh
uwuw
erer
iyiy
ihih
eheh
aeae
ah
ahaa
aa
ao ao
uhuw
uw
erer
iyiy
ihih
eh
ae
ae
ahahaa
aouhuh
uwuw
erer
iyiy
ih
ehehae ae
ahah aa
aoaouhuh
uwuw
erer
iyiy
ae
ah
ao
uh
uw
uw
erer
iyiy
ih
iheh
ae
ae
ahah
uhuh
uwuw
er
iy
iy
ih
ah
ah
aaaa
ao
ao
uhuh
uw uw
erer
iy
iy
aeae
aauh
uw uw
er
er
iyiy
ae ae
ahah
aauhuh
uw
erer
iy
iy
ih
eh
aeae
ahaa
aoao
uhuh
uw
uw
erer
iyiy
aeae
ahahaa
aoao
uhuh
uwuw
erer
iy
iy
iheh
eh aeae
ah
ao
uhuh
uw
uw
er
er
F1 (Hz)
F2
(Hz)
Bagging 10 C4.5 decision trees. Misclassification error: 20.33%
0 200 400 600 800 1000 1200 1400500
1000
1500
2000
2500
3000
3500
4000
Fig. 13. Decision boundaries and errors obtained by bagging 10 decision trees (number 9 in Table VIII).
Another approach for circumventing limitations of classifiers is to build ensembles withmethods as boosting or bagging. Fig. 13 illustrates how bagging can improve results, obtainingdecision boundaries not as limited as the ones of the basic decision tree in Fig. 9. There is even a

non-contiguous region for ER in Fig. 13, similar to the one suggested by the K-nearest neighbor ofFig. 10, which obtained the best result in terms of classification based only on F1 and F2.
7. ConclusionsThis report reviewed the work described in [1]. The concepts of formants and
fundamental frequency were discussed in order to avoid confusions with the nomenclature F0 andF1-F3. A flexible partition of the database was proposed, such that results obtained by differentresearchers can be easily compared. Results of vowel classification experiments conducted withWeka were presented, with some plots on the F1 x F2 plane to help interpreting results.
References
[1] G. Peterson and H. Barney, "Control methods used in a study of vowels," Journal of the Acoustical Societyof America, vol. 24, pp. 175-184, 1952.
[2] R. L. Watrous, "Current status of Peterson-Barney vowel formant data," Journal of the Acoustical Society ofAmerica, vol. 89, pp. 2459-60, 1991.
[3] E. Frank and e. al, "Weka [http://www.cs.waikato.ac.nz/ml/weka/]," The University of Waikato, 2002.[4] A. Klautau, "http://speech.ucsd.edu/aldebaro/repository," 2002.[5] C. L. Blake and C. J. Merz, "UCI Repository of machine learning databases
[http://www.ics.uci.edu/~mlearn/MLRepository.html]." Irvine, CA: University of California, Department ofInformation and Computer Science, 1998.
[6] L. Rabiner and R. Schafer, Digital Processing of Speech Signals: Prentice-Hall, 1978.[7] A. M. Kondoz, Digital Speech: Coding for Low Bit Rate Communication Systems: John Wiley & Sons,
1994.[8] X. Huang, A. Acero, and H.-W. Hon, Spoken language processing, 1 ed: Prentice-Hall, 2001.[9] R. A. Jacobs, M. I. Jordan, S. J. Nowlan, and G. E. Hinton, "Adaptive Mixture of Local Experts," Neural
Computation, vol. 3, pp. 79-87, 1991.[10] R. S. Shadafan and M. Niranjan, "A dynamic neural network architecture by sequential partitioning of the
input space," Cambridge University, Cambridge May 13 1993.[11] P. Clarkson and P. J. Moreno, "On the use of support vector machines for phonetic classification," presented
at IEEE International Conference on Acoustics, Speech, and Signal Processing, 1999.[12] G. Fant, Acoustic theory of speech production, 1 ed: Mounton & CO, 1960.[13] S. Stevens and J. Volkman, "The relation of pitch to frequency," Journal of Psychology, vol. 53, pp. 329,
1940.[14] R. K. Potter and J. C. Steinberg, "Toward the specification of speech," The Journal of the Acoustical Society
of America, vol. 22, pp. 807-820, 1950.[15] K. N. Stevens, Acoustic Phonetics. Cambridge, Mass.: The MIT Press, 1999.[16] R. Kent and C. Read, The Acoustic Analysis of Speech: Singular, 1992.[17] J. L. Flanagan, Speech Analysis, Synthesis and Perception. New York: Springer, 1972.[18] P. Ladefoged, A Course in Phonetics, 4 ed: Harcourt Brace, 2001.[19] A. Klautau, "ARPABET and the TIMIT alphabet [http://speech.ucsd.edu/aldebaro/papers]," 2001.[20] P. Ladefoged,
"http://hctv.humnet.ucla.edu/departments/linguistics/VowelsandConsonants/course/chapter2/amerenglishvowels.html,"2002.

Appendix - Command lines for Weka
# Algorithm Weka's command line1 Naïve Bayes - simpler implementation weka.classifiers.NaiveBayesSimple2 Naïve Bayes weka.classifiers.NaiveBayes3 Naïve Bayes with kernel estimation weka.classifiers.NaiveBayes -K4 Kernel density estimator weka.classifiers.KernelDensity5 K-nearest neighbor with K = 5 weka.classifiers.IBk -K 5 -W 06 KStar weka.classifiers.kstar.KStar -B 20 -M a7 Multilayer perceptron weka.classifiers.neural.NeuralNetwork -L 0.3 -M 0.2 -N 500 -
V 0 -S 0 -E 20 -H a8 C4.5 decision tree with reduced error pruning weka.classifiers.j48.J48 -R -N 3 -M 29 Bagging 10 iterations using C4.5 with
reduced error pruningweka.classifiers.Bagging -S 1 -I 10 -P 100 -Wweka.classifiers.j48.J48 -- -R -N 3 -M 2
10 Bagging 50 iterations using C4.5 withreduced error pruning
weka.classifiers.Bagging -S 1 -I 50 -P 100 -Wweka.classifiers.j48.J48 -- -R -N 3 -M 2
11 AdaBoost M1 using C4.5 without reducederror pruning
weka.classifiers.AdaBoostM1 -P 100 -I 10 -S 1 -Wweka.classifiers.j48.J48 -- -C 0.25 -M 2
12 AdaBoost M1 using C4.5 with reduced errorpruning (only approximately 4 iterations werecompleted)
weka.classifiers.AdaBoostM1 -P 100 -I 10 -S 1 -Wweka.classifiers.j48.J48 -- -R -N 3 -M 0
13 Boosted stumps with LogitBoost weka.classifiers.LogitBoost -P 100 -I 10 -Wweka.classifiers.DecisionStump --
14 10 binary classifiers (one-against-all): SVMwith polynomial kernel of order 5
weka.classifiers.MultiClassClassifier -E 0 -R 2.0 -Wweka.classifiers.SMO -- -C 1.0 -E 5.0 -A 1000003 -T 0.0010-P 1.0E-12 -O
15 10 binary classifiers (one-against-all): 50iterations of AdaBoost using stumps
weka.classifiers.MultiClassClassifier -E 0 -R 2.0 -Wweka.classifiers.AdaBoostM1 -- -P 100 -I 50 -S 1 -Wweka.classifiers.DecisionStump --
16 10 binary classifiers (one-against-all): 50iterations of LogitBoost using stumps
weka.classifiers.MultiClassClassifier -E 0 -R 2.0 -Wweka.classifiers.LogitBoost -- -P 100 -I 50 -Wweka.classifiers.DecisionStump --
17 10 binary classifiers (one-against-all):multilayer perceptron
weka.classifiers.MultiClassClassifier -E 0 -R 2.0 -Wweka.classifiers.neural.NeuralNetwork -- -L 0.3 -M 0.2 -N500 -V 0 -S 0 -E 20 -H a
18 20 binary classifiers (random code):multilayer perceptron
weka.classifiers.MultiClassClassifier -E 1 -R 2.0 -Wweka.classifiers.neural.NeuralNetwork -- -L 0.3 -M 0.2 -N500 -V 0 -S 0 -E 20 -H a
19 20 binary classifiers (random code): 100iterations of AdaBoost using stumps
weka.classifiers.MultiClassClassifier -E 1 -R 2.0 -Wweka.classifiers.AdaBoostM1 -- -P 100 -I 100 -S 1 -Wweka.classifiers.DecisionStump --
20 20 binary classifiers (random code): 100iterations of AdaBoost using multilayerperceptrons
weka.classifiers.MultiClassClassifier -E 1 -R 2.0 -Wweka.classifiers.AdaBoostM1 -- -P 100 -I 10 -S 1 -Wweka.classifiers.neural.NeuralNetwork -- -L 0.3 -M 0.2 -N500 -V 0 -S 0 -E 20 -H a

Appendix - F1 x F2 plots
0 200 400 600 800 1000 1200 1400500
1000
1500
2000
2500
3000
3500
4000
iyiy
ihiheh
ehae
ae
ahah
aa aaao ao
uhuhuwuw
er
er
iyiy
ihiheheh
aeae
ahahaaaa
aoao
uhuh
uwuw
erer
iyiy
ihih
ehehaeae
ahahaa aa
aoao
uhuh
uwuw
erer
iy
iy
ihih
eheh
aeae
ahah aa aa
aoaouhuhuw
uw
erer
iyiy
ih
ih eheh aeae
ahah aaaa
aoao
uhuhuwuw
erer
iyiy
ihiheheh
ae ae
ahah
aaaaao
aouhuh
uwuw
erer
iyiy
ihiheheh aeae
ahah
aaaa
aoao
uhuhuwuw
erer
iyiy
ihih eh
eh
ae
ae
ahah
aaaa
aoaouhuh
uwuw
erer
iyiy
ihih
eheh
ae ae
ah ah aaaa
ao
aouhuhuwuw
erer
iyiy
ihih
ehehaeae
ahah
aaaa
aoao
uhuhuwuw
erer
iyiy
ihih
eheh
aeae
ahah
aaaa
aoao
uhuh
uwuw
erer
iyiy
ihih
eheh
aeae
ahah aaaa
aoao
uhuh
uwuw
erer
iyiy
ihih
eheh
aeae
ah
ahaaaa
aoao
uh uh
uwuw
er
er
iyiy
ihih
eh
eh
aeae
ahah
aaaa
aoao
uhuh
uwuw
erer
iyiy
ihih eheh
aeae
ahah
aa aa
ao ao
uh
uh
uwuw
erer
iyiy
ihih
eh
eh
ae
ae
ah ahaa
aa
aoao
uhuh
uw
uw
erer
iyiy
ih
iheh
eh
ae
ae
ahah
aa
aa
aoao
uhuh
uwuw
er er
iy
iy
ihih
eheh
ae ae
ah
ah
aaaa
ao
ao
uhuh
uw uw
erer
iy
iy
ihih
eheh
aeae
ahah
aaaa
aoao
uhuh
uw uw
er
eriy
iy
ihihehehaeae
ahah aaaa
aoaouhuh
uwuw
erer
iyiy
ihiheheh
aeae
ahah
aaaa
aoaouhuhuwuw
erer
iyiy
ihiheheh aeae
ahah aaaa
aoao
uhuh
uwuw
erer
iyiy
ihih
eheh aeae
ahah aaaa
aoao
uhuh
uwuw
erer
iyiy
ihiheheh
aeae
ahahaaaa
aoao
uhuh
uwuw
erer
iyiy
ih
iheheh
aeae
ahahaaaa
aoao
uhuh
uwuw
erer
iyiy
ihih eh
eh
aeae
ahahaaaa
aoaouhuhuwuw
erer
iyiy
ihiheh
eh aeae
ahah
aaaa
aoao
uhuhuwuw
erer
iyiy
ihih eh eh
aeae
ahah
aa aa
aoao
uhuh
uwuw
er er
iyiy
ihih eheh
aeae
ah
ah aa aa
aoao
uh
uh
uw
uw
erer
iyiy
ihih eheh
aeae
ah ah
aaaa
ao
aouhuh
uwuw
erer
iyiy
ihih
eheh
aeae
ahah
aaaa
aoao
uh
uh
uwuw
erer
iyiy
ihih
eheh
aeae
ah
ahaa
aa
ao ao
uhuhuw
uw
erer
iyiy
ihih
eheh
ae
ae
ahah
aaaa
aoaouhuh
uwuw
erer
iyiy
ihih
ehehae ae
ahah aaaa
aoaouhuh
uwuw
erer
iyiy
ihih
eheh
ae ae
ahah
aaaa
aoao
uhuh
uwuw
erer
iy
iy
ih
iheh
eh aeae
ah ah aaaaao
ao
uhuh
uw
uw
erer
iyiy
ihih
eheh
aeae
ahahaaaa
aoao
uhuh
uwuw
erer
iy
iy
ihiheh
eh aeae
ahah
aaaaaoao
uhuh
uw
uw
er
er
iyiy
ihiheheh ae
ae
ahahaaaa
aoao
uhuh
uwuw
erer
iyiyihih eheh
aeae
ahah aaaa
aoaouhuh
uwuw
erer
iyiy
ihiheheh
aeae
ahahaaaa
aoao
uhuh
uwuw
erer
iyiy
ihih
eheh
aeae
ahahaaaa
ao aouhuh
uwuw
erer
iyiy
ih iheheh
ae ae
ahah
aaaaao
ao
uhuhuwuw
erer
iy iy ihih
eheh aeae
ahahaa
aa
aoao
uhuh
uwuw
erer
iyiy
ihih eheh
aeae
ahah aaaa
aoao
uh uh
uwuw
erer
iyiy
ihih
eheh aeae
ahah aa
aa
ao
aouhuh
uwuw
erer
iyiy
ih iheheh
ae
ae
ahah
aaaa
aoao
uhuh
uwuw
er er
iyiyih
ih
eheh
aeae
ahah
aa aa
aoao
uhuh
uw
uw
erer
iyiy
ihih
eheh
aeae
ahah
aaaa
aoaouh
uh
uwuw
erer
iyiy
ihih
eheh
ae
ae
ahahaaaa
aoaouhuhuw
uw
erer
iy iyih
ih
eheh
aeae
ahah
aaaa
aoao
uhuhuwuw
erer
iyiy
ihih
eheh
aeae
ah
ah
aaaa
aoao
uhuh
uwuw
er er
iyiy
ihiheheh
aeae
ahahaaaa
ao aouh uhuwuw
erer
iy
iy
ihih
eheh
ae ae
ahahaaaa
ao
ao
uhuhuw
uw
er er
iy
iy
ihih
eheh
aeae
ahahaa
aa
aoao
uh
uh
uwuw
er er
iy
iyih ih
eheh
ae
ae
ah ah
aa
aa
ao
ao
uhuh
uw
uw
erer
iyiy
ih iheheh
ae ae
ah
ah aa
aa
aoao
uh
uhuw
uwer
eriyiy
ih ih
eheh
ae ae
ahah aaaa
aoao
uh uhuwuw
erer
iyiy ih
ih
eheh aeae
ahah
aaaa
aoao
uhuh
uwuw
erer
iyiy ihih
eheh
aeae
ahahaaaa
aoaouhuh
uwuw
erer
iyiy
ihih ehehae
ae
ahah aa
aa
aoaouhuh
uwuw
erer
iyiyihih
eheh
aeae
ahah aaaa
aoaouhuhuwuw
erer
iyiy
ihih eheh aeae
ahahaaaa
aoaouhuh
uwuw
erer
iyiy
ihih eheh
aeae
ahah aaaa
aoao
uhuh
uwuw
erer
iyiy
ihih
eheh
aeae
ahah
aaaa
aoao
uhuhuwuw
erer
iyiy
ihih
eheh
aeae
ahahaaaa
aoao
uhuhuwuw
erer
iyiy
ihih eheh
aeae
ahahaaaa
aoaouh
uhuw
uw
erer
iy iy
ihih eheh
aeae
ahah
aaaa
aoao
uhuhuwuw
er
er
iyiy
ihih
eheh aeae
ahahaaaa
aoaouhuh
uwuw
er
er
iyiy
ihih eheh
aeae
ahah
aaaa
ao ao
uhuhuw
uw
erer
iyiy
ihih
eheh
aeae
ahah
aaaa
aoao
uhuh
uwuw
er er
iyiy
ihih
eheh
aeae
ahah
aaaa
aoaouhuh
uwuw
erer
iyiy
ihih
eheh
ae ae
ahah
aaaa
aoao
uh uh
uwuw
erer
iyiy
ih
ih
eheh
aeae
ahah
aaaa
ao
ao
uh uhuw
uw
erer
iyiy
ihih
eheh
aeae
ahah
aa aa
aoao
uhuh
uwuw
erer
iyiy
ihih
eheh
aeae
ahah
aaaa
aoaouh
uh
uwuw
erer
F1 (Hz)
F2
(Hz)
All 1520 vowels from [Peterson & Barney]
Fig. A.1- F1 x F2 for all 1520 vowels. This plot should be the same but for unknown reason itseems to differ from [6], page 44.
0 200 400 600 800 1000 1200 1400500
1000
1500
2000
2500
3000
3500
4000
iyiy
ihiheh
ae
ahah
aa aauhuhuwuw
er
er
iyiy
ihiheh
aeae
aaaa
aoao
uhuh
uwuw
erer
iyiy
ihih
ehehaeae
ahaa aa
aoao
uhuh
uw
erer
iy
iy
ih
eheh
aeae
ahaa aa
aoaouhuhuw
uw
erer
iyiy
ih
ih eheh aeae
ahah aa
aoao
uhuhuwuw
erer
iyiy
ihiheheh
ae ae
ah
aauhuh
uwuw
erer
iyiy
ih
eh aeae
ah
aa
aoao
uw
erer
iy
ih
ahah
aouhuh
uwuw
erer
iy
ihih
eheh
ae ae
ah ah aa
aouhuhuw
erer
iyiy
ihih
ehehae
ae
ahah
aaaa
aouhuhuw
uw
erer
iyiy
ih
aeae
ah
aaaa
aoao
uhuh
uwuw
erer
iyiy
ihih
aeae
ah
aoao
uh
uwuw
erer
iyiy
ihih
eheh
aeae
ah
aoao
uh uh
uwuw
er
iyiyih
ih
eh
eh
aeae
ahah
aa
ao
uhuh
uwuw
erer
iy
ihih eh
aeae
ah
aa
ao aouw
erer
iyiy
ae
ah
ao
uh
uw
uw
erer
iyiy
ih
iheh
ae
ae
ahah
uhuh
uwuw
er
iy
iy
ih
ah
ah
aaaa
ao
ao
uhuh
uw uw
erer
iy
iy
aeae
aauh
uw uw
er
eriy
iy
ihihehehae
ah aa
aoaouhuh
uwuw
erer
iyiy
ihiheheh
aeae
ahah
aaaa
aoao
uhuwuw
erer
iyiy
ihih
aeae
ah
ao
uhuh
uwuw
erer
iyiy
ihih
eheh aeae
aauhuh
uwuw
erer
iyiy
ih
aeae
ahahaa
aoao
uh
uwuw
erer
iyiy
eheh
aeae
aa
aoao
uhuh
uwuw
erer
iyiy
ihih
ae
ahah
aoaouhuhuwuw
erer
iyiy
ihiheh
eh aeae
ahah
aaaauhuhuwuw
erer
iyiy
ihih eh eh
ah
aa aa
aoao
uhuh
uwuw
er er
iyiy
ih eheh
aeae
ah
ah aa
aoao
uwuw
erer
iyiy
ih eheh
aeae
ah ahaa
aoao
uh
uwuw
erer
iyiy
ihih
eheh
aeae
ahah
aaaa
aoao
uhuh
uwuw
erer
iyiy
ihih
eheh
aeae
ah
ahaa
aa
ao ao
uhuw
uw
erer
iyiy
ihih
eh
ae
ae
ahahaa
aouhuh
uwuw
erer
iyiy
ih
ehehae ae
ahah aa
aoaouhuh
uwuw
erer
iyiy
ae ae
ahah
aauhuh
uw
erer
iy
iy
ih
eh
aeae
ahaa
aoao
uhuh
uw
uw
erer
iyiy
aeae
ahahaa
aoao
uhuh
uwuw
erer
iy
iy
iheh
eh aeae
ah
ao
uhuh
uwuw
er
er
F1 (Hz)
F2
(Hz)
Training set of unanimously identified vowels
Fig. A.2- F1 x F2 for training set with onlyunanimously identified vowels.
0 200 400 600 800 1000 1200 1400500
1000
1500
2000
2500
3000
3500
4000
iyiy
ihiheheh ae
ae
ah
aa
aoao
uhuh
uwuw
erer
iyiyihih eh
aeae
ahah
aoaouh
uwuw
erer
iyiy
ihih
ao
uwuw
erer
iyiy
ihih
aeae
ah
ao aouhuhuwuw
erer
iyiy
iheheh
ae ae
ah
aa
ao
uhuhuwuw
erer
iy iy
aeae
aa
uh
uwuw
erer
iyiy
ihih
ae
aa
aoao
uh uh
uwuw
erer
iyiy
ihih
aeae
ah
aa
ao
aouhuh
uwuw
erer
iyiy
iheheh
ae
ae
aaaa
aoao
uhuh
uwuw
er er
iyiy eheh
ae
ahah
aa
aoao
uhuh
uwuw
erer
iy
ihih
eheh
aeae
ahah
aaaa
aoaouh
uh
uwuw
erer
iyiyih
eheh
ae
ahaaaa
aouhuw
uw
er
iy iyih
ih
eh
ahah
aaaa
uhuhuw
erer
iyiy
ihih
eh
aeae
ah
ah
aaaa
aoaouw
uw
er er
iyiy
ihiheheh
ahahaaaa
ao aouh uhuwuw
erer
iy
iy
ihih
eheh
ae ae
ahah
ao
ao
uhuhuw
uw
er er
iy
iy
eh
aeae
ahah
aoao
uh
uh
uwuw
er er
iy
iyih ih
eheh
ae
ae
ah ahuhuh
uw
uw
erer
iyiy
ih iheh
ae ae
ahaa
aa
ao
uh
uhuw
uwer
eriyiy
ih ih
eheh
ae ae
ahah aaaa
ao
uh uhuwuw
erer
iyiy ih
ih
ehae
ahah
aoao
uhuh
uwuw
erer
iyiy ihih
aeae
ahaa
aa
aoaouh
uwuw
erer
iyiy
ihih ehehae
ae
ah aa
aoaouhuh
uwuw
er
iyiy
aeae
ah aaaa
uhuhuwuw
erer
iyiy
ihih eh ae
aauh
uwuw
erer
iyiy
ih eheh
aeae
ah aaaa
aoao
uhuh
uw
erer
iyiy
ihih
aeae
ah
aaaa
ao
uhuhuwuw
erer
iyiy
ehaeae
ahahaaaauhuh
uw
erer
iyiy
ihiheh
aeae
ahahaaaa
aoaouh
uhuw
uw
erer
iy iy
ih eh
ahah
aa
ao
uhuhuwuw
er
er
iyiy
ihih
eheh
ahaaaa
aoaouhuh
uwuw
erer
iyiy
aeae
ah
ao ao
uw
uw
erer
iyiy
ihih
eheh
aeae
ahah
aa
aoao
uhuh
uwuw
er er
iyiy
ihih
eheh
aeae
ahah
aa
aoaouhuh
uwuw
erer
iyiy
ihih
ae ae
aoao
uh uh
uwuw
erer
iyiy
ih
ih
eheh
aeae
ahah
aaaa
ao
uh uhuw
uw
erer
iyiy
ihih
eheh
aeae
ah
aauh
uwerer
iyiy
ihih
eheh
aeae
ahah
aa
aoaouh
uh
uwuw
erer
F1 (Hz)
F2
(Hz)
Testing set of unanimously identified vowels
Fig. A.2- F1 x F2 for testing set with onlyunanimously identified vowels.
View publication statsView publication stats