class 19: chinese credit market...
TRANSCRIPT

Class 19: Chinese Credit Market 中国信用债市场Financial Markets, Spring 2020, SAIF
Jun Pan
Shanghai Advanced Institute of Finance (SAIF)Shanghai Jiao Tong University
April 13, 2020
Financial Markets, Spring 2020, SAIF Class 19: Chinese Credit Market 中国信用债市场 Jun Pan 1 / 23

The Rise of China’s Onshore Credit Market
From 2008 through 2018, domestic debt securities issued by China’s non-financialcompanies increased by $2.795 trillion, from a negligible level in 2008 to $3 trillionin 2018, second only to the US.As China further opens up its financial system, this onshore credit market has thepotential of becoming a key component of the global fixed-income market, offeringinternational investors exposure to the real China.If the rapid growth of China’s economy has been the story of our age for the pastthree decades, then, moving forward, the maturation of China’s financial marketsand their integration into the global markets can very well be the story of thecoming decade.
Financial Markets, Spring 2020, SAIF Class 19: Chinese Credit Market 中国信用债市场 Jun Pan 2 / 23

Its Significance
China’s financial system has long been dominated by large state-owned banks.Firms in China rely on bank loans as a major source of debt financing. Prior to2008, market-based debt accounts for less than 5% of the total debt financing.For non-financial firms in China, the emergence of the credit market has opened acheaper and more efficient form of debt financing and lessened the dominance ofbanks in extending credit. By 2018, the market-based debt accounts for 16% of thetotal debt financing of non-financial firms in China.For the fast growing asset-management industry in China, it has expanded theinvestment frontier by offering an entirely new asset class – between the loweryielding and lower risk government bonds and the higher yielding and higher riskequity market.
Financial Markets, Spring 2020, SAIF Class 19: Chinese Credit Market 中国信用债市场 Jun Pan 3 / 23

Debt Financing by Non-Financial Firms in China, Bond vs Loan
0
2
4
6
8
10
12
14
16
18
20
Fra
ctio
n of
Bon
d F
inan
cing
(%
)
2004 2006 2008 2010 2012 2014 2016 20180
10
20
30
40
50
60
70
80
90
100
Tril
lion
RM
B
Loan in RMB Trillion (left axis)Bond in RMB Trillion (left axis)Bond Fraction (right axis)
Financial Markets, Spring 2020, SAIF Class 19: Chinese Credit Market 中国信用债市场 Jun Pan 4 / 23
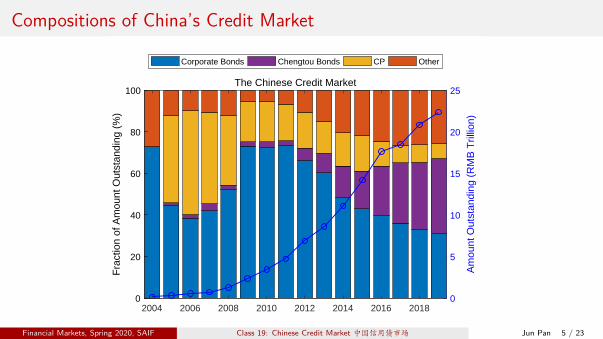
Compositions of China’s Credit Market
0
5
10
15
20
25
Am
ount
Out
stan
ding
(R
MB
Tril
lion)
The Chinese Credit Market
2004 2006 2008 2010 2012 2014 2016 20180
20
40
60
80
100
Fra
ctio
n of
Am
ount
Out
stan
ding
(%
)
Corporate Bonds Chengtou Bonds CP Other
Financial Markets, Spring 2020, SAIF Class 19: Chinese Credit Market 中国信用债市场 Jun Pan 5 / 23

Defaultable Bonds
Financial Markets, Spring 2020, SAIF Class 19: Chinese Credit Market 中国信用债市场 Jun Pan 6 / 23

Pricing of Defaultable Bonds
Model the random default time with default intensity λ:▶ One-year survival probability: e−λ
▶ One-year default probability: 1− e−λ ≈ λ
Assume zero recovery (100% loss given default):▶ Price: P = e−r × e−λ = e−(r+λ), where r is the riskfree rate.▶ Yield: r + λ▶ Credit Spread: λ
Assume loss given default = Loss:▶ P = e−r × e−λ + e−r × (1− e−λ)× (1− Loss)▶ For small λ, the credit spread is approximately: λ× Loss.
Financial Markets, Spring 2020, SAIF Class 19: Chinese Credit Market 中国信用债市场 Jun Pan 7 / 23
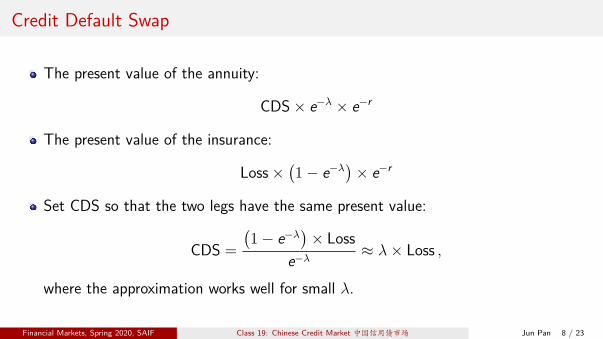
Credit Default Swap
The present value of the annuity:
CDS × e−λ × e−r
The present value of the insurance:
Loss ×(1− e−λ
)× e−r
Set CDS so that the two legs have the same present value:
CDS =
(1− e−λ
)× Loss
e−λ≈ λ× Loss ,
where the approximation works well for small λ.
Financial Markets, Spring 2020, SAIF Class 19: Chinese Credit Market 中国信用债市场 Jun Pan 8 / 23
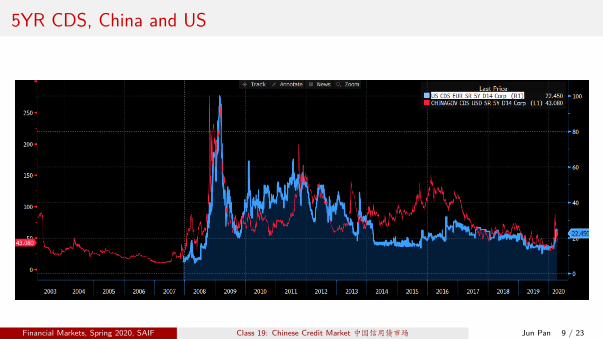
5YR CDS, China and US
Financial Markets, Spring 2020, SAIF Class 19: Chinese Credit Market 中国信用债市场 Jun Pan 9 / 23

One-Year Default Rates
2010 2011 2012 2013 2014 2015 2016 2017 2018 20190
0.01
0.02
0.03
0.04
0.05
0.06
0
0.1
0.2
0.3
0.4
0.5
0.6
0.7
0.8
0.9
1China Credit Market, Annual Default Rate (%)
CN SOE (left)CN NSOE (right)
1930 1940 1950 1960 1970 1980 1990 2000 20100
0.2
0.4
0.6
0.8
1
1.2
1.4
1.6
0
2
4
6
8
10
12
14
16Moody's Global Corporates, Annual Default Rate (%)
Global IG (left)Global HY (right)
Financial Markets, Spring 2020, SAIF Class 19: Chinese Credit Market 中国信用债市场 Jun Pan 10 / 23

Default Counts and Volume
Financial Markets, Spring 2020, SAIF Class 19: Chinese Credit Market 中国信用债市场 Jun Pan 11 / 23

China’s Corporate Bonds
0
1
2
3
4
5
6
7
Am
ount
Out
stan
ding
(R
MB
Tril
lion)
The Chinese Corporate Bond Market
2004 2006 2008 2010 2012 2014 2016 20180
20
40
60
80
100
Fra
ctio
n of
Am
ount
Out
stan
ding
(%
)
Pub NSOE Pri NSOE Pri SOE Pub SOE
Financial Markets, Spring 2020, SAIF Class 19: Chinese Credit Market 中国信用债市场 Jun Pan 12 / 23

Default and New Issuance of Corporate Bonds
0
10
20
30
40
50
60
Qua
rter
ly D
efau
lt A
mou
nt (
RM
B B
illio
n)
Default Amounts
15Q1
15Q3
16Q1
16Q3
17Q1
17Q3
18Q1
18Q3
19Q1
0
20
40
60
80
100
Fra
ctio
n of
Def
ault
Am
ount
(%
)
Pub NSOE Pri NSOE Pri SOE Pub SOE
100
200
300
400
500
600
700
Tot
al N
ew Is
suan
ce (
RM
B B
illio
n)
New Issuance
15Q1
15Q3
16Q1
16Q3
17Q1
17Q3
18Q1
18Q3
19Q1
0
20
40
60
80
100
Fra
ctio
n of
New
Issu
ance
(%
)
Pub NSOE Pri NSOE Pri SOE Pub SOE
Financial Markets, Spring 2020, SAIF Class 19: Chinese Credit Market 中国信用债市场 Jun Pan 13 / 23

Corporate Credit Spreads, China vs US
Investment Grade Credit Spreads
10Q1 11Q1 12Q1 13Q1 14Q1 15Q1 16Q1 17Q1 18Q1 19Q10
50
100
150
200
250
300
350
400
450
500
Cre
dit S
prea
d (b
ps)
0
10
20
30
40
50
60
Qua
rter
ly D
efau
lt A
mou
nt (
Bill
ion
RM
B)
Public Non-SOE (left axis)Public SOE (left axis)Quarterly Default Amount (right axis)
1990 1995 2000 2005 2010 2015 20200
100
200
300
400
500
600
700
200
400
600
800
1000
1200
1400
1600
1800
2000US Corporates, Credit Spreads (bps)
March 23
Invetment Grade (left)High Yield (right)
Financial Markets, Spring 2020, SAIF Class 19: Chinese Credit Market 中国信用债市场 Jun Pan 14 / 23
Market Segmentation and Price Discovery
Price discovery: The link between credit spreads and credit quality is generally weakin China’s bond market. Prior to the first default in 2014, credit spreads in Chinaare uninformative about credit quality above and beyond credit ratings.Segmentation: Since the credit tightening of 2017-18, the non-SOEs see their creditspreads exploding to over 100 bps above than their SOEs counterparts. Bycontrast, according to our default measures, the non-SOE issuers are in facthealthier than their SOEs counterparts.Segmentation on price discovery:
▶ The unprecedented credit risk forces investors to price non-SOE bonds withmore differentiation, making the non-SOE credit spreads markedly moreinformative.
▶ As investors seek safety in SOE bonds under the perception of governmentsupport, the information content of SOE credit spreads remains limited.
Financial Markets, Spring 2020, SAIF Class 19: Chinese Credit Market 中国信用债市场 Jun Pan 15 / 23

Severe Segmentation amidst Record-High Defaults in Chinese Corp Bonds
Difference in Credit Spread, Non-SOE minus SOE
10Q1 11Q1 12Q1 13Q1 14Q1 15Q1 16Q1 17Q1 18Q1 19Q1-50
0
50
100
150
200
250
Diff
eren
ce in
Cre
dit S
prea
d (b
ps)
0
10
20
30
40
50
60
Qua
rter
ly D
efau
lt A
mou
nt (
Bill
ion
RM
B)
Difference in Credit Spread (left axis)Quarterly Default Amount (right axis)
Credit spreads for non-SOE bondsare over 150 basis points higherthan their SOE counterparts in2019.This is after controlling for creditratings and other bond and firmcharacteristics.
Financial Markets, Spring 2020, SAIF Class 19: Chinese Credit Market 中国信用债市场 Jun Pan 16 / 23
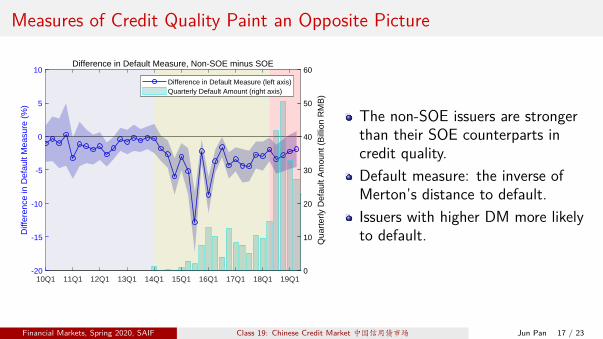
Measures of Credit Quality Paint an Opposite Picture
Difference in Default Measure, Non-SOE minus SOE
10Q1 11Q1 12Q1 13Q1 14Q1 15Q1 16Q1 17Q1 18Q1 19Q1-20
-15
-10
-5
0
5
10
Diff
eren
ce in
Def
ault
Mea
sure
(%
)
0
10
20
30
40
50
60
Qua
rter
ly D
efau
lt A
mou
nt (
Bill
ion
RM
B)
Difference in Default Measure (left axis)Quarterly Default Amount (right axis)
The non-SOE issuers are strongerthan their SOE counterparts incredit quality.Default measure: the inverse ofMerton’s distance to default.Issuers with higher DM more likelyto default.
Financial Markets, Spring 2020, SAIF Class 19: Chinese Credit Market 中国信用债市场 Jun Pan 17 / 23

Merton’s Model of Default, dVt = µVt dt + σA Vt dZt
T=0 T=1-1
-0.8
-0.6
-0.4
-0.2
0
0.2
0.4
0.6
0.8
1
Log
of A
sset
Val
ue
Distance-to-Default (DD)(µ− 1
2σ2A)
T − ln(K/V0)
σA√
T
Asset volatility: σA
Firm leverage: K/V0
Asset growth: µ
Financial Markets, Spring 2020, SAIF Class 19: Chinese Credit Market 中国信用债市场 Jun Pan 18 / 23

Model Calibration
For a fixed horizon T, we estimate the firm’s asset value Vt and volatility σA via
Et = Vt N(d1)− er T KN(d2) and σE =VtEt
∂Et∂At
σA ,
where Et is the firm’s equity value and σE is the equity volatility, and
d2 =ln(Vt/K) + (r − σ2
A/2)TσA
√T
and d1 = d2 + σA√
T .
Quarterly calibration using quarterly-updated model inputs:▶ Default Boundary K: current liabilities plus one half of long-term debt.▶ Equity Value Et: the total market cap by quarter end.▶ Equity volatility σE: estimated using daily stock returns within the quarter.▶ Riskfree rate r: one-year bank deposit rate.
Financial Markets, Spring 2020, SAIF Class 19: Chinese Credit Market 中国信用债市场 Jun Pan 19 / 23

Default Measure
The inverse of Merton’s distance to default (DD) to measure the firm’s default risk:
DMt = DD−1t and DDt =
(µ− 1
2σ2
A)
T − ln (K/V0)
σA√
T
where the asset growth µ is estimated using the average growth rate of the assetvalue over the past three years.Issuers with higher DM are of lower credit quality and more likely to default. Ourdefault measure is similar in spirit to:
▶ Merton’s probability of default N(−DD): Its reliance on normal distributionpredicts low levels of defaults and flattens out the cross-issuer variation in DD.
▶ Moody’s KMV EDF (expected default frequency): This construction ofempirical distribution requires a large database of historical defaults, infeasiblefor the Chinese market.
Financial Markets, Spring 2020, SAIF Class 19: Chinese Credit Market 中国信用债市场 Jun Pan 20 / 23

Explaining Credit Spreads using DM and its Three Components
10Q1 11Q1 12Q1 13Q1 14Q1 15Q1 16Q1 17Q1 18Q1 19Q1-15
-10
-5
0
5
10
15
20
25
Slo
pe C
oeffi
cien
t
Credit Spreads on Default Measure
Public Non-SOEPublic SOE
10Q1 11Q1 12Q1 13Q1 14Q1 15Q1 16Q1 17Q1 18Q1 19Q1-4
-2
0
2
4
6
8
10
Slo
pe C
oeffi
cien
t
Credit Spreads on Equity Volatility
Public Non-SOEPublic SOE
10Q1 11Q1 12Q1 13Q1 14Q1 15Q1 16Q1 17Q1 18Q1 19Q1-2
0
2
4
6
8
10
Slo
pe C
oeffi
cien
t
Credit Spreads on Leveage
Public Non-SOEPublic SOE
10Q1 11Q1 12Q1 13Q1 14Q1 15Q1 16Q1 17Q1 18Q1 19Q1-3
-2
-1
0
1
2
3
Slo
pe C
oeffi
cien
t
Credit Spreads on Asset Growth
Public Non-SOEPublic SOE
Financial Markets, Spring 2020, SAIF Class 19: Chinese Credit Market 中国信用债市场 Jun Pan 21 / 23

Additional R2 Explained
10Q1 11Q1 12Q1 13Q1 14Q1 15Q1 16Q1 17Q1 18Q1 19Q1
0
5
10
15
Add
ition
al R
2 (%
)
R2 Explained by DM
Public Non-SOEPublic SOE
10Q1 11Q1 12Q1 13Q1 14Q1 15Q1 16Q1 17Q1 18Q1 19Q1
0
5
10
15
Add
ition
al R
2 (%
)
R2 Explained by Leverage, Equity Vol, and Asset Growth
Public Non-SOEPublic SOE
Financial Markets, Spring 2020, SAIF Class 19: Chinese Credit Market 中国信用债市场 Jun Pan 22 / 23

Main Takeaways
Financial Markets, Spring 2020, SAIF Class 19: Chinese Credit Market 中国信用债市场 Jun Pan 23 / 23