clark university poll of emerging adults · · 2015-08-24lives of emerging adults and their...
TRANSCRIPT

1
Work, Education and Identity
CLARK UNIVERSITY POLL OF EMERGING ADULTS

2
Research Objectives
• Reflections on education and its impact on the lives of Emerging Adults and their transition into the workplace
• How Emerging Adults form their identities and pursue identity-based work that makes the best of their talents and interests
• Insight into the stereotypes associated with Emerging Adults
• Current status of life at work, and how Emerging Adults envision their futures

3
Methodology
From May 22 to May 29, 2015 the polling firm Penn Schoen Berland (PSB) conducted an online quantitative study of
1,000 Emerging Adults (ages 21-29). This audience was broken down into younger Emerging Adults (ages 21-24),
older Emerging Adults (25-29), and their corresponding segments to further identify changes across demographics.
AUDIENCE SAMPLE SIZE MARGIN OF ERROR
All 1000 ±3.1%
Younger Emerging Adults (21-
24) 505 ±4.36%
Older Emerging Adults (25-29) 495 ±4.4%
Male 506 ±4.36%
Female 494 ±4.41%
Attended college (Associate degree
and higher) 575 ±4.09%
White 576 ±4.08%
Black/African-American 141 ±8.25%
Asian American 55* ±13.21%
Hispanic/Latino 199 ±6.95%

4
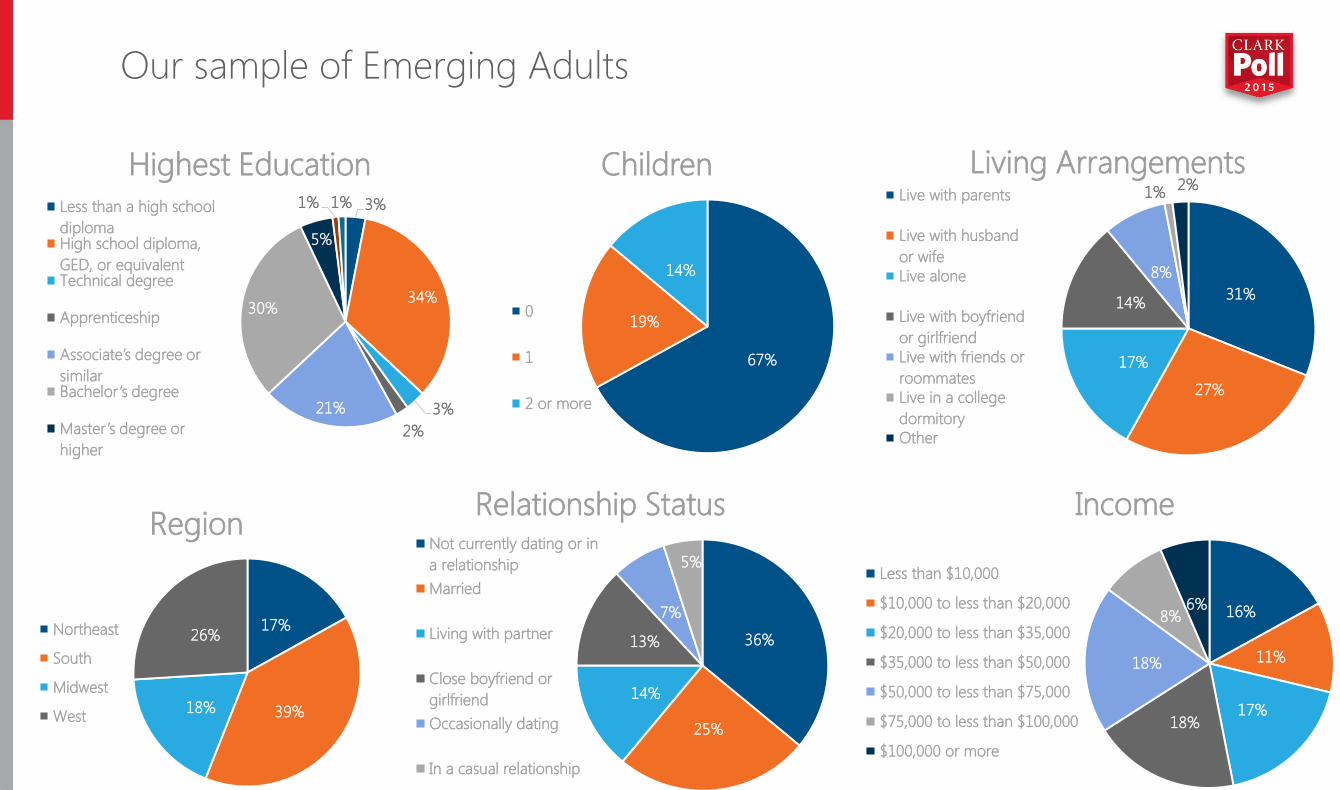
Our sample of Emerging Adults
51% 49%
Gender
Male
Female 50% 50%
Age
21-24
25-29
17%
39% 18%
26%
Region
Northeast
South
Midwest
West
26%
37%
37%
Mother's Education
High school diploma
or less
Two-year degree,
some college, or
vocational school
4-year college degree
or more
58% 14%
6%
20%
2%
Race
White
Black/African
AmericanAsian American
Hispanic/Latino
Other
5
Our sample of Emerging Adults
31%
27%
17%
14%
8%
1% 2%
Living Arrangements Live with parents
Live with husband
or wife
Live alone
Live with boyfriend
or girlfriend
Live with friends or
roommates
Live in a college
dormitory
Other
17%
39% 18%
26%
Region
Northeast
South
Midwest
West
16%
11%
17% 18%
18%
8% 6%
Income
Less than $10,000
$10,000 to less than $20,000
$20,000 to less than $35,000
$35,000 to less than $50,000
$50,000 to less than $75,000
$75,000 to less than $100,000
$100,000 or more
67%
19%
14%
Children
0
1
2 or more
3%
34%
3%
2%
21%
30%
5%
1% 1%
Highest Education Less than a high school
diplomaHigh school diploma,
GED, or equivalentTechnical degree
Apprenticeship
Associate’s degree or
similar Bachelor’s degree
Master’s degree or
higher
36%
25%
14%
13%
7%
5%
Relationship Status Not currently dating or in
a relationship
Married
Living with partner
Close boyfriend or
girlfriend
Occasionally dating
In a casual relationship

6 6
Education
① Emerging Adults value open, accessible education;
80% say that education and/or training past high
school is more important than ever.
② Financial support plays a key role in the decision
whether to attend college, with 7 in 10 of Emerging
Adults who declined to go to college citing cost as a
primary factor.
③ While this leads to a high incidence of student debt
among those who do attend (63%), most consider
their loan debt to be manageable, and say the
education experience is “worth it.”
Key Findings
The best use
of their talents
Enjoyable
work centered
around
personal
fulfilment
The ideal job for
Emerging
Adults- even if it
means
accepting lower
pay
Employment
① Emerging Adults are neither lazy nor entitled; 89%
say that no matter what job they’re doing, they’ll try
to do it as well as possible.
② While a majority report satisfaction with their post-
education employment opportunities, 3 in 5 struggle
with work/life balance in their current jobs, and 7 in
10 haven’t progressed as far in their careers as they
had hoped to.
③ Emerging Adults see themselves changing career
paths at least once in the future, and do not see
themselves in the same fields they’re currently in 10
years down the line.

7
Education
8 8
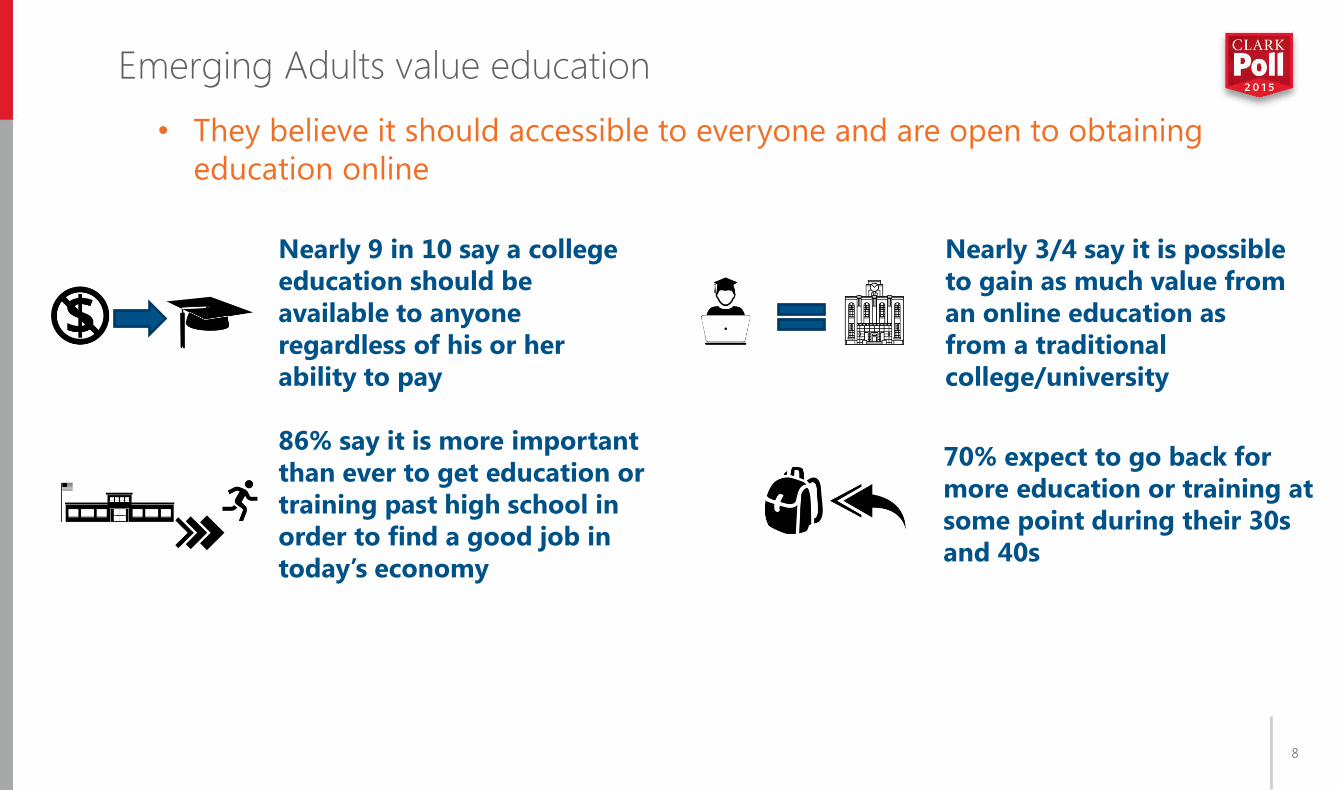
Emerging Adults value education
Nearly 9 in 10 say a college
education should be
available to anyone
regardless of his or her
ability to pay
86% say it is more important
than ever to get education or
training past high school in
order to find a good job in
today’s economy
70% expect to go back for
more education or training at
some point during their 30s
and 40s
• They believe it should accessible to everyone and are open to obtaining
education online
Nearly 3/4 say it is possible
to gain as much value from
an online education as
from a traditional
college/university

9
Although Emerging Adults value education, nearly 3 in 5 say they haven’t been able to find the financial support to get the education they need
59% of all emerging
adults say they have not
been able to find enough
financial support to get
the education they need
64%* of those with
a high school diploma
or less say they have
not been able to find
enough financial
support to get the
education they need
* Those with high school diploma or less N=367

10
More than 3/5 of those who didn’t go to college cited affordability concerns as playing a significant role
I did not want to go to school any
more
I did not know what I wanted to study after high
school
Foundation for graduate or professional
school
Family
responsibilities
I could not afford to get more education
I continued education past
high school because…
N=775
Nearly 7 in 10 didn’t go to
college because
of cost
I did NOT continue education
past high school because…
N=213
The possibility of making more
money
86%
Having a better chance of finding a
good job
87%
Education/training in a specific area
85%
Broadening my
knowledge of
the world
80%
Foundation for graduate or professional
school
Foundation for graduate or professional
school
72%
68%
58%
57%
51%
Half said they
didn’t go because
of family
responsibilities
More than
4 in 5 went to
college to find a
good job

11
37 7 8 10 9 9 10 7 2
No student debt
Under $5,000
$5,000-$9,999
$10,000-14,999
$15,000-$19,999
$20,000- $29,999
$30,000-$49,999
$50,000-$100,000
Over $100,000
More than 3 in 5 Emerging Adults have student loan debt
What is the total amount of your current student loan debt?
Showing % with associate degree or more (N=775)
63% have
student
loan debt
Nearly 1 in 10 have more than $50,000 in
debt

12
Nearly 70% of
respondents feel they are
“able to adequately
manage and pay off”
student loan debt within
their current job situation.
33% feel that they are
“drowning” in student
loan debt despite being
employed.
An overwhelming majority of respondents have found their educational experiences to be worthwhile, regardless of the financial consequences
63% 37% Have student loan debt
Have no student loan debt
72%
28%
My educational experience was worthwhile, even though I
have student loan debt now.
My educational experience wasn’t worth the debt I took on.
What is the total amount of your current student loan debt?
Showing % with associate degree or more
Which of the following statements is closer to your view? Showing % who have student loans and are currently employed
N=360
Which of the following statements is closer to your view? Showing % who have student loans
N=408

13
Transitioning to Work

14
More than 1 in 4 Emerging Adults say their jobs are unrelated to the fields in which they received education or training
73%
27%
Related to education Unrelated to education
Only 66% of women
versus 78% of men
have jobs related to
their education
V.
How much is your current job directly related to the field
in which you received your education or training?
Showing % currently employed (N=654)

15
40
60 60%: I am satisfied with the
employment opportunities my college degree has afforded me.
The majority of Emerging Adults are satisfied with the employment opportunities their college degrees have afforded them
40%: My college degree has
not provided me with the employment opportunities I
anticipated.
Which of the following statements is closest to your view?
Showing % with associates degree or more (N=575)

16
Very Well Prepared
• Writing clearly and persuasively (43%)
• Working independently to solve a problem without help (43%)
• Reading and understanding complex information (42%)
• Locating and evaluating information from multiple sources (40%)
• Doing the work required for your current job (39%)
• Continuing on to further education (38%)
• Working effectively with others who have different skills (38%)
• Developing creative solutions to complex problems (36%)
• Overcoming challenges and obstacles to achieve a goal (36%)
Not at all Prepared
• Finding a job in your field (10%)
• Changing career directions (11%)
• Advancing your career (8%)
• Leading a team with confidence (8%)
• Speaking persuasively to others (6%)
• Monitoring your progress toward a goal and making
changes when necessary (6%)
Today’s job market
does not value a
liberal arts
educational
background.
A liberal arts education
including history,
philosophy and English
literature is important
and valuable no matter
what career you pursue.
56%
44%
Which of the following statements is closer to your view? Showing % All
Emerging Adults feel that while their educational backgrounds have helped them hone soft skills, they haven’t been as well-prepared for specific career skills
How has your education so far prepared you for each of these? Showing % All, Ranked by Very Well-Prepared
Changing career directions
(11%) and finding jobs in
their fields (10%) are the
areas where respondents
felt the least well
prepared by their
education
• 56% of Emerging Adults say today’s job market does not value a liberal arts educational background

17 17
Emerging Adults across the board feel well-prepared for understanding their relationships and responsibilities in the world, but feel less confident about the technical aspects of life – like personal finances and civic duties
WELL
PREPARED
LESS
PREPARED
How well do you feel your education has prepared you for your life outside of work in each of the following ways? Showing % All
79%
Understanding my
personal strengths
and weaknesses
74%
Understanding others
and my relationships
with them
73%
Understanding myself
and how I fit into the
world
73%
Handling the
responsibilities
of daily life
68%
Making decisions
about political and
social issues
66%
Handling my
personal finances
55%
Having a successful
marriage/relationships

18
Current Work

19
More than 3 in 5 Emerging Adults are unhappy with some aspect of their current job
81% have 1 job and 19%
have 2 or more
51% have been at their
current job for 2-4 years
More than 3 in 5 are
currently unhappy with
either their work-life
balance, salary, or both
Current Job
50% say their job with
their current
employer is
temporary
50% say they would
like to advance
within their career
at their current
employer

20
70% have not made as much progress in their careers as they had hoped to
Entry Level-
Assistant
Manager
Mid-level to
senior
manager or
director
Vice
president or
higher
60%
24%
7%
Which of the following best describes your current job title?
Showing % currently employed (N=654)
16% are mid-level
to senior
manager or
director
31% are mid-level
to senior
manager or
director
70
30
I have not made as much progress in my
career as I had hoped I would have by
now
Agree Disagree
To what extent do you agree or disagree with each of the
following statements? Showing % All
• Emerging Adult men are almost twice as likely as Emerging Adult women to be mid-level or senior managers or directors
76% of men say
they prefer to
take initiative
and be a leader
over following
others’
instructions,
compared to
68% of women

21
Only 35% of employed Emerging Adults believe that the most important job feature (“look forward to going each day”) strongly applies to their current job
IDEAL REAL
Please rank the following job features from most important to least
important when looking for a long-term job for yourself. Ranked l
How strongly does each of the following job features apply to
your current job? Asked of those currently employed (N=654),
Ranked by % strongly applies
They are more concerned with personal fulfillment & happiness and less concerned with power & influence
Please rank the following job features from most important
to least important when looking for a long-term job for
yourself. Ranked by Mean
Emerging
Adults
Is a job that I will look forward to going to each day 1
Pays me a lot of money 2
Makes the best use of my talents and abilities 3
Is low stress 4
Enables me the flexibility to work when and where I want to 5
Has reasonable hours so that I have lots of free time 6
Is work that does some good in the world 7
Offers work that challenges me 8
Enables me to work with co-workers who are also my friends 9
Puts me in a position of power and influence 10
How strongly does each of the following job features apply
to your current job? Ranked by % strongly applies Emerging
Adults
Is a job that I will look forward to going to each day 35
Has reasonable hours so that I have lots of free time 33
Makes the best use of my talents and abilities 32
Enables me the flexibility to work when and where I want to 32
Enables me to work with co-workers who are also my friends 30
Is work that does some good in the world 30
Offers work that challenges me 29
Is low stress 29
Pays me a lot of money 25
Puts me in a position of power and influence 24
V.

22
59% I would take a lower
paying job if it meant doing
something I love
41% Having a high salary or
pay grade is most important to me
even if it means working in a job I
don’t enjoy
Although their ideal job would pay a lot of money, when push comes to shove, nearly 60% of Emerging Adults would choose a job they love, even if it comes at a lower pay grade
Which of the following statements is closest to your view?
Showing % All
Emerging Adults
with a graduate
degree are 16%
more likely to
think high
salaries are most
important
Female Emerging
Adults are 5%
more likely to
take a lower
paying job to do
something they
love

23
Myths v. Truths about Emerging Adults

24
Contrary to popular belief, Emerging Adults are not impatient, lazy, entitled, or disloyal
MYTHS ABOUT
EMERGING ADULTS
THE TRUTH ABOUT
EMERGING ADULTS
Myth BUSTED Impatient
Lazy
Entitled
Not Loyal
Myth BUSTED
Myth BUSTED
Myth BUSTED
• 79% say if they were in a boring job they
would be patient and try to move up within
the company
• 89% say no matter what job they are doing,
they try to do it as well as possible
• 59% think it’s a problem to show up to
work late occasionally
• 60% disagree with the statement 'On a
normal work day, I try to get by with doing
as little work as possible.'
• 64% disagree with the statement 'If a job is
boring, I don't see any point in doing it
well.'
• 60% disagree with the statement ‘I don't
see any advantage in being loyal to the
company I work for.’
Inseparable from
social media Myth BUSTED
• 78% say they would consider taking a job
that blocked social media and personal

25
51 26 12 11
Little or none
Occasional support when needed
Frequent support when needed
Regular support for living expenses
Many Emerging Adults are still receiving financial support from their parents
Younger
Emerging
Adults receive
the most
regular
support (+8)
How much financial support do your parents
provide you? Showing % All
Nearly 4 in 5
Emerging Adults
often feel that they
do not make
enough money
Nearly half (49%)
receive some type of
financial support
62% of people
who do not receive
financial support
would choose a job
they love over a job
with higher salary

26
Emerging Adults expect to move around career-wise, rather than stay on a singular path
65
58
60
35
42
40
MY CURRENT JOB IS NOT IN THE FIELD I HOPE TO
BE IN 10 YEARS FROM NOW. *
I THINK I’LL HAVE TO SWITCH CAREERS MULTIPLE
TIMES DURING MY LIFETIME TO KEEP UP WITH THE
CHANGING ECONOMY.
I WANT TO CHANGE CAREER PATHS AT LEAST ONCE
OR TWICE IN MY LIFETIME.
Agree Disagree
To what extent do you agree or disagree with each of the
following statements? Showing % All
* Only asked of those who are currently employed (N=654)
27
Appendix

28
34
30
21
6 3
37
28
23
2 3
31 32
18
9
3
High school diploma,
GED, or equivalent
Bachelor’s degree Associate’s degree Master’s degree Apprenticeship or training
program for a specific job
Base Younger Emerging Adults Older Emerging Adults
What is the highest level of education you have
completed so far? Showing % All
• Nearly 40% of 21-
to 24-year-olds
had completed at
least high school or equivalent
• More than one-
third of 25- to 29-
year-olds had
completed their
bachelor’s degree
Bachelor’s degrees and high school diplomas/GEDs remain the most common levels of education among respondents

29
8
13
28
51
8
13
36
43
8
14
20
59
Occasionally taking classes
Enrolled in school part-time
Enrolled in school full time
Not currently in school
Older Emerging Adults Younger Emerging Adults Base
Which of the following best describes your current
educational status? Showing % All
Younger Emerging
Adults are much more
likely to be enrolled in a
Public University (+9) or
Community College
(+7) than Older
Emerging Adults, who
prefer Private (+5) or
Online Universities (+8)
The majority of respondents were not currently in school, with more than 40% of 21- to 24-year-olds and half of 25- to 29-year-olds unenrolled

30
45
22
16
43
23
18
47 21
14
Public
university
Private
university
Community
college
Older Emerging
Younger Emerging
Adults
Base
Which of the following best describes the kind of school you last
attended? Showing % who are not currently in school (N=294)
The mean ages across
audiences for
completion of most
recent educational
program were very
similar, with Younger
Emerging Adults
averaging completion
at age 20, and Older
Emerging Adults at
age 21
While respondents currently taking courses are doing so at state- funded institutions, most Emerging Adults describe their last school of attendance as either a public or private university

31
19 16 14 13
10 8
18 15 15 17
8 8
20 16
13 10 12
9
Business Math, engineering,
computers, or
technology
Arts and humanities Psychology, sociology, or
other social sciences
Health professions Other
Base Younger Emerging Adults Older Emerging Adults
If you have obtained any education or training after high school, which
of the following best describes the area of your education or training?
Showing % obtained education or training after high school (N=633)
For respondents who pursued education or training after high school, most focused in the areas of business, engineering/tech, arts/humanities and the social sciences.

32
More than 1 in 5 Emerging Adults think they would have benefited more from their college experience if they had waited to go a year or two after high school
21 30 25 24 I would have benefited more from my college education if I had
waited a year or two after high school before entering college.
Strongly agree Somewhat agree Somewhat disagree Strongly disagree
How strongly do you agree or disagree with the following
statements? Showing % who have completed an associates degree or more (N= 575)

33
Why I pursued education after high school
Please state how much each of the
following factors influenced your
decision to pursue college or other
education beyond high school.
Showing %, Ranked by Influenced *Note: Only asked of those with an associate degree or higher (N=775)
Influenced
Strongly
influenced my
decision
Somewhat
influenced my
decision
Had little to no
influence
Had little influence
on my decision
Didn’t influence
my decision at all
Having a better chance of finding a
good job 87 55 32 13 9 4
The possibility of making more
money 86 52 34 14 9 5
Getting education or training in a
specific area 85 47 38 15 11 4
Broadening my knowledge of the
world 80 42 38 19 13 6
I always expected to go 79 45 34 20 14 6
My parents 73 37 36 26 16 10
Achieving a foundation for graduate
or professional school 72 37 35 28 17 11
The potential to have fun while
attending more school 61 28 33 39 24 15
My friends 54 23 31 46 24 22
Avoiding adult responsibilities for a
few more years 50 19 31 50 21 29

34
Why I didn’t pursue education after high school
Q56-64: Please state how much
each of the following factors
influenced your decision not to
pursue college or other education
beyond high school. Showing %, Ranked by Influenced *Note: Only asked of those who did not obtain and are not in the process of obtaining an associate degree or higher (N=213)
Influenced
Strongly
influenced my
decision
Somewhat
influenced my
decision
Had little to no
influence
Had little influence
on my decision
Didn’t influence
my decision at all
Cost/I could not afford to get more
education 68 42 26 31 13 18
I did not want to go to school any
more 58 28 30 42 17 25
I did not know what I wanted to
study after high school 57 23 34 42 15 27
Family responsibilities 51 24 27 49 16 33
I didn’t have clear guidance on how
to apply/enroll 42 17 25 57 19 38
I never expected to attend 41 14 27 59 19 40
I didn’t think it would be necessary
for my job/career 39 13 26 61 17 44
Mental health complications 35 16 19 65 13 52
Physical health complications 34 13 21 66 15 51

35
Around 3 in 5 say they prefer to have co-workers who are friends
61%
39%
I prefer to have co-workers who are also my friends
and a part of my social life outside of work.
I prefer to have strictly working relationships with my
co-workers, and like to keep my friends and social life
separate from work.
48% 52%
I prefer a lifestyle of flexibility and freedom of location
I prefer a lifestyle of stability and consistency.
56% 44%
I prefer to have a less structured job that provides
more room for creativity.
I prefer to have a 9-5 job that explicitly lays out my
daily tasks and responsibilities.
Which of the following statements is closer to your view?
Showing % All

36
Almost ¾ of Younger Emerging Adults are paid hourly
As Emerging Adults get older, they transition
from being paid hourly to being paid on salary
• 1 in 10 older Emerging Adults are paid per job/on a freelance basis
How are you currently paid? If more than one answer is true you may
select multiple responses. Showing % currently employed (N=654)
66
30
9 7 1
73
20 8 6 1
59
39
10 9 1
Paid hourly Paid on salary Paid per job/on a
freelance basis
Paid on commission Other
All Younger Emerging Adults Older Emerging Adults

37
1 in 5 female Emerging Adults works two jobs
81% have 1 job 16% have 2 jobs 3% have 3 or
more jobs
How many different jobs do you currently have?
Showing % currently employed (N=654)
Almost 1 in 5 female
Emerging Adults has 2
jobs

38
79% of Emerging adults who currently have jobs in education plan to stay in the field for at least another 10 years
Which of the following best describes the area you work in now?
Which of the following best describes the field in which you have or plan to have your career in 10 years?
Showing % of respondents in each field currently who plan to be in that field in 10 years (N=654)
65% of
Emerging
Adults say
“My current
job is not in
the field I
hope to be
in 10 years
from now.”
Education: 79% (n=52)
Technology or computers: 69% (n=77)
Financial industry/services: 55% (n=50)
Health care: 44% (n=64)
Arts: 41% (n=54)

39
Almost 9 in 10 Emerging Adults say no matter what job they are doing, they try to do it as well as possible
TRUE
'No matter what job I am doing, I try to do it as
well as possible.'
'If I were in a boring job, I would be patient and
try to move up within the company.'
'I would never be willing to stay in a boring job in
the long run, no matter how well it paid.'
FALSE
'If a job is boring, I don't see any point in doing it
well.'
I don't see any advantage in being loyal to the
company I work for.
'On a normal workday, I try to get by with doing
as little work as possible.'
Most Agree with Statement Most Disagree with Statement
‘I don't think it’s a problem to show up to
work late occasionally.'
About ½ Agree or Disagree
'I don't see anything wrong with checking my Facebook page, tweeting, or texting with friends now and then in the course of a normal work day.' ‘
If employers do not pay me well,
they do not deserve my best
work effort.'
‘I like the socializing at work better than doing the actual work.’
T/F SPLIT
‘If employers do not pay me well, they do not
deserve my best work effort’ is true of 63% of men
compared to 45% of women
• Additionally, they are willing to be patient in a boring job IF they think it will go somewhere

40
Three-quarters of Emerging Adults have never been laid off or fired from a job
How many times have you been laid off or fired from a job?
Showing % All
75%
19%
5% 1%
Never Once Twice Three or more

41
Nearly 4 in 5 Emerging Adults would consider taking a job that blocks social media and personal email
What percentage of your work day would you say you spend
surfing the Web, checking social media or your personal
email, or doing other non-work related activities?
Showing % currently employed (N= 654)
Would you consider taking a job that blocks the use of social
media and personal email? Showing % All
78% say YES
33
22 23
14
8
31
24 24
13
8
34
20 23
15
8
Less than 5% 5%-10% 10%-25% 26%-50% More than 50%
All Younger Emerging Adults Older Emerging Adults

42
Nearly 1/5 of Emerging Adults are not currently employed but are looking for work
Which of the following best describes your current employment
status? Showing % All
70% of Younger Emerging Adults work
fewer than 40 hours per week
32 28
19
8 6 6 1
25
31
24
6 5 7 2
39
25
14 10
6 5 1
Employed and working
full-time
Employed and working
part-time
Not currently
employed, but looking
for work
Stay-at-home parent Self-employed Not currently
employed, and not
looking for work
Other
All Younger Emerging Adults Older Emerging Adults

43
KEPI Scores - The Clark University Knowledge Economy Preparation Index (KEPI) ™. These are the qualities that employers say they need workers to have in the new knowledge economy.
How well has your education so far prepared you for each of
the following? Showing Mean All
Younger
Emerging
Adults
Older Emerging
Adults Male Female No College College
Reading and understanding complex information 3.23 3.22 3.24 3.22 3.24 3.15 3.29
Developing creative solutions to complex problems 3.10 3.08 3.12 3.11 3.09 2.97 3.2
Locating and evaluating information from multiple sources 3.18 3.13 3.24 3.16 3.21 3.05 3.28
Writing clearly and persuasively 3.24 3.18 3.29 3.22 3.26 3.14 3.31
Speaking persuasively to others 3.04 3.05 3.02 3.07 3.01 2.94 3.11
Working independently to solve a problem without help 3.25 3.20 3.30 3.21 3.28 3.17 3.31
Working effectively with others who have different skills 3.18 3.18 3.17 3.17 3.18 3.06 3.26
Leading a team with confidence 2.99 2.96 3.02 3.03 2.95 2.84 3.1
Monitoring your progress toward a goal and making changes
when necessary 3.09 3.07 3.10 3.11 3.06 2.99 3.16
Overcoming challenges and obstacles to achieve a goal 3.15 3.13 3.17 3.18 3.12 3.03 3.24
TOTAL 31.45 31.20 31.67 31.48 31.40 30.34 32.26
Methodology: We calculated the KEPI Score by assigning each answer choice a number on a scale from
1-4: Very well=4, Somewhat well=3, Not very well=2, Not at all=1. We then took the mean score (to two
decimal places) for each of the statements and added them together to create a summary score.

44
THANK YOU
Contact:
Ariella Steinreich, Steinreich Communications
Jane Salerno, Media Relations Director
Clark University [email protected]
www.clarku.edu/clark-poll