clark county renewable energy park - idaho waste/030311wastetoenergy/clark... · 2 clark county...
TRANSCRIPT
Clark County Renewable Energy Park Waste to Energy Feasibility Study 10/19/2010
Whisper Mountain Professional Services, Inc

1
Acknowledgment: "This material is based upon work supported
by the Department of Energy under Award Number DE-
EE000141.”
Disclaimer: "This report was prepared as an account of work
sponsored by an agency of the United States Government. Neither
the United States Government nor any agency thereof, nor any of
their employees, makes any warranty, express or implied, or
assumes any legal liability or responsibility for the accuracy,
completeness, or usefulness of any information, apparatus, product,
or process disclosed, or represents that its use would not infringe
privately owned rights. Reference herein to any specific
commercial product, process, or service by trade name, trademark,
manufacturer, or otherwise does not necessarily constitute or imply
its endorsement, recommendation, or favoring by the United States
Government or any agency thereof. The views and opinions of
authors expressed herein do not necessarily state or reflect those of
the United States Government or any agency thereof."

2
CLARK COUNTY RENEWABLE ENERGY PARK
WASTE TO ENERGY FEASIBILITY STUDY
EXECUTIVE SUMMARY
The use of biomass as a renewable energy feedstock is gaining wide support within Idaho. Idaho
has a wide variety of potential biomass sources including but limited to, municipal solid waste,
agriculture waste in the form of crop residues, livestock wastes, i.e., manures, and small diameter
woody biomass from public and private lands. This feasibility study was conducted by Whisper
Mountain Professional Services on behalf of Clark County Economic Development with the
primary purpose of determining if use of biomass as a renewable energy feedstock could
facilitate the creation of a waste to energy facility in Clark County’s Centennial Energy Park
which is located in Dubois Idaho.
The study was funded through an Idaho Office of Energy Resources Grant. In summary the study
included the following specific areas:
An assessment of the volume of municipal solid waste (MSW) available in the region.
An assessment of the volume and types of potential agricultural waste available in the
region.
An assessment of the woody biomass feedstock availability in the region.
The conceptual design of a thermo-chemical technology facility that can process
approximately 250 tons per day of MSW.
A discussion of the market(s) for the electricity.
A discussion of the facility site location considerations, permitting requirements, and
utility issues.
Conclusions and subcontractor recommendations including cost effectiveness, barriers,
risks, and financing options.
Four specific forms of biomass were examined as part of the study process, municipal solid
waste, agricultural crop residues, livestock waste or manure, and woody biomass. The study area
included six counties in eastern Idaho, Clark, Fremont, Teton, Madison, Jefferson, and
Bonneville. In the assessment area there are more than sufficient biomass sources to power a
renewable electrical generating energy facility however, it was discovered that because of
acquisition costs of the biomass feedstocks and the low price paid for electrical energy supplies
only municipal solid waste power facilities are cost effective.
The study also examined if there were technologies currently deployed which could be used to
convert biomass feedstocks into renewable electrical energy. The target price for the technology
was established as $3.5-4.0M per MWe capacity. Several technologies were given a cursory
review however, most were immediately found to exceed the target price primarily due to the
3
high cost of emission treatment facilities. At the suggestion of the Director of the Idaho
Department of Commerce, Clark County directed Whisper Mountain to examine the Dynamis
Energy 3.0 Waste to Energy Technology and to include the findings in this study. The design
basis cost for Dynamis’s Technology is $3.5M per MWe. The Dynamis Technology is discussed
in the body of this report and was found to be a feasible cost effective solution to the conversion
of biomass to renewable electrical energy.
Unfortunately three of the biomass forms were not found to be cost effective feedstocks for
electrical energy creation. Electrical energy prices in Idaho are well below the national average.
While some feedstocks may be cost effective in other energy markets only municipal waste,
because of its disposal fee subsidy was deemed to be a cost effective biomass resource.
The creation of the Eastern Idaho Regional Solid Waste District was brought about as a
significant outcome of this study. The feasibility of partnering regionally to find a solution to the
disposal of municipal solid waste was firmly established. The Waste District is comprised of four
Counties; Clark, Bonneville, Madison, and Fremont. Using the information gathered in the study
the Waste District has forged a partnership which will commence the construction of a Waste to
Energy Facility at the Centennial Energy Park in Dubois Idaho in early spring 2011. The facility
will process 250 tons per day of municipal solid waste and will create a total base load power
supply of 12 MWe and provide an annual net return to the counties of approximately $2.4.

4
CLARK COUNTY RENEWABLE ENERGY PARK
WASTE TO ENERGY FEASIBILITY STUDY
TABLE OF CONTENTS
Introduction ..................................................................................................................................... 6
Discussion ....................................................................................................................................... 7
Municipal Solid Waste .................................................................................................................... 9
Woody Biomass ............................................................................................................................ 14
Agricultural Waste ........................................................................................................................ 19
Technology ................................................................................................................................... 23
Economics ..................................................................................................................................... 33
Conclusion .................................................................................................................................... 38
Appendix 1: Eastern Idaho Regional Solid Waste District Documents ....................................... 39
Appendix 2: Clark County Community Economic Impact Analysis............................................ 56
Appendix 3: MSW Analytical Results .......................................................................................... 57
Bibliography ................................................................................................................................. 58

5
This
Page
Intentionally
Blank

6
CLARK COUNTY RENEWABLE ENERGY PARK
WASTE TO ENERGY FEASIBILITY STUDY
INTRODUCTION
As part of an ongoing economic development program, Clark County Idaho is establishing an
energy park on a 151-acre parcel within the City of Dubois. The anchor facility at the park is a
proposed Waste-to-Energy (WTE) plant. The concept of the facility is to gasify municipal solid
waste (MSW) from Clark and surrounding counties to make electricity. In addition to MSW, the
plant may be able to use agricultural waste and woody biomass available in the region for
feedstock. The current plan is to provide about 250 tons of feedstock per day to the facility and
have a plant capacity in the range of 12 to 14 MW.
The County commissioned a study to assess the feasibility of the WTE plant. Specifically the
study will assess the availability and associated cost of providing MSW, agricultural waste, and
woody biomass to the proposed energy park not only for the WTE facility, but also to other
symbiotic facilities which may use biomass for other energy producing uses. Additionally, the
study evaluated the thermo-chemical technology provided by Dynamis Energy, LLC to
determine if using it would be cost effective and environmentally acceptable.
Specific areas of emphasis in the study include the following:
An assessment of the volume of municipal solid waste (MSW) available in the region,
how much may be obtained under long-term contract and the financial arrangements and
impacts of bringing MSW feedstock to the proposed facility. The assessment includes
costs of handling and storage of the MSW, how various amounts will be managed, and an
agreement template with neighboring counties on providing MSW to the proposed waste-
to-energy (WTE) facility.
An assessment of the volume and types of potential agricultural waste available in the
region, how much may be obtained under long-term contract, and the cost for the
agricultural waste feedstock at the source and delivered. The assessment includes costs of
handling and storage of the agricultural waste, how various amounts will be managed,
and an agreement template with agricultural waste providers.
An assessment of the woody biomass feedstock availability in the region, how much may
be obtained under long-term contract, and the cost for the woody biomass feedstock at
the source and delivered. The assessment will identify specific potential public and
private biomass supply in the region which could potentially be used as feedstock for a
waste-to-energy (WTE) facility. The assessment should discuss all potential sources of
fuel that may be used for a WTE plant including wood manufacturing waste, wood chips,
sawdust, forest thinnings, and removals.
The conceptual design of the Dynamis Energy thermo-chemical technology facility will
assess whether a facility of this type could process approximately 250 tons per day of
MSW. The conceptual design includes a description of the facilities footprint, equipment,
processes, byproducts, as well as the permitting, capital, and operational costs.
7
A discussion of the market(s) for the electricity, including access to those markets,
anticipated revenues, and return on the investment.
A discussion of the facility site location considerations, permitting requirements, and
utility issues.
Conclusions and subcontractor recommendations including cost effectiveness, barriers,
risks, and financing options.
DISCUSSION
In July 2009 Clark County Idaho was informed that its major private employer, Idahoan Foods,
would be closing its potato processing facility outside of Dubois. The Idahoan Plant provided
60% of the private employment in Clark County. The County Commission tasked Ms. Kerri
Ellis, the Clark County Economic Development Director to find a suitable replacement industry.
The intent of the search was to replace the private jobs lost due to the Idahoan Plant closure. The
County had been investigating several renewable energy projects in hopes of increasing County
revenues. One such project was the creation of a Waste to Energy Facility whereby municipal
solid waste could be converted to an energy source. This study examines the feasibility of
converting Biomass to Energy and provides a path forward for Plant construction and operations.
Industry Perspective- Biomass to Energy
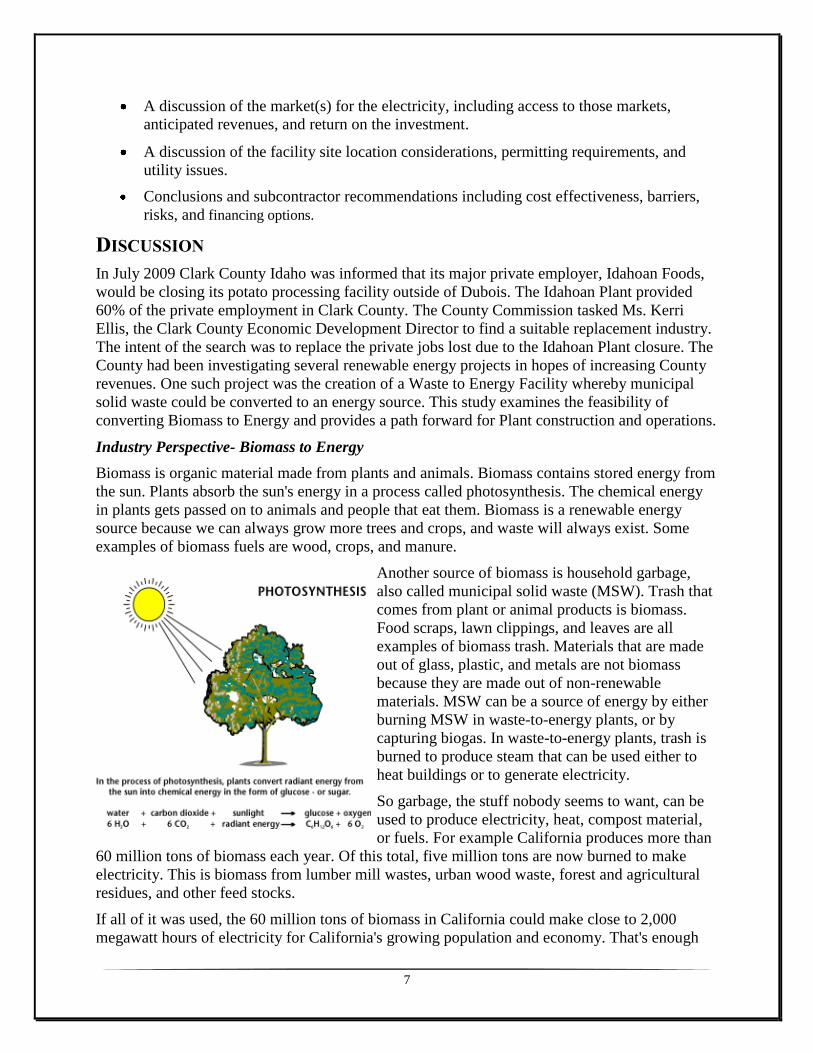
Biomass is organic material made from plants and animals. Biomass contains stored energy from
the sun. Plants absorb the sun's energy in a process called photosynthesis. The chemical energy
in plants gets passed on to animals and people that eat them. Biomass is a renewable energy
source because we can always grow more trees and crops, and waste will always exist. Some
examples of biomass fuels are wood, crops, and manure.
Another source of biomass is household garbage,
also called municipal solid waste (MSW). Trash that
comes from plant or animal products is biomass.
Food scraps, lawn clippings, and leaves are all
examples of biomass trash. Materials that are made
out of glass, plastic, and metals are not biomass
because they are made out of non-renewable
materials. MSW can be a source of energy by either
burning MSW in waste-to-energy plants, or by
capturing biogas. In waste-to-energy plants, trash is
burned to produce steam that can be used either to
heat buildings or to generate electricity.
So garbage, the stuff nobody seems to want, can be
used to produce electricity, heat, compost material,
or fuels. For example California produces more than
60 million tons of biomass each year. Of this total, five million tons are now burned to make
electricity. This is biomass from lumber mill wastes, urban wood waste, forest and agricultural
residues, and other feed stocks.
If all of it was used, the 60 million tons of biomass in California could make close to 2,000
megawatt hours of electricity for California's growing population and economy. That's enough

8
electricity for about two million homes!
Biomass is converted to energy in simple ways. The waste wood, tree branches, and other scraps
are gathered together and transferred to receiving locations. Waste is also added from factories
and farms at the receiving location. Rather than going to a landfill, local governments are
seeking to utilize state of the art technologies to process the waste into energy.
Using biomass as an energy feedstock helps to reduce global warming compared to a fossil fuel-
powered plant. Vegetation uses and stores carbon dioxide (CO2) when they grow, the stored
CO2 in the plant is released when the plant material is burned or decays. By replanting the crops
(renewal), the new plants can use the CO2 produced by the burned plants. So using biomass and
replanting helps close the carbon dioxide cycle. However, if the crops are not replanted, then the
carbon dioxide emitted through the process will contribute to global warming.1 Use of biomass
requires the “renewal” cycle to be a true carbon reduction practice.
The use of biomass to produce energy is a responsible environmental practice because the
biomass is reduced, recycled, and then reused. Today, new ways of using biomass are still being
discovered. The industry is moving quickly to the use of biomass conversion into Refuse
Derived Fuels (RDF) as one way to reduce the carbon footprint and to create usable electrical
energy.
Currently biomass fuels provide about 3 percent of the energy used in the United States. People
in the USA are trying to develop ways to burn more biomass and less fossil fuel. Using biomass
for energy can cut back on waste and support agricultural products grown in the United States.
Biomass fuels also have a number of environmental benefits. The figure below illustrates the
current status of waste to energy projects in the world.2
1 http://www.eia.doe.gov/kids/energy.cfm?page=biomass_home-basics-k.cfm 2 Dynamis Energy LLC, presentation to Clark County Board of County Commissioners, September 2009

9
MUNICIPAL SOLID WASTE
Although the first facility that combusted MSW for energy came on line in New York City in
1898, the industry did not experience rapid growth until 1978 with the enactment of the Public
Utility Regulatory Policy Act (PURPA).3 This legislation made it mandatory for utilities to
purchase electricity from qualifying facilities (QFs), which were defined as “cogeneration or
small power production facilities that meet certain ownership,
operating, and efficiency criteria established by the Federal
Energy Regulatory Commission pursuant to (PURPA).” This
new law improved the economics of the many MSW waste-
to-energy plants that qualified as QFs. PURPA mandated the
price paid for electricity to be equal to the utility’s avoided
cost of energy and capacity, and this resulted in MSW QFs
receiving a higher price for their power than they might
otherwise have received.4 MSW plants also benefited from the
increased cost of landfilling due to increases in “tipping fees”
(the cost to dump waste at a landfill), making disposing of MSW at a waste-to-energy plant less
expensive than at a landfill in many cases.
MSW waste-to-energy plants have high capital costs, and in order to make these plants
financially viable, project financers required the plant to obtain a reliable stream of low-cost fuel.
Usually, a plant would enter into a “flow contract” in which a municipality delivered its waste
stream to a specific plant. Thus, certain facilities held a de facto monopoly over a certain
locality’s MSW. In some cases, these contracts were seen as restricting interstate commerce in
municipal wastes, and in 1994 the U.S. Supreme Court
upheld a challenge to flow control, finding that it violated
the interstate commerce clause of the Constitution. This
ruling partially or fully voided many flow supply contracts
and created an added constraint on the waste-to-energy
industry. Subsequent to this ruling, few plants have been
able to come on line.5
In Idaho the long term disposal contracts for MSW have
also come under question because of the 2006 Frazier
decision issued by the Idaho Supreme Court.6 Based on
this decision Idaho government entities cannot commit to
long term contracts without the approval of the voters.
While there currently is a proposal to amend the Idaho
Constitution to remove this requirement all forms of local
government in Idaho are held to the decision. This current
constitutional limit makes it very difficult for counties to
develop and fund renewable energy projects.
3 Public Law 95-617, Public Utility Regulatory Policies Act of 1978. 4 The incremental cost to the electric utility of alternative electric energy which the utility would have generated or purchased
from another source 5 http://biomass.ucdavis.edu/materials/reports%20and%20publications/2003/2003_Solid_Waste_Conversion.pdf 6 Idaho Supreme Court, May 2005 Term, City of Boise v. Frazier, No. 30944, April 13, 2006

10
MSW as Biomass
Garbage, often called municipal solid waste (MSW), is the source of about 10% of the total
biomass energy produced in the United States. MSW contains biomass (or biogenic) materials
like paper, cardboard, food scraps, grass clippings, leaves, wood, and leather products, and other
non-biomass combustible materials, mainly plastics and other synthetic materials made from
petroleum.
Americans produce more and more waste each year. In 1960, the average American threw away
2.7 pounds of trash a day. Today, each American throws away about 4.5 pounds of trash every
day.7
Municipal Solid Waste could be the primary feedstock
converted in a waste to energy plant. The average
Idaho County hauls 60,000 to 70,000 tons of
municipal solid waste to landfills each year. Over the
past decade counties have been researching ways to
better use municipal solid waste. Recycling has
become a normal part of the waste disposal program in
most counties, aluminum cans, plastic, glass, and
newspaper are recycled during the sanitation process
either at the curb or at the transfer station. By using
recycling counties can remove items that are reusable.
The remaining waste includes various paper products
(roughly 38% of waste), food/household waste, and
construction or yard waste which could be considered
as biomass.
As part of this study MSW samples from Bonneville, Madison, and Clark Counties were
analyzed to determine suitability for the waste to energy conversion process. The complete
results of the analysis are located in Appendix 3. The analysis demonstrated the complexities of
waste acceptance and the need for a reliable dry, homogenous feed source. Moisture content of
the waste has a significant effect on the BTU content of the fuel as it does with any fuel type.
The following table provides the historical view of the availability of MSW in Clark, Bonneville,
Fremont, and Madison Counties.
County 2006 2007 2008 2009
Fremont
(St. Anthony landfill only)
3,726 3,259 4,282 4,360
Madison 13,959 14,482 14,313 15,167
Clark 427 443 447 459
Bonneville 83,325 89,796 90,034 85,403
TOTAL 101,437 107,980 109,076 105,389
Table 1
MSW Availability
7 http://www.eia.doe.gov/kids/energy.cfm?page=biomass_home-basics-k.cfm

11
The average tipping fee for municipal waste in the Western U.S. in 2004 was $37.748 that
number rose to $42.08 in 2008. According to David Babbitt, the Public Works Director of
Bingham County Idaho, the life cycle cost of waste placed in a county owned and operated
landfill ranges from $18 to $22 a ton. Currently the cost to tip at the Jefferson County Landfill at
Mud Lake is $30.55 a ton. That cost is expected to increase annually. By comparison, Bonneville
County charges out of county users, $38.00 a ton to tip at their landfill. Counties participating in
the Clark County Waste to Energy facility could be offered competitive tipping fees for their
municipal waste as an incentive for renewing contracts with the Waste to Energy Facility. The
cost of accepting tires as feedstock at a competitive rate may encourage shipment to the Clark
County Facility, offering another option to participating counties.
Tires as MSW
Tires, even though they are not a form of biomass, are another form of municipal waste and
could serve as an energy source. After contacting transfer stations in southeastern Idaho, it was
discovered that currently many transfer stations charge $3.00 - $5.00 to dispose of tires, with an
additional $1.00-$3.00 fee for removal of the rim. Larger tires, such as truck and farming
equipment have an additional fee for disposal, if they are accepted at all. Tire rims are placed in
the metal recycling and the tire is placed in the tire recycling. Tires in Southeastern Idaho are
then shipped to a plant in Salt Lake City, Utah to be shredded and used in making playground
equipment and high school or college tracks. Tires mixed with other waste will gasify at a higher
BTU content, thereby producing more electricity. (The analytical results from a tire sample are
provided in Appendix 1.)
Discarded tires are in abundance in the study area. A typical large commercial tire dealership
generates 600-800 waste tires per month. This does not include tires discarded by homeowners
or retreading businesses. A tire disposal and recycling business which processes tires for the
States of Oregon, Washington, California, and Idaho reported that it processed 10 million tires in
2008.9
Under Idaho Statute, Title 39 Chapter 65, Section 39-6508 - “PURPOSE. The state of Idaho
supports and encourages the reuse and recycling of waste tires. The legislature finds the
paramount public interest in regulating waste tires is to protect public health and safety. In
particular, the legislature is concerned with eliminating potential fire hazards; minimizing or
eliminating potential breeding grounds for disease-bearing insects; and eliminating potential
sources of surface and ground water contamination.”10
An excellent way to “recycle or reuse”
tires could be as use as fuel in a waste to energy facility.
8 http://www.environmentalistseveryday.org/docs/Tipping-Fee-Bulletin-2005.pdf
9 http://www.tiredisposal-recycling.com/DisplayPage.aspx?pageid=25
10 http://legislature.idaho.gov/idstat/Title39/T39CH65SECT39-6508.htm

12
Table 2
Bonneville County Tire Disposal Costs
Table 3
Madison County Tire Disposal Costs
Table 4
Fremont County Tire Disposal Costs
To aid in the encouragement of proper disposal of tires Clark County could offer the opportunity
for participating counties to have their tire waste gasified with their municipal waste. This would
increase the available BTU content of the waste and would decrease the cost of disposal for the
Counties.
Using MSW as a Feedstock
Municipal Solid Waste is abundant in the study area. Current practices include recycling of
materials at the county owned transfer stations, curb side recycling on a limited basis, and then
disposal of the remaining MSW at landfills. Fremont and Bonneville County still own and
operate their own landfills. Fremont County has two landfills, one in St. Anthony and one it
Island Park. The Island Park landfill is operated on land leased from the Targhee National Forest
and will be full in a few years. The St. Anthony landfill is sufficient capacity for the anticipated
need however, the landfill is unlined and the County is concerned about leachate from the
landfill entering into the ground water. Bonneville County has a robust landfill system and has
room for expansion for several years. Clark, Madison, Teton, and Jefferson all dispose of their
waste at the Jefferson County Landfill at Mud Lake Idaho. The current tipping fee paid by Clark,
Madison, and Teton Counties is $30.55 with an annual increase expected. This fee does not
include the cost of transportation from the individual counties to the landfill. Teton County
Tire Type Fee W/Rim Fee W/O Rim
Car, Lt Truck $8.00 ea $3.00 ea
Truck $11.00 ea $6.00 ea
Farm Implement $45.00 ea $40.00 ea
Earthmoving Equip N/A $100.00
Shredded tires N/A $250.00 ton
Tire Type Fee W/Rim Fee W/O Rim
Car, Lt Truck $4.00 ea $2.00 ea
Truck $15.00 ea $7.50 ea
Farm Implement $30.00 ea $15.00 ea
Earthmoving Equip $50.00 ea $25.00 ea
Tire Type Fee W/Rim Fee W/O Rim
Car $4.00 ea $2.00 ea
Lt. Truck $6.00 ea $3.00 ea
Truck $30.00 ea $15.00 ea
Farm Implement $50.00 ea $25.00 ea
Earthmoving Equip $80.00 ea $50.00 ea

13
estimates their total disposal fee at approximately $90/ton when the cost of their transfer station,
transportation to the landfill, and the landfill tipping fee are totaled together.
During the study the Counties met together to discuss options for disposal including partnering
on a Waste to Energy Facility. The limiting factor to the construction of a regional facility came
back again and again to the availability of the Counties to fund such a facility in light of the
Frazier Decision and the limits on long term contracting. A solution was discovered through
investigation of the Idaho Statutes. Under Idaho Code, Title 31 Chapter 49, Counties are allowed
to join together to form a regional solid waste district. The purpose of this district is to govern
and control the disposal of all municipal solid waste in the created district unless specifically
exempted by the Counties upon joining the district. The formation of the district also allows the
district to issue revenue bonds to defray the cost of operations and the construction of disposal
facilities without affecting the full faith and credit of the individual counties.11
A regional solid waste district was formed in June of 2010 with the Counties of Clark,
Bonneville, Fremont, and Madison participating. The District was named the Eastern Idaho
Regional Solid Waste District and was created solely for the purpose of the continued
examination of the feasibility of development of a waste to energy facility at the Centennial
Energy Park in Dubois Idaho. Creation document examples are provided in Appendix 1 of this
report. All creation documents are based on similar documents created by the Southern Idaho
Regional Solid Waste District located in Twin Falls, Idaho.
Another issue facing counties is the selection of a treatment option for MSW. Idaho Code also
offers assistance in that matter. Under Idaho Code Title 31 Chapter 45, Pollution Control
Financing, counties are allowed to bond for pollution prevention facilities and to also choose
technologies as sole or single source style procurement. This statute allows counties to examine
emerging renewable energy technologies which might also double as pollution control
facilities.12
For example, a waste to energy facility that diverts MSW from a landfill may be
seen as a pollution control solution.
A key element of financing a waste to energy facility is the need to provide revenue guarantees.
The basic elements of the revenue stream are the feedstock tipping fee and the power purchase
agreement. Without those two elements in place this is not a viable project. The need to have a
long term, i.e., 20 year waste contract is covered through county participation in the regional
waste district. The ability for a long term power purchase agreement is also provided for through
the waste district because the legislation specifically excluded waste districts from this
constitutional requirement.
11 http://www.legislature.idaho.gov/idstat/Title31/T31CH49SECT31-4901.htm 12 http://www.legislature.idaho.gov/idstat/Title31/T31CH45SECT31-4502.htm

14
WOODY BIOMASS
The feasibility of woody biomass as a feedstock was examined. Woody biomass is defined as the
by-products of forest management, restoration, and hazardous fuel reduction, including trees and
woody plants grown in the forest. There are several types of woody biomass. To thoroughly
study the feasibility of woody biomass all of the types will be addressed, as well as the benefits
and costs.
Biomass waste, including forest and logging residue, municipal waste, agricultural residue, and
animal waste accounts for 9% of the
energy used in Idaho. However, there is
not enough of this biomass in the state to
supply all the energy the state uses. As an
example, a typical 15 MWe power plant
would need to consume 8,000 bone dry
tons (BDT) per year per MW, or 120,000
BDT total of woody biomass for a 15
MWe Plant.
Woody biomass includes forest based
biomass, including thinning, slash, and
small diameter woods. Forest resources
are the major component in woody biomass feedstock. The six county study area lies between
two National Forests within a twenty-six to one hundred seventy mile radius. The Targhee-
Caribou National Forest occupies over 3 million acres in southeastern Idaho and the Salmon-
Challis National Forest occupies 4.3 million acres in east-central Idaho. In 2009 a stimulus bill
provided money for three forests in the greater Yellowstone region, including Targhee-Caribou
National Forest, to use the stimulus money for wildfire reduction and forest health.13
The use of
these resources as woody biomass would benefit the national forests, while assisting in President
Obama’s renewable energy stimulus plans.
Transportation/Hauling
Transporting woody biomass from the forests to Clark County would be possible, although a
limited mileage radius would allow for better transportation costs. Transportation research shows
that woody biomass shipped within an 80-100 mile radius would be more cost effective than
longer hauls, with an average cost of 0.15 per ton/per mile. With this average cost in mind the
ranger districts within a 102 mile distance from Dubois were examined, with an average distance
of 86.5 miles at a cost of 0.15 per ton a twenty five ton trailer load would cost $3.75 a mile, the
cost to transport the woody biomass from the forest would average $324 per load. Transport of
fuel wood via rail is 35% less than trucking on hauls averaging 80 miles or more according to
Union Pacific Railroad however, this does not include the rent of the individual cars.14
In the
scenario above this would save an estimated $113. In order to determine the best mode of
transportation, rail access to the area must be assessed. Clark County would only have rail access
to the Targhee woody biomass via St. Anthony. Eastern Idaho Railroad has a rail line from St.
Anthony through Rigby to Idaho Falls; Union Pacific Railroad has a rail line from Idaho Falls
13 http://wolves.wordpress.com/2009/02/19/bridger-teton-national-forest-quickly-moves-to-use-stimulus-money-for-anti-
conservation-logging/= 14 http://www.up.com/

15
through Dubois. A siding would need to be constructed at Dubois for off loading of any rail
shipment of biomass of any sort. Rail access in or out of Teton County was abandoned in 1990.
Possible sources of woody biomass would include, mill residues, which might be the lowest cost
woody biomass as the harvesting or logging cost have already been absorbed in the delivery to
the mill; logging residues, for example tree limbs, tree tops, etc.; and, small diameter woody
biomass removed from the forests as a method of fuel reduction.
Obtaining biomass from Forest
The estimated cost for obtaining biomass from forest fuel treatment thinning varies by the type
of treatment methods used. The cut and skid treatments estimated cost is $30 to $40/dry ton or
$6.20 to $8.30/MWH. “It increases slightly to $34 to
$48/dry ton or $7.00 to $9.90/MWH when the
cut/skid/chip method is adopted.”15
The average cost for delivered logging residues (with
a transport distance of 62 miles) is estimated to be
$33/dry ton or $6.80/MWH using the full cost
method.
The most commonly recognized types of woody
biomass are wood pellets or wood chips.
Chipping
Chipping has been around for a long time. Chipping is the most widely recognized usage of
woody biomass in biomass fuels. Wood chips are made from waste woods, wood residuals from
construction, agriculture, logging, foresting and sawmills. Chipping on site with a chipper, may
be less expensive than hauling the wood and then chipping.
The main advantages to wood chips are:
1. Wood chips are widely available,
2. Wood chips are a clean burning alternative to coal.
15
www.forestbioenergy.net/.../fact-sheet-6-2-the-economics-of-forest-biomass-production-and-use

16
Loading to Truck Costs (per Humbolt, UC Davis file) Cost $/BDT
Type Loading Hauling Grinding System Additional:
Hook Lift Truck &
Centralized Grinding
$6.30 $10.32 $16.22 $32.84*
Slash Bundling &
Hook-lift Truck &
Grinding
$2.99 $9.34 $17.97 $46.50* Bundling= $16.20
Dump Truck &
Centralized Grinding
$3.33 $6.91 $13.77 $24.01*
Logging Truck
hauling whole trees &
Centralized Chipping
$2.61 $6.29 $14.42 for
Chipping
$29.81* Fell/Shovel=$6.50
System cost does not include support cost, move-in cost, cost of employee transportation, cost of
transportation to market, or profit allowance.
Slash
Although leaving slash in the forest may be good for fertility, it provides a fire hazard
particularly in drier slopes, areas or seasons. In Idaho the landowner is required to reduce slash to
an acceptable level to release the landowner from liability for any forest fire throughout the
property. The types of slash that are recommended for removal is that which is smaller than three
inches in diameter, material which is larger than three inches (referred to as coarse woody debris)
is recommended to be left in place as it is less of a fire hazard and benefits wildlife.
A study done in 2008 for the Sierra Nevada Conservancy16
on Forest Biomass Removal on
National Forest Lands showed that a Biomass Boiler in Lincoln, California produced 4,652
MWH from 4,191 bone dry tons of slash from the Sierra Nevada. This would be close to the
average of 1 dry ton producing 1 MWH depending on moisture content. The slash consisted of a
combination of tree limbs, tops, small stems and other materials less than 3 inches in diameter
from a variety of tree types. The cost of this biomass to collect, process (slash was chipped at the
site) and transport from the project site was $58.43/bone dry ton with the current market price in
the central Sierra Nevada region being $30/bone dry ton. The cost of the project included the use
of two excavator/loaders, one water truck to keep down dust, three chipper vans, and one low
bed truck for hauling.
Slash Bundler
The John Deere Company completed a study in seven
different National Forests, including one in the Idaho
Panhandle and one in Missoula Montana, completed by
John Deer, using their 1490D Slash Bundler. The study
showed that the bundler operated on slopes up to 40%.
Production ranged from 6.5 bundles per hour to over 10
bundles per hour operating in the stand. Bundling of
slash piles neared 20 bundles per hour. The bundler has
the capability to produce 16’ bundles.17
There was a
16 http://sierranevadaconservancy.ca.gov/ 17
http://www.forestprod.org/biomass09mitchell.pdf

17
notice of some loose debris from the loads; transporting bundles in solid bins would confine the
material. These slash bundles have been processed as hog fuel in Idaho, Montana, Oregon, and
California. The John Deer 1490D Slash Baler has the capacity to bundle between 150 and 200
bales a day. An average bale weighs approximately 1000 pounds. The cost to haul the bales an
average of 50 miles is $6.50-$7.00 a ton.
A negative aspect to slash bundling is that the slash may contain soil and grit that preclude direct
use for energy and fuel generation. A positive aspect of slash bundling is that since the bales are
compressed and quite dense they can be stored as long as nine months and still retain 90 percent
of their energy value, unlike chips which decay and degrade in energy value if stored for several
weeks.
Urban Wood Waste
Urban wood waste is wood that includes; sawn lumber, pruned branches, stumps, and trees from
street and park maintenance. The primary constituents in waste stream are used lumber, trim,
shipping pallets, trees, branches, and other wood debris from construction, demolition, clearing,
and landscaping activities. The waste generated from this type of woody biomass represents a
significant portion of the solid waste stream and is
estimated to be 28 percent of total tonnage. Treated
wood waste may need to be managed using alternative
methods. Wood which has been treated with chemicals
to preserve it against insects, microbes, etc. will need
to be handled using Idaho guidelines for chemically
treated wood disposal.
Urban wood waste is largely used for engineered
woods, landscape mulch, compost, and biomass fuel.
All of these uses require processing; separating the
wood from other wastes, removing of contaminants and fasteners and then processing through
grinding or chipping. Demolition operations usually generate wood that is less desirable for most
of these uses as it includes other materials. The best use for this type of wood is in biomass
feedstock. The biomass facility would not need to purchase the urban wood and yard waste; a
tipping fee similar to municipal solid waste could be assessed. To use this type of wood waste as
a feedstock the facility would need to determine what to accept that would produce the energy
desired verses the cost, keeping in mind possible treated woods and the process to remove the
contaminants.
Mill Residue
Mill residue is byproducts such as sawdust, hog fuel, and wood chips from lumber mills,
plywood manufacturing and other wood processing companies. An example of a biomass to
energy plant that uses mill residue is in northeastern Washington. The
facility purchases approximately 350,000 BDT per year of residue from
mills and generates 46MW of electrical power. This facility has long-term
contracts with mills to supply biomass for the facility. The success of this
plant is its location in one of the most forested areas in the Pacific
Northwest.
Hauling costs vary with distance and/or mileage. Several studies were

18
examined to determine hauling costs. Prices ranged from $13.49/ton for course materials to
$33/dry ton for all forest residue/incorporating mill residue in with forest residue. As with all of
the other types of woody biomass it is essential to determine the distance and amount of residue
being transported to determine the overall cost effectiveness. There are several lumber
companies/sawmills/log home builders within a 91 mile radius of Dubois. Calls made directly to
these companies to determine if they would like to participate in the biomass facility by
providing their mill residue were not returned. There was very little interest as most sell their
residue to landscapers in the area.
Using Woody Biomass as a Feedstock
Woody biomass is an excellent renewable fuel however; access to the fuel in the study area is
limited because of current forestry practices on the Targhee National Forest. In discussion with
the Dubois District of the Targhee National Forest it was noted that Environmentalists have
essentially shut down all logging in the area. Furthermore there is very little private forested land
in the area. The study area is comprised primarily of high plain desert areas which have been
adapted to agricultural uses. Wood resources are limited to northern Clark and Fremont
Counties, eastern Teton and Madison Counties and southeastern Bonneville County. With the
exception of riparian lands there are no forested areas in Jefferson County.
The cost of acquiring and delivery of woody biomass to a regional waste to energy facility is
discussed at some length in the economic section of this study. While woody biomass is an
excellent fuel type the lack of availability makes the use of it as a renewable fuel impractical to
this particular study area, however, areas such as northern and central Idaho may find the
opposite and so for those markets further feasibility studies may be of value.

19
AGRICULTURAL WASTE
Agricultural waste is recognized as byproducts from agricultural or farming activities, the parts
of the plants not used in production or sale, and animal waste. Agricultural wastes include both
natural and non-natural wastes from the packaging or production process of agricultural
products. In this study the natural agricultural waste will be assessed including, livestock waste
or manures, and crop residues.
Animal Wastes as Biomass
Conversion of crop residues and livestock waste (LsW) makes good use of what would otherwise
be disposed of through landfill or land application. While land application is not necessarily a
poor use of animal waste it is highly regulated and may contaminate nearby surface or
groundwater. On average about 65% of these wastes are land applied. Livestock wastes are a
problem to the environment in areas of particularly large feedlots, dairies or other areas where
animals are concentrated in one location. There is increased pressure on local governments to
restrict the size of such facilities because of the accumulation of large amounts of LsW. This
waste is not only odorous, but is also thought to be polluting community water supplies.
Confined Animal Feeding Operations (CAFO) control by local governments has become an
extremely emotional and contentious topic. Current CAFO ordinances require that LsW be
applied to agricultural fields. This often requires CAFO operators to purchase land for no other
reason than land application of the waste. Further, this land application is increasingly suspected
to be linked to high nitrates in drinking water supplies. Use of LsW as a biomass renewable
energy feedstock could benefit the farming community to include; less livestock waste being
spread on fields, less livestock waste built up in piles, thereby resulting in less odor, and less
flies. Less land application also eliminates the concern of surface water and ground water
contamination from nitrates in the waste. Livestock waste does not have much economic value,
but rather is an economic liability to the
agricultural industry.
Removal costs are an estimated $0.348 per
cow/per day for a typical farm with a stanchion
barn.18
There are several benefits from manure
removal. One benefit realized by removing the
manure once a week is decrease in the need to
use insecticides. Although the use of insecticides
would not be eliminated the less frequent use
would slow the development of resistance to the insecticide by flies. Weekly removal of the
manure would also eliminate the odor caused by buildup of manure. In the six county study area
there are an estimated 21,033 head of cattle. The cost per cow/per day for removal of manure is
$7,319.00 for the six county area or $222,634 a month. Most farmers/ranchers are responsible for
the removal costs themselves leading farmers to land apply or sell manure at a minimal cost for
fertilizer to local residents for gardens or other farm land.
The average cost for the removal of manure from one cow is $127.02 a year/or $10.85 a month.
With a 100 cow dairy the cost of manure removal would only be $1085 a month which yields
18
www.ncbi.nlm.nih.gov/pubmed/2768644

20
very little financial incentive to the owner to process the manure or consider it as a biomass fuel
source.
Custom manure-hauling-spreading services in the Twin Falls area currently use a 10-ton truck
with an eight-foot spreader. Costs for these services include; loading, hauling and spreading at an
average of $19 per truck per load for a one mile round-trip.19
There is also an additional charge
of $1.50 per mile per truckload after the first mile. The average cost per ton for this service is
$1.90.
Hauling costs for manure normally are charged against the manure’s nutrient value. When
considered in this way the cost to haul manure more than a mile exceeds its value as a fertilizer.
However, this feasibility study is studying the use of animal waste as a form of biomass
feedstock therefore only the cost of hauling the manure will be considered. In most cases trucks
will be hauling a considerable amount of water, because of this custom haulers usually charge by
cubic yard rather than by weight. Charges for hauling manure may also be based on cost per
gallon, which averages between 0.8 cents to 1.5 cents/gallon or $7.00/per ton according to a
survey of Illinois commercial manure haulers20
.
Disposal in existing landfills in the study area is also occurring on a limited basis. Bonneville
County, Idaho has a landfill fee of $38.00 a ton for manure, hay, and straw. Madison County
only accepts old hay, straw, and rotten potatoes at their Construction and Demolition (C&D)
location and charges by the truck load for these types of agricultural waste. A pickup truck is
$10.00 a load, while a 6 wheeler truck is $15.00 a load, and a 10 wheeler is $20.00 per load.
Fremont County did not specify their charges for old hay, straw, and manure although they do
accept it in their landfill. Jefferson County did not specify a cost to dispose of manure or straw at
their landfill. Manure in Teton County is mixed with woods and used in processing compost at
their transfer station.
In order for manure to be a viable biomass fuel it would of necessity be dried. Dry manure,
manure which has been dewatered and allowed to dry for a week, can be better converted to
energy through the conversion process as the moisture content is lower. Manures with higher
moisture content would need to be dried through a heating process, adding an additional energy
consumption process before being used as renewable energy feedstock.
Crop Residue as Biomass
For Idaho growers the common removal method for crop
residue is through baling or open burning. The burning
method is used as a way to control disease, weeds and
pests. Such burning is conducted on approved “burn
days” and overseen with regulations, procedures and
registration for burning from the DEQ21
. Burning may
only be conducted in the fields where the crop residue
originated. Burning of old bales of hay or straw is
prohibited. While the burn may also improve yields for the next crop the occurrence of burns
getting out of control is an issue as well as the smoke from those burns. A report from the Bureau
19 Discussions with JMS, Jerome, Idaho 20 http://www.sweeta.illinois.edu/pdf/manure_haulers_applicators.pdf 21 http://www.deq.idaho.gov/air/prog_issues/burning/crop_residue_burning.cfm

21
of Land Management in April of 2008 stated that “so far this year, there have been numerous
burn escapes due to conditions too windy to keep the fire contained . . “ Fires such as this have
burned several acres of both public and private land, endangering residents and wildlife.
Grass/Straw farmers use the burn technique to remove crop residue even though chopping straw
has been demonstrated and proven to work equally well in two other states. These types of burns
have seen as much as 4500 acres burned on one day. Out of control burns and burns of large
amounts of land have forced the State of Idaho to make burn regulations even stricter in 2008.
Along with causing smoke, residents have seen smoke and ash blow across highways, homes,
golf courses, and bike trails. Hospitals have even reported smoke in their ventilation systems and
asthma sufferers are forced into emergency rooms.22
In response to these issues Clark County could receive crop
residue at their Waste to Energy facility. Harvested crop
residue is suitable as a feedstock. The six county area has a
total harvested area of 170,688 acres.23
The grains harvested
in these areas include barley, winter wheat, spring wheat
and oats; three of the counties also grow barley malt.
Winter and Spring Wheat produce between 75-83 bushels
per harvested acre; while Barley produces an average of 90
bushels per acre. Crop residue from these small grains
ranges between 45% and 80%. To estimate the availability
of crop residue the average in bushels per acre gives an average grain production of 82 bushels
per acre harvested, multiply the acres harvested for a total of 13,996,416 bushels of harvested
grain. The crop residue for a harvest of this size, at an average 62.5% (45% and 80% averaged)
would produce 8,747,760 bushels of crop residue. The total crop residue harvested multiplied by
the average crop residue weight of 40 lbs. per straw bale would equal 349,910,400 pounds or
174,955.2 tons of crop residue. As a feedstock the Clark County area produces a considerable
amount of crop residue.
An additional factor in using crop residue as a feedstock is the cost of harvesting the residue.
Crop residue, such as straw is often sold by the bale or ton. Straw that is baled in square or round
bales costs approximately $14 a ton to bale plus an additional $2.50 a bale to haul or stack in the
field.
Using Agricultural Waste as a Feedstock
Agricultural wastes, both manures and crop residues are feasible biomass fuels. Grain growers
especially, based on individual discussions, are open to providing crop residues in any form
required to processing. The limiting factors however, may be the amount of ash that is generated
through the conversion of crop residues in renewable energy plants.24
Because the difference in
density crop residues tend to generate more ash per ton than their biomass counterparts during
the combustion process.
The use of manures is problematic since the BTU content of dry manure is higher than all other
sources of biomass, the key requirement is dry. Manures must be dewatered and then dried
22 http://www.agri.idaho.gov/Categories/Environment/CropResidueDisposal/indexsmoke.php 23
www.city-data.com/county/Clark_County(or other County)-ID.html (for each of the six counties-then added together for total
number of acres). Information on grain production, bushels, etc. is from the associated city-data.com site for each county. 24 http://www.astm.org/Standards/E1755.htm

22
before being used as biomass fuel feedstock. The drying of the manure requires a thermal
process which may use as much energy as it creates. It would seem that farmers and ranchers
would be interested in paying to have manures removed. We did not find that to be the case in
our discussions with large CAFO owners it was evident that they considered the manure as a
possible energy source for their own operations. Many have already determined the need to
install anaerobic digesters at their facilities, capture methane, and fire generators to create
electricity to be used on site. Many CAFO’s in the Midwest are already using these practices as a
solution to their waste management problems.

23
TECHNOLOGY
Author’s Note:
Clark County Economic Development, through its consultants, Whisper Mountain
Professional Services, and Precision Systems Engineering (PSE), has examined over 200
differing types of Waste to Energy Technologies over the past 2 years. The deployment
cost for these technologies range between $5-7M per MWH capacity. Upon the
recommendation of the Director of the Idaho Department of Commerce the Clark County
Board of County Commissioners requested that Whisper Mountain and PSE examine
technology owned by Dynamis Energy LLC of Eagle Idaho. Clark County under separate
contract also requested that PSE conduct an independent engineering feasibility review
of the Technology including a visit to the operations of a waste conversion facility in
Barrow Alaska which uses an earlier version of the Dynamis Technology. Additionally
Clark County contracted with Whisper Mountain to complete a due diligence process on
their behalf on the technology and Dynamis Energy LLC. For sake of completeness the
summary of the technology is provided in this feasibility study. All operating costs used in
the following economic feasibility section of this report is based on the operations of the
Dynamis Energy 3.0 Waste to Energy Plant.
The Waste to Energy Industry seems to combine most thermal treatments by the use of heat to
treat MSW (waste) under the term incineration. Such processes under the term are vastly
different in their applications, costs, and benefits a brief explanation of the main thermal
technology classifications is presented below:
Incineration-mass burn technology at high temperatures, non efficient energy production
Gasification - process that converts carbonaceous materials, such as coal, petroleum,
biofuel, or biomass, into carbon monoxide and hydrogen by reacting the raw material at
high temperatures with a controlled amount of oxygen and/or steam
Pyrolysis - a form of gasification that chemically decomposes organic materials by heat
in the absence of oxygen that is unproven in large-scale applications.
The recovery of energy from MSW materials is already a well established technology. As the
price of oil and other energy resources rise, waste products have become a valuable resource that
can no longer be ignored. Many developing countries consider waste a renewable energy
resource with incentives in tipping fees and for energy recovery. Energy from waste not only
reduces the reliance on fossil fuels such as coal, oil, or gas, it also reduces the amount of land
used for landfills. MSW (waste) can be economically used to produce heat, electricity and other
usable energy forms for industrial and domestic use.
Recent advances in thermal technology have significantly improved the process of solid waste
disposal. With modern thermal processes, many types of waste can be safely and efficiently
handled, thus providing major benefits for both the waste producer and the environment. Energy
from MSW (waste) is possible using a waste to energy recovery system (plant). These power
plants practice municipal waste management, and use various methods to turn municipal solid
waste into renewable green energy. This can be done through different methods, including
incineration, gasification, pyrolysis, and anaerobic digestion. Waste to energy plants take waste,

24
which Americans create in enormous amounts, and create a renewable energy source that is not
harmful to the environment.
Municipal waste management has become even more important because many landfills are
becoming full, and a number of them have already closed. Traditional landfill methods involve
dumping municipal solid waste into pits in the landfill, and then burying the waste. This is not
effective municipal waste management, because the decomposing waste emits gases mainly in
the form of methane gas. It can take years or even decades for this waste to decompose
completely, if at all.
A waste to energy plant provides many benefits to the local community. Municipal waste
management can become a renewable energy source that is green and provides benefits to the
community. Municipal solid waste will be created, regardless of whether this waste is used in
waste to energy programs or not. Waste to energy plants can eliminate municipal solid waste in
an effective way, while generating much needed power at the same time. The economic rationale
and the expected rate of return to be generated are based on the following facts:
The present economic environment of many rural communities in the United States
requires a low cost solution to the ever-increasing sanitation and waste disposal
problems.
Rural communities’ energy resources are composed, largely, of potential solid fuels such
as agricultural wastes, forestry wastes, as well as industrial, municipal and medical
wastes.
Those resources have traditionally, rarely been put to productive use.
The increasing volume of municipal and industrial waste discharge is complicated by a
lack of cost-effective methods of waste disposal and insufficient financial resources to
deal with the implementation of modern environmentally sensitive solutions.
In view of these considerations as well as the reality of increasingly restrictive environmental
protection regulations, municipalities have relatively few alternatives that are as cost effective as
solid waste conversion to energy. Given the ever-increasing sanitary problems facing most
populated centers today, and the certainty of increasing energy costs and demand, the most
efficient, profitable, and environmentally sensitive conclusion is the construction of versatile
waste to energy plants.
Clark County’s Waste to Energy Project has chosen to utilize the Dynamis 3.0 Thermal
Conversion Technology because it is competitively priced, meets environmental requirements,
operates on a wide variety of feedstocks, and provides a methodology to divert municipal solid
waste from landfills.
Technology Benefits
Though there are several companies in the market who offer technologies that mass burn MSW.
These technologies typically require labor-intensive pre-handling of waste prior to treatment.
The Dynamis Energy technology with its custom scale abilities, simple design, and limited
amount of waste handling is unique in the market.

25
Dynamis 3.0 Thermal Conversion Technology
The two-stage process uses batch waste gasification and thermal combustion/oxidation. The
untreated solid waste is initially loaded into a primary chamber where it is thermally reacted
under starved oxygen conditions and transformed into burnable gases and ash. Unlike typical
thermal treatment methods, the gasification reactions occur at relatively low temperatures under
controlled conditions. This minimizes the production of airborne 'fly ash' particulates, carryover
of toxic metals, and NOx. The gasification process provides a 95% reduction by volume of the
waste. The remaining 5% is a sterile ash with minimal residual carbon. Metals and glass in the
waste stay with the ash in inert forms and can be recovered by conventional recycling methods.
To complete the process, the gases from the primary gasification chamber enter the secondary
combustion chamber where they are mixed with oxygen (taken from ambient air) and oxidized at
high temperature to complete the process. The energy from hot gas effluent is then recaptured in
the form of high temperature, high pressure steam.
The Dynamis process actively addresses many potential emissions problems such as particulates,
NOx, many toxic volatile metals, and dioxins/furans. The system incorporates either dry or wet
lime scrubbers or other emission abatement systems to neutralize acid gases and absorb other
dangerous by-products such as mercury, depending on the waste type destroyed.
Because the Dynamis system requires no pre-treatment of waste and has few moving parts, it has
many advantages over other thermal treatment systems. Its durable, simple design is easy to
Issue Dynamis Solution Competitors
Presort Waste No Presort
Required
Most require presort
and tipping floor
Dry, Grind, Prepare No waste
preparation required
Most require drying, grinding, or some
prep
High Energy Operating Requirements Self Sustaining Combustion Most use up to 30% of power generated for
plant ops
Stack Emission Equipment None required, may add
lime injection system
Most require expensive
stack emission equipment
Plant Scalability System easily scales,
given available space
Most require proper sizing
at initial construction
Proven Large Scale Capability Modular design
system is proven
Very few other than
mass burn incineration
Ash & Recyclables

26
install and operate. Once the system is loaded it requires minimal operator attention and thus has
lower labor costs. The modular design allows for flexibility in application to meet capacities
from 5 to over 2000 tons per day.
Waste Types
A listing of acceptable solid waste types is provided below:
Untreated Municipal Solid Waste (MSW)
MSW with organic fraction removed for composting
Biomass such as crop residues, manures, or small diameter wood
Medical wastes
Industrial wastes
Tires
Sewage sludge
Oily absorbent wastes
E-wastes

27
Dynamis 3.0 Thermal Conversion Process in Detail
Holding Bin/Conveyor to Primary
The process begins by loading municipal solid waste (MSW), directly from garbage trucks, into
the holding bins. Next the MSW, up to 1,000 tons per combustion cycle, can be moved by
conveyer into the Primary Gasification Chamber. A major benefit of the Dynamis process is its
ability to accept waste in many different forms. Unlike many systems, there is no requirement to
shred the waste. Waste materials can be accepted loose, bagged, baled, or on pallets. The system
can also accept a wide range of bulky items such as vehicle tires, mattresses, furniture, and
construction debris.
The Primary Gasification Chamber (PGC)
The process starts with untreated waste being bulk-loaded into the primary gasification chamber
(PGC) through a hydraulically operated door at the top or front of the chamber. In many waste
configurations, waste is charged into the PGC unit, and a carefully controlled flow of air is
introduced. Only enough air is provided to allow sufficient burning for heating to occur, typically
70 to 80 percent of the stoichiometric air requirement is introduced into the PGC. Due to the air
controlled (starved) environment, the MSW gasifies and is converted to a super rich syngas.
Gasification occurs in the PGC at relatively low temperatures of 450-550°C (800-1000°F),
converting the waste into gas and ash. The hot gases are then passed to the Secondary
Combustion System.
The Secondary Combustion System (SCS)
Once the hot gas is passed into the secondary combustion system (SCS) they are actively mixed
with oxygen (taken from the ambient air). This process is achieved by the use of a Turbulent Air
Ring which flashes (combusts) the mixture at temperatures of 1,800-2,000°F. The Turbulent Air
Ring and temperature assure that a rapid and thorough mixture of the super rich syngas and
oxygen is achieved providing optimum conditions for the combustion of all gases.
Boiler/Steam Production
The flame created by the Super Rich Gas/Oxygen combustion is directed through a high
temperature power boiler where water is converted into high-pressure steam. In most
installations the boilers will be configured as a fire tube, water tube, or scotch high temp high-
pressure firebox boiler of three-pass construction for highest thermal efficiency. It has an
extended retention time design that provides maximum furnace volume without excessive
refractory, plus increased radiant surface for maximum heat absorption. In many waste
configurations the construction of the boiler will be an integral part of the Secondary
Combustion System, making them one complete unit.
Energy Production
This high pressure steam generated from the boiler can be sold, used for industrial applications,
or directed through a power generation turbine creating electrical power that can be routed to the
local electrical grid. The Dynamis waste to energy facilities (electrical generation) can generally
provide electricity at a fraction of the cost of purchased power. In many installations, generation
packages can operate parallel with plant electrical systems to reduce or eliminate the cost of
purchase power. Where waste heat is available, boiler and generation systems are commonly
applied to recover exhaust heat and enhance return on investment for the owner.

28
Emissions Control Equipment
As noted above COMPLETE COMBUSTION of gases is not completely achievable, however it
is assumed that emissions out the stack are to be identical in content to the ambient/breathable air
of the atmosphere. Over the past 12+years, air quality tests have been run by independent third
parties. These 60+ tests have all determined that the Dynamis process meets and exceeds all state
and local government emission regulations based upon those guidelines published by the US
Government Environmental Protection Act.
Dynamis Energy’s Technology Air Testing Results
Results are from over 60 tests over the past 12+ years
250 TPD Typical Plant Layout
Contaminant Units Dynamis EPA California EU Ontario B.C.
Total Particulate Matter mg/m3 3.9 24 14 9 12 19
Hydrogen Chloride (HCI) mg/m3 .01491 37 27 9 19 69
Sulphur Dioxide (SO2) mg/m3 5.24 78 56 46 37 246
NOx expressed as NO2 mg/m3 62.09 282 202 183 207 344
Carbon Monoxide (CO) mg/m3 2.29 57 42 47 - 55
Mercury (Hg) mg/m3 .0000114 .080 .035 .046 .020 .19
Cadium (Cd) mg/m3 < .00001 .020 .007 .046 .014 .10
Lead mg/m3 .00000806 .2 .098 - .142 .049
Dioxins and Furans ng/m3 .553 13 9 .9 .040 .5

29
Process Logic Control System
All aspects of combustion and fuel feed are monitored and controlled by state-of-the-art logic, 3
times per second. This is especially important with the ever-changing combustion conditions of
biomass and waste fuels. The microprocessor analyses data from various inputs such as switches,
thermocouples, RTDs, an oxygen sensor to continually monitor exhaust and optimize air-to-fuel
mixture as well as signal when anything needs attention.
Reclamation
After a gasification cycle in the PGC, the remaining material (2- 5% of the original volume) can
be moved by conveyor belt where all recyclables are sorted and retained automatically. The end
by-product of the gasification process is inert fly ash, which has value in the marketplace and is
an important additive in concrete and cement based building materials thereby eliminating any
need for landfill use. Environmental Advantages and Performance
The Dynamis Energy 3.0 Thermal Conversion System process was designed using state of the art
processes and equipment which allows the system to achieve very low emissions and thus
eliminate the need for auxiliary scrubbers. Most standard systems will operate without using
downstream emissions abatement systems and still meet Environmental Protection Agency and
European Union standards, thus demonstrating the efficiency of the Dynamis Energy process.
The system has several design features that make it more environmentally compliant than other
thermal treatment technologies:
Once the waste is loaded into the primary gasification chamber, it is sealed, and the waste
is not moved or agitated as in other thermal processes. This means that during the
gasification process, the production of small particulates (fly-ash) is reduced
dramatically, thus reducing the emissions and minimizing the need for downstream
scrubbers or filters.
Prolonged exposure to temperatures in the primary chamber ensures that almost 100%
carbon burn-out is achieved.
The ash residue is nonhazardous and virtually inert, making it suitable for recycling.
Accurate mass flow and temperature control in both chambers is achieved automatically
through a Process Logic Controller (PLC). This allows the gasification process to be slow
and stable, thus avoiding high temperature fluctuations which can result in incomplete
combustion and NOx production. This also allows production of more consistent hot gas
flows for efficient energy recovery.
The low temperatures in the gasification stage allow light metals and alloys to remain
intact, although totally sanitized.
Turbulent mixing and retention of combustion gases in the secondary chamber with high
temperature ensure that the combustion process is fully completed.

30
Waste to Energy System Cost Estimate
Clark County MSW Waste to Energy Project
Facility Sized, process 250 tons day MSW, Wood Plastic and Rubber
Main System Components Quantity
Steam Generators 75,000 PPH capacity 2
Turbine / Generators 7.0 MW 2
TOS Combustion W / Secondary 8
Condenser/Condensate tank and pumps 2
Electric Transformer and Controls 2
Deaerators / Tank and Stand 2
Operating Control Panel 2
Pollution Equipment and Stack 2
Air Compressor and Drier 2
Economizer and Controls 2
Ash Handling and Storage 2
Main System Components Sub-Total: $19,481,384
Building and Miscellaneous
Power House Building
Cooling Tower with Fans
Roof Vents and Filters
Over Head Doors
Concrete and Labor
Fire Extinguisher
Building and Miscellaneous Sub-Total: $ 7,775,629
Electrical and PLC, Labor
Electrical Wiring, Harness, Controls
PLC Programming and Controls
Labor
Electrical and PLC, Labor Sub-Total: $ 3,104,155
Steel, Piping and Labor
Air System Piping
Boiler Set-up labor
Turbine / Generator set-up Labor
Steel, Piping and Labor Sub-Total: $ 2,907,199
Construction Services
Purchasing and Project Management
Watchman and Guard Service
Secretarial and Accounting
Construction Utilities
Subsistence and Travel
Construction Services Sub-Total: $ 1,723,400
Insurance, Legal, Permits, and Finance
Insurance, Legal, Permits and Finance Sub-Total: $ 929,500
Clark County Waste to Energy Project Total Cost Estimate: $35,921,267 (2010 Dollars)

31
Waste to Energy Site
The Eastern Idaho Regional Solid Waste District will own and operate the Clark County Waste
to Energy Plant. The Plant will be located at the Centennial Energy Park in Dubois Idaho, (see
figure below).
Waste to Energy Plant Site
32
The entire Energy Park is located on the east side of the City of Dubois and is zoned Industrial.
A building permit will be the only required local permit needed to begin construction. The water
and sewer services will be provided by the City of Dubois. Fiber optic cabling will be provided
to the site by the Mud Lake Telephone Cooperative. In the spring of 2010 an Economic
Community Development Block Grant was awarded to the City of Dubois by the Idaho
Department of Commerce to aid in the installation of roads, water and sewer services, and fiber
optic cable. The project is currently in the engineering stages. Additional infrastructure to be
installed includes the electrical substation and electrical distribution system. The conceptual
design for the electrical system was completed by Precision Systems Engineering through
funding from the Idaho Department of Commerce’s GEM Grant program. The Plant will provide
the funding for the substation as part of the interconnection with PacifiCorp. Additional revenues
will be required to complete the electrical distribution system.
Electrical power from the Plant will be sold to PacifiCorp under the PURPA Qualified Facility
program via an interconnection to the Dubois Substation operated for PacifiCorp by Rocky
Mountain Power. A 69 KV line will be installed between the Park and the Dubois Substation.
The line will be approximately 6 miles long and will cost an estimated $3.2M to construct. Once
constructed the line will be owned and maintained by Rocky Mountain Power in behalf of
PacifiCorp. The total cost of all interconnection activities including feasibility studies, impact
studies, and construction engineering will total an estimated $50,000.
Air Quality permits will be required by Idaho Division of Environmental Quality. A permit to
construct will be issued prior to Plant financing. Plant financing will be provided through the sale
of Revenue Bonds issued by the Eastern Idaho Regional Solid Waste District. It is anticipated
that the bond offering will be for approximately $50M. The repayment period will be 20 years at
an interest rate of 4%.

33
ECONOMICS
In today’s market there is a high probability of economic success when biomass is used in the
energy conversion process. The most promising of all of the biomass sources in municipal solid
waste. The average tipping fee for Municipal Solid Waste in the Western United States was
$37.74 in 200425
that number rose to $42.08 in 2008. Tipping fees in the subject area are
consistently lower than the national average however; they are competitive when using a
technology which can be deployed in the $3-4M/MWe range. For an example using Dynamis’
technology for a four county waste conversion facility designed to process 250 tons per day of
waste the annual estimated revenue stream is over $12 million. The revenue includes the tipping
fees associated with the waste disposal as well as a disposal fee for tires. The revenue stream also
includes revenue from the sale of electricity and the sale of recycled tires. In this scenario the
profit is shared between the host county, the operating contractor, and the four other partnering
counties in the Regional Solid Waste District in a private/public partnership. For example if a
County disposed of 20,000 tons of municipal solid waste a year and their tipping fees were
currently $30.55/ton, (the regional average) the annual savings for the County would be in excess
of $170,000 based on a tipping fee of $22/per ton at the plant plus a profit share of ~$436,000
which essentially covers the cost of disposal less the cost of transportation to the treatment
facility.
The Waste to Energy Facility would also plan to gasify 300+ tires a day, along with the 250 tons
of municipal solid waste. Current practices, described above, at County owned transfer stations
accept tires at an average cost per tire of $4.00; with an additional $1.00-$3.00 fee for removal of
the rim (tire costs are dependent on the tire size). Counties then pay to have their waste tires
hauled to Utah for recycling. An average truckload of tires shipped to the recycling plant in Salt
Lake City Utah costs a county $650. The Plant would process all tires delivered to the facility at
approximately 35% of the current costs yielding even more savings to counties.
Using livestock waste as a biomass fuel source does not yield the type of return that municipal
solid waste does. Livestock waste must be seen as a liability rather than a valuable feedstock.
The average value of livestock waste from one cow is $54.57 a year/or $4.54 a month if used or
sold as a fertilizer. This is before the expenses of loading, hauling, and spreading are deducted.
The cost of land application is slightly higher. The average cost of removal of livestock waste is
0.35 per cow/per day or $1.90 per to haul the
waste for one mile roundtrip, with an additional
$1.50 per mile after the initial roundtrip. In
Southern Idaho, custom haulers charge $28 per
load for a one mile roundtrip distance with a
truck capacity of eleven ton, the cost would be
28/11 totaling $2.54 per ton for the first mile.26
If this fee per mile were to stay at $2.54 the
average cost to haul livestock waste to the Clark
County facility from one of the participating counties would be $2.54/ton plus $1.5X67 miles
totaling $170.12 for a 28 ton load. The tipping fee would then be $6/Ton. When a dairyman faces
25
http://www.environmentalistseveryday.org/docs/Tipping-Fee-Bulletin-2005.pdf 26
http://www.extension.org/faq/37143
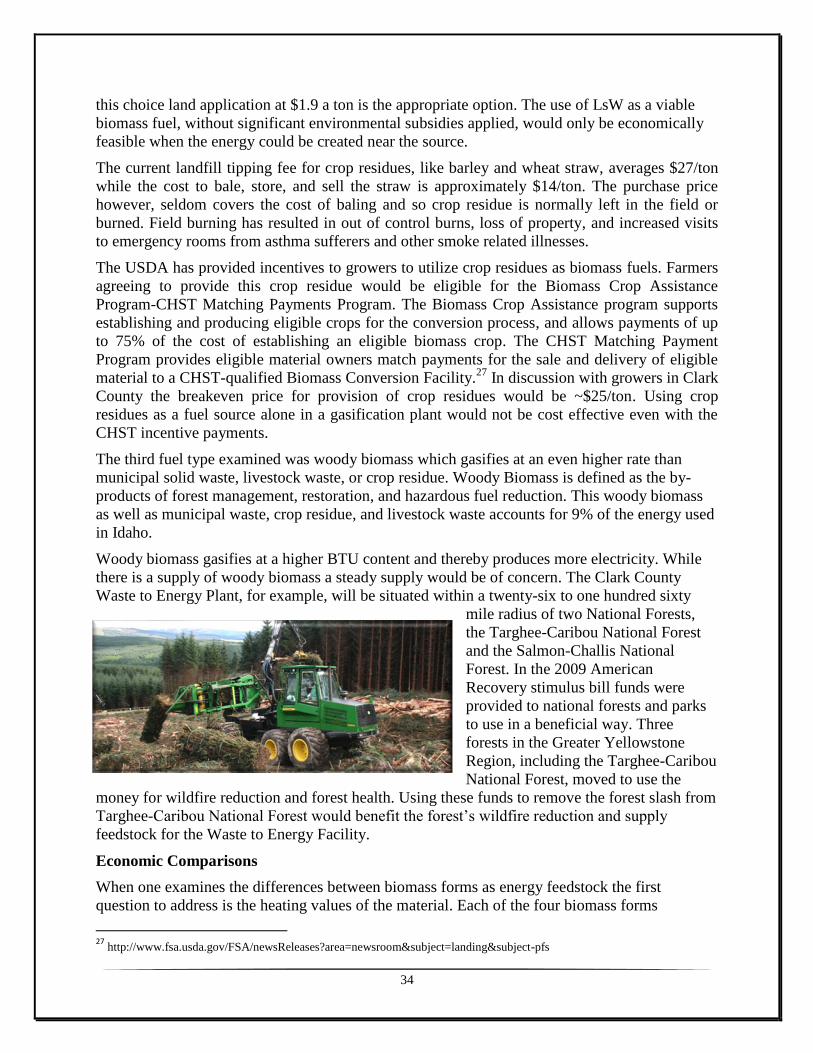
34
this choice land application at $1.9 a ton is the appropriate option. The use of LsW as a viable
biomass fuel, without significant environmental subsidies applied, would only be economically
feasible when the energy could be created near the source.
The current landfill tipping fee for crop residues, like barley and wheat straw, averages $27/ton
while the cost to bale, store, and sell the straw is approximately $14/ton. The purchase price
however, seldom covers the cost of baling and so crop residue is normally left in the field or
burned. Field burning has resulted in out of control burns, loss of property, and increased visits
to emergency rooms from asthma sufferers and other smoke related illnesses.
The USDA has provided incentives to growers to utilize crop residues as biomass fuels. Farmers
agreeing to provide this crop residue would be eligible for the Biomass Crop Assistance
Program-CHST Matching Payments Program. The Biomass Crop Assistance program supports
establishing and producing eligible crops for the conversion process, and allows payments of up
to 75% of the cost of establishing an eligible biomass crop. The CHST Matching Payment
Program provides eligible material owners match payments for the sale and delivery of eligible
material to a CHST-qualified Biomass Conversion Facility.27
In discussion with growers in Clark
County the breakeven price for provision of crop residues would be ~$25/ton. Using crop
residues as a fuel source alone in a gasification plant would not be cost effective even with the
CHST incentive payments.
The third fuel type examined was woody biomass which gasifies at an even higher rate than
municipal solid waste, livestock waste, or crop residue. Woody Biomass is defined as the by-
products of forest management, restoration, and hazardous fuel reduction. This woody biomass
as well as municipal waste, crop residue, and livestock waste accounts for 9% of the energy used
in Idaho.
Woody biomass gasifies at a higher BTU content and thereby produces more electricity. While
there is a supply of woody biomass a steady supply would be of concern. The Clark County
Waste to Energy Plant, for example, will be situated within a twenty-six to one hundred sixty
mile radius of two National Forests,
the Targhee-Caribou National Forest
and the Salmon-Challis National
Forest. In the 2009 American
Recovery stimulus bill funds were
provided to national forests and parks
to use in a beneficial way. Three
forests in the Greater Yellowstone
Region, including the Targhee-Caribou
National Forest, moved to use the
money for wildfire reduction and forest health. Using these funds to remove the forest slash from
Targhee-Caribou National Forest would benefit the forest’s wildfire reduction and supply
feedstock for the Waste to Energy Facility.
Economic Comparisons
When one examines the differences between biomass forms as energy feedstock the first
question to address is the heating values of the material. Each of the four biomass forms
27
http://www.fsa.usda.gov/FSA/newsReleases?area=newsroom&subject=landing&subject-pfs

35
discussed are sensitive to moisture content which greatly impacts the energy values. To ensure
consistent comparisons the higher heating value (HHV) for each biomass type is provided in the
figure below. Note that the highest BTU content is for dry livestock waste. The next best heating
value is for wood followed closely by municipal solid waste. This comparison could lead one to
believe that there is really very little difference in the heating values of biomass, while that
statement is true for dry biomass the challenge is how to reach a dry state. The amount of energy
required to dewater and dry livestock waste for example could be equal to the amount of energy
provided by the dried manure. The economic consideration then is the “dryness” or average
moisture content of the biomass.
The second comparison that must be made is the cost of the biomass, both to obtain and to
transport to the conversion facility. The figure below provides a comparison of cost of delivery
for the four biomass forms. Note that the cost of delivery for municipal solid waste is a negative
number compared to positive numbers for the three biomass forms. This is because waste to
energy conversion facilities would be paid to receive and treat the municipal waste where the
other forms are required purchases from the producers.
-30
-20
-10
0
10
20
30
40
MSW LsW Crop Residue Wood
Biomass Price Comparison
$/Ton
0
1000
2000
3000
4000
5000
6000
7000
8000
9000
MSW LsW Crop Residue Wood
BTU/LB
BTU/Ton

36
As the figure shows there is a significant cost difference between MSW and Woody Biomass. A
simple one day comparison of MSW versus woody biomass yields the following:
If a Waste to Energy Facility dedicated one full day a week to woody biomass
gasification as a backup feedstock it would require one dry ton of woody biomass to
produce 1.1 MWH of energy. Therefore, if the Waste to Energy Plant were to only use
woody biomass for one day it would require 13.2 tons of dry biomass to produce 12
mega-watts per hour or a total of 316.8 Tons of dry woody biomass. The average cost for
delivered logging residue, with a transport of 62 miles, is $33/dry ton. Therefore the cost
of the woody biomass required to produce 12 MWH over a 24 hour period would be
$10,454.40. The fuel cost to produce the power would be $36.30/MWH plus an operation
cost of $81.37/MWH for a total of $117.67 MWH. In comparison the cost per MWH for
MSW is $81.37 – $22.00 or $59.37 MWH a total difference over 24 hours of $16,790.40.
The example provided above clearly demonstrates that while all four forms of biomass are
feasible feed stocks for renewable energy projects the best option is obviously municipal waste
because of the fact that the delivery and acquisition price is subsidized by the county paid tipping
fees. Other forms could be used depending on the value of the power sales agreements. The sale
of electrical power from renewable energy sources is the main source of revenue for these types
of facilities. The power purchase price has to be sufficient to not only pay for the biomass feed
stock, but also cover all operational expenses.
Waste to Energy Operations Costs
The cost of operating a waste to energy facility was established for this study using the Dynamis
3.0 Waste to Energy Technology as the basis for operations. The following annual operations
costs were established.
Labor $1,809,000
Benefits $542,700
Employment Taxes $180,900
Workers Comp/Liability $30,000
Propane $48,000
Vehicle Fuel $150,000
Utilities $101,400
Chemicals and Compounds $120,000
Disposable Equipment $120,000
Waste Disposal $99,600 (non-biomass waste streams)
Equipment Leasing $360,000
Equipment Replacement $180,000
Facility Insurance $336,480 (includes liquidated damages for power not produced)
Technical Oversight Fee $240,000 (Dynamis technical oversight)
Contingency $600,000
SUBTOTAL $4,918,080
Debt Service $3,635,880
TOTAL ANNUAL COSTS $8,553,960
With an annual operations cost of $8,553,960 the average cost per MWH is $81.37. If the fuel or
feed stock acquisition costs are added as with the example of woody biomass presented above

37
the average cost per MWH could raise above $117.00/MWH. In order for this type of project to
be feasible electrical power purchase prices would of necessity be greater than $120.00/MWH.
In Idaho the Idaho Public Utility Commission sets the electrical power prices under PURPA. For
a non-fueled small generating facility, i.e., less than 10 MWh or 10 mega-watt hours average
monthly net sold, the price per MWH for a 20 year contract with a delivery date commencing in
2012 is $85.71.
The following chart demonstrates an annual budget for a 250 TPD Municipal Solid Waste to
Energy Facility using the Dynamis Energy 3.0 Technology. The facility would produce 12
MWH with a parasitic load of 2 MWH and a net sold under PURPA to PacifiCorp of 10 MWH.
The budget also provides for sale of recycled metals and for the disposal of 300 tires per day at
the facility. The net annual profit is estimated as $2,394,312.
Community Economic Impact
A local community Economic Impact Analysis on the Clark County Waste to Energy Plant was
conducted in September 2009 by Timothy L. Solomon, the Executive Director of the Regional
Development Alliance. The complete analysis report is included in this study as Appendix 2.
Clark County Site Proforma 19-Oct
250 TPD or 10000 TPYDistrict Ownership/Clean Mt. Ops Jan Feb Mar April May June July August September October November December Total
Based on 10000 tons MSW /yr 10% unable to be used/recycled(dirt,cement,other)
Revenue
Tipping Fees $22 183,333 183,333 183,333 183,333 183,333 183,333 183,333 183,333 183,333 183,333 183,333 183,333 2,199,996
Recycle ($110/ton) 123,750 123,750 123,750 123,750 123,750 123,750 123,750 123,750 123,750 123,750 123,750 123,750 1,485,000
Sale of Recs 10 MWe @$1.25 MWH 0 0 0 0 0 0 0 0 0 0 0 0 0
Tires 300 PD @ $2.00 18,250 18,250 18,250 18,250 18,250 18,250 18,250 18,250 18,250 18,250 18,250 18,250 219,000
Sale of Electricity at 10 aMWe @$85.71 MWH 625,683 625,683 625,683 625,683 625,683 625,683 625,683 625,683 625,683 625,683 625,683 625,683 7,508,196
Ash Sales @ 50/ton 7% Ash 0 0 0 0 0 0 0 0 0 0 0 0 0
Total Revenue
Electricity Production 951,016 951,016 951,016 951,016 951,016 951,016 951,016 951,016 951,016 951,016 951,016 951,016 11,412,192
(Tons) 100000 100000 100000 100000 100000 100000 100000 100000 100000 100000 100000 100000
Expenses
Bond servicing 20 Year 50,000,000 at 4.0% 302,990 302,990 302,990 302,990 302,990 302,990 302,990 302,990 302,990 302,990 302,990 302,990 3,635,880
Facility Insurance 66,700 66,700 66,700 66,700 66,700 66,700 66,700 66,700 66,700 66,700 66,700 66,700 367,000
Insurances Worker Comp/Liability) 2,500 2,500 2,500 2,500 2,500 2,500 2,500 2,500 2,500 2,500 2,500 2,500 30,000
Management Salaries 50,000 50,000 50,000 50,000 50,000 50,000 50,000 50,000 50,000 50,000 50,000 50,000 600,000
Labor Wages 100,750 100,750 100,750 100,750 100,750 100,750 100,750 100,750 100,750 100,750 100,750 100,750 1,209,000
Social Security and Unemployment Taxes @10% 15,075 15,075 15,075 15,075 15,075 15,075 15,075 15,075 15,075 15,075 15,075 15,075 180,900
Benefits/ 30% of wages 45225 45225 45225 45225 45225 45225 45225 45225 45225 45225 45225 45225 542,700
Propane 4,000 4,000 4,000 4,000 4,000 4,000 4,000 4,000 4,000 4,000 4,000 4,000 48,000
Vehicle Fuel 12,500 12,500 12,500 12,500 12,500 12,500 12,500 12,500 12,500 12,500 12,500 12,500 150,000
Utilities 8,450 8,450 8,450 8,450 8,450 8,450 8,450 8,450 8,450 8,450 8,450 8,450 101,400
Chemicals and Compounds 10,000 10,000 10,000 10,000 10,000 10,000 10,000 10,000 10,000 10,000 10,000 10,000 120,000
Disposable Equipment and Supplies 10,000 10,000 10,000 10,000 10,000 10,000 10,000 10,000 10,000 10,000 10,000 10,000 120,000
Waste Disposal 8,300 8,300 8,300 8,300 8,300 8,300 8,300 8,300 8,300 8,300 8,300 8,300 234,000
Equipment Acquistion/Leasing 30,000 30,000 30,000 30,000 30,000 30,000 30,000 30,000 30,000 30,000 30,000 30,000 600,000
Dynamis/Clean Mountain Energy Oversight 20,000 20,000 20,000 20,000 20,000 20,000 20,000 20,000 20,000 20,000 20,000 20,000 240,000
Equipment Replacement 15,000 15,000 15,000 15,000 15,000 15,000 15,000 15,000 15,000 15,000 15,000 15,000 180,000
Contingency 50,000 50,000 50,000 50,000 50,000 50,000 50,000 50,000 50,000 50,000 50,000 50,000 600,000
Total Expense 751,490 751,490 751,490 751,490 751,490 751,490 751,490 751,490 751,490 751,490 751,490 751,490 9,017,880
Profit/Loss 250 TPD 199,526 199,526 199,526 199,526 199,526 199,526 199,526 199,526 199,526 199,526 199,526 199,526 2,394,312

38
CONCLUSION
The purpose of this study has been to determine if there are suitable biomass feedstocks in the
area to operate a renewable energy facility at the Centennial Energy Park and whether or not the
operations would be feasible both from a technology and revenue generation basis. The answer
to this question is a qualified yes. While there is more than sufficient feedstocks the real question
is whether or not those feedstocks can be acquired over a long period of time at a reasonable
cost.
Of the four biomass forms reviewed MSW is the most viable feedstock for a waste to energy
facility. The cost of acquisition of the MSW would almost always be subsidized by a tipping fee.
The idea of assessing a tipping fee for other forms of biomass is not viable. Crop residues and
woody biomass are both viable as feedstock sources however, the cost of harvesting and
shipping makes them unviable as a feedstock when compared to the subsidized MSW. The use of
manures or livestock waste as a feedstock may be financially viable in some locations, but only
if there was a market condition that allowed for a tipping or disposal fee. The cost of drying
manure is also a liability.
The problem with long term MSW acquisition is sufficiently addressed by Title 31, Chapter 49
of Idaho Code. The Code provides for the creation of a regional solid waste district. There are
two critical benefits that this legislation provides; 1) the code allows for the creation of a regional
waste district for the sole purpose of the disposal of all municipal solid waste in the participating
counties and governs the disposal practices for those whom participate, and 2) allows for funding
of facilities and operations dedicated to waste disposal through revenue bonding without
attaching the liability to the tax payers. Clark County used this provision as discussed above to
partner with three other counties to form the Eastern Idaho Regional Solid Waste District. The
formation of the District provided for a long term supply of municipal solid waste feedstock and
also allowed for financing of a waste to energy facility without encumbrance of the tax revenues
of the participating counties.
The Eastern Idaho Regional Solid Waste District has committed to construct a Waste to Energy
Plant at the Centennial Energy Park. The Plant will process 250 tons per day of MSW using the
Dynamis 3.0 Technology. The Plant will cost approximately $40M and will be financed using
revenue bonds issued on behalf of the District. The facility will add 32 full time jobs to the area
paying an average wage of $22/hr with benefits. Additional symbiotic users of energy are also
examining the option of co-locating with the waste to energy plant to use by products such as
low pressure steam, hot water, and ash.
The information gathered regarding crop residues and woody biomass has not gone unnoticed by
others who have a desire to place facilities at the Energy Park. Recently the Regional Manager
for the Great Plains, the Camelina Company, made contact with Clark County. Great Plains has a
desire to construct a Camelina Seed press facility at the Energy Park. They would purchase low
pressure steam from the Waste to Energy Plant to heat the seed prior to pressing. Additionally
they are interested in purchasing biomass, either woody or crop residues, to run in their
methanol/ethanol processes. These types of inquires provide hope that a robust biomass market
will emerge in the eastern Idaho region.

39
This
Page
Intentionally
Blank

40
APPENDIX 1: EASTERN IDAHO REGIONAL SOLID WASTE DISTRICT
DOCUMENTS

41
BYLAWS OF THE:
Eastern Idaho Regional Solid Waste District
23rd
Day of June, 2010
ARTICLE I
Name
Section 1.1. The name of the district shall be the Eastern Idaho Regional Solid Waste
District (hereinafter referred to as the “District”). The District was created pursuant to Section
31-4903, Idaho Code; by resolution of the boards of commissioners of Clark, Bonneville,
Madison, and Fremont Counties, Idaho and is now composed of the counties of Clark,
Bonneville, Madison, and Fremont Idaho.
ARTICLE II
Board of Directors
Section 2.1. The property, business, powers, and affairs of the District shall be managed
and controlled by the board of directors thereof (the “Board”). The Board is vested with all
powers as provided in Title 31, Chapter 49, Idaho Code, as the same exists or may hereafter be
amended.
Section 2.2. The Board shall consist of a number of directors determined in accordance
with the provisions of Section 31-4904, Idaho Code, with one (1) commissioner from each
participating county serving as a Board member.
Section 2.3. Directors shall receive no compensation for their services, but shall be
entitled to reimbursement from the District of their necessary expenses, including travel and per
diem expenses, incurred in the discharge of their duties.
Section 2.4. Each director shall hold office for a two-year term or until his or her
successor has been appointed and qualified, but in no event for a term greater than his or her
term of office as commissioner of the participating county appointing him or her. A certificate of
the appointment or reappointment of a director shall be filed with the secretary of the Board, and
such certificate shall be conclusive evidence of the due and proper appointment of such director.
Section 2.5. The qualifications and eligibility of persons to serve on the Board shall be as
defined and described in Section 31-4904, Idaho Code, as the same now exists or may be
amended hereafter.
Section 2.6. The Board shall hold regular meetings without additional notice at the
District Offices, (address) in Dubois , Idaho, on the last Wednesday of the month at the hour of
1:00 p.m. or such other time and place as may be determined by the Board and included as an
amendment to these Bylaws.
Section 2.7. The President or a majority of the Board shall have power to call special
meetings of the Board, the object of which shall be submitted to the Board in writing; the call
and object, as well as the disposition thereof, shall be entered upon the minutes of the Secretary.

42
Special meetings may be held upon three (3) days’ notice. The notice provided in this section
may be dispensed with in the event a special meeting is called to deal with an emergency matter,
such as one involving injury or damage to persons or property or the likelihood of such injury or
damage. The only item to be discussed at such emergency meetings shall be the matter for which
the meeting is called. Attendance by any director; in person or by proxy at such special meeting
shall be deemed a waiver of any right to notice of such meeting.
Section 2.8. A majority of the members of the Board present at duly noticed meeting in
person or by proxy shall constitute a quorum for the purpose of conducting business and
exercising the powers of the District and for all other purposes. Notwithstanding the provisions
of Idaho Code 31-4904, official action may be taken by the Board only upon the affirmative vote
of at least three (3) members thereof present in person or by proxy at a duly convened regular or
special meeting at which a quorum is present, except as otherwise specified in these Bylaws.
Section 2.9. The Board, by majority vote of the full Board, may employ an Executive
Director, technical experts, legal counsel, waste operations contractor, and such other agents and
employees, permanent and temporary, as the Board may require, and the qualifications and
duties of and compensation for all of said persons so employed shall be determined by the Board.
Section 2.10. Any vacancy on the Board shall be filled by the commissioners of the
county originally appointing the director whose office has become vacant.
Section 2.11. A member of the Board shall be entitled to have his or her vote cast by
proxy, provided, however, that the only person entitled to cast such proxy shall be a member of
the Board of Commissioners of the county in which the absent District board member resides. In
order for a vote to be cast concerning a decision to be made by the Board, such vote must be cast
in person at a meeting of the Board.
ARTICLE III
Officers
Section 3.1. The Board shall elect a President and Vice President from among its
members, and shall appoint a Secretary and Treasurer, who need not be a director. The Offices of
Secretary and Treasurer may be combined in one person.
Section 3.2. The Board shall elect the foregoing officers and such other officers as are
deemed necessary for a term of one (1) year and until his or her successor is duly elected and
qualified. Such elections shall occur at the regular meeting held in June. Officers elected at that
meeting shall hold office until the regular meeting the following June.
Section 3.3. The President shall be the chief presiding officer of the District. The
President shall execute all deeds, bonds, contracts, leases, and other legal documents authorized
by the Board. The President shall also have such other powers and duties as may be assigned to
him or her by the Board.
Section 3.4. The Vice President shall be possessed of all the powers and shall perform the
duties of the President in the absence or disability of the President. The Vice President shall have
the power to vote on any matter presented to the Board for its consideration. The Vice President
shall also have such other powers and duties as may be assigned to him or her by the Board.
Section 3.5. The Secretary shall keep the minutes of all proceedings of the Board; shall
attend to giving and serving all notices of meetings of the Board as required; shall execute with

43
the President in the name of the District all deeds, bonds, contracts, leases, and other legal
documents and instruments as authorized by the Board, and shall be the custodian of the District
seal, books, bylaws, and such other books, records, and documents of the Agency as the Board
shall direct. In addition, he or she shall perform other duties and have such responsibilities as
may be designated by the Board. In case of the absence or disability of the Secretary or his or her
refusal or neglect to perform such duties, all duties required of the Secretary may be performed
by the President or Vice President or such other person as may be designated by the Board.
Section 3.6. The Treasurer shall have the general custody of all the funds and securities
of the District and shall have general supervision of the collection and disbursement of funds of
the District. He or she shall endorse on behalf of the District, for collection, checks, notes, and
other obligations and shall deposit the same to the credit of the District in such bank or banks or
depositories as the Board may designate. He or she may sign, with the President or such other
person or persons as may be designated for said purpose by the Board, all negotiable
instruments. He or she shall enter or cause to be entered regularly in the books of the District full
and accurate account of the District; shall at all reasonable times exhibit the District books and
accounts to any director of the District at the office of the District during regular business hours;
and, whenever required by the Board or the President, shall render a statement of his or her
accounts. He or she shall perform such other duties as may be prescribed from time to time by
the Board or by the bylaws. The Treasurer shall, before entering upon his or her duties; give
bond for the faithful performance of his or her duties in such sum and with such surety as shall
be approved by the Board.
Section 3.7. If any of the foregoing offices shall, for any reason, become vacant, the
Board shall elect a successor who shall hold office for the unexpired term.
Section 3.8. Consistent with section 2.9 hereof, the Board may appoint an Executive
Director or other administrative officer for the District. The Executive Director or other
administrative office shall be the chief administrative officer of the District, shall serve at the
pleasure of the Board, and shall have such powers and duties as may be assigned him or her by
the Board. In addition, the Board may authorize the Executive Director to appoint such other
administrative officers as it deems necessary, all of whom shall serve at the pleasure of the
District, and shall have such powers and duties as may be assigned to them by the Executive
Director.
ARTICLE IV
Miscellaneous
Section 4.1. The seal of the Eastern Idaho Regional Solid Waste District shall be circular
in form and shall have the name of the District on the circumference and shall have the words
“Corporate Seal” in the center.
Section 4.2. The Board may appoint one or more committees to investigate and study
matters of District business and thereafter to report on and make recommendations concerning
said matters assigned to the Board. When possible, each of said committees may be comprised of
persons other than members of the Board. No such committees shall have the power to make
final District decisions, that power being vested solely in the Board. The term of office, the
persons serving, the matters to be studied and all procedural decisions relating to the functioning
of such committees shall be made and decided by the Board.

44
Section 4.3. In addition to such bank accounts as may be authorized in the usual manner
by resolution of the Board, the Treasurer, with the approval of the President, may authorize such
bank accounts to be opened or maintained in the name and on the behalf of the District as he or
she may deem necessary or appropriate. Payments from such bank accounts are to be made upon
the check of the District, each of which checks shall be signed by two of such directors, officers,
or bonded employees of the District as shall be authorized by the Board.
Section 4.4. The rules contained in the current edition of Robert’s Rules of Order, Newly
Revised, shall govern regular and special meetings of the Board in all cases to which they are
applicable and in which they are not inconsistent with these Bylaws and any special rules of
order which the Board may adopt.
Section 4.5. No director or employee of the District shall voluntarily acquire any personal
interest, direct or indirect, in any project or property of the District or in any contract or proposed
contract in connection with such project or property.
Section 4.6. Other counties that are not participating counties as of the date of adoption
hereof may be included in the Eastern Idaho Solid Waste District upon the affirmative vote of
two-thirds (2/3) of the full Board, and upon such terms and conditions as are imposed by the
Board in its sole and absolute discretion.
Section 4.7. All budget receipts to be tendered to the District in any calendar year shall be
payable in an amount not less than one-half (1/2) on or before the fourth Monday of January and
the balance to be paid on or before the fourth Monday of July.
Section 4.8. The permissible service area of the District shall include all lands, including
municipalities, contained within the counties of Clark, Bonneville, Madison, and Fremont unless
specifically exempted by the waste flow control agreement entered into by the participating
counties with the District.
Any additional area proposed for service outside of the counties designated in this paragraph 4.8
may be included in the District service area only upon the affirmative vote of two-thirds (2/3) of
the Districts entire Board, which two-thirds (2/3) affirmative vote must include the affirmative
vote of the Director who represents the county in which the proposed expanded use is located. In
the event that the Director who is a representative of such county does not cast an affirmative
vote, or in the event that the affirmative vote of two-thirds (2/3) of the entire Board of the
District is not obtained, such expansion shall be disallowed.

45
ARTICLE V
We, the undersigned, being all of the members of the Board of Directors of the Eastern Idaho
Regional Solid Waste District, do hereby certify that the foregoing Bylaws were duly adopted as
the Amended and Restated Bylaws of said District on the 23rd
day of June, 2010.
____________________________________
William Fredriksen
Clark County
____________________________________
Lee Staker
Bonneville County
____________________________________
Jon Weber
Madison County
____________________________________
LeRoy Miller
Fremont County
I, the undersigned, secretary of the Eastern Idaho Regional Solid Waste District, hereby certify
that the foregoing Bylaws were duly adopted as the Bylaws of the District on the 23rd
day of
June, 2010.
____________________________________
Kerri Ellis
Secretary

46
RESOLUTION 2010 -
WHEREAS, Clark County is a political subdivision of the State of Idaho charged with the
responsibility for establishing, maintaining and operating a solid waste disposal system pursuant to Idaho
Code 31-4401, et seq.; and
WHEREAS, the legislature of the State of Idaho has found and declared, pursuant to Idaho Code
31-4901, et seq. (the “Act”) that the disposal of solid waste within the State of Idaho is an important
public purpose, and that the creation of independent regional districts to administer solid waste disposal is
an efficient and cost-effective method of meeting the state’s solid waste disposal needs; and
WHEREAS, the Act has been adopted in order to enable counties to establish regional solid waste
districts for the purpose of providing a regional solution to the problem of solid waste disposal through
the operation and maintenance of a regional solid waste system; and
WHEREAS, Clark County deems it in its best interest to participate with the counties of
Bonneville, Madison, Teton, and Fremont, in the establishment of an independent public body corporate
and politic to be known as the Eastern Idaho Regional Solid Waste District (“District”), as more
specifically set forth in 31-4903 of the Act; and
WHEREAS the participating Counties aforementioned have deemed it appropriate to create this
District to further investigate the technical and financial feasibility of constructing a District owned waste
to energy facility to be located in the Centennial Energy Park in Dubois, Idaho; and
NOW, THEREFORE, BE IT HEREBY RESOLVED that Clark County hereby elects to become
a participating county with Bonneville, Madison, Teton, and Fremont Counties in the establishment of the
Eastern Idaho Regional Solid Waste District (the “District”) in accordance with the terms and provisions
of the Act.
BE IT FURTHER RESOLVED that Clark County hereby appoints
_________________________, one of its commissioners, to serve on the Board of the District.
BE IT FURTHER RESOLVED that Eastern Idaho Solid Waste District will be immediately
dissolved if the waste to energy project is not deemed both technically or financially feasible as
determined by a professional bond underwriter employed by the District and that Clark County nor any of
the participating counties can or will be held liable for any debts or financial claims of the Eastern Idaho
Solid Waste District.
Dated this ___ day of _________________, 2010.
_________________________________
_________________________________
ATTEST
______________________ _________________________________
County Clerk
47
Eastern Idaho Regional Solid Waste District Agreement
FLOW CONTROL ORDINANCE
AN ORDINANCE REQUIRING THE DEPOSIT OF ALL SOLID WASTE GENERATED
WITHIN THE BOUNDARIES OF THE COUNTY AT THE COUNTY’S TRANSFER
STATION(S) OR, ALTERNATIVELY AT THE CLARK COUNTY WASTE TO ENERGY
FACILITY; DEFINING TERMS; ESTABLISHING PENALTIES; AND PROVIDING FOR AN
EFFECTIVE DATE.
WHEREAS, Idaho Code Title 31 Chapter 44 imposes the primary responsibility for the
establishment of solid waste disposal sites on the counties of the State of Idaho, and
WHEREAS, ___________ County has elected to become a member of the Eastern Idaho
Regional Solid Waste District in order to fulfill duties imposed upon it by law regarding solid
waste, and
WHEREAS, the Eastern Idaho Regional Solid Waste District, through its Board of Directors, has
established a regional waste to energy facility at the Centennial Energy Park in Dubois, Idaho,
and
WHEREAS, the Eastern Idaho Regional Solid Waste District, through cooperation with its
member counties, has identified transfer stations within the boundaries of each county whereby
solid waste may be delivered before finally being transported to the Clark County Waste to
Energy Facility, and
WHEREAS, the Eastern Idaho Regional Solid Waste District has, through its Board of Directors,
established a budget to defray the cost of its operation, and
WHEREAS, the money necessary to conduct the operations of the District are generated through
means authorized by Idaho Code Section 31-4404, and
WHEREAS, a significant portion of the revenue of the District is derived from “tipping” fees
which are fees collected for the deposit of solid waste at either a transfer station or the Clark
County Waste to Energy facility, and
WHEREAS, the budget of the Eastern Idaho Regional Solid Waste District assumes that the
solid waste generated within the boundaries of this County will be delivered to either the
designated transfer station or the Clark County Waste to Energy Facility in order that the
county’s share of the budget of the Eastern Idaho Regional Solid Waste District may be realized,
and
WHEREAS, for purposes of protecting the public health, providing for protection of land, water
and air resources to facilitate the ability of the Eastern Idaho Regional Solid Waste District to be
adequately financed and discharge its duties with regard to the disposal of solid waste, it is
necessary that the County control the disposition of solid waste generated within its boundaries,

48
BE IT THEREFORE ORDAINED by the Board of County Commissioners of ____________
County, a political subdivision of the State of Idaho as follows:
Section 1. Definition of Terms:
For purposes of this ordinance:
A. “Solid Waste” shall have the meaning set forth in Idaho Code Section 39-7403(50) as
it now exists or as it may hereafter be amended.
B. “Regional Solid Waste District” means the Eastern Idaho Regional Solid Waste
District formed and existing under the provisions of Idaho Code Section 31-4901, et seq.
C. “Board of Directors” means the duly elected and serving Board of Directors of the
Eastern Idaho Solid Waste District.
D. “Transfer Station” means any transfer station officially identified as such within the
boundaries of _____________ County by action of the Board of Directors at the Eastern Idaho
Regional Solid Waste District.
E. “Regional Waste to Energy Facility” means the Waste to Energy Facility owned by the
Eastern Idaho Regional Solid Waste District in Clark County, and any additional landfill site
owned or leased by the Eastern Idaho Regional Solid Waste District approved by the Idaho
Department of Environmental Quality.
Section 2. Deposit of Solid Waste.
All solid waste generated within the boundaries of ___________ County shall be
deposited or collected exclusively at a transfer station located within the boundaries of the
County or at the Regional Waste to Energy Facility.
Section 3. Deposit of Certain Waste at Regional Waste to Energy Facility.
At the direction of the Eastern Idaho Regional Solid Waste District, designated types of
solid waste shall be deposited directly at the Regional Waste to Energy Facility and not at a
transfer station. Such types of solid waste may include but not be limited to, those types of solid
waste that have a high degree of potential for impact on human health or damage to property or
which may require sophisticated inspection or handling prior to final disposition.
Section 4. Payment of Fees.
Every person or entity depositing solid waste at a transfer station or at the Regional
Waste to Energy Facility shall pay an appropriate fee established by the resolution of the
___________ County Board of Commissioners. The fee shall be payable at the time the solid
waste is deposited.

49
Section 5. Penalty.
Any violation of this ordinance shall be a misdemeanor, punishable by a fine not to
exceed Three Hundred Dollars ($300.00), imprisonment in the county jail for a period not to
exceed six (6) months or both. Each individual act of failing to properly deposit solid waste or
failure to pay the appropriate fee shall constitute a separate offense under this ordinance.
Section 6.
This ordinance shall become effective upon its passage and publication as provided by
law.
PASSED BY THE ____________ COUNTY BOARD OF COUNTY
COMMISSIONERS THIS ___ DAY OF ____________, 2010.
BOARD OF COUNTY COMMISSIONERS
____________________________________
Chairman
____________________________________
Commissioner
____________________________________
Commissioner
ATTEST:
________________________
Clerk

50
SOLID WASTE DISPOSAL AGREEMENT
ARTICLE I
ACCEPTANCE AND COSTS
Section 1.01. Acceptance of Solid Waste.
The District agrees to accept all solid waste delivered to a transfer station or stations or
other solid waste disposal or resource recovery site or sites operated by the District in the County
except hazardous waste. The District shall not be obligated to receive any material that is not
solid waste. All solid waste received by the District pursuant to this Section shall be considered
to be received by the District from the County. The District shall properly dispose of all solid
waste received by it from the County.
Section 1.02. Solid Waste Disposal Charges.
(a) The District shall establish as a part of its budget for each fiscal year of the District (a
“Fiscal Year”) rates, fees and charges (“Solid Waste Disposal Charges”) for the receipt of
disposal of solid waste by the District, including the estimated total amount of Solid Waste
Disposal Charges required to be received in such Fiscal Year (the “Annual Solid Waste Disposal
Charges”) from each participating county. The Annual Solid Waste Disposal Charges shall be
sufficient, together with electrical production and other revenues received by the District, to
cover the District’s costs and expenses for such Fiscal Year, including but not limited to a
reasonable operating reserve and any other reserves considered appropriate by the District in its
discretion, and to provide any reasonable operating margin that the District in its discretion
determines to be required for it to operate on a fiscally sound basis. At no time shall the total
amount of revenue removed from the District funds in direct payment to the participating
counties exceed thirty (30%) percent of the gross revenues even if a higher revenue to expenses
ratio exists. If the gross revenues to expenses ratio (net profit) exceeds thirty five (35%) percent
the Annual Solid Waste Disposal Charges will be reduced to meet the goal of 30%.
(b) The County shall pay to the District, for the receipt from the County by the District of
Solid Waste and the disposal of such solid waste, Solid Waste Disposal Charges which shall be
the portion of each Annual Solid Waste Disposal Charge allocated by the District to such solid
waste in accordance with this Section (the “County’s Solid Waste Disposal Charges”). In
determining Solid Waste Disposal Charges and in making such allocation, the District may
(i) Base Solid Waste Disposal Charges and such allocation on weight or volume
of solid waste received for disposal.
(ii) Establish categories of solid waste that may be received and charge different
Solid Waste Disposal Charges and allocation for various kinds of solid waste
received, such as tires and sewer sludge.
(iii) Establish separate Solid Waste Disposal Charges and allocations for Solid
Waste received by it at transfer facilities owned by or leased to the District and
for solid waste received by it from transfer facilities owned by counties and others
delivering waste to the District.
(iv) Take into account such other factors and may make such other decisions as it

51
in its discretion deems appropriate.
The allocation to the County for solid waste received by the District from the County during each
12-month period ending on a December 31 (a “Disposal Period”), together with all allocations to
other counties and others with whom the District has contracted for the receipt of solid waste
(“Contracting Sources”) for the Fiscal Year that includes such December 31, shall equal the
Annual Solid Waste Disposal Charges for such Fiscal Year (after deduction of any Solid Waste
Disposal Charges budgeted to be received from noncontracting customers during such Fiscal
Year).
(c) The District shall establish its budget for each Fiscal Year in accordance with Section
31-4907 of the Act. No later than each April 15, the District shall determine the projected
amount of the County’s Solid Waste Disposal Charges for the Disposal Period ending on the
immediately following December 31 by any methodology adopted by the District and may base
such determination upon the solid waste received by the District from the County and from other
Contracting Sources in the immediately preceding Disposal Period. The County shall pay one-
half of said projected Solid Waste Disposal Charges for such Disposal Period semiannually on
the fourth Monday in January during such Disposal Period and the remaining one-half of said
projected County Solid Waste Disposal Charges on the fourth Monday in July immediately
following such Disposal Period.
(d) Within 30 days after the end of each Disposal Period, the aggregate County Solid
Waste Disposal Charges for the solid waste that was received by the District from the County
during such Disposal Period shall be determined by the District based on allocation of the
Annual Solid Waste Disposal Charges (after deduction of any Solid Waste Disposal Charges
received or budgeted to be received from noncontracting customers during the then current
Fiscal Year) of the solid waste received from the County and the solid waste received from other
Contracting Sources in such Disposal Period. In the event said aggregate County Solid Waste
Disposal Charges
(i) are in excess of the projected County Solid Waste Disposal Charges paid by
the County for such Disposal Period pursuant to the preceding paragraph (c) , or
(ii) are less than the projected County Solid Waste Disposal Charges that have
been paid by the County pursuant to the preceding paragraph (c),
the amount to be paid by the County during the immediately succeeding Fiscal Year shall be
adjusted accordingly; provided that upon the termination of this Agreement pursuant to Section
1.02, the County shall pay any such excess County Solid Waste Disposal Charges, as
appropriate, within 90 days after the termination of this Agreement.
(e) The District’s determination of its budget, Solid Waste Disposal Charges, Annual
Solid Waste Disposal Charges, the projected and actual County’s Solid Waste Disposal Charges
and other amounts related to this Agreement shall be binding upon the County.
(f) To the extent permitted by law, the County shall pay the District a delinquency
charge on any Solid Waste Disposal Charges not paid when due pursuant to this Agreement,
which delinquency charge shall be equal to the amount of said Solid Waste Disposal Charge due
times a daily accrual charge for the number of days said Solid Waste Disposal Charge is

52
delinquent computed at the rate of 12% per annum or the maximum rate permitted by law,
whichever is less.
(g) All Solid Waste Disposal Charges payable by the County shall be paid for the
account of the District to __________ Bank, ______________, Idaho (or another bank
designated by the District in a written notice to the County) acting as a depository for District
funds for payment for deposit into an account maintained by the District with said bank for the
receipt of District funds.
(h) The County’ obligations to pay Solid Waste Disposal Charges are in consideration
for the receipt of solid waste delivered by the County to the District. The obligation of the
County to pay Solid Waste Disposal Charges for solid waste received from the County by the
District is absolute and unconditional without abatement, deduction, set-off, counterclaim,
recoupment or defense, or any right of termination or cancellation. Nothing in this Section shall
be construed as a waiver by the County of any rights or claims the County may have against the
District under this Agreement or otherwise, but any recovery upon such rights or claims shall be
had from the District separately.
Section 1.03. Covenants of the County.
(a) The County shall not acquire, construct or operate, or continue the operation of, any
landfill site or any facility for the recovery of resources or the disposal of solid waste after a
waste to energy facility of the District is operational unless agreed herein. The County shall take
all actions necessary to require that all solid waste collected within the County be delivered to
the District’s Waste to Energy Facility or Facilities.
(b) The County agrees to obtain, budget and appropriate sufficient funds from sources
legally available to it, including but not limited to the sources set forth in Section 31-4404 of the
Idaho Code, to pay the Solid Waste Disposal Charges under this Agreement.
(c) Insert Specific exemptions as requested in this section -
ARTICLE II
EVENT OF DEFAULT AND REMEDIES
Section 2.01. Default by the County.
(a) If the County fails to pay any installment of the Landfill Closure Charge or any Solid
Waste Disposal Charge when the same is due and such failure continues for 45 days after
the District has given the County notice of such failure, the District may exercise any one
or more of the following remedies:
(i) Refuse to accept any further solid waste from the County until such time as
all installments of the Landfill Closure Charge due hereunder, all Solid Waste
Disposal Charges due hereunder and any delinquency charges due hereunder have
been paid in full.
(ii) Commence and pursue an action seeking payment for all sums due hereunder
together with all costs of the District in prosecuting said action and pursuing
remedies hereunder, including without limitation attorney’s fees.

53
(iii) Take any other action at law or in equality to enforce the rights of the
District under this Agreement.
(b) In the event the County shall fail to perform any of its other obligations hereunder
and the County does not cure such failure within 30 days after the District has given the
District written notice of such failure (or, if such failure cannot be cured during such 30-
day period, such longer period as is acceptable to the District in its discretion), then the
District may take any available action at law or in equity to enforce its rights hereunder.
Section 2.02. Default by the District.
In the event the District shall fail to perform any of its obligations hereunder and the
District does not cure such failure within 30 days after the County has given the District written
notice of such failure (or, if such failure cannot be cured during such 30-day period, such longer
period as is acceptable to the District in its discretion), then the County may take any available
action at law or in equity to enforce its rights hereunder.
ARTICLE III
REVENUE SHARING
Section 3.01 Payments.
Revenues generated by the operations of the Waste to Energy Conversion Facility shall
be determined by the ratio between the revenue generated from all sources over expenses
included debt and operating contract incentive payments. The annual budget shall reflect a goal
of a net positive ratio of not less than 30% and not more than 35%. Revenues shall be shared as
follows:
a) Waste to Energy Facility Operation Contractor twenty (20%) percent
incentive payment
b) Waste to Energy Conversion Facility host county forty percent (40%) of the
remaining eighty (80%) percent
c) Other participating counties will split sixty (60%) of the remaining eighty
(80%) percent based on their percentage of the waste dispose of at the facility.
The revenues shall be paid within 45 days upon successful completion of the fiscal year.
ARTICLE IV
CONDITIONS
Section 4.01. Term.
This Agreement shall be effective for a term commencing with its execution and delivery by the
parties hereto and ending on December 31, 2032, unless extended expressly by a written
instrument executed by both parties hereto. The obligations of the County and the District to
make any payments under Section 1.01(d) with respect to such Disposal Period shall survive
expiration of the term of this Agreement.

54
Section 4.02. Governing Law.
This Agreement shall be governed by and construed in accordance with the laws of the State of
Idaho.
Section 4.03. No Personal Liability.
All liabilities of the parties under this Agreement are solely liabilities of the County and the
District, and no commissioner, director, officer, employee or agent of the County or the District
shall have any personal individual liability under this Agreement.
Section 4.04. Binding Effect.
This Agreement shall inure to and be binding upon the County and the District and their
respective successors and assigns.
Section 4.05. Entire Agreement
This Agreement is a final expression of the agreement between the parties hereto and such
agreement may not be contradicted by evidence of any prior oral agreement or of a
contemporaneous oral agreement between the parties hereto. No unwritten oral agreement
between the parties exists.
Section 4.06. Amendments.
This Agreement may not be effectively amended, changed, modified, altered, or supplemented
except with the written consent of both the County and the District. Any waiver of any provision
of this Agreement or any right or remedy hereunder must be affirmatively and expressly made in
writing and shall not be implied from inaction, course of dealing or otherwise.
Section 4.07. Notices.
Any notices required or permitted under this Agreement shall be sufficient if same is duly mailed
by registered or certified mail, postage prepaid, and addressed as follows:
(a) If to the County:
(b) If to the Eastern Idaho Regional Solid Waste District:
55
IN WITNESS WHEREOF, the parties hereto have entered into this Agreement
as of the day and year first above written.
Eastern Idaho Regional Solid Waste District
By: _________________________________
President
(SEAL)
ATTEST:
________________________
Secretary
56
APPENDIX 2: CLARK COUNTY COMMUNITY ECONOMIC IMPACT
ANALYSIS

CLARK COUNTY, IDAHO WASTE TO ENERGY PLANT: Economic Impact Analysis --- November 2009 Prepared By: Timothy L. Solomon Executive Director Regional Development Alliance, Inc. 2300 North Yellowstone Idaho Falls, ID 83401

2
TABLE OF CONTENTS Introduction Page 3 Scope of Analysis Page 4 Study Area Data Page 5 Economic Impact – 250-‐Ton Plant:
Construction Phase – Employment Compensation and Household Spending Impacts Page 11 Construction Phase – Plant Construction Activities Impacts Page 13 Construction Phase – Combined Impacts of Employment Compensation/Household Spending and Plant Construction Activities Page 14 Operations Phase – Introduction Page 14 Operations Phase – Employment Compensation and Household Spending Impacts Page 15 Operations Phase – Plant Operations Impacts Page 16 Operations Phase – Combined Impacts of Employment Compensation/Household Spending and Plant Operations Activities Page 18
Economic Impact – 500-‐Ton Plant: Introduction Page 20 Construction Phase – Employment Compensation and Household Spending Impacts Page 20 Construction Phase – Plant Construction Activities Impacts Page 21 Construction Phase – Combined Impacts of Employment Compensation/Household Spending and Plant Construction Activities Page 22 Operations Phase – Employment Compensation and Household Spending Impacts Page 23 Operations Phase – Plant Operations Impacts Page 24 Operations Phase – Combined Impacts of Employment Compensation/ Household Spending and Plant Operations Activities Page 26

3
INTRODUCTION
A tri-‐party agreement is being considered for a waste to energy plant in Clark
County, Idaho. The partnership consists of both public and private entities including
Clark County.
The plant would use gasification technology rather than incineration to
convert waste typically headed for landfills into electricity. Waste would come
through contracts with surrounding counties and cities. The process employs a
patented technology for receiving and combusting the waste and creating the steam
to run an electric generator. Estimates place the amount of waste available in a 12
county area at more than 300,000 tons of waste produced annually.
Two initial plant sizes are being considered. The first is a 250-‐ton plant that
would produce approximately 12 MW of electrical power. The second is a 500-‐ton
plant that would produce approximately 24 MW of electrical power. One MW of
power is generally assumed to power 400 – 900 homes depending on residential
usage. The plant would be designed to easily expand to 4,000 tons.
This analysis considers only the economic impacts of a 250-‐ton plant and a
500-‐ton plant in Clark County, Idaho. No consideration of additional availability of
electricity to county residents has been considered in the study as the independent
power producer is a wholesaler and will be selling to utilities. Residents will
continue buying their power directly from the utilities.
The revenue model for the plant owners would be structured around four (4)
sources:
1. Power sales
2. Sale of recyclables
3. Tipping fees
4. Alternative energy subsidies and credits

4
SCOPE OF ANALYSIS
This analysis has been conducted at the request of Clark County Economic
Development. The analysis considers only impacts to Clark County, Idaho.
Clark County is a rural county located in the southeastern portion of Idaho.
The county sits approximately 1.5 hours from Yellowstone National Park on the
northeast, 50 miles from Idaho Falls, Idaho (Bonneville County) on the south, and
borders Montana on the north.
Two (2) plant sizes were considered in the analysis: 250-‐ton per day and
500-‐ton per day. Both plant sizes are assumed to require 12 months to construct
with additional workers required on the 500-‐ton plant to complete within the
allotted time.
The construction of the 250-‐ton plant was assumed to require 150 full-‐time
equivalent workers while the 500-‐ton plant was assumed to require 250 full-‐time
equivalent workers. Construction of the 250-‐ton plant is budgeted at $30 million
while the 500-‐ton plant is anticipated to be exactly double at $60 million.
The analysis assumes a 25-‐year operating timeframe for the plant regardless
of size. The 250-‐ton plant is anticipated to require 35 employees including
management. The 500-‐ton plant is anticipated to require 43 employees including
management.
Waste receipts, energy production and revenue are assumed constant
although typical plant operations will see variations in all three throughout a 25-‐
year period. Of course, this is not a revenue analysis for the plant but an economic
impact analysis based on employment, production and local purchasing. In order to
properly account for variations in the out-‐years, output and GDP deflators have
been used.
All models have been developed and analyzed using IMPLAN V3 and 2008
datasets.

5
STUDY AREA DATA
As mentioned earlier, Clark County is a rural county located in southeastern
Idaho. Total land area is 1,765 square miles. Gross Regional Product (GRP) was
$50,527,301 in 2008. Table 1 shows components of GRP.
Table 1 - COMPONENTS OF GROSS REGIONAL PRODUCT FOR CLARK COUNTY, IDAHO
Employee Compensation $27,115,125 Proprietor Income $4,594,938 Other Property Type Income $15,935,110 Indirect Business Taxes $2,882,128 TOTAL GROSS REGIONAL PRODUCT $50,527,301.00
Total personal income during 2008 was $35,596,940. There are 367
households in the study area with an average household income of $96,994. Please
note, however, that the real average is going to be lower than the $96,994 due to in-‐
commuters who come to work in the county. Data on actual household income for
resident vs. non-‐resident personal income are unavailable.
The total number of people employed in the county in 2008 was 1,087 while
the total 2008 population was estimated at 910 people. Various agricultural
concerns in the county attract in-‐commuters from at least two surrounding counties
thus accounting for the number employed vs. the population. There are a total of
60 industry sectors accounted for in Clark County. Table 2 – Clark County, ID
Industries, Relative Employment, Output & Compensation provides a comparison
across Clark County industries for employment and allied characteristics.
One of the concerns for county officials is that a large potato processing plant
recently announced plans to close and dislocate 70 local employees. It is hoped that
the construction and operation of the waste to energy plant will employ a portion of
the dislocated workers. Of course, diversity in employment is important to any
given study area. By using the Shannon-‐Weaver Diversity Index (a tool designed to
measure diversity in and among wide-‐ranging elements) as an economic indicator

6
Table 2 - CLARK COUNTY, ID INDUSTRIES, RELATIVE EMPLOYMENT, OUTPUT & COMPENSATION (Ranked by Employment)
INDUSTRY TYPE EMPLOYMENT OUTPUT EMPLOYEE COMPENSATION
Food Processing 104 $53,084,512 $5,323,321 Cattle Ranching & Farming 89 $6,852,637 $1,555,159 Grain Farming 83 $4,294,782 $315,785 Employment Services 69 $1,897,607 $1,108,215 Real Estate 62 $2,460,633 $0 State & Local Government Education 57 $2,474,352 $2,184,596 Federal Government (Non-‐Military) 55 $5,058,977 $4,453,605 Auto Repair 50 $2,185,712 $0 State & Local Government (Non-‐Education) 44 $1,399,997 $1,236,053 Wholesale Trade 39 $5,923,698 $2,162,953 Business Support Services 39 $2,219,710 $826,382 Religious Organizations 33 $4,072,208 $418,150 Individual and Family Services 30 $824,586 $291,686 Personal Care Services 27 $887,080 $124,367 Fitness & Recreational 23 $543,221 $11,624 Retail Stores – Food & Beverage 21 $845,510 $355,507 Performing Arts 19 $483,079 $0 Vegetable and Melon Farming 15 $2,103,962 $825,508 Auto Equipment Rental & Leasing 15 $2,064,765 $0 Support Activities for Ag and Forestry 15 $423,948 $50,218 All Other Misc. Professional, Scientific & Tech. Services 16 $3,584,036 $374,997 Retail Stores – Gasoline Stations 15 $710,372 $199,596 Food Services & Drinking Places 14 $599,497 $24,445 Private Household Operations 13 $85,631 $74,719 Insurance 13 $2,217,937 $1,049,989 Other State & Local Government Enterprises 12 $2,281,943 $222,471 Other Basic Organic Chemical Manufacturing 12 $27,411,624 $917,811 Telecommunications 10 $3,402,827 $370,453 Hotels/Motels 8 $567,180 $101,461 Construction 8 $899,884 $251,623 Private Educational Services 8 $622,802 $283,753 Transport by Truck 6 $795,690 $296,228 Relay & Industrial Control Manufacturing 6 $1,911,219 $316,715 Retail Stores – Clothing 6 $216,047 $68,205 Couriers & Messengers 5 $26,420 $0 Community Food, Housing & Other Relief Services 5 $139,819 $74,993 Other Information Services 5 $2,218,091 $338,389 Specialized Design Services 4 $438,839 $80,068 Federal Government – Military 4 $244,669 $167,022 Computer Systems Design Services 3 $214,163 $137,471 Retail Stores – Misc. 3 $98,378 $45,492 Amusement (arcade, candy machines, etc.) 3 $288,125 $28,932 Oil/Natural Gas Services 3 $1,257,630 $0 Monetary Authority and Depository Credit 3 $690,923 $188,254 Custom Computer Programming Services 2 $149,542 $60,814 U.S. Postal Service 2 $150,453 $94,769 Animal Production Except Cattle, Poultry and Eggs 2 $59,372 $28,568 Retail Stores – Motor Vehicles & Parts 1 $11,340 $0 Retail Non-‐stores – Direct and Electronic Sales 1 $13,379 $0 Retail Stores – Sporting Goods, Hobby, Book and Music 1 $8,339 $0 Personal and Household Goods Repair and Maintenance 1 $30,307 $0 Maintenance & Repair of Non-‐Residential Structures 1 $90,414 $45,999 Commercial & Industrial Machinery and Equipment Repair 1 $90,408 $28,759 Commercial Hunting & Trapping 1 $98,220 $0 TOTALS 1087 $151,726,496.00 $27,115,125.00

7
tool we find that Clark County has an index of 0.55915. An index of 1.0 would
assume that the same numbers of people are employed in each industry found
within the study area. Anything less than 1.0 shows decreasing diversity or, in other
words more people employed in one industry than another. A greater diversity is
desired in order to decrease the possibility of employment losses within an area.
When building the model, it was necessary to “add” the industry sector
“electric power generation, transmission, and distribution” to the study area as that
industry is not currently present. Upon adding the industry to other industries
already present in the study area, the Shannon-‐Weaver Diversity Index improved to
0.56453. The addition of the industry is a good example of how diversity improves
as additional industries are added to the area.
Table 3 – Labor Income Per Worker by Industry, shows relative comparisons
of how specific industries contribute to the economy through labor income.
Components of labor income include employee compensation and sole proprietor
income. In addition, Table 3 shows the top industries located in Clark County
relative to total employment and output. Keep in mind that the food processing
industry is being impacted with the closure of the largest plant and will impact the
county negatively.
It is important to note that Table 3 includes the addition of “electric power
generation, transmission, and distribution” in order to offer a comparison of labor
income to other industries currently located in Clark County.
Table 4 shows the top 10 segments in demand by households in Clark County
along with the relative amounts paid by households to the various segments
annually. Note that rental housing is the segment most in demand, and the segment
“medical and diagnostic labs and outpatient services” is number 10.
Table 5 compares the number of households by income level for the study
area.

8
Table 3 - LABOR INCOME PER WORKER BY INDUSTRY (Ranked Highest to Lowest Labor Income)
INDUSTRY TYPE LABOR INCOME PER WORKER
Electric Power Generation, Transmission, and Distribution $90,158 Insurance $83,776 Federal Government – Non-‐military $80,855 Other Basic Organic Chemical Manufacturing $79,926 Vegetable and Melon Farming $71,178 Monetary Authorities and Depository Credit $71,041 Other Information Services $68,498 Management, Scientific, and Technical Consulting $61,871 Computer Systems Design Services $60,125 Wholesale Trade $56,207 Food Processing $53,323 Relay and Industrial Control Manufacturing $52,831 Transport by Truck $48,523 Oil & Natural Gas Services $47,929 Maintenance & Repair of Non-‐Residential Structures $47,795 U.S. Postal Service $47,778 Construction $35,349 Custom Computer Programming Services $32,113 Misc. Professional, Scientific and Technical Services $29,881 Commercial and Industrial Machinery and Equipment Repair $29,248 State & Local Government – Non-‐Education $28,332 Support Activities for Ag and Forestry $27,395 Business Support Services $26,461 Automotive Equipment Rental and Leasing $24,613 Hotels/Motels $19,230 Other State & Local Government Enterprises $18,852 Employment Services $17,942 Cattle Ranching & Farming $17,690 Retail Stores – Food and Beverage $17,158 Amusement $16,879 Retail Stores – Misc. $16,252 Community Food, Housing and Other Relief Services $15,588 Retail Stores – Gasoline $14,149 Religious Organizations $13,648 Auto Repair and Maintenance $12,907 Personal Care Services $12,063 Retail Stores – Clothing $11,956 Food Services & Drinking Places $11,903 Individual and Family Services $10,954 Commercial Hunting & Trapping $10,029 Fitness & Recreation $4,834

9
Table 4 - HOUSEHOLD COMMODITY/SERVICE DEMAND, CLARK COUNTY, IDAHO
COMMODITY/SERVICE AMOUNT SPENT BY HOUSEHOLDS ANNUALLY Rental Services of Owner-‐Occupied Buildings $177,146 Private Hospital Services $70,014 Physicians, Dentists, Other Healthcare $54,637 Restaurant, Bar and Drinking Places Services $50,797 Insurance $47,131 Wholesale Trade Distribution Services $27,879
Higher Education $24,591
Retail Services – Food & Beverage $23,469
Retail Services – General Merchandise $20,676
Medical & Diagnostic Labs and Outpatient Services $19,860
Table 5- HOUSEHOLDS BY INCOME CATEGORY
HOUSEHOLD INCOME CATEGORY NUMBER OF HOUSEHOLDS Less Than $10,000 Per Year 48 $10,000 to $15,000 Per Year 35 $15,000 to $25,000 Per Year 67 $25,000 to $35,000 Per Year 52 $35,000 to $50,000 Per Year 116 $50,000 to $75,000 Per Year 32 $75,000 to $100,000 Per Year 14 $100,000 to $150,000 Per Year 1 $150,000 or More Per Year 2
TOTAL 367
Understanding local supply and demand for various services/commodities is
important to understanding how economies are impacted with changes in dollar
and trade flows. Table 6 expresses the percentage of local demand for key
commodities/services that is satisfied by local producers/providers. In other
words, the Table shows the percent of local demand that is satisfied by local
producers for any given commodity.

10
Table 6 - PERCENT LOCAL DEMAND SATSIFIED BY LOCAL SUPPLY FOR ANY GIVEN COMMODITY
COMMODITY/SERVICE PERCENT LOCAL SUPPLY
Commercial & Industrial Machinery & Equipment Repairs and Maintenance 96% Home Health Care Services 96% Accounting, Tax Preparation, Bookkeeping, and Payroll Services 96% Custom Computer Programming Services 94% Retail Services -‐ Non-‐Store, Direct & Electronic Sales 93% Monetary Authorities & Depository Credit Intermediation Services 92% Nursing & Residential Care Facilities 91% Environmental & Other Technical Consulting Services 91% Wholesale Trade Distribution Services 87% Retail Services -‐ Sporting Goods, Hobby, Book and Music 79% Retail Services -‐ Motor Vehicle & Parts 75% Restaurant, Bar & Drinking Place Services 74% Retail Services – Misc. 70% Retail Services – Food & Beverages 68% Retail Services – Clothing 62% Vegetables & Melons 50% Retail Services – Gasoline Stations 31% Cattle from Ranches & Farms 21% Auto Repair and Maintenance 20% Truck Transportation Services 14% Fitness & Recreational Sports Center Services 14% Soft Drinks & Manufactured Ice 11% Frozen Foods 0.28% Cookies, Crackers & Pasta 0.13% Breakfast Cereal 0.12% Seasonings & Dressings 0.12% Relay & Industrial Controls 0.12% Snack Foods 0.06% Switchgear and Switchboard Apparatus 0.02%
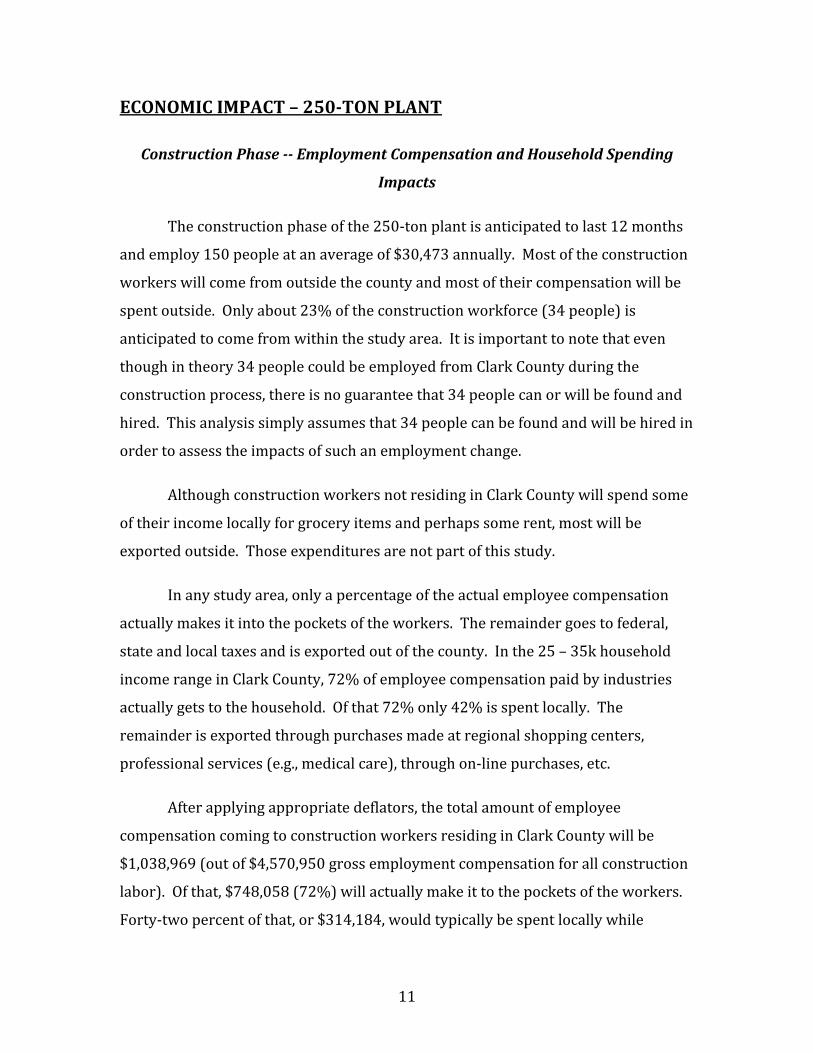
11
ECONOMIC IMPACT – 250-TON PLANT
Construction Phase -- Employment Compensation and Household Spending
Impacts
The construction phase of the 250-‐ton plant is anticipated to last 12 months
and employ 150 people at an average of $30,473 annually. Most of the construction
workers will come from outside the county and most of their compensation will be
spent outside. Only about 23% of the construction workforce (34 people) is
anticipated to come from within the study area. It is important to note that even
though in theory 34 people could be employed from Clark County during the
construction process, there is no guarantee that 34 people can or will be found and
hired. This analysis simply assumes that 34 people can be found and will be hired in
order to assess the impacts of such an employment change.
Although construction workers not residing in Clark County will spend some
of their income locally for grocery items and perhaps some rent, most will be
exported outside. Those expenditures are not part of this study.
In any study area, only a percentage of the actual employee compensation
actually makes it into the pockets of the workers. The remainder goes to federal,
state and local taxes and is exported out of the county. In the 25 – 35k household
income range in Clark County, 72% of employee compensation paid by industries
actually gets to the household. Of that 72% only 42% is spent locally. The
remainder is exported through purchases made at regional shopping centers,
professional services (e.g., medical care), through on-‐line purchases, etc.
After applying appropriate deflators, the total amount of employee
compensation coming to construction workers residing in Clark County will be
$1,038,969 (out of $4,570,950 gross employment compensation for all construction
labor). Of that, $748,058 (72%) will actually make it to the pockets of the workers.
Forty-‐two percent of that, or $314,184, would typically be spent locally while

12
$433,874 (58%) would likely be spent in the broader region. Table 7 shows the
likely ways in which the $314,184 would be absorbed into the local economy.
The employment effects of spending the $314,184 locally over a one year
period would likely result in the creation of 2.7 additional equivalent jobs in the
county with resulting labor income of $41,865 (or $15,505.55 average employment
compensation) for the 2.7 equivalent people. Even though the data suggest an
additional 2.7 people hired, the odds are that no jobs would be created at all
specifically because of the construction spending. All that is being suggested is that
the resulting income to businesses in the area from construction spending would be
the equivalent of hiring 2.7 people spread across many business sectors where
spending occurs.
The spending would also likely result in an additional $12,960 in income to
sole proprietorships in the study area.
Over that same 12-‐month period, due to construction spending,
approximately $21,427 would be received in indirect business taxes (drivers’
licenses, hunting and fishing licenses, sales tax, permits, etc.). Total taxes from
construction employment spending going to state and local taxing districts would
likely be $20,754. Total taxes going to federal government would likely be $8,999.
Table 7 - TOP 13 SECTORS WHERE RESIDENT CONSTRUCTION WORKERS WILL LIKELY SPEND THEIR INCOME
Housing (Rent) Real Estate Transactions Telecommunications Wholesale Trade Other State And Local Government Enterprises Retail Stores – Food And Beverage Individual And Family Services Religious Organizations Food Services And Drinking Places Automotive Repair And Maintenance, Except Car Washes Personal Care Services Monetary Authorities And Depository Credit Intermediation Activities Retail Stores – Gasoline Stations

13
Construction Phase -- Plant Construction Activities Impacts
Construction of the 250-‐ton plant, as referenced above, is expected to take 12
months. Total plant construction is expected to cost $30 million including the
employee compensation discussed above.
Most of the materials and equipment expenditures will occur external to the
county. Direct output (economic activity in the county) would approximate
$6,818,761. Indirect output (local supplier spending) would approximate $415,537
locally. Induced output (employee spending) could stimulate an additional
$200,230 in local spending. The remainder of the total output associated with
construction ($30 million) would be exported to the broader region.
As a result of local suppliers doing business related to the construction work
(the indirect effects), approximately 4.9 jobs will be created in the supplier chain
with resulting employee compensation of approximately $102,464 (or $20,911
average per employee). Total indirect labor income including sole proprietors is
anticipated at $126,383.
Table 8 shows the top 10 industries impacted by spending in the indirect
(supplier) round.
Table 8 - TOP 10 INDUSTRIES IMPACTED BY INDIRECT ROUND OF SPENDING
INDUSTRY PROJECTED AMOUNT FROM INDIRECT ROUND OF SPENDING
Wholesale Trade $120,840 Telecommunications $83,448 Automotive Repair $32,234 Employment Services $26,495 Real Estate Establishments $21,921 Retail Stores – Food & Beverage $19,356 Commercial & Industrial Machinery & Equipment Repair
$16,784
Banks $15,691 Scientific, Professional, Technical Services $13,029 Other Consulting Services $11,058

14
Construction Phase – Combined Impacts of Employment
Compensation/Household Spending and Plant Construction Activities
Table 9 shows the combined total anticipated impacts of all construction
activities for the 250-‐ton plant construction period. Note that the impact results
listed are for ONLY Clark County and do not anticipate impacts on surrounding
counties.
Table 9 - COMBINED EMPLOYEE/HOUSEHOLD SPENDING AND CONSTRUCTION ACTIVITY IMPACTS
Operations Phase – Introduction
As outlined above, this analysis assumes a 25-‐ year plant operating history
with 35 employees. For the purposes of analysis we assume that the employment
level will remain static. Of course static employment rarely occurs over any
significant period of time whether due to attrition, markets, labor supply, or
production changes.
As noted in the introductory pages of this document, the industry “electric
power generation, transmission, and distribution” was not present in Clark County
and, therefore, had to be added. The model was customized to include that industry
along with appropriate employment, production, and labor income numbers. As
such, the results of the Operations Phase include the normal interactions that would
occur between the added industry and other industries present in the county.
IMPACT CATEGORY IMPACT RESULT Total Output (economic activity) $6,818,761 Direct Employment 34 Indirect Employment 4.9 Induced Employment 2.7 Direct Employee Compensation $1,038,969 Indirect Employee Compensation $102,464 Induced Employee Compensation $41,865 Direct Labor Income (includes proprietors) $1,429,223 Indirect Labor Income (includes proprietors) $126,383 Induced Labor Income (includes proprietors) $54,825 Indirect Business Taxes (total) $78,731

15
It should be noted here that with the addition of the power generation and
transmission sector, not only did the Shannon-‐Weaver Diversity Index improve (as
noted in the document introductory pages) but we also found that the amount of
indirect business taxes improved substantially.
In short, the amount of total indirect business taxes in Clark County went
from $2,882,127 prior to the sector addition to $6,637,278 following. That’s an
additional $3,755,151 in indirect business taxes by adding this one industry.
In addition, as noted in Table 3, electric power generation, transmission, and
distribution has a substantially higher level of per worker labor income than other
industries currently in operation in Clark County.
Operations Phase -- Employment Compensation and Household Spending
Impacts
As noted above, the Operations Phase is taken out 25 years in the analysis
and assumes employment static at 35 for all 25 years. Using appropriate deflators,
we find that year-‐one total employee compensation will be $1,236,623. Total direct
employee compensation over the 25-‐year period is projected at $42,336,283.
Approximately $29,544,780 will make it to the pockets of the workers after taxes,
etc. Total indirect (supplier chain) employee compensation is $2,503,654. Total
induced employee compensation is $579,965. Total direct, indirect, and induced
employee compensation for the 25 year operating history, then, is $45,419,902.
As with resident construction workers, only 72% of employee compensation
makes it into the pockets of the workers and 42% is spent locally (on an average
basis). As such, of the $29,544,780 total direct employee compensation that will
make it to the worker, $12,408,808 would likely be spent within Clark County over
the 25-‐year period. The same is likely to occur for the indirect and induced impacts
as well with a slightly higher percentage of the induced employee compensation
figure being spent locally. Of the total (direct, indirect and induced) employee

16
compensation over 25 years we could reasonably expect that $13,703,928 would be
spent within the county.
Household spending over the 25-‐year period could result in the creation of
an additional 47.1 jobs in the county. The sectors in which employees would
typically spend their income are found in Table 10.
Table 10 – TOP 10 CLARK COUNTY INDUSTRY SECTORS IN WHICH RESIDENT WORKERS WOULD LIKELY SPEND THEIR INCOME
Wholesale Trade Retail Stores – Food and Beverages Individual and Family Services Telecommunications Other Private Educational Services Retail Stores – Gasoline Stations Monetary Authorities & Depository Credit Intermediation Services Retail Stores – Clothing Other State & Local Government Enterprises Retail Stores – Misc.
Operations Phase – Plant Operations Impacts
When considering the total impact of plant operations, including employee
compensation, we find that direct output (economic activity/production) over 25
years will be approximately $797,650,700. The indirect effects of that activity could
result in $15,356,860 being spent with local businesses (or approximately $614,274
per year). There are no guarantees that such spending will occur with local
businesses. The data only suggest that such spending could be absorbed within the
local area by businesses.
As the interactions occur between plant operations and local businesses over
25 years, it is likely that an additional 132.5 indirect equivalent jobs (or equivalent
employee compensation) would be created locally in the plant supplier/vendor
chain. It is important to remember that those jobs would be created over 25 years
on an average of 5.3 per year. Those jobs are associated only with businesses
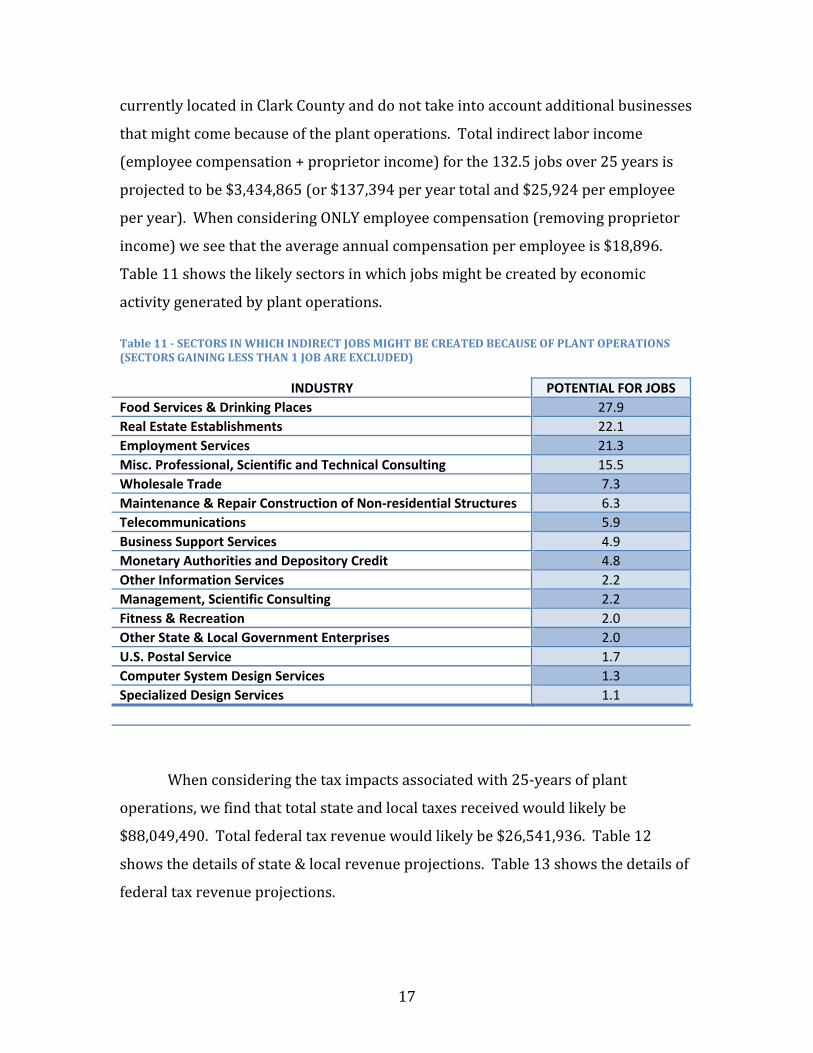
17
currently located in Clark County and do not take into account additional businesses
that might come because of the plant operations. Total indirect labor income
(employee compensation + proprietor income) for the 132.5 jobs over 25 years is
projected to be $3,434,865 (or $137,394 per year total and $25,924 per employee
per year). When considering ONLY employee compensation (removing proprietor
income) we see that the average annual compensation per employee is $18,896.
Table 11 shows the likely sectors in which jobs might be created by economic
activity generated by plant operations.
Table 11 - SECTORS IN WHICH INDIRECT JOBS MIGHT BE CREATED BECAUSE OF PLANT OPERATIONS (SECTORS GAINING LESS THAN 1 JOB ARE EXCLUDED)
INDUSTRY POTENTIAL FOR JOBS Food Services & Drinking Places 27.9 Real Estate Establishments 22.1 Employment Services 21.3 Misc. Professional, Scientific and Technical Consulting 15.5 Wholesale Trade 7.3 Maintenance & Repair Construction of Non-‐residential Structures 6.3 Telecommunications 5.9 Business Support Services 4.9 Monetary Authorities and Depository Credit 4.8 Other Information Services 2.2 Management, Scientific Consulting 2.2 Fitness & Recreation 2.0 Other State & Local Government Enterprises 2.0 U.S. Postal Service 1.7 Computer System Design Services 1.3 Specialized Design Services 1.1
When considering the tax impacts associated with 25-‐years of plant
operations, we find that total state and local taxes received would likely be
$88,049,490. Total federal tax revenue would likely be $26,541,936. Table 12
shows the details of state & local revenue projections. Table 13 shows the details of
federal tax revenue projections.

18
Table 12 – STATE & LOCAL TAX & OTHER REVENUE PROJECTIONS OVER 25 YEARS
Table 13 - FEDERAL TAX REVENUE PROJECTIONS OVER 25 YEARS
DESCRIPTION PROJECTED TAX REVENUE Social Insurance Tax – Employee Contribution $1,992,148 Social Insurance Tax – Employer Contribution $2,014,666 Indirect Business Taxes $13,124,475 Corporate Tax $8,872,866 Personal Income Tax $537,781 TOTALS $26,541,936.00
Operations Phase – Combined Impacts of Employment Compensation/Household
Spending and Plant Operations Activities
Table 14 shows the combined total anticipated impacts of all operations
activities for the 250-‐ton plant 25-‐year operations period. Note that the impact
results listed are for ONLY Clark County and do not anticipate impacts on
surrounding counties.
DESCRIPTION PROJECTED TAX REVENUE Social Insurance Tax – Employee Contribution $17,794 Social Insurance Tax – Employer Contribution $76,556 Sales Tax $40,853,032 Business Property Tax $33,505,680 Motor Vehicle Licenses $1,256,485 Severance Tax $146,889 Other Taxes $4,849,844 Other State & Local Revenue (non-‐taxes) $4,748,785 Corporate Profits Tax $2,228,558 Personal Income Tax $286,039 Fines & Fees $39,770 Personal Tax -‐ Property Tax $9,304 Other Taxes – Fishing/Hunting Licenses, etc. $30,754 TOTALS $88,049,490.00

19
Table 14 - COMBINED IMPACTS OF EMPLOYEE/HOUSEHOLD SPENDING AND PLANT ACTIVITIES FOR THE 25-YEAR OPERATIONS PHASE
IMPACT CATEGORY IMPACT RESULT Total Output (economic activity) $817,603,200 Direct Employment 35 (895.9 Equivalent over 25 years) Indirect Employment 132.5 (5.3 per year) Induced Employment 47.1 (1.8 per year) Direct Employee Compensation $42,336,283 ($1,693,451 per year) Indirect Employee Compensation $2,503,654 ($100,146 per year) Induced Employee Compensation $579,965 ($23,199 per year) Direct Labor Income (includes proprietors) $81,987,800 ($3,279,512 per year) Indirect Labor Income (includes proprietors) $3,434,865 ($137,395 per year) Induced Labor Income (includes proprietors) $797,333 ($31,893 per year) Indirect Business Taxes (total) $98,461,940

20
ECONOMIC IMPACT – 500-TON PLANT
Introduction
In this section, only those pertinent impact changes associated building and
operating a 500-‐ton plant rather than a 250-‐ton plant are considered. The 500-‐ton
plant will cost approximately $60 million to construct and require approximately
250 full-‐time workers who are assumed to be paid $30,473 annually. Of the 250
workers, approximately 57 will come from Clark County.
The Operations Phase is the same 25-‐year period but will require 43 full-‐time
employees who will, the analysis assumes, reside in Clark County. The workers will
be paid the same annual average of $35,332 as the 250-‐ton plant. As with the
construction workers, and as is consistent with the 250-‐ton plant, workers will
spend approximately 42% of their compensation locally.
Construction Phase -- Employment Compensation and Household
Spending Impacts
The total amount of employee compensation coming to construction workers
residing in Clark County will be $2,013,924. Of that, $1,450,025 (72%) will actually
make it to the pockets of the workers. Forty-‐two percent of that, or $609,010
would typically be spent locally while $841,015 (58%) would likely be spent in the
broader region. The sectors displayed in Table 15 show the likely ways in which the
$609,010 would be absorbed into the local economy.
The employment effects of spending the $609,010 locally over a one year
period would likely result in the creation of 3.3 additional equivalent jobs in the
county with resulting labor income of $51,168 (or $15,505.55 average employment
compensation) for the 3.3 equivalent people.

21
As with the 250-‐ton plant, even though the data suggest an additional 3.3
people might be employed, the odds are that no jobs would be created at all
specifically because of the construction spending. All that is being suggested is that
the resulting income to businesses in the area from construction spending would be
the equivalent of hiring 3.3 people spread across many business sectors where
spending occurs.
Over that same 12-‐month period, due to construction spending,
approximately $35,183 would be received in indirect business taxes (drivers’
licenses, hunting and fishing licenses, sales tax, permits, etc.). Total taxes from
construction employment spending going to state and local taxing districts would
likely be $34,077. Total taxes going to federal government would likely be $15,092.
Table 15 - TOP 16 SECTORS WHERE RESIDENT CONSTRUCTION WORKERS WILL LIKELY SPEND THEIR INCOME
Housing (Rent) Real Estate Transactions Telecommunications Wholesale Trade Other State And Local Government Enterprises Retail Stores – Food And Beverage Individual And Family Services Religious Organizations Food Services And Drinking Places Automotive Repair And Maintenance, Except Car Washes Personal Care Services Monetary Authorities And Depository Credit Intermediation Activities Retail Stores – Gasoline Stations Fruit And Vegetables Canning, Pickling And Drying Other Private Educational Services Retail Stores – Clothingand Clothing Accessories
Construction Phase -- Plant Construction Activities Impacts
Most of the materials and equipment expenditures will occur external to the
county. Direct output (economic activity in the county) would approximate
$12,556,940. Indirect output (local supplier spending) would approximate

22
$765,223 locally. Induced output (employee spending) would approximate
$320,726 locally. The remainder of the total output associated with construction
($60 million) would be exported to the broader region and beyond.
As a result of local suppliers doing business related to the construction work
(the indirect effects), approximately 9.1 jobs will be created in the supplier chain
with resulting employee compensation of approximately $190,290 (or $20,911
average per employee). Total indirect labor income including sole proprietors is
anticipated at $232,737. Table 16 shows the top 10 industries impacted by
spending in the indirect (supplier) round.
Table 16 - TOP 10 INDUSTRIES IMPACTED BY INDIRECT ROUND OF SPENDING
INDUSTRY PROJECTED AMOUNT FROM INDIRECT ROUND OF SPENDING
Wholesale Trade $222,531 Telecommunications $153,673 Automotive Repair $59,360 Employment Services $48,791 Real Estate Establishments $40,367 Retail Stores – Food & Beverage $35,645 Commercial & Industrial Machinery & Equipment Repair
$30,909
Banks $28,896 Scientific, Professional, Technical Services $23,994 Other Consulting Services $20,363
Construction Phase – Combined Impacts of Employment
Compensation/Household Spending and Plant Construction Activities
Table 17 shows the combined total anticipated impacts of all construction
activities for the 500-‐ton plant construction period. Note that the impact results
listed are for ONLY Clark County and do not anticipate impacts on surrounding
counties.

23
Table 17 - COMBINED EMPLOYEE/HOUSEHOLD SPENDING AND CONSTRUCTION ACTIVITY IMPACTS
Operations Phase -- Employment Compensation and Household Spending
Impacts
As noted above, the Operations Phase is taken out 25 years in the analysis
and assumes employment static at 43 for all 25 years. Using appropriate deflators,
we find that year-‐one total employee compensation will be $1,519,279. Total direct
employee compensation over the 25-‐year period is projected at $51,621,170.
Approximately $37,167,242 will make it to the pockets of the workers after taxes,
etc. Total indirect (supplier chain) employee compensation is $3,062,502. Total
induced employee compensation is $709,422. Total direct, indirect, and induced
employee compensation for the 25 year operating history, then, is $55,393,094.
As with resident construction workers, only 72% of employee compensation
makes it into the pockets of the workers and 42% is spent locally (on an average
basis). As such, of the $37,167,242 total direct employee compensation that will
make it to the worker, $15,610,242 would likely be spent within Clark County over
the 25-‐year period. The same is likely to occur for the indirect and induced impacts
as well with a slightly higher percentage of the induced employee compensation
figure being spent locally. Of the total (direct, indirect and induced) employee
IMPACT CATEGORY IMPACT RESULT Total Output (economic activity) $12,556,940 Direct Employment 57 Indirect Employment 9.1 Induced Employment 3.3 Direct Employee Compensation $1,652,845 Indirect Employee Compensation $188,690 Induced Employee Compensation $51,683 Direct Labor Income (includes proprietors) $2,371,561 Indirect Labor Income (includes proprietors) $232,737 Induced Labor Income (includes proprietors) $55,354 Indirect Business Taxes (total) $140,811

24
compensation over 25 years we could reasonably expect that $17,194,450 would be
spent within the county.
Household spending over the 25-‐year period could result in the creation of
an additional 57.6 jobs in the county. The sectors in which employees would
typically spend their income are found in Table 18 on the following page.
Table 18 – TOP 10 CLARK COUNTY INDUSTRY SECTORS IN WHICH RESIDENT WORKERS WOULD LIKELY SPEND THEIR INCOME
Wholesale Trade Retail Stores – Food and Beverages Individual and Family Services Telecommunications Other Private Educational Services Retail Stores – Gasoline Stations Monetary Authorities & Depository Credit Intermediation Services Retail Stores – Clothing Other State & Local Government Enterprises Retail Stores – Misc.
Operations Phase – Plant Operations Impacts
When considering the total impact of plant operations, including employee
compensation, we find that direct output (economic activity/production) over 25
years will be approximately $975,697,500. The indirect effects of that activity could
result in $18,784,660 being spent with local businesses (or approximately $751,386
per year). There are no guarantees that such spending will occur with local
businesses. The data only suggest that such spending could be absorbed within the
local area by businesses.
As the interactions occur between plant operations and local businesses over
25 years, it is likely that an additional 162 indirect equivalent jobs (or equivalent
employee compensation) would be created locally in the plant supplier/vendor
chain. It is important to remember that those jobs would be created over 25 years
on an average of 6.5 per year. Those jobs are associated only with businesses

25
currently located in Clark County and do not take into account additional businesses
that might come because of the plant operations. Total indirect labor income
(employee compensation + proprietor income) for the 162 jobs over 25 years is
projected to be $4,201,568 (or $168,063 per year total and $25,856 per employee
per year). When considering ONLY employee compensation (removing proprietor
income) we see that the average annual compensation per employee is $18,904.
Table 19 shows the likely sectors in which jobs might be created by economic
activity generated by plant operations.
Table 19 - SECTORS IN WHICH INDIRECT JOBS MIGHT BE CREATED BECAUSE OF PLANT OPERATIONS (SECTORS GAINING LESS THAN 1 JOB ARE EXCLUDED)
INDUSTRY POTENTIAL FOR JOBS Food Services & Drinking Places 34.2 Real Estate Establishments 27.1 Employment Services 26 Misc. Professional, Scientific and Technical Consulting 18.9 Wholesale Trade 9 Maintenance & Repair Construction of Non-‐residential Structures 7.7 Telecommunications 7.3 Business Support Services 5.9 Monetary Authorities and Depository Credit 5.9 Other Information Services 2.7 Management, Scientific Consulting 2.7 Fitness & Recreation 2.5 Other State & Local Government Enterprises 2.5 U.S. Postal Service 2.1 Computer System Design Services 1.6 Specialized Design Services 1.3 Automotive Repair & Maintenance 1.0
When considering the tax impacts associated with 25-‐years of plant
operations, we find that total state and local taxes received would likely be
$107,703,371. Total federal tax revenue would likely be $32,466,465. Table 20
shows the details of state & local revenue projections. Table 21 shows the details of
federal tax revenue projections.

26
Table 20 – STATE & LOCAL TAX & OTHER REVENUE PROJECTIONS OVER 25 YEARS
Table 21 - FEDERAL TAX REVENUE PROJECTIONS OVER 25 YEARS
DESCRIPTION PROJECTED TAX REVENUE Social Insurance Tax – Employee Contribution $2,436,823 Social Insurance Tax – Employer Contribution $2,464,367 Indirect Business Taxes $16,054,040 Corporate Tax $10,853,414 Personal Income Tax $657,821 TOTALS $32,466,465.00
Operations Phase – Combined Impacts of Employment Compensation/Household
Spending and Plant Operations Activities
Table 22 shows the combined total anticipated impacts of all operations
activities for the 500-‐ton plant 25-‐year operations period. Note that the impact
results listed are for ONLY Clark County and do not anticipate impacts on
surrounding counties.
DESCRIPTION PROJECTED TAX REVENUE Social Insurance Tax – Employee Contribution $21,766 Social Insurance Tax – Employer Contribution $93,645 Sales Tax $49,971,992 Business Property Tax $40,984,612 Motor Vehicle Licenses $1,536,950 Severance Tax $179,677 Other Taxes $5,932,397 Other State & Local Revenue (non-‐taxes) $5,808,779 Corporate Profits Tax $2,726,003 Personal Income Tax $349,887 Fines & Fees $48,648 Personal Tax -‐ Property Tax $11,381 Other Taxes – Fishing/Hunting Licenses, etc. $37,619 TOTALS $107,703,356.00

27
Table 22 - COMBINED IMPACTS OF EMPLOYEE/HOUSEHOLD SPENDING AND PLANT ACTIVITIES FOR THE 25-YEAR OPERATIONS PHASE
Table 23 gives a list of the top 20 businesses that typically would typically
benefit from the location of a power generation plant.
Table 23 - TOP 20 BUSINESS SECTORS THAT WOULD BENEFIT FROM THE LOCATION OF A POWER GENERATION PLANT (ASSUMING ALL SECTORS WERE AVAILABLE IN A STUDY AREA)(NATIONAL DATA)
Extraction of Oil & Natural Gas Mining Coal Petroleum Refineries Rail Transport Pipeline Transport Maintenance and Repair Construction of Nonresidential Structures Misc. Professional, Scientific and Technical Services Monetary Authorities and Depository Credit Intermediation Activities Legal Services Food Services & Drinking Places Lessors of Nonfinancial Intangible Assets Real Estate Establishments Wholesale Trade Business Telecommunications Management of Companies and Enterprises Securities, Commodity Contracts, Investments and Related Activities Transport by Truck Architectural, Engineering and Related Services Electric Power Generation, Transmission & Distribution Turbine and Turbine Generator Set Units Manufacturing
IMPACT CATEGORY IMPACT RESULT Total Output (economic activity) $975,697,500 Direct Employment 43 (1,095.9 equivalent over 25 years) Indirect Employment 162 (6.5 per year) Induced Employment 57.6 (2.3 per year) Direct Employee Compensation $51,621,170 ($1,486,690 per year) Indirect Employee Compensation $3,062,502 ($122,500 per year) Induced Employee Compensation $709,422 ($28,378 per year) Direct Labor Income (includes proprietors) $100,288,600 ($4,011,544 per year) Indirect Labor Income (includes proprietors) $4,201,568 ($168,063 per year) Induced Labor Income (includes proprietors) $975,309 ($39,012 per year) Indirect Business Taxes (total) $120,440,000

28

57
APPENDIX 3: MSW ANALYTICAL RESULTS

Clark County Waste to EnergyMunicipal Waste Analysis Results
Clark County Sample #1
Proximate/Ultimate Analysis
Trace Element Analysis

TCLP Analysis

Clark County Sample #2
Proximate/Ultimate Analysis
Trace Element Analysis

TCLP Analysis

Madison #1
Proximate/Ultimate Analysis
Trace Element Analysis

TCLP Analysis

Madison #2
Proximate/Ultimate Analysis
Trace Element Analysis

TCLP Analysis

Bonneville #1
Proximate/Ultimate Analysis
Trace Element Analysis

TCLP Analysis

Bonneville #2
Proximate/Ultimate Analysis
Trace Element Analysis

TCLP Analysis

Bonneville #3
Proximate/Ultimate Analysis
Trace Element Analysis

TCLP Analysis

Bonneville #4
Proximate/Ultimate Analysis
Trace Element Analysis

TCLP Analysis
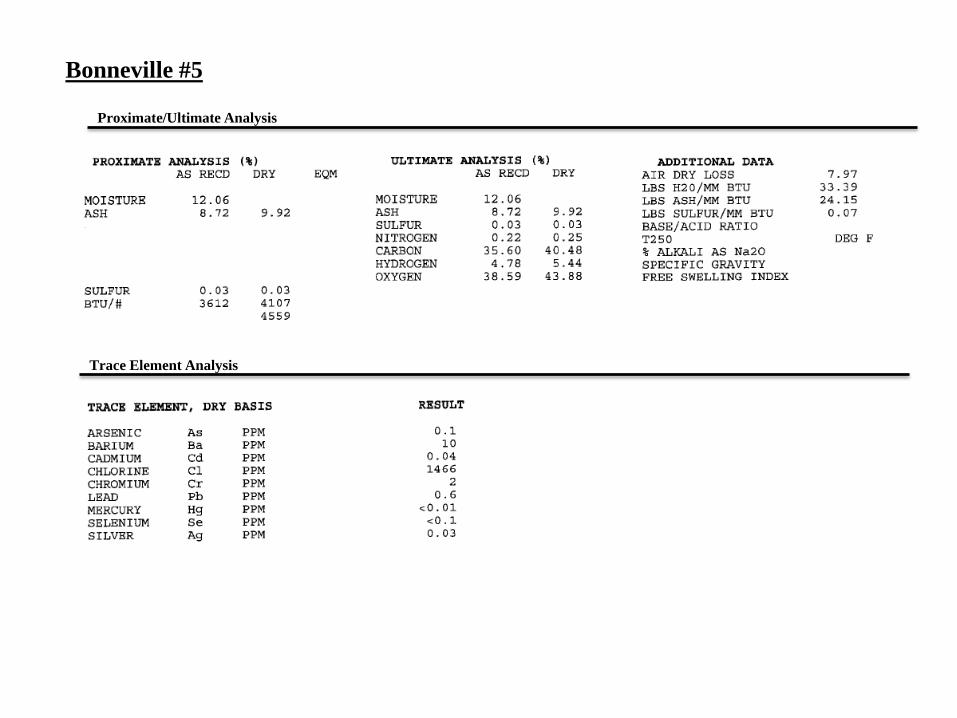
Bonneville #5
Proximate/Ultimate Analysis
Trace Element Analysis

TCLP Analysis

Bonneville Carpet
Proximate/Ultimate Analysis
Trace Element Analysis

TCLP Analysis

58
BIBLIOGRAPHY
“Biomass Crop Assistance Program-CHST Matching Payments Program”. USDA Farm Service
Agency, January 2010
http://www.fsa.usda.gov/FSA/webapp?area=home&subject=landing&topic=landing.
“Bonneville County, Idaho” 2010. City-Data.com,
www.citydata.com/county/Bonneville_County-ID.html.
“Bridger-Teton National Forest Quickly Moves to Use Stimulus Money for Anti-conservation
Logging”, The Wildlife News February 19, 2009-Ralph Maughan
http://wolves.wordpress.com/2009/02/19/bridger-teton-national-forest-quickly-moves-to-use-
stimulus-money-for-anti-conservation-logging/
“Bundling Logging Residues With a Modified John Deere Slash Bundler”, Mitchell, Dana;
USDA Forest Service Southern Research Station, Forest Operations Research Unit, Auburn, AL,
August 2009. http://www.forestprod.org/biomass09mitchell.pdf
“Clark County, Idaho”, 2010. City-Data.com, www.city-data.com/county/Clark_County-
ID.html.
“Costs of existing and recommended manure management practices for house fly and stable fly
(Diptera:Muscidae) control on dairy farms”, PubMed.gov U.s. National Library of Medicine
National Institutes of Health, Lazarus, WF; Rutz, DA; Miller, RW; Brown, DA, August 1989.
http://www.ncbi.nlm.nih.gov/pubmed/2768644
Davis, R.B., Jenkins, B.M., Nguyen, Solid Waste Conversion: A review and database of current
and emerging technologies, Final Report, University of California Davis, Department of
Biological and Agricultural Engineering, December 2003
Dynamis Energy LLC. Company Home Page. 2010. http://www.dynamisenergy.com/
“Fact Sheet 6.2. the Economics of Forest Biomass Production and Use”, Gan, J.; C. Mayfield.
2007. Forest Bioenergy, http://www.forestenergy.net/
Fink, Rodney J., Fink, Ross L. An Assessment of Biomass Feedstock Availability in Missouri,
February 2006
“Fremont County, Idaho” 2010. City-Data.com, www.city-data.com/county/Fremont_County-
ID.html.
Gendebien, A. Leavens, A. Blackmore K. Godley, A. Lewin K. Whiting, K. J. and Davis, R.
Refuse Derived Fuel, Current Practice and Perspectives, European Commission, Directorate
General Environment, July 2003
59
“How much does it cost to transport 1 Ton of manure and/or compost on a per mile basis?”,
Cooperative Extension System, Home page. January 14, 2010.
http://www.extension.org/faq/37143.
“Idaho Statutes Title 39 Health and Safety Chapter 65 Waste Tire Disposal”, State of Idaho
Legislature 2010. http://legislature.idaho.gov/idstat/Title39/T39CH65SECT39-6508.htm
“Jefferson County, Idaho” 2010. City-Data.com, www.city-data.com/county/Jefferson_County-
ID.html.
Los Angeles County Conversion Technology Evaluation Report, Phase II Assessment, Alternate
Resources, Inc., October 2007
“Madison County, Idaho” 2010. City-Data.com, www.city-data.com/county/Madison_County-
ID.html.
Morris, Gregory PhD, Bioenergy and Greenhouse Gases, Green Power Institute, May 2008
Murphy, Michael L. Advancing Waste to Energy Technology Design and Performance of EPI
Fluidized Bed RDF Fired Power Plants Worldwide, Energy Products of Idaho, 2003
“NSWMA’s 2005 Tip Fee Survey”, NSWMA Research Bulletin 05-3 March 2005. National
Solid Waste Management Association, http://www.environmentalistseveryday.org/docs/Tipping-
Fee-Bulletin-2005.pdf
Peterson, Donald, R. The Real Cost of Extracting Logging Residues Study, Lumberjack
Resource Conservation and Development Council, Inc., September 2005
“Public Utility Regulatory Policies Act of 1978 (PURPA) (Public Law 95-617). Federal Energy
Regulatory Commission, http://www.ferc.gov/students/energyweregulate/fedacts.htm
“Renewable Biomass”. Energy Kids U.S. Energy Information Administration, 2010.
http://www.eia.doe.gov/kids/energy.cfm?page=biomass_home-basics-k.cfm
Repa, Edward W. PhD, NSWMA’s 2005 Tip Fee Survey, March 2005
“Teton County, Idaho” City-Data.com, www.citydata.com/county/Teton_County-ID.html.
Tire Disposal & Recycling Company Home Page. 2010. http://www.tiredisposal-
recycling.com/DisplayPage.aspx?pageid=25

60
Acknowledgment: "This material is based upon work supported
by the Department of Energy under Award Number DE-
EE000141.”
Disclaimer: "This report was prepared as an account of work
sponsored by an agency of the United States Government. Neither
the United States Government nor any agency thereof, nor any of
their employees, makes any warranty, express or implied, or
assumes any legal liability or responsibility for the accuracy,
completeness, or usefulness of any information, apparatus, product,
or process disclosed, or represents that its use would not infringe
privately owned rights. Reference herein to any specific
commercial product, process, or service by trade name, trademark,
manufacturer, or otherwise does not necessarily constitute or imply
its endorsement, recommendation, or favoring by the United States
Government or any agency thereof. The views and opinions of
authors expressed herein do not necessarily state or reflect those of
the United States Government or any agency thereof."