clarity&rigour€¦ · users can now reapportion political districts or cut sales turf without...
TRANSCRIPT

clarity&rigour
spatially intelligent.
C&R QGIS RedistrictingPlugin Manual and Tutorial

The Clarity and Rigour QGIS Redistricting Plugin
The C&R QGIS redistricting plugin brings the power of redistricting to the world’s leading open source GIS package! Users can now reapportion political districts or cut sales turf without needing to spend a cent on expensive software packages.
Our plugin has the following features:- Select percentage-based population tolerances- Easily rename districts- Select a district by clicking on the map- “Eraser” tool unassigns districts- Define custom fields to aggregate along with population and districts- Lock completed districts to prevent accidental changes
Our product directly updates your shapefile or GIS layer which allows you to do anyting a GIS software package can do once you’re done reapportioning. With QGIS, you can overlay your shapefile over an OpenStreetMap layer, or create a map fit for publication once you’ve finished districting. Combine your shapefile with different layers, such as road layers, or use the QGIS labeling feature to tell you how many people live in each polygon you’re districting. Your choices are nearly limitless.
This document will walk you through the plugin step-by-step, including downloading data as if you were about to create a redistricting plan for the United States.
������������������

1. Download and install QGIS.
QGIS is the world’s leading free and open-source GIS software. The redistricting plugin runs within QGIS.
QGIS can be downloaded at https://www.qgis.org/en/site/
As of the writing, the plugin only works with QGIS 2. Support for QGIS 3 has been planned and will be forthcoming shortly.
Once you have downloaded QGIS, go to the folder where you downloaded it, extract the file, and install the software.
2. Download and extract the data.
In order to redistrict, we’ll need to download the proper data. For the purposes of this tutorial, we will use census.gov TIGER data, used in the actual United States redistricting process.
To download the data, please visit the following website:https://www.census.gov/geo/maps-data/data/tiger-data.html
You should see a website which says “TIGER/Line® with Selected Demographic and Economic Data” with a number of possible download options.
For the purposes of this exercise, under the “2010 Census” heading (underneath the American Community Survey data), find the “Population & Housing Unit Counts – Blocks.” Click on the header, select a state of your choice, and click “GO.”
Once the file has downloaded, go to your Downloads folder, right-click on the file, and click “Extract files or folders.” A folder with the data will be created.
3. Install the redistricting plugin.
Open QGIS. Find and select the “Plugins” drop-down menu in the menu bar (in QGIS 2.14, it is between “Settings” and “Vectors.”) From the “Plugins” menu, select “Manage and Install Plugins.” Make sure “All” or “Not installed” is selected. Search for “C&R Redistricter.” The plugin and its logo should appear.
Check the box next to the plugin and then click “Install Plugin.” C&R Redistricter should now be installed.
Tip: If you have not done so already, also search for and install the OpenLayers Plugin. This will let you display your map over a Google Map layer or an OpenStreetMap layer, which can be very helpful when redistricting.
� ������������������

4. Open the redistricting plugin.
From the “Plugins” menu, there should now be an “C&R Redistricter” item with a right-facing chevron. Click on it and open the redistricter. The redistricting panels should appear.
You may also see a redistricting toolbar with the application’s logo on it. Clicking on the icon will open the plugin.
Tip: Both the redistricting panel and the attributes table are “dockable,” meaning you can move them around as you like, by clicking the icon to the left of the x on the panel.
5. Open the shapefile or layer you downloaded.
The census layer you downloaded and extracted is a vector layer. To open a vector layer, go to the Layer menu > Add Layer > Add Vector Layer.
A pop-up box will appear:
Select “Browse”, go to the folder where you extracted the census file you downloaded, and select the file. It should be a .shp file, and end in _pophu: for instance, the Connecticut file is titled tabblock2010_09_pophu, where 09 is Connecticut’s state FIPS code. Once selected, click “Open.” The map of the state will display – it may take a couple seconds to load all of the shapes.
6. Add a district column to the data layer.
Before you begin redistricting, you need to add a district field to the map layer. A field is a new column on the database associated with the map. We will use this column to let the software know which district the polygon is in.
Right-click on the layer in the layer panel (typically on the left). If you see nothing which looks like the name of the layer, go to View > Panels and make sure Layers Panel is checked.
� ������������������

Once you’ve right-clicked on the Layer Panel, select “Open Attribute Table.” (Note: right-clicking this is also how you get to the Layer “Properties”, which will be useful later.)
There should be a number of icons on the top part of the attribute table. The farthest right icon should be a little abacus, the “Field Calculator.” Click on the abacus. This will open up the field calculator dialog box.
� ������������������

You will use this dialog to create a new field. First, make sure the “Create a new field” box is checked – it should be by default. Make sure “virtual field” is unchecked.
Add a new field called DISTID by typing the name into “Output field name”. If you are working in a country where electorates are named and not numbered, make sure the field is a text field. Otherwise, you can use either a Whole number/integer field or a text field.
Also consider adding a default value of 0, as seen below:
Click OK. Depending on how large the file is, the field will take several seconds to be created.
In the upper left-hand corner, click the pen/pencil icon and save the layer.
Close the attribute table.
� ������������������

8. Set up the layer for districting.
On the redistricting toolbar, select “Change Parameters.” This will launch the parameters dialog.
A completed parameters window is shown below.
The “Layer To District” is the name of the layer you want to redistrict. (If you have previously started a file, clicking “load” will automatically load all of the remaining parameters.)
� ������������������

For “Number of Districts”, enter the number of districts you will need to create.
For “Population Field”, enter the field which represents how many people live in each census block. In our case, it’s POP10.
Equal Population Tolerance is for plans which don’t have to district down to the last voter. Enter the percent tolerance the software will use for determining whether a plan is within your legally defined parameters. For a U.S. Congressional district, this is exactly 0%. U.S. state legislatures have a bit more leeway. Australian state districts must vary by no more than 3.5%. This field may not be relevant for you if you are looking to reapportion a country with a target number such as Canada.
For “District Field”, enter the field you created in step 7, in our case DISTID.
“Data Field” allows you to create display columns for fields other than the population and district ID. These must be integer fields and should in theory represent population, though they could represent anything you want a sum of, including area (or possibly sales in a non-political context.) If you had voting age population or race data on the file, you could view it as you redistrict by defining it here.
“Create Map Styles From Districts” will automatically make a categorical color-coded map if checked. Leave unchecked if you are using a partially redistricted file which is already color coded or labeled.
Tip: Once you’ve created your layer, the software will attempt to save the parameters so when you come back, all you have to do is select the layer and click “Load.”
Tip: If you are redistricting file is large, the program may become unresponsive for a short amount of time once you select OK. Be patient! It’s just setting everything up.
9. Start Redistricting.
It’s time to start redistricting!
If everything worked properly, you should see a table which looks like this:
� ������������������

Note: the picture above is from a partially redistricted file – a brand new file will have all zeroes except for district # “0”, which is the sum of any polygon that remains undistricted.
Our districts are ready to be painted. District 1 is the active district. Change the district by scrolling the slider.
The software works by using the QGIS “select” feature. You can find this on the “Map Navigation” toolbar. The icon should look like this:
However, this only selects one feature at a time. Click the arrow next tothe box and select “select by polygon” (which will select features byletting you point-and-click around where you want to select) or “selectby freehand” (which will select features you draw while the mouse pointer is down, so no point-and-click).
From here, select an area on the map. The area should turn yellow, like this:
� ������������������
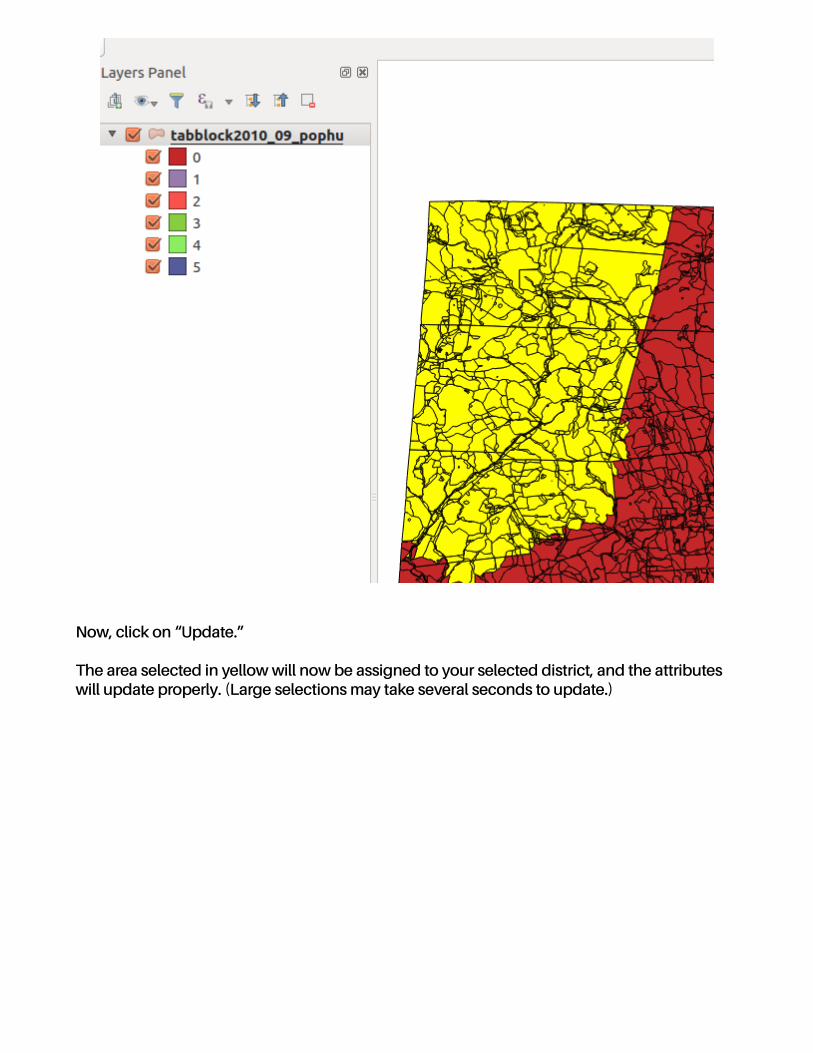
Now, click on “Update.”
The area selected in yellow will now be assigned to your selected district, and the attributes will update properly. (Large selections may take several seconds to update.)
� ������������������

Repeat this process until you’ve designed the districts you want to create. Each district’s rowsin the attributes table will turn green when you’ve hit the population target.
Once you have created the district you want to create, you can lock a layer from being edited by checking the “Locked” checkbox.
If you want to reset the layer to “0” or “no district”, click the “Erase” button.
Changing District NamesEach district is assigned a number by default. If you are working on a plan which uses names instead of numbers, click on the “toolbox” button and select
Calculating CompactnessFor political and technical reasons, the software does not come with any compactness calculators. If you want to calculate compactness mathematically, you will need to use the QGIS disslove feature once you have finished your blocks to create a new layer. (The dissolve feature will merge all contiguous polygons with the same attribute/district into one larger polygon.) You can then calculate the area and perimeter of the new layer and then calculate compactness score that way.
However, QGIS can be very slow at dissolving large files. Using ogr2ogr or even GRASS to dissolve your file is recommended.
�� ������������������

Tips for new QGIS users- If you’ve downloaded the OpenLayers plugin, you can drape this over a map! Go to Web > OpenLayers Plugin and select the map of your choice. You may have to re-order the layers using the layer panel – simply click the _pophu layer and drag it to the top of the layers panel and it will display “on top” of the map.
To add transparency to your districts file, which will allow you to see the underlying map, right click on the name of the layer in the layer panel and select “properties.” Under the “Style” tab, the “Layer Transparency” slider is at the bottom: change it to 60-70% to be able to “see through” the layer to the map you’ve added.
Other cool things you can do by using the layer properties menu (right-click on the name of the layer in the layers panel, and then select “Properties”:
1. Label the map with the number of people in each polygon. This is exceptionally useful when you’re trying to equalize the last few census blocks. Click on the “Labels” tab and select “Show Labels For This Layer.” If you choose the population field, the number showing how many people live in each polygon will display.
2. Re-color the map by clicking on the color square under “Symbol” on the Style tab.
3. Export the attribute table to CSV using the toolbox.
Happy redistricting!
�� ������������������