clare ozawa , chief business officer inception s ciences ... and... · clare ozawa , chief business...
TRANSCRIPT
Clare Ozawa, Chief Bus ines s Officer Inception Sc iences Rekha Hemrajan i, VP, Head of Licens ing and M&A, Onyx Pharmaceutica ls

Topics for Today
• Why Partner • How To Structure a Partnership • How To Value a Partnership • The Deal Environment & Current Metrics • The Deal Process • Is the Business Model Broken? Considerations for
a Business Development Professional • Recent Examples
2

Why Partner
3
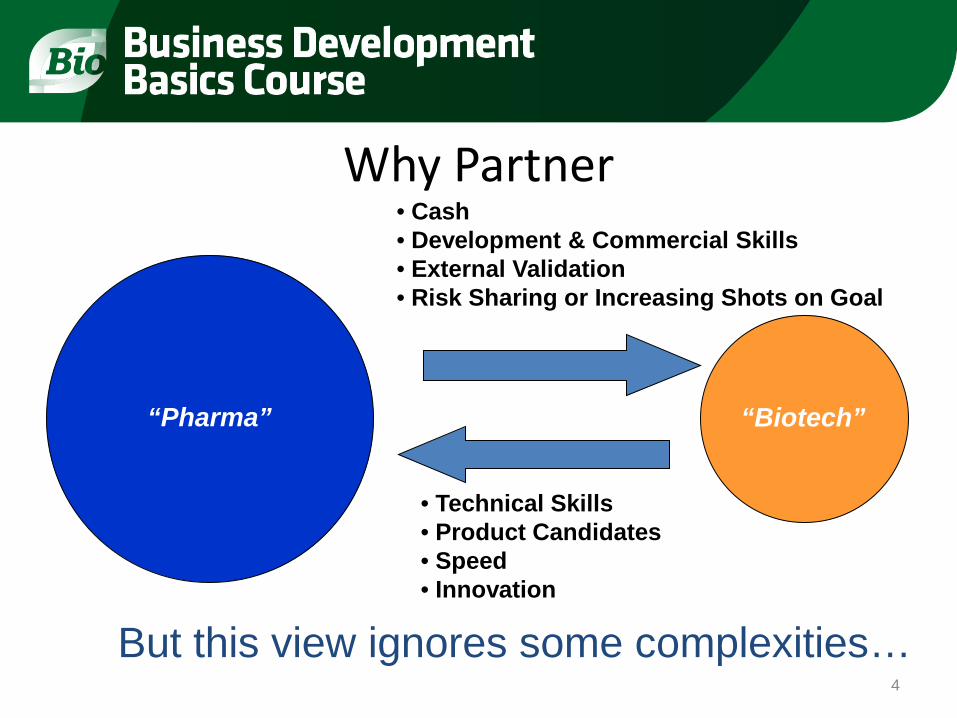
Why Partner • Cash • Development & Commercial Skills • External Validation • Risk Sharing or Increasing Shots on Goal
• Technical Skills • Product Candidates • Speed • Innovation
“Pharma” “Biotech”
But this view ignores some complexities… 4

Financing Your Biotech Company - 2001 “How We Used To Do It”
$1 $10
$50 $30
$150
$300
$0
$100
$200
$300
$400
$500
$600
NIH / Academic
Grants
VC - early stage
VC - late / mezzanine
"Validating" Partnership
IPO Public Secondaries
$ M
illio
ns
Public Private
5
Pharma Partnership

But Things Have Gotten More Complex…
6

It Is Taking Longer And More Capital For Companies to Exit
7
Average Time to Exit of US Venture-Backed Life Sciences Companies by Year of Exit (Years)
Average Equity Raised by Life Sciences Companies to Acquisition by Year of Exit ($ Millions)
Source: NVCA and Thomson Reuters

Healthcare IPOs Have Dwindled Over Time Percentage of Total IPOs per Year, 2004-2012
Source: Renaissance Capital; BIO website 8

Although Recent Data Suggests Some Reawakening of the Biotech IPO Market…
Source: Yahoo Finance 9
--NASDAQ Biotech Index --NASDAQ --S&P 500
• 2 Preclinical IPOs in 2012: Regulus (RGLS) and Verastem (VSTM)

And VC Funding is Down almost 30%
Biotechnology VC Total Funding and # of Deals By Year 1995 – 2012
Source: PWC Money Tree 10

11
Source: NVCA, PWC Jan 2013 MoneyTree report, Thomson Reuters
Lowest Level Since 1996
Initial VC Funding Is Harder to Come By Life Sciences First-Time Fundings

In 2013 – How’s the Model Holding Up? “What Now?”
$1 $10
$50 $30
$150
$300
$0
$100
$200
$300
$400
$500
$600
NIH / Academic
Grants
VC - early stage
VC - late / mezzanine
"Validating" Partnership
IPO Public Secondaries
$ M
illio
ns
Public Private
12
Pharma Partnership

Financing Your Biotech Company - 2013 “What Now?”
$1 $10
$50 $30
$150
$300
$0
$100
$200
$300
$400
$500
$600
NIH / Academic
Grants
VC - early stage
VC - late / mezzanine
"Validating" Partnership
IPO Public Secondaries
$ M
illio
ns
Public Private
13
Pharma Partnership

Can we finance this way?
Actually, yes…
14
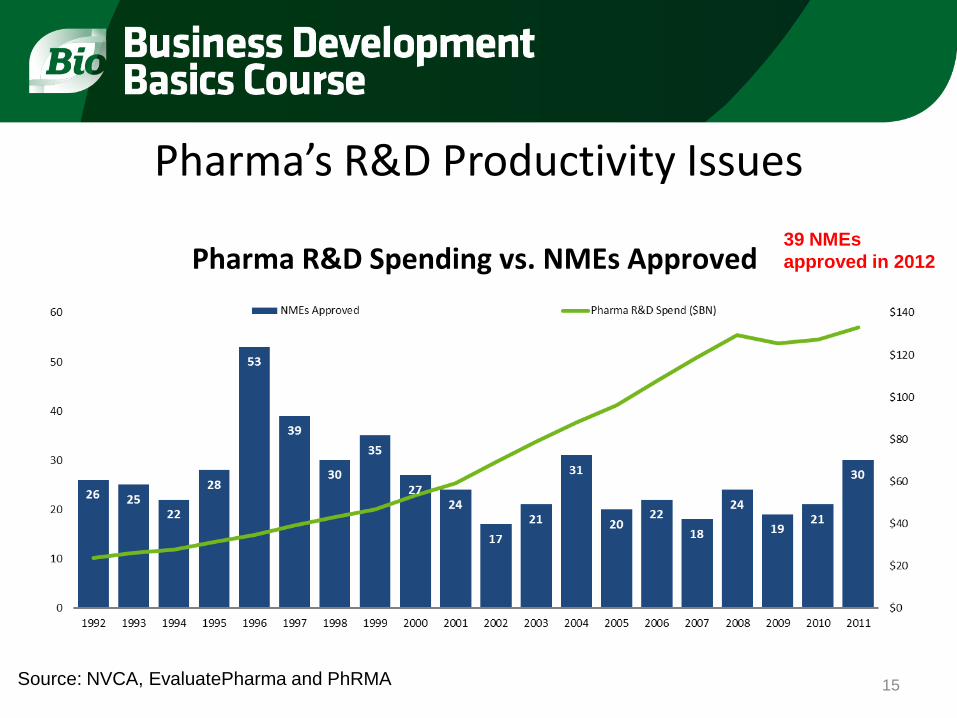
Pharma’s R&D Productivity Issues
15
Pharma R&D Spending vs. NMEs Approved
Source: NVCA, EvaluatePharma and PhRMA
39 NMEs approved in 2012

Pharma’s Patent Gaps Getting Very Real
0% 10% 20% 30% 40% 50% 60% 70%
Potential Revenue Loss by 2016 (% of Total 2010 WW Revenues)**
Source: Thomson Pharma, SEC 10-Ks 16

Recent Preclinical Structured Deals
17
Quanticel Pharma/ Celgene
• Company launched with VC funding + Celgene funding
• Celgene paid $45M upfront; option to acquire at 3.5 years
Warp Drive/ Genentech
•Launched with VC funding + Sanofi funding
•Sanofi has option to acquire
Inception 3/ Roche
•Company jointly funded from start by VC funding + Roche
•Roche has predefined option to acquire at IND
Resolve Therapeutics/ Takeda
•$8M upfront payment to fund through a Phase 1b lupus study
• Predefined option to acquire for up to $247M in upfront+milestones
Novel deal structures provide early funding

The public biotech perspective – raising cash while balancing cost and risk Loan-like vehicle
Hybrid –Clinical development financing
Equity like vehicle
• Relatively cheap capital
• Minimum dilution
• Potential overhang around time of repayment
•Not available to most biotech companies
• Risk sharing - don’t have to repay if compounds fail
• Potential overhang around time of repayment
•Not available to most private biotech companies
• No payback necessary
• Shareholder dilution - dilution of value of all assets of company, selling small percentage of entire pipeline
• Best risk diversification for investor
•Dependent on equity/venture market
License compound with Pharma company
• Good way to access additional capabilities and share risk
• Large % dilution in value of specific asset
• Potential loss of control
18

Cost of capital of various fund raising alternatives
Financing Option Cost of Capital Comments Debt/Convertible Debt 10%-20% • Blend of cost of equity
and cost of debt
Clinical Development Financing Vehicle
25%-30% • Delays and lowers dilution compared to equity now
Partner Compounds Could be huge depending on value of compound and terms
• No near-term equity dilution
• Value dilution in only one asset
• Capitalized value of earnings lost
Venture/Private Equity 45%+ • Usually look for cash on cash multiples of 3x-5x
Public Equity 25%-35% (equity cost of capital)
• Higher near-term dilution 19

If the Objective is Access to Capabilities/Expertise/Validation
• Valuing the partner’s contribution/capabilities – Increased Probabilities of Technical Success? – Shorter time to market? – Broader clinical program, larger number of indications? – Higher peak sales? – Increased valuation of company from “marquee” deal?
20

If the Objective is Sharing Risk Or Increasing Shots on Goal
• Consider ways to retain economics, while off-loading some costs – Cost and Profit share in compound – Retain certain number of compounds/output resulting
from collaboration – Retain certain geographies – Use financing vehicle to fund clinical development – Funding mechanisms from pharma partner
21

How To Structure A Partnership
22

Partial Acquisitions Controlling
>50%
100% Acquisitions
Licensing (Non-
Equity)
Shared Resources &
Competencies Through
Collaboration
Partial Acquisitions thru Equity
<50%
Joint Ventures
Increasing Partner Commitment
Increasing Degree of Integration
Corporate Partnerships Traditional M&A
Partnerships Come in a Variety of Forms Continuum of Transaction Types
Contractual Collaborative
23

Alliance vs.
Contractor vs.
Partner vs.
Service Provider vs.
Collaborator 24

In all transactions… There is a unique dynamic between the
Buyer and the Seller; and Every deal is different…
25

Value for the “Buyer” • New product candidates • New technologies (innovation)
– Discovery – Development
• IP/Know-how • Catalyst for change
– Challenge internal capabilities – Speed – Decision making
26

Value for the “Seller”
• Cash • Ability to advance technology platform • Ability to develop technology or therapeutic • Ability to commercialize technology or
therapeutic • Underwrite development of infrastructure • Market “validation”
27

What Kind of Transaction? • Straight license agreement
– Arm’s length – No collaboration (not really an alliance)
• Research collaboration • Development collaboration • Promotion/Marketing collaboration • Royalties vs. Profit sharing • M&A (the ultimate alliance?)
Varying degrees of all three?
28

What types of payments? • Upfront payment
– Proportion of costs to date (all or some fraction?) – Recognition of stage of development of IP and Know-how
• R&D Support – FTE basis
• Rate? Tracking? Auditing? • Work plan?
• Milestones – Research/Technical achievements – Clinical achievements – Regulatory hurdles (filings vs. approvals? territories?)
• Royalties – Percentage of sales? Tiers? – Sales milestones? – Buy out of future revenue stream?
29

Forms of Payment? • Cash
– Non-dilutive for seller • Equity
– Spares P&L for buyer • Unless written down?
– Upside potential for buyer? • Loans
– Forgivable? – Convertible?
Upfront
Research Support, Milestones
More relevant to Development and Commercialization
30

The Challenge
Near-term cash
Long-term value
Essential in early years
Essential to attract and keep investors 31

‘Classical’ Evolution of Deal Structure over Company Lifecycle
Early years Middle years Later years
Near-term cash
Long-term value
Early years Middle years Later years
Near-term cash Long-term value
32

How long does it take?
33

Will your product get approved?
34

How much will it take? BIG $$$$$$
INVENTOR $ > VC $$ > BIOTECH $$$ > PHARMA $$$$ 35
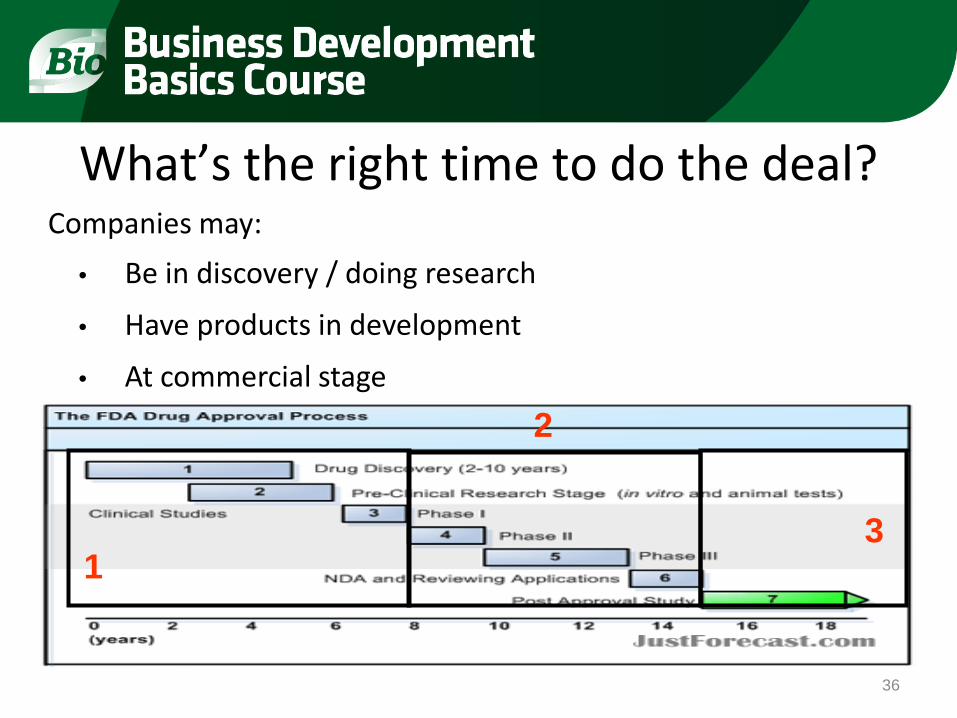
Companies may: • Be in discovery / doing research
• Have products in development
• At commercial stage
What’s the right time to do the deal?
1
2
3
36

So what structure for a deal? • Consider “life stage” of each partner
– Needs of seed and early stage companies cash & survival – Needs of companies with promising platforms
• Cash & proof-of-concept – Needs of companies with promising product candidates
• Cash & growth of infrastructure – Needs of the buyer vs. the seller
• Access to products, product candidates
• Additional considerations: – State of the seller’s portfolio – State of the buyer’s portfolio – Determining value of payments
• Risk and NPV? • Comparables? • “Loading”: front end vs. back end
37
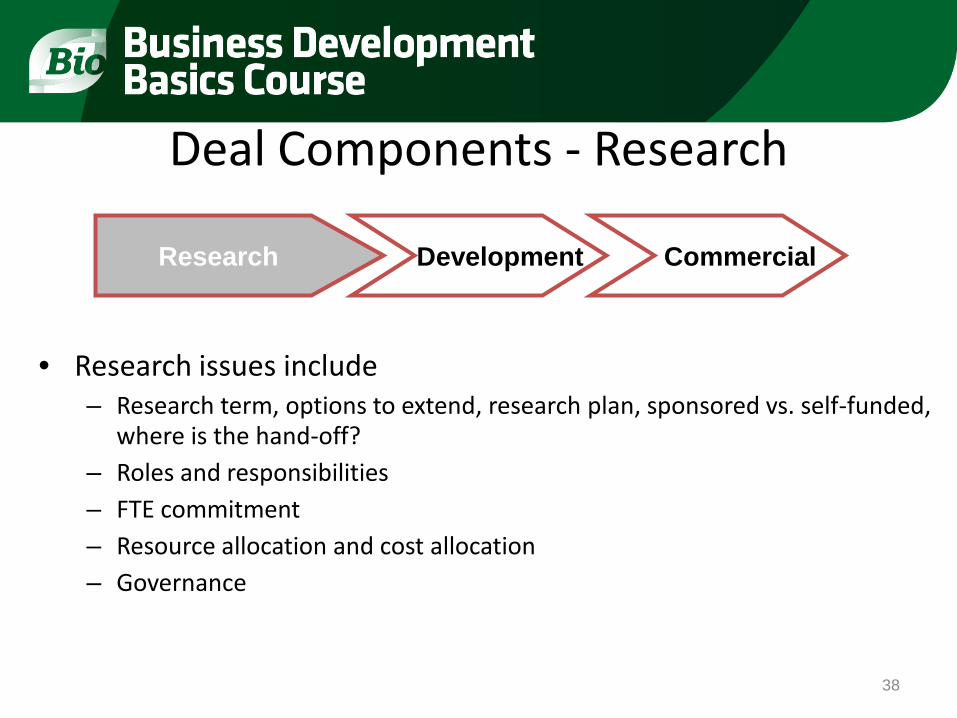
Deal Components - Research
• Research issues include – Research term, options to extend, research plan, sponsored vs. self-funded,
where is the hand-off? – Roles and responsibilities – FTE commitment – Resource allocation and cost allocation – Governance
Research Development Commercial
38

Deal Components - Development
• Development issues include – Development plan, compound criteria, regulatory affairs, resource
commitment, roles and responsibilities, cost sharing or reimbursement procedures
– Selection of development compounds – Buy-in for initial development compound vs. follow-ons
Research Development Commercial
39

Deal Components - Commercialization
• Commercial issues include – Commercialization plan – Manufacturing – Resources – Roles and responsibilities – Cost sharing and reimbursement – Trade-offs for retained rights – Royalty vs. profit sharing
Research Development Commercial
40

How To Value A Partnership
41

Whatever the Objectives, Need to Analyze the Value
CLOSE TO CASH FLOWS – NPV Analysis or IRR • Risk adjustment
TOO EARLY FOR VISIBILITY INTO CASH FLOWS – Make vs. Buy Approach
• Cost based approach for valuing project
COMPARABLE TRANSACTIONS ANALYSIS
42

NPV-Based Approach • Depends heavily on the following parameters:
– Timing and amount of revenues – Scale and scope of costs
• Clinical trials • Product development costs • Sales and marketing costs
– Risk adjustment for revenues and costs • Probabilities of success • Precedented vs. novel targets • Therapeutic Area • Modality
– Discount Rates/Cost of Capital 43

Detailed Inputs to Valuation Responsible Deliverable Methods Valuation Input
Initial Business Case Objective
Review of opportunity to provide first-pass scale and basis for framing terms/negotiation
Clinical Dev’t Plan and Projected Costs
Clinical Representative Clinical plan to achieve TPP, including size of trial(s), proposed # of sites, timing for initiation and completion, regulatory filings
• Clinical to partner with PM to incorporate feedback from regulatory, comm’l, dev’t, manufacturing
• Finance to partner with Clinical & PM to develop cost estimates for development program
• Projected Development Costs and Timing
PTS Assessment Clinical Representative Assessment of the Probability of Technical success for the relevant development phases/indications to achieve TPP
• Utilization of Industry benchmarks and internal view of development risk
• PTS % by Phase/Study
PRS Assessment Clinical Representative working with Regulatory
Assessment of the Probability of Regulatory success for the relevant indications
• Utilization of Industry benchmarks and internal view of regulatory risk
• PRS % by Indication
Revenue Projections Commercial Representative Appropriate patient-based forecasting scenarios incorporating market research, etc. that incorporate share uptake, peak share, competition, dosing and other relevant factors
• Commercial to partner w/ outside vendors for mkt rsch, forecasting
• Validate w/ stakeholders
• Net Sales in $’s by Indication in Excel linked to commercial assumption inputs
• Units Sold if available
Commercial Costs Commercial Representative
Projected Commercial Infrastructure for Field Force (Details/Reps) and Advertising and Promotional Efforts; Link to potential indications under development
• Commercial to utilize market analogs; Partner with Finance
• Commercial Cost Projections in $’s
Manufacturing Plan / Cost of Goods
Corporate Development (working with Tech Ops, etc.)
Revised manufacturing plan, including assessment of risks to timing, capital expense, evaluation of 3rd party partnerships. Timeline for tech transfer, scale-up, capital expenditure; also COGS estimate(s)
• Corp Dev to coordinate w/ manufacturing lead to link with commercial plan/forecast/pricing
• COGS estimate (unit basis if available – otherwise % estimate informed by Price assumption)
• 3rd party Royalty % / tiers • CapEx in $’s
Financial Inputs Finance Representative Relevant financial assumptions for Working Capital, Tax Rates and Discount Rate
• Coordinate with relevant finance line functions
• %’s

• From Net Revenue, all manufacturing, development and operating expenses are subtracted to arrive at an Operating Income for the project or business
• Taxes are calculated based upon this Pre-Tax Income to arrive at Net Income After Tax (NIAT) • Changes in working capital reflect a difference between the time the product manufacture is initiated and payment is received
for a sale. This is a timing issue rather than value creation or destruction. • Free Cash Flow represents the actual cash received from the project/business during a specified period. • In order to reflect the value of a project today, future cash flows are discounted back to today to account for the time value of
money using the weighted average cost of capital (WACC). Each dollar in a future year is worth less than a dollar in the previous year.
• The sum of the stream of discounted cash flows reflects the Net Present Value of the opportunity (NPV)
Illustrative Discounted Cash Flow
Net Revenue After Rebates and Discounts - Cost of Goods / Third Party Royalties = Gross Profit - Operating Expenses (e.g. Field Force/Marketing/Post Marketing Development) - R&D Costs = Operating Income / EBT - Taxes = Net Income After Tax - Changes in Working Capital = Free Cash Flow x Discount Factor (reflects time value of money) = Discounted Cash Flow
45

Valuation: Risk Adjusted View
Decision Point
eNPV = 71
Phase 1 Phase 2 Phase 3 Regulatory
Success 60%
Failure 40%
Success 40%
Failure 60%
Success 65%
Failure 35%
Success 85%
Failure 15%
Phase of Development
$1,000
($250)
($220)
Illustrative
($75)
($25)
NPV
The rNPV is the probability weighted value of the range of NPV’s that result in success or failure of the asset at different points in its’ development Key drivers of value are: 1. Development Investment 2. Projected Commercial Margins 3. PTRS
Probability
13%
2%
9%
36%
40%

Income StatementProduct 2013 2014 2015 2016 2017 2018 2019 2020 2021 2022 2023 2024 2025
RevenueCOGSGross Profit
Operating Expenses
R&D Expenses
EBIT
Taxes
NIAT
Cash Flow StatementProduct 2013 2014 2015 2016 2017 2018 2019 2020 2021 2022 2023 2024 2025
NIATChange in WCFree Cash Flow
NPVIRR
Income StatementOnyx 2013 2014 2015 2016 2017 2018 2019 2020 2021 2022 2023 2024 2025
RevenueCOGSRoyaltiesGross Profit
Operating Expenses
R&D Expenses
Milestone Payments
Profit Split Payments
EBIT
Taxes
NIAT
Cash Flow StatementOnyx 2013 2014 2015 2016 2017 2018 2019 2020 2021 2022 2023 2024 2025
NIATChange in WCFree Cash Flow
NPVIRR
Total Product Opportunity
Deal Terms
Income StatementPartner 2013 2014 2015 2016 2017 2018 2019 2020 2021 2022 2023 2024 2025
RevenueCOGSRoyaltiesGross Profit
Operating Expenses
R&D Expenses
Milestone Payments
Profit Split Payments
EBIT
Taxes
NIAT
Cash Flow StatementPartner 2013 2014 2015 2016 2017 2018 2019 2020 2021 2022 2023 2024 2025
NIATChange in WCFree Cash Flow
NPVIRR
Value to Licensee
Value to Partner
Proposed deal terms split the total product pie into the respective shares for licensee/acquirer and the potential partner
47

Cumula tive NPV
-750
-500
-250
0
250
500
750
1000
1250
1500
2013 2014 2015 2016 2017 2018 2019 2020 2021 2022 2023 2024 2025 2026 2027 2028 2029 2030
Total Product Cumulative NPV Licensor Cumulative NPV
• Cumulative NPV depicts the NPV from today to a forward point in time and is a useful way to show the investment and payback over time of a particular transaction
• As a Licensor, Upfront and Development Milestone Payments increase the total forward investment and delay project profitability on a cumulative NPV basis
MS’s
48
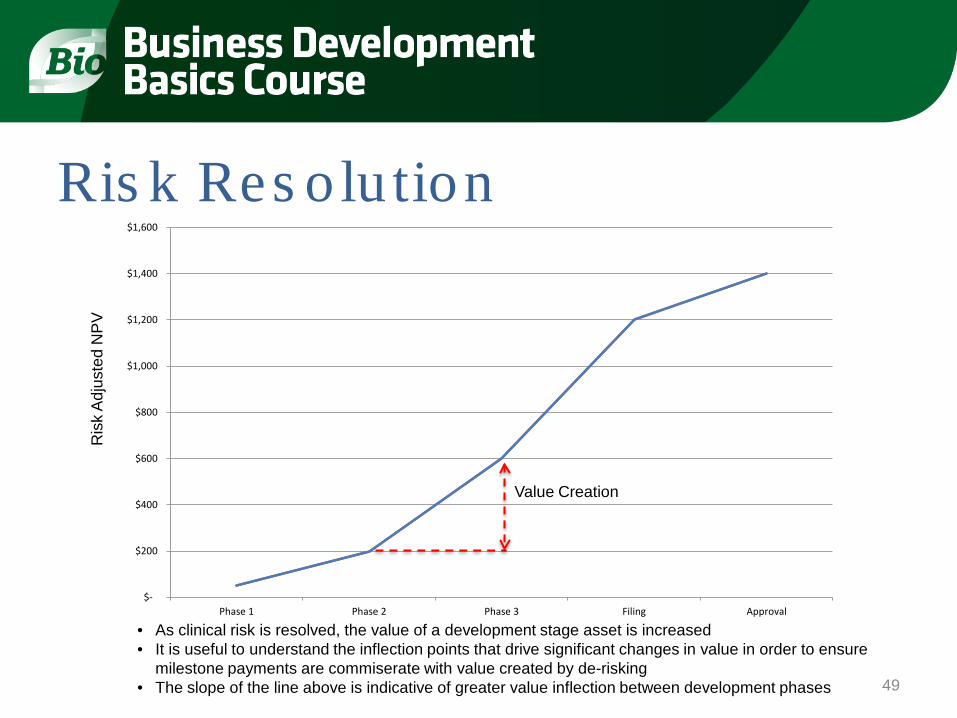
Ris k Res olu tion
49
$-
$200
$400
$600
$800
$1,000
$1,200
$1,400
$1,600
Phase 1 Phase 2 Phase 3 Filing Approval
• As clinical risk is resolved, the value of a development stage asset is increased • It is useful to understand the inflection points that drive significant changes in value in order to ensure
milestone payments are commiserate with value created by de-risking • The slope of the line above is indicative of greater value inflection between development phases
Ris
k A
djus
ted
NP
V
Value Creation

MONTECARLO SIMULATION IS ANOTHER TOOL TO MODEL UNCERTAINTY
0%
10%
20%
30%
40%
50%
60%
70%
80%
90%
100%
($1,000) ($500) $0 $500 $1,000 $1,500 $2,000 $2,500 $3,000 $3,500 $4,000 $4,500 $5,000
~60% Likelihood of rNPV > $400M
rNPV ($M)
Perc
entil
e
50

Make vs. Buy Analysis • Risk Adjusted cost estimation also depends
heavily on the following parameters: – Probabilities of success – Cost of each stage of process – Length of time to complete each stage of process – Each organization’s capabilities and efficiencies
are different
51

• Risk adjusted PV of upfront and downstream payments should compensate licensor for value of program – Risk adjusted PV of upfront and future payments in a
50/50 profit sharing partnership should compensate licensor for 50% of risk adjusted NPV of program
• Distribution of value between upfront and downstream payments to reflect remaining risk and upside. – Designed for the project to be as self-sustaining as possible
How to Split the Pie
52

Consider Going Forward With Transaction If • NPV Analysis
– Risk-adjusted NPV of Asset (in buyer’s hands) is sufficiently > Price of Asset, i.e., Remaining Value of Asset is sufficiently positive
• Make vs. Buy Analysis • Financial cost of “make” + Opportunity Cost (of
time and market value lost) during “make” > Cost of “Buy”
53

Components of Valuation • A little analytics
– NPV – Make-vs-buy – Comparables Analysis
• A lot of judgment – Synergies…is the asset a particularly good portfolio fit for a particular
company – Does it have strategic importance?
• Painful amount of negotiation – Competitive dynamic – Structuring for a win-win outcome
54

The Deal Environment and Current Metrics
55

1 Average deal value and total deals taken from EvaluatePharma Source: BCG, EvaluatePharma Licensing 56
Total Number of Licensing Deals and Values are Holding Steady

Top 10 Pharma Companies: defined by highest 2011 sales: Abbott, AZ, Eli Lilly, GSK, J&J, Merck, Novartis, Pfizer, Roche, Sanofi Source: BCG, EvaluatePharma Licensing
Decline in Number of Licensing Deals by Top 10 Pharma Companies
57

Autoimmune/ Inflammatory
10%
Cancer 24%
Diversified 6%
Endocrine/ Metabolic
10%
Infectious 14%
Neurology 14%
Dermatologic 3%
Hematologic 3%
Ophthalmic 3%
Pulmonary 2%
Cardio. 3%
Other* 8%
2007-2011 n = 2,247
Autoimmune/ Inflammatory
9%
Cancer 33%
Diversified 7%
Endocrine/ Metabolic
9%
Infectious 13%
Neurology 13%
Dermatologic 1%
Hematologic 1%
Ophthalmic 2%
Pulmonary 2%
Cardio. 2%
Other* 8%
2012 n = 424
*omits 432 and 104 licensing deals for 2007-2011 and 2012, respectively, for which a therapeutic area was not applicable or not disclosed
TA Distribution of Licenses Shows Even stronger focus on oncology in 2012
Source: The Deloitte Recap of 2012 Deals 58

Source: Deloitte Recap 59

Source: Elsevier Strategic Transactions
Deals between Big Pharma & Academia are Rising
60

Source: Deloitte Recap 61

Source: Deloitte Recap 62
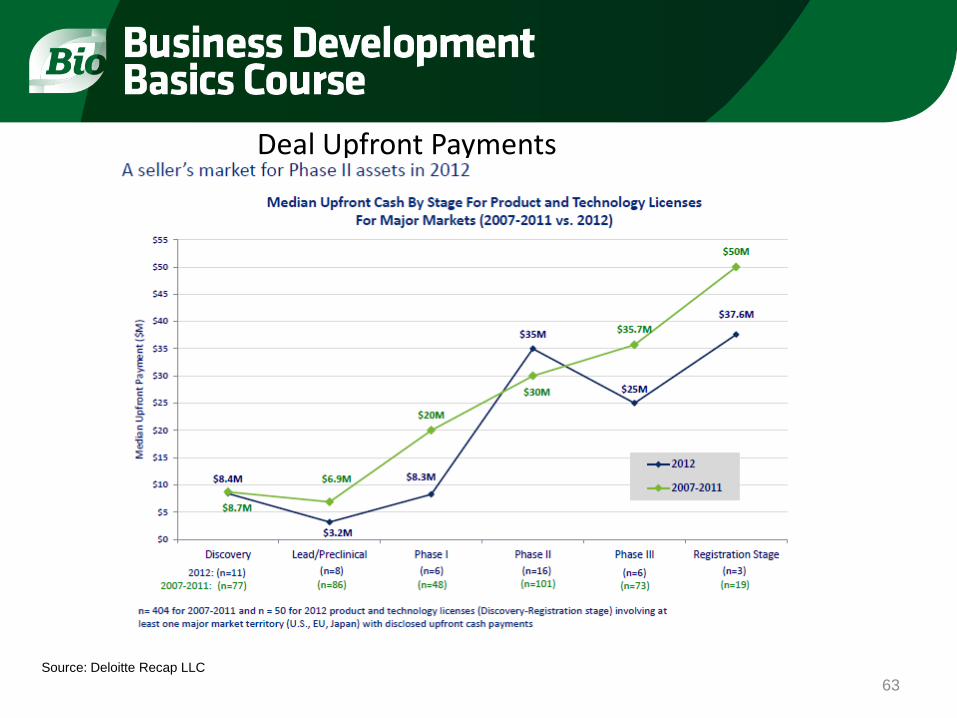
Source: Deloitte Recap LLC
Deal Upfront Payments
63

Source: Deloitte Recap 64
2012 M&A Activity M&A Dollars by Market Segment

Source: Deloitte Recap 65
M&A Activity Top 5 Therapeutic Areas: % Distribution of M&A by Development Stage, 2005-2011

Source: BIO Industry Analysis, Elsevier Database 66
Earnouts from M&A Deals Have Become More Back-ended

The Deal Process
67
The Business Development Role • Identify opportunity • Develop the negotiation strategy • Manage the negotiation process • Identify and resolve key issues early, if possible • Drive process and maintain momentum • Provide access to high level decisionmakers • Facilitate meetings
– Scientific and commercial – Due diligence and operational
• Close the deal 68

Outline
• Preparation and planning • Components of the process • Communication is key!
69
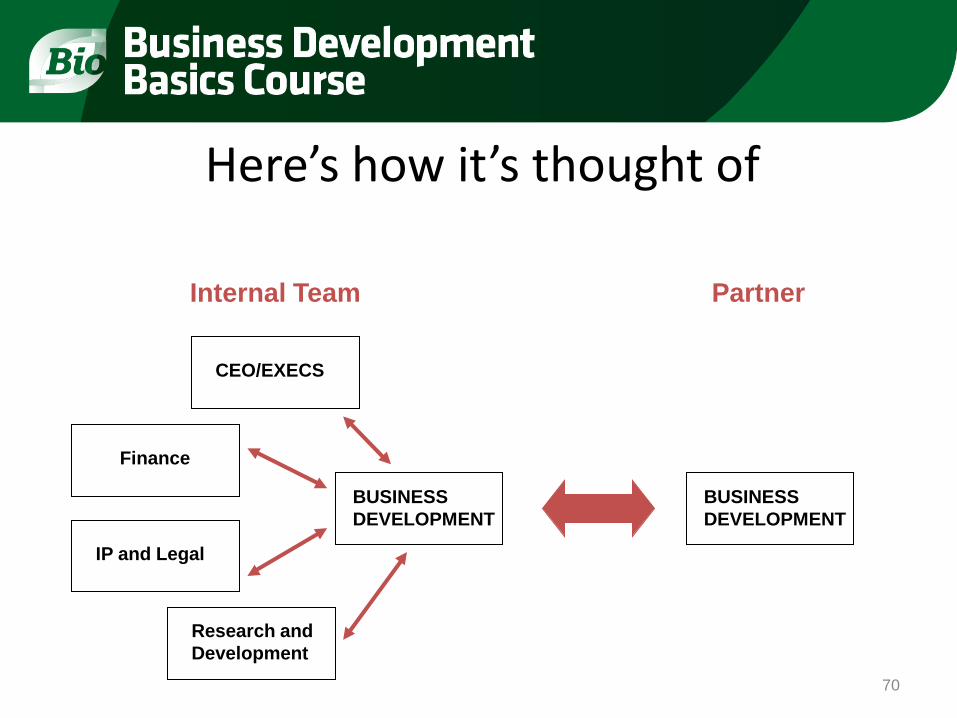
Here’s how it’s thought of
CEO/EXECS
Finance
IP and Legal
Research and Development
BUSINESS DEVELOPMENT
BUSINESS DEVELOPMENT
Internal Team Partner
70

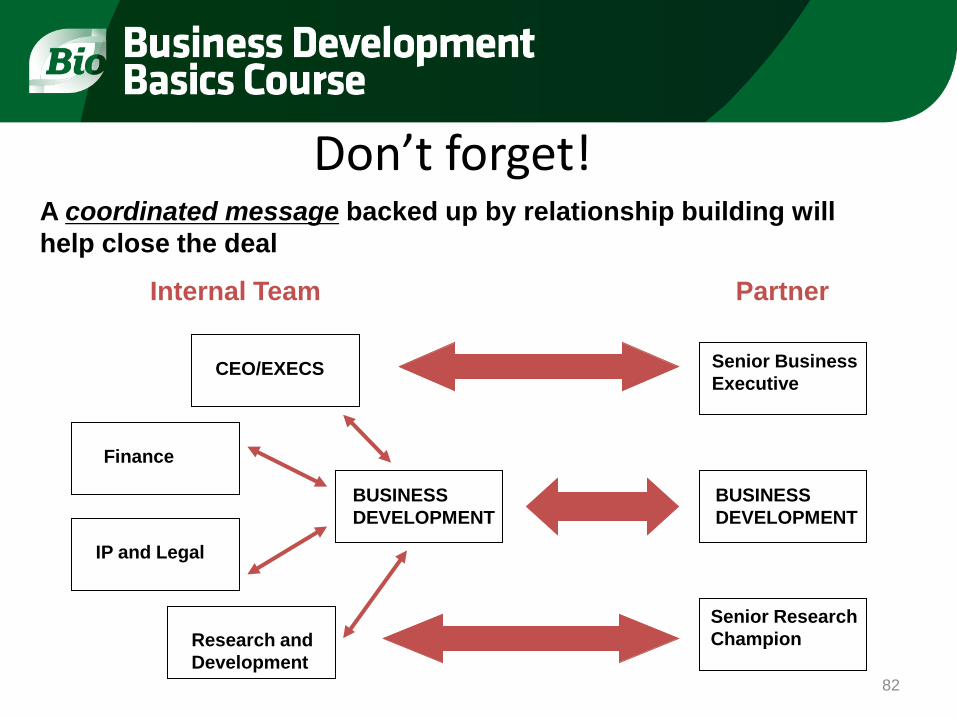
CEO/EXECS
Finance
IP and Legal
Research and Development
BUSINESS DEVELOPMENT
BUSINESS DEVELOPMENT
Internal Team Partner
Senior Research Champion
Senior Business Executive
A coordinated message backed up by relationship building will help close the deal
Here’s how it ought to be!
71

Getting Started • Define the objectives of the deal (corporate strategy) • Plan for timing – when does it need to be done? • Have an internal communication plan • Identify potential partners • Prepare non-confidential package and confidential
packages • Begin preparing due diligence materials
72

Internal Corporate Objectives and Planning • Define the primary purpose for partnering • Weighting of purposes is important
– Cash – Experience in pre-clinical or clinical development – Commercialization
• Define the market opportunity – be realistic, ask experts – Elaborate the commercial potential – Understand the competition, potential differentiators – Develop a financial model and understand how changing the numbers changes the
profit sharing between licensor and licensee • Create a communication plan within the company so the message is always the
same • Identify potential partners
– Do your homework and prioritize – Rolodex and conferences – NOT “blast e-mail” solicitations!
73

Components that are Early in the Deal Process • Build the relationship • Utilize your non-confidential package
– Have all relevant publications, patents, posters, etc. ready in form to send out upon request so your partners don’t have to track them down (PDF is best)
• Negotiate a CDA – Do this quickly and efficiently (if this is slow, then things are already bad!)
• Have your confidential package ready – Any pre-clinical studies in organized form
• Executive summaries for each section are important • Again, PDF is probably best
– Try to anticipate the questions • Balancing act between providing enough information to understand the
opportunity, while not overwhelming reviewers with too much • Be careful with really sensitive stuff (e.g. you may not want to disclose
compound structures until the deal is actually close to signing!) • Rough term sheet discussions can occur (very rough)
– Think in terms of structure, not the numbers (not yet!) 74

Components that are in the Middle of the Deal Process • Build the relationship • MTA (if a “taste spoon” is appropriate)
– This should be done quickly but carefully if a deal is contingent upon the outcome of experiments
• Detailed due diligence • Negotiating terms (Field, Territory, Scope, etc.) • Sell the deal internally
– Get clarity on deal-stopper issues – Inform executive management of progress and identity of partner
• Manage to a short list of issues – Ideally the non-binding term sheet is agreed to in full by the end of this process
(subject to completion of due diligence and executive management approval) • Start writing any research, development or commercialization plans that need
to accompany the contract
75

Components that are Late in the Deal Process
• Build the relationship • Finalize diligence
– This would include assuring that the patent ownership or registration is correct and valid
– Providing final scientific updates if the process has taken a long time • Negotiate the contract (do as much of the drafting yourself
whenever possible) • Refine the research, development or commercialization plans • Final approvals – know what approvals are necessary and plan for
them • CLOSE the deal!
76

What is “Due Diligence”? • Due diligence is the potential partner’s process of “getting under
the hood” of your company/program • Due diligence will be performed on several different fronts
– Intellectual property – Technical (Science, Compound, Facilities) – Legal – Financial
• Due diligence is perhaps the key to the entire process – It shows both your ability to be prepared and professional as well as that of
the potential partner – Learn from it – Do not become defensive – Be very responsive
77

Due Diligence – Intellectual Property • Intellectual property due diligence
– Have invention disclosure system ready – Have all applications and patents and their status and
prosecution history well organized in spread sheets – Have a document room ready with all relevant files – Exclude any opinions (e.g. FTO) – In the best case, have IP counsel “on call” to take questions
78

Due Diligence – Science and Materials • Ask the potential partner for a list of questions and documents in
order to prepare • Organize all reports and protocols and have them in the diligence
room • Convene your team AHEAD of time
– Discuss what each person’s assignment will be – Are there any “off-limit” topics? – Answer only the questions asked – Encourage them to stick to the facts that they can back-up with evidence
• Tell your team members that it is better to say “I don’t know” or to come get you if they don’t know whether they should answer
79

Due Diligence – Hosting Site Visits • YOU are in charge • Offer to arrange their stay and transportation to and from a hotel if needed • Offer to take them out for dinner with your team (begin to build the longer
term relationship) • Ensure that everyone looks professional for the first day • Have food and drink ready for your guests • Give them privacy • Make sure the labs are cleaned and offices are organized (if their team will be
visiting any offices) • Make sure all white-boards are clean and the meeting room doesn‘t have any
left over notes on tables or shelves • Make sure you and they understand your policy on copies of documents being
removed from the building • Check on progress but don’t hover around your guests
80

Electronic Data Rooms • Becoming more and more common • Advantages:
– Easy to organize materials and add documents – Can track what documents are reviewed and by whom – Can have multiple companies reviewing information simultaneously – Sometime speeds process
• Disadvantages: – Lose some (all?) of the face-to-face interactions – Questions don‘t necessarily get asked as readily – opportunity to correct
misunderstandings may be missed
• Be sure to think about how you incorporate an electronic data room in the context of your deal – Can make a lot of sense in a competitive deal, one where there is a lot of data, as well as
one that strictly licensing – Consider still having a face-to-face diligence visit to answer questions and develop
relationships
81
CEO/EXECS
Finance
IP and Legal
Research and Development
BUSINESS DEVELOPMENT
BUSINESS DEVELOPMENT
Internal Team Partner
Senior Research Champion
Senior Business Executive
A coordinated message backed up by relationship building will help close the deal
Don’t forget!
82

Getting the deal approved • Internal approval
– Is everyone on board? – Understanding of each person‘s role to make the deal succeed?
• Shareholder approval – Board of Directors and shareholder rights (vetos etc) – Have you aligned interests of VCs, others and company?
• Wall Street – Pre-FDA approval programs are question marks – Early stage programs can be viewed as liabilities
• Post-signing – Shareholder perspectives might change
83

Formal Deal Process • A formal deal process (or auction) with deadlines for key
activities, such as term sheets & diligence, can help drive competition that will maximize deal value and speed time to close
• Not all deals are well suited – Need true competition for the asset – 4 or more potential partners moving forward
with serious discussions
• Do not declare a process prematurely – A failed process (no one meeting the deadlines you impose) is much worse than not
having one at all
• Make sure to be realistic in timeframes • Communicate clearly & consistently
84

Launching the Operating Relationship
• Joint Steering Committees • Project Teams • Work plans
Research Development Commercialization
85

Joint Steering Committees
• Oversight for the collaboration • Typically equal numbers of appropriately senior representatives
– Most often 3+3 – “Senior” most often means Directors and VPs
• Responsibilities – General oversight – Resource allocation decisions/approvals – Setting of goals/Determination of success – Authorizing 3rd party engagements (e.g. academic labs, CROs, etc.) – Resolving disagreements
• Typically meet on a quarterly basis
86

Dispute Resolution • The contract will usually say…
– JSC to resolve disputes – Failing that, escalation to senior executives – Failing that, typically either of binding arbitration or the
more powerful party has final say
• The reality… – Should really be handled by the JSC – If not, try again… really hard! – If still not resolved then… you’ve probably got a major
problem and the contract mechanism may not help – That’s why relationship-building is so important
87

Project Teams • This is the where the real work gets done • Membership really depends on the stage of the program • Core members
– Project leaders (one from each side) • Senior Scientist or Clinician
– Research Scientists/Research Associates – DMPK/Toxicology – Clinical – Regulatory – Manufacturing – Program manager
• Others? – Alliance manager/Business Development (as needed) – IP manager/counsel (as needed) – Corporate communications (on rare occasion?)
88

Project Team Activities • Draft the project work-plan and update as required
– Align scientific reality with business objectives – Make clear assignments of roles and responsibilities – Are the resource allocations appropriate? – Is the timeframe appropriate? – Does plan account for expected timing of milestone events? – Have the parties agreed to success criteria so that you’ll know when
the milestone has been met? • Meet regularly to review activities/data
– Weekly or fortnightly are typical – Keep minutes/Track action items
• Report to the JSC – Informal updates as often as warranted (“managing up”) – Formal presentations (at the quarterly meeting)
89

Intellectual Property • The easy part:
– What was mine is mine… – What was yours is yours…
• What about the new inventions arising under the collaboration – Ownership usually follows inventorship
• Solely-owned vs. jointly-owned – How and what to share
• For the project at hand, a good contract should allow open sharing • The tricky part has to do with new IP that a party may want to use outside
of the partnership – How do IP terms affect behavior?
90

Planning for success • When to think like a “lawyer”
– A well-drafted agreement must anticipate worst case scenarios – However, a well-drafted agreement should promote positive behavior
• Practical approaches – Draft good work plans and communicate the goals upward regularly – Meet regularly with your counterparts and build the human side of
the relationship – Remember that no agreement can anticipate all contingencies… when
the terms no longer seem to make sense, it’s time to re-engage the deal folks and examine whether modifications are necessary
• Draft amendments as soon as possible
91
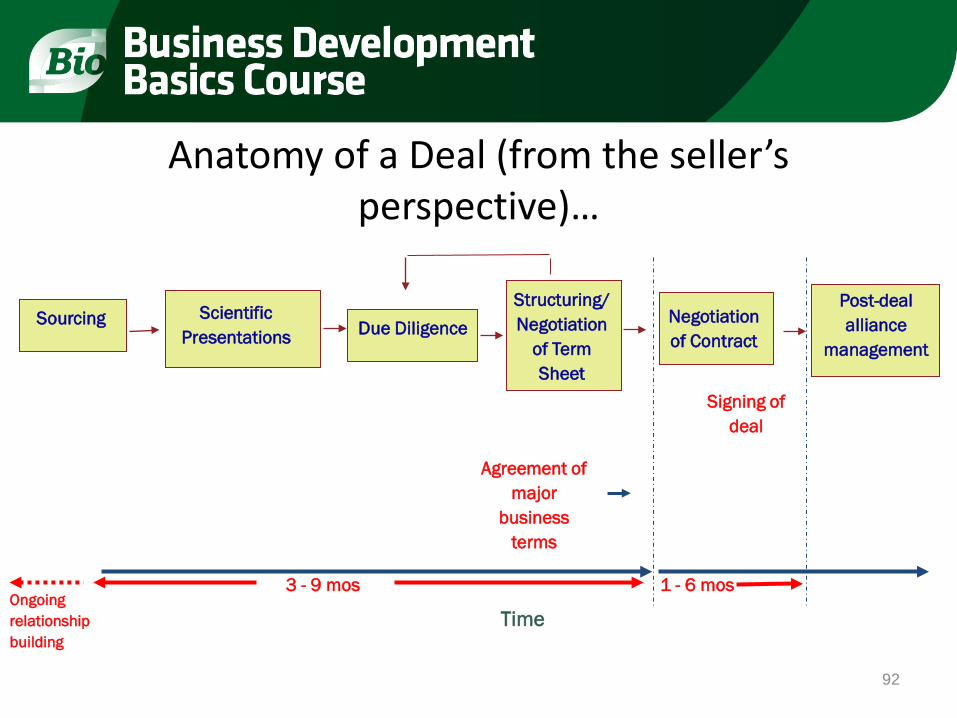
Anatomy of a Deal (from the seller’s perspective)…
Sourcing Scientific Presentations
Structuring/ Negotiation
of Term Sheet
Negotiation of Contract
Post-deal alliance
management
Time
Signing of deal
3 - 9 mos 1 - 6 mos
Agreement of major
business terms
Due Diligence
Ongoing relationship building
92
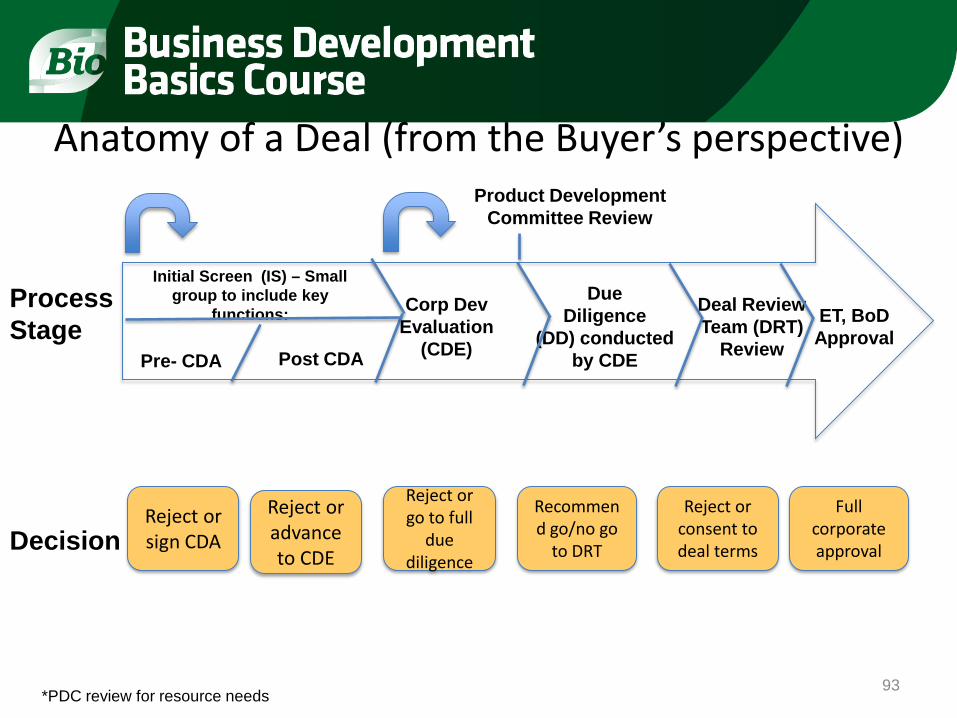
Anatomy of a Deal (from the Buyer’s perspective)
Initial Screen (IS) – Small group to include key
functions: Corp Dev Evaluation
(CDE)
Reject or sign CDA
Reject or go to full
due diligence
Product Development Committee Review
Due Diligence
(DD) conducted by CDE
Recommend go/no go
to DRT
Process Stage
Decision
Deal Review Team (DRT)
Review
ET, BoD Approval
Full corporate approval
Reject or consent to deal terms
*PDC review for resource needs
Post CDA
Reject or advance to CDE
Pre- CDA
93

You have to Kiss a Lot of Frogs before you find the Prince! 21 companies contacted for deal 2 - 5 initial non-confidential meetings/phone calls per company
11 Confidential Disclosure Agreements negotiated and signed 4-10 confidential scientific meetings/updates per company 6 companies conducted due diligence 8-15 due diligence discussions/meetings/ updates per company including IP diligence
5 term sheets
5-10 negotiation sessions per term sheet
10-15 negotiation sessions for contract
25 – 50 substantive interactions per co. before deal was signed!
Example Deal
94

Business Development is not (usually) a linear process • Most BD efforts do not end up in a transaction…but you hope you
make relationships along the way… – Therefore, never burn bridges
• Negotiations are not smooth…often a last minute fly in the ointment…but you hope you learn something from each one (and try to anticipate this in the future) – Therefore, there needs to be high level “buy-in” for the deal
• Companies are more inclined to do deals with people they trust…it is all about the people! – Biotech’s reputation for strong science and for delivering in past
collaborations helps a lot! 95
What Makes a Good Bus Dev Professional? • Selling skills
– Generating as much interest as possible for the asset you are trying to market
• People skills – Managing external discussions/relationships without ever closing the
door – Internal decision making and consensus building
• Negotiating Skills – Every interaction is an opportunity for negotiation
• Analytical skills – Making data driven decisions in valuing and structuring a deal
• Project management skills – Keeping the process moving smoothly – Very important to be responsive and timely to maintain momentum of
a deal 96

Is the Business Model Broken? Considerations for a Business
Development Professional
97

Source: Elsevier Strategic Transactions
Deal Upfront Payments
98

Cost-based approach to valuing an “AVERAGE” compound
Source: Data through IND from In-Vivo Nov 2006 “The $100 M IND” – based on industry avg. Data for Phase I estimated by Exelixis.
Screening/Hit to Lead
Lead Op Preclinical/IND
Phase I
Cost per stage($ M) $1.5 $13.0 $8.2 $10.0 POS per stage 50% 61% 51% 65%Cumulative POS 50% 30% 15% 10%# of screening progs for one successful compound
6.5 10.0
Time to IND per stage (yrs)
5.1 3.3 1.4 1
Risk and time-adjusted cost for one successful compound*
$97.0 $184.3
* Cost of capital used 12%
99

Of the nearly 1000 compounds in development in oncology, >50% address 8 targets
Source: LifeSciVC.com “Cancer Drug Targets: The March of the Lemmings” by Bruce Booth, June 2012
100

Which Will Contribute To An Already Low Success Rate • 20% PTRS in mid-stage trials – why do so many fail?
– 50% for lack of efficacy – 20% for safety – 30% for “strategic reasons” – most rapidly growing category
• Strategic reasons most commonly due to lack of differentiation from existing drugs
against a validated target – Neither first-in-class nor best-in-class cannot survive
• What can we do to improve chances of success?
– Identification of unmet need – Novel mechanisms/therapies – Patient selection strategies, e.g., biomarkers
Source: Nature Reviews Drug Discovery 10:1 (2011) 101

Recent Example: Inception Sciences and Roche
102

In 2005 Versant seeded spin-out of Merck discovery team to form Amira o Peppi Prasit as Amira CSO o 3 discovery programs/5 drug candidates completed Phase 1 within 5 years
Pharma transactions led to successful Amira exit in 2011
o GSK acquired FLAP asthma program ($425M) o BMS acquired LPA1 fibrosis program ($475M)
In 2011 Versant backed spin-out of Amira discovery team to form Inception o Peppi Prasit as Inception CEO, leading ex-Amira drug discovery team o First “build-to-buy" structured acquisition deal closed within 18 months
103

Program #2 Program #1
• Independent structure for each program
• Early stage partnerships co-fund to an exit
Program #4 Program #3
Inception Sciences Incubator
Transferred into independent structures
104

Academic program Pharma partner Drug discovery incubator
• Academic entrepreneurs provide access to potential new drug targets
• Inception translates academic discoveries into drug candidates
• Pharma develops drug candidates into commercial products
105

M&A
NewCo project
Incubate program with academic leaders based on Pharma interest
Successful execution
Structured exit with partner Early partnership
Pharma
Traditional
“Build-to-buy” partnering model
Launch new company Develop drugs over multiple years
Exit path based on Pharma interest
Successful execution
IPO?
Venture funded NewCo
Venture & Pharma fund
NewCo
5-10 years
3-5 years
Successful execution NewCo
project
M&A?
106

• Early access to breakthrough innovations • Externalization of R&D cost • Risk sharing
Advantages for Pharma:
• Early assurance of Pharma interest and commitment • Access to Pharma capabilities • Research funding to supplement venture capital • Assurance around liquidity timeline
Advantages for Versant Ventures & Inception:
107

o “Inception 3” co-created for discovery of novel drugs for sensorineural hearing loss
o Inception team conducts drug discovery
o Academic scientists providing rare know-how and unique platform (Stanford)
o Funded by Versant Ventures and Roche research funding
o Roche acquisition at first IND at preset terms
Roche Enters Hearing-Loss Space In Risk-Sharing Venture With Inception, Versant
108
Roche/Inception/Versant Ventures Transaction – Sept 2012
Recent Example: Onyx and ONO
109

Onyx / Ono Transaction – Sept 2010
Carfilzomib: Phase IIb for Multiple Myeloma Also included Oprozomib (oral compound) in Phase 1
Strong response rate data in 2 large trials
Deal Structure • Extremely competitive process • Japan territory only • $59M up front • $339M including milestones • Significant development funding for
global studies – Ono bears costs for local studies
• Rights to participate in label expansion (aligning interests)
• Largest economics for Japan rights for P2 molecule
Strategic Rationale • US NDA in 2011 • 2 large Phase 3 studies ongoing • Onyx: Seeking to focus resources, not
likely to build in Japan • Ono: declining revenues from legacy
portfolio – Seeking near-term “win” – Seeks innovation reimbursement – Safety profile of CFZ is attractive;
Japanese treaters are scrupulous about “doing no harm.”
• Ono: Seeking to expand in oncology 110

111
Questions??
