ck-12 basic probability and statistics, a full course ... · pdf fileck-12 foundation ck-12...
TRANSCRIPT
CK-12 FOUNDATION
CK-12 Basic Probability andStatistics, A Full Course,Teacher’s Edition, Answer Key
Meery
CK-12 Foundation is a non-profit organization with a mission to reduce the cost of textbook materialsfor the K-12 market both in the U.S. and worldwide. Using an open-content, web-based collaborativemodel termed the “FlexBook,” CK-12 intends to pioneer the generation and distribution of high-qualityeducational content that will serve both as core text as well as provide an adaptive environment for learning,powered through the FlexBook Platform™.
Copyright © 2011 CK-12 Foundation, www.ck12.org
Except as otherwise noted, all CK-12 Content (including CK-12 Curriculum Material) is made availableto Users in accordance with the Creative Commons Attribution/Non-Commercial/Share Alike 3.0 Un-ported (CC-by-NC-SA) License (http://creativecommons.org/licenses/by-nc-sa/3.0/), as amendedand updated by Creative Commons from time to time (the “CC License”), which is incorporated hereinby this reference. Specific details can be found at http://www.ck12.org/terms.
Printed: June 10, 2011

Contents
1 Independent and DependentEvents, Answer Key 11.1 Answer Key for Review Questions . . . . . . . . . . . . . . . . . . . . . . . . . . . . . . . . 1
2 The Next Step ... ConditionalProbability, Answer Key 72.1 Answer Key for Review Questions . . . . . . . . . . . . . . . . . . . . . . . . . . . . . . . . 7
3 Introduction to DiscreteRandom Variables, Answer Key 183.1 Answer Key for Review Questions . . . . . . . . . . . . . . . . . . . . . . . . . . . . . . . . 18
4 Probability Distributions,Answer Key 274.1 Answer Key for Review Questions . . . . . . . . . . . . . . . . . . . . . . . . . . . . . . . . 27
5 Measures of Central Tendency,Answer Key 365.1 Answer Key for Review Questions . . . . . . . . . . . . . . . . . . . . . . . . . . . . . . . . 36
6 The Shape, Center and Spreadof a Normal Distribution,Answer Key 446.1 Answer Key for Review Questions . . . . . . . . . . . . . . . . . . . . . . . . . . . . . . . . 44
7 Organizing and DisplayingDistributions of Data, AnswerKey 527.1 Answer Key for Review Questions . . . . . . . . . . . . . . . . . . . . . . . . . . . . . . . . 52
8 Organizing and DisplayingData for Comparison, AnswerKey 648.1 Answer Key for Review Questions . . . . . . . . . . . . . . . . . . . . . . . . . . . . . . . . 64
www.ck12.org ii
Chapter 1
Independent and DependentEvents, Answer Key
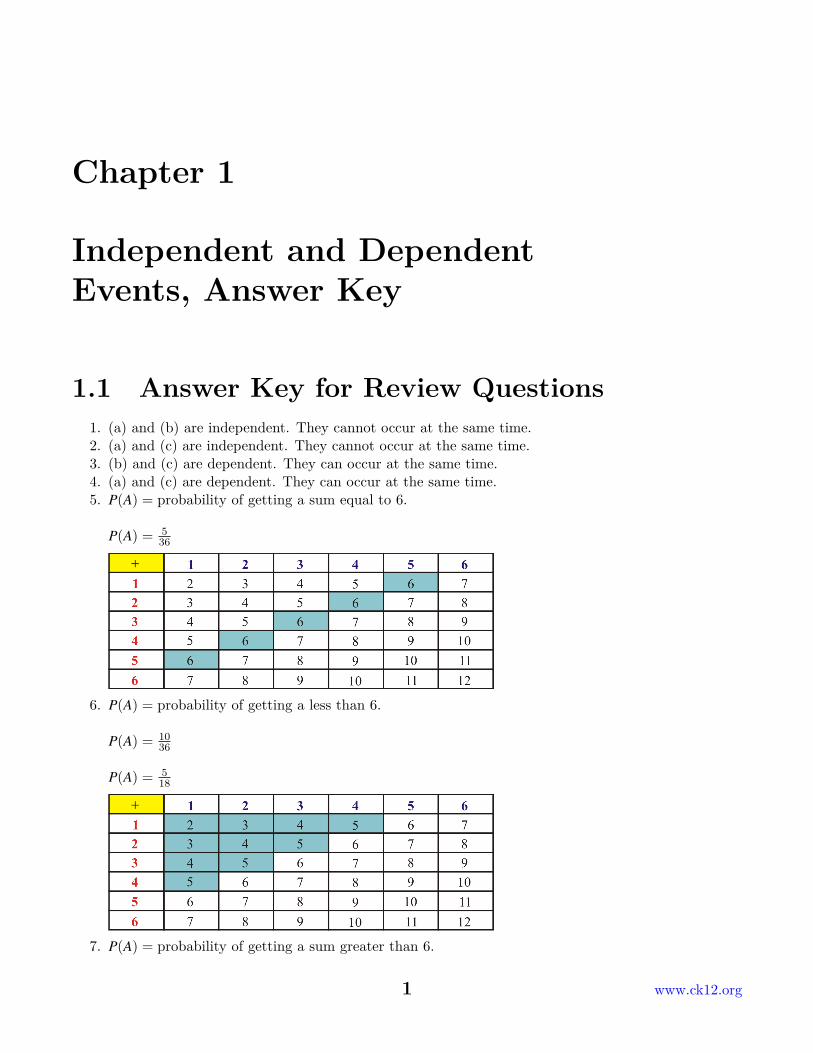
1.1 Answer Key for Review Questions1. (a) and (b) are independent. They cannot occur at the same time.2. (a) and (c) are independent. They cannot occur at the same time.3. (b) and (c) are dependent. They can occur at the same time.4. (a) and (c) are dependent. They can occur at the same time.5. P(A) = probability of getting a sum equal to 6.
P(A) = 536
6. P(A) = probability of getting a less than 6.
P(A) = 1036
P(A) = 518
7. P(A) = probability of getting a sum greater than 6.
1 www.ck12.org
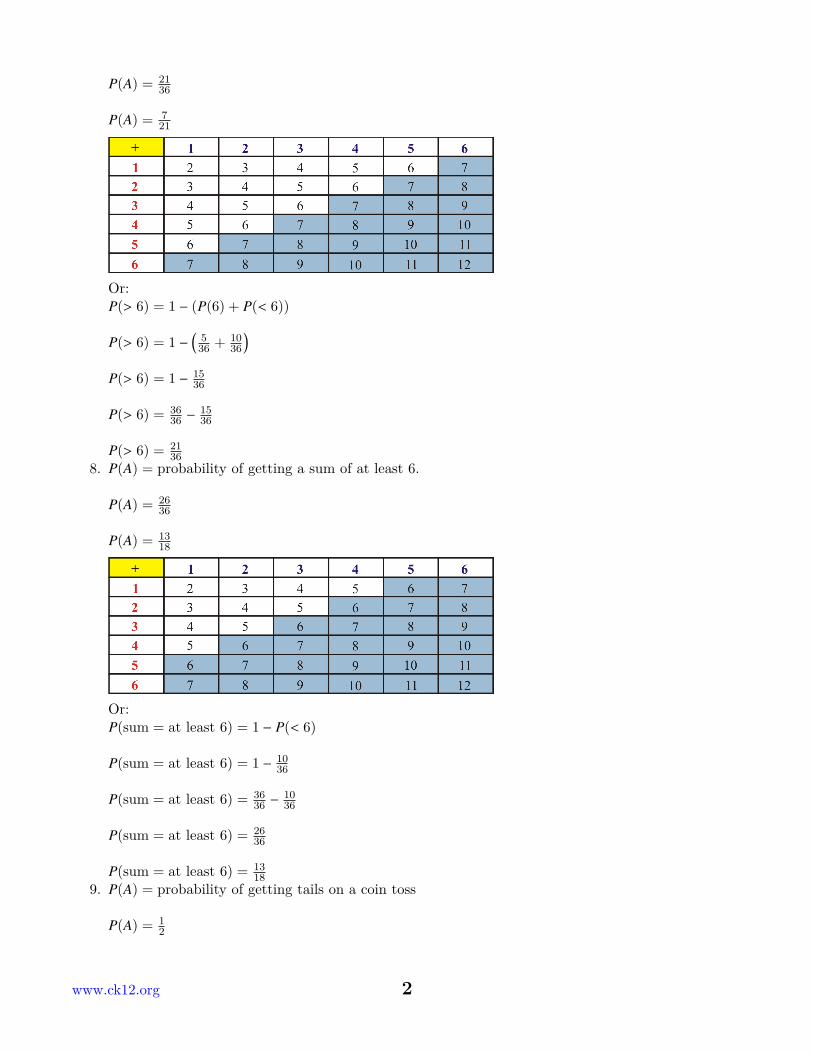
P(A) = 2136
P(A) = 721
Or:P(> 6) = 1 − (P(6) + P(< 6))
P(> 6) = 1 −(
536 + 10
36
)P(> 6) = 1 − 15
36
P(> 6) = 3636 −
1536
P(> 6) = 2136
8. P(A) = probability of getting a sum of at least 6.
P(A) = 2636
P(A) = 1318
Or:P(sum = at least 6) = 1 − P(< 6)
P(sum = at least 6) = 1 − 1036
P(sum = at least 6) = 3636 −
1036
P(sum = at least 6) = 2636
P(sum = at least 6) = 1318
9. P(A) = probability of getting tails on a coin toss
P(A) = 12
www.ck12.org 2

P(B) = probability of getting a 5 on a die toss
P(B) = 16
P(A and B) = 12 ×
16
P(A ∩ B) = 112
10.
11.
12. P(A) = probability of selecting a student who wants a uniform
P(A) = 0.45
P(B) = probability of selecting a student who does not want a uniform
P(B) = 0.55
P(A or B) = 0.45 + 0.55
P(A or B) = 113.
14. P(A) = probability of selecting a number that is a multiple of 4 = {4, 8, 12, 16, 20}
P(A) = 510
P(B) = probability of selecting a number that is a multiple of 5 = {10, 20}
P(B) = 210
3 www.ck12.org
P(A and B) = 510 ×
210
P(A ∩ B) = 10100
P(A ∩ B) = 110
P(A ∪ B) = P(A) + P(B) − P(A ∩ B)
P(A ∪ B) = 510 + 2
10 −110
P(A ∪ B) = 610
P(A ∪ B) = 35
15. P(A) = probability of selecting a red jelly bean
P(A) = 1037
P(B) = probability of selecting a green jelly bean
P(B) = 1237
P(A or B) = 1037 + 12
37
P(A ∪ B) = 2237
16. P(A) = probability of selecting a blue or green jelly bean
P(A) = P(Blue or Green)1037 + 12
37
P(A) = 2737
P(B) = probability of selecting a red jelly bean on the second draw
P(B) = 1036
P(A and B) = 2737 ×
1036
P(A ∩ B) = 2701332
P(A ∩ B) = 1574
17. P(A) = probability of a student taking chemistry
P(A) = 1760
P(B) = probability of a student taking math
P(B) = 1360
P(A or B) = 1760 + 13
60
www.ck12.org 4
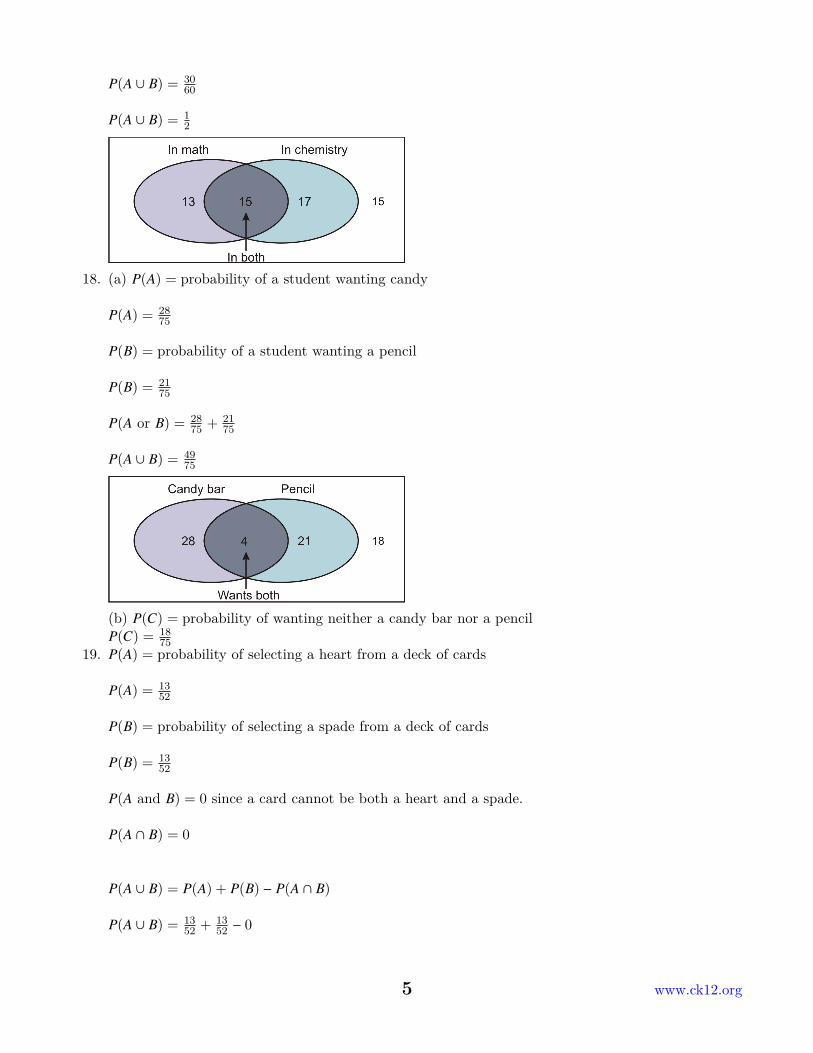
P(A ∪ B) = 3060
P(A ∪ B) = 12
18. (a) P(A) = probability of a student wanting candy
P(A) = 2875
P(B) = probability of a student wanting a pencil
P(B) = 2175
P(A or B) = 2875 + 21
75
P(A ∪ B) = 4975
(b) P(C) = probability of wanting neither a candy bar nor a pencilP(C) = 18
7519. P(A) = probability of selecting a heart from a deck of cards
P(A) = 1352
P(B) = probability of selecting a spade from a deck of cards
P(B) = 1352
P(A and B) = 0 since a card cannot be both a heart and a spade.
P(A ∩ B) = 0
P(A ∪ B) = P(A) + P(B) − P(A ∩ B)
P(A ∪ B) = 1352 + 13
52 − 0
5 www.ck12.org
P(A ∪ B) = 2652
P(A ∪ B) = 12
The events are mutually exclusive since P(A ∩ B) = 0.
20. P(A) = probability of selecting a heart from a deck of cards
P(A) = 1352
P(B) = probability of selecting a face card from a deck of cards
P(B) = 1252
P(A and B) = 1352 ×
1252
P(A ∩ B) = 1562704
P(A ∩ B) = 352
P(A ∪ B) = P(A) + P(B) − P(A ∩ B)
P(A ∪ B) = 1352 + 12
52 −352
P(A ∪ B) = 2252
P(A ∪ B) = 1126
The events are not mutually exclusive since P(A ∩ B) , 0.
www.ck12.org 6
Chapter 2
The Next Step ... ConditionalProbability, Answer Key
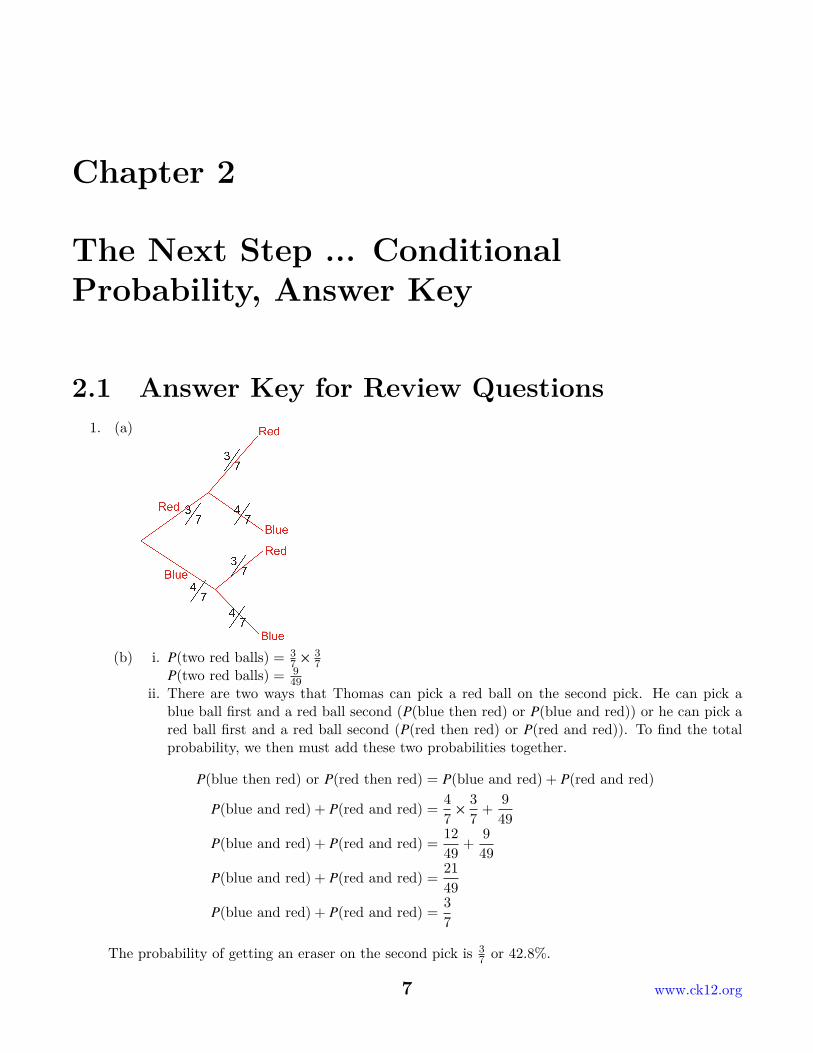
2.1 Answer Key for Review Questions1. (a)
(b) i. P(two red balls) = 37 ×
37
P(two red balls) = 949
ii. There are two ways that Thomas can pick a red ball on the second pick. He can pick ablue ball first and a red ball second (P(blue then red) or P(blue and red)) or he can pick ared ball first and a red ball second (P(red then red) or P(red and red)). To find the totalprobability, we then must add these two probabilities together.
P(blue then red) or P(red then red) = P(blue and red) + P(red and red)
P(blue and red) + P(red and red) =47× 3
7+
949
P(blue and red) + P(red and red) =1249
+949
P(blue and red) + P(red and red) =2149
P(blue and red) + P(red and red) =37
The probability of getting an eraser on the second pick is 37 or 42.8%.
7 www.ck12.org
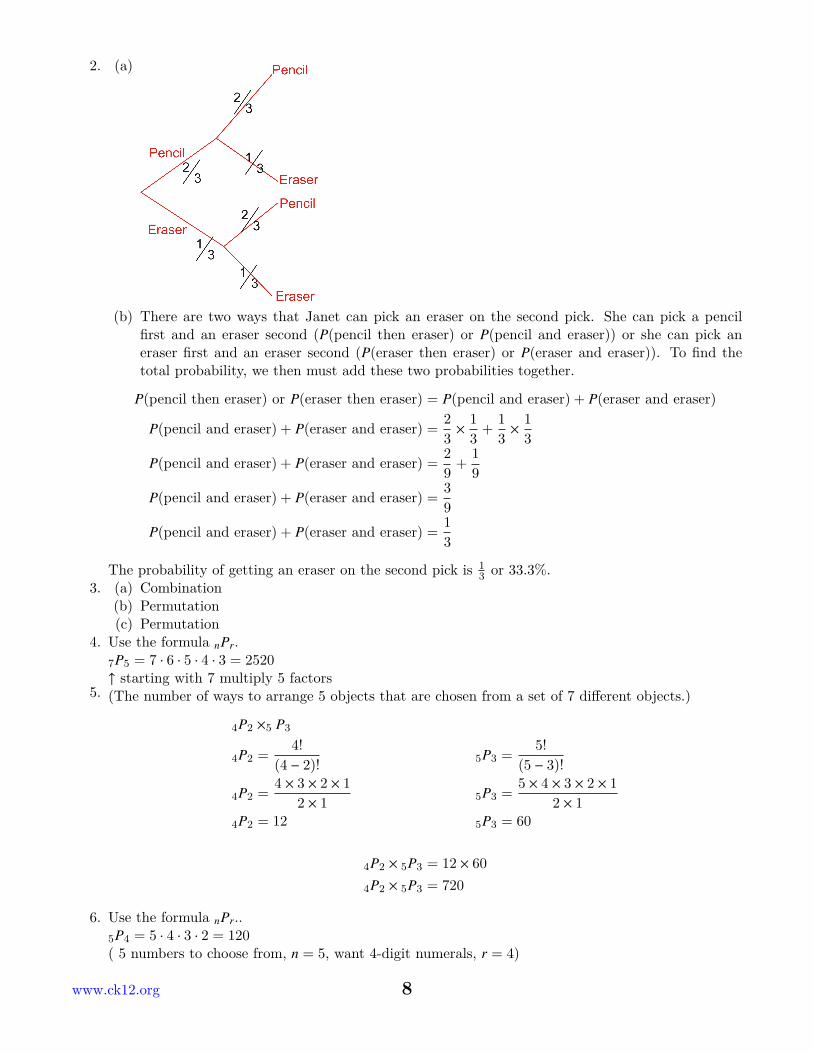
2. (a)
(b) There are two ways that Janet can pick an eraser on the second pick. She can pick a pencilfirst and an eraser second (P(pencil then eraser) or P(pencil and eraser)) or she can pick aneraser first and an eraser second (P(eraser then eraser) or P(eraser and eraser)). To find thetotal probability, we then must add these two probabilities together.
P(pencil then eraser) or P(eraser then eraser) = P(pencil and eraser) + P(eraser and eraser)
P(pencil and eraser) + P(eraser and eraser) =23× 1
3+
13× 1
3
P(pencil and eraser) + P(eraser and eraser) =29
+19
P(pencil and eraser) + P(eraser and eraser) =39
P(pencil and eraser) + P(eraser and eraser) =13
The probability of getting an eraser on the second pick is 13 or 33.3%.
3. (a) Combination(b) Permutation(c) Permutation
4. Use the formula nPr.7P5 = 7 · 6 · 5 · 4 · 3 = 2520↑ starting with 7 multiply 5 factors(The number of ways to arrange 5 objects that are chosen from a set of 7 different objects.)5.
4P2 ×5 P3
4P2 =4!
(4 − 2)! 5P3 =5!
(5 − 3)!
4P2 =4 × 3 × 2 × 1
2 × 1 5P3 =5 × 4 × 3 × 2 × 1
2 × 14P2 = 12 5P3 = 60
4P2 × 5P3 = 12 × 60
4P2 × 5P3 = 720
6. Use the formula nPr..5P4 = 5 · 4 · 3 · 2 = 120( 5 numbers to choose from, n = 5, want 4-digit numerals, r = 4)
www.ck12.org 8
7. There are nine (9) letters in the word REFERENCE therefore n = 9. We want 9 letter arrangements;therefore we are choosing nine (9) objects at a time. In this example r = 9. In this problem, we areusing a group of letters with letters that repeat. In the group of nine letters (REFERENCE), thereare two R’s and four E’s. So x1 = 2 and x2 = 4.
8. There are eleven (11) letters in the word MISSISSIPPI therefore n = 11. We want 11 letter ar-rangements; therefore we are choosing eleven (11) objects at a time. In this example r = 11. Inthis problem, we are using a group of letters with letters that repeat. In the group of eleven letters(MISSISSIPPI), there are two P’s, four I’s, and four S’s. So x1 = 2, x2 = 4 and x3 = 4.
9. There are eleven (11) letters in the word MATHEMATICS therefore n = 11. We want 11 letterarrangements; therefore we are choosing eleven (11) objects at a time. In this example r = 11. Inthis problem, we are using a group of letters with letters that repeat. In the group of eleven letters(MATHEMATICS), there are two M’s, two A’s, and two T’s. So x1 = 2, x2 = 2 and x3 = 2.
9 www.ck12.org
10. There are eight (8) cookies that we can order therefore n = 8. We want 8 different cookie orders;therefore we are choosing eight (8) objects at a time. In this example r = 8. In this problem, we areusing a group of cookies with types of cookies that repeat. In the group of eight cookies (4 chocolatechip, 2 oatmeal and 2 double chocolate cookies), there are four chocolate chips, two oatmeal, andtwo double chocolate. So x1 = 4, x2 = 2 and x3 = 2.
11. There are fifteen (15) questions on the math test that therefore n = 15. We have a maximum of15 different answer sheets possible; therefore we are choosing fifteen (15) objects at a time. In thisexample r = 15. In this problem, we are using a group of answer choices with types that repeat. Inthe group of answer choices (5 questions have the answer A, 4 have the answer B, 3 have the answerC, 2 have the answer D, and 1 has the answer E), there are five A’s, four B’s, three C’s, and two D’s.So x1 = 5, x2 = 4, x3 = 3 and x4 = 2.
www.ck12.org 10
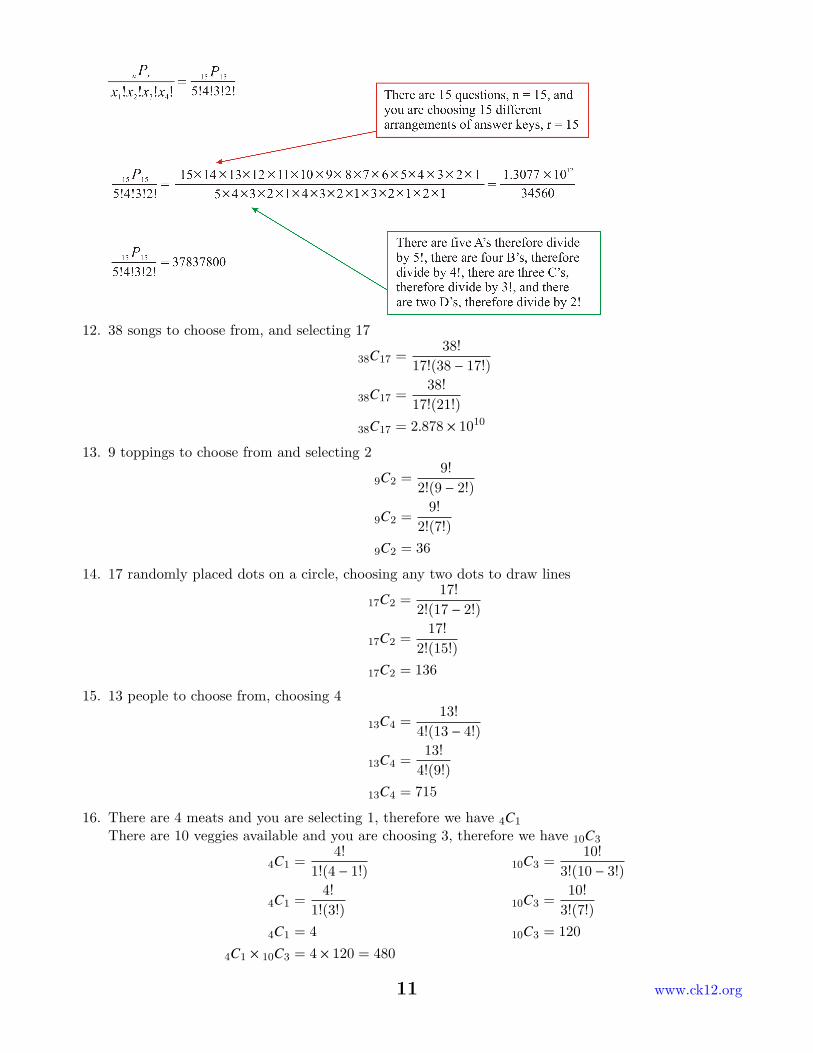
12. 38 songs to choose from, and selecting 17
38C17 =38!
17!(38 − 17!)
38C17 =38!
17!(21!)
38C17 = 2.878 × 10¹⁰
13. 9 toppings to choose from and selecting 2
9C2 =9!
2!(9 − 2!)
9C2 =9!
2!(7!)
9C2 = 36
14. 17 randomly placed dots on a circle, choosing any two dots to draw lines
17C2 =17!
2!(17 − 2!)
17C2 =17!
2!(15!)
17C2 = 136
15. 13 people to choose from, choosing 4
13C4 =13!
4!(13 − 4!)
13C4 =13!
4!(9!)
13C4 = 715
16. There are 4 meats and you are selecting 1, therefore we have 4C1
There are 10 veggies available and you are choosing 3, therefore we have 10C3
4C1 =4!
1!(4 − 1!) 10C3 =10!
3!(10 − 3!)
4C1 =4!
1!(3!) 10C3 =10!
3!(7!)
4C1 = 4 10C3 = 120
4C1 × 10C3 = 4 × 120 = 480
11 www.ck12.org
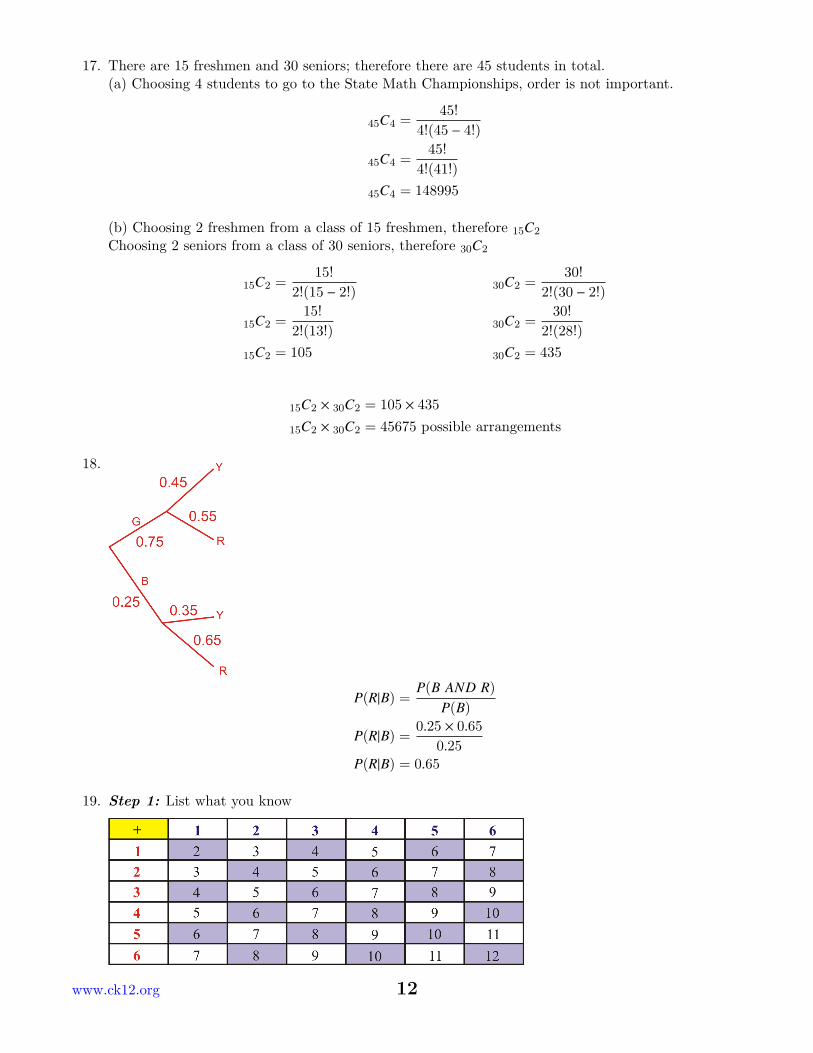
17. There are 15 freshmen and 30 seniors; therefore there are 45 students in total.(a) Choosing 4 students to go to the State Math Championships, order is not important.
45C4 =45!
4!(45 − 4!)
45C4 =45!
4!(41!)
45C4 = 148995
(b) Choosing 2 freshmen from a class of 15 freshmen, therefore 15C2
Choosing 2 seniors from a class of 30 seniors, therefore 30C2
15C2 =15!
2!(15 − 2!) 30C2 =30!
2!(30 − 2!)
15C2 =15!
2!(13!) 30C2 =30!
2!(28!)
15C2 = 105 30C2 = 435
15C2 × 30C2 = 105 × 435
15C2 × 30C2 = 45675 possible arrangements
18.
P(R|B) =P(B AND R)
P(B)
P(R|B) =0.25 × 0.65
0.25P(R|B) = 0.65
19. Step 1: List what you know
www.ck12.org 12
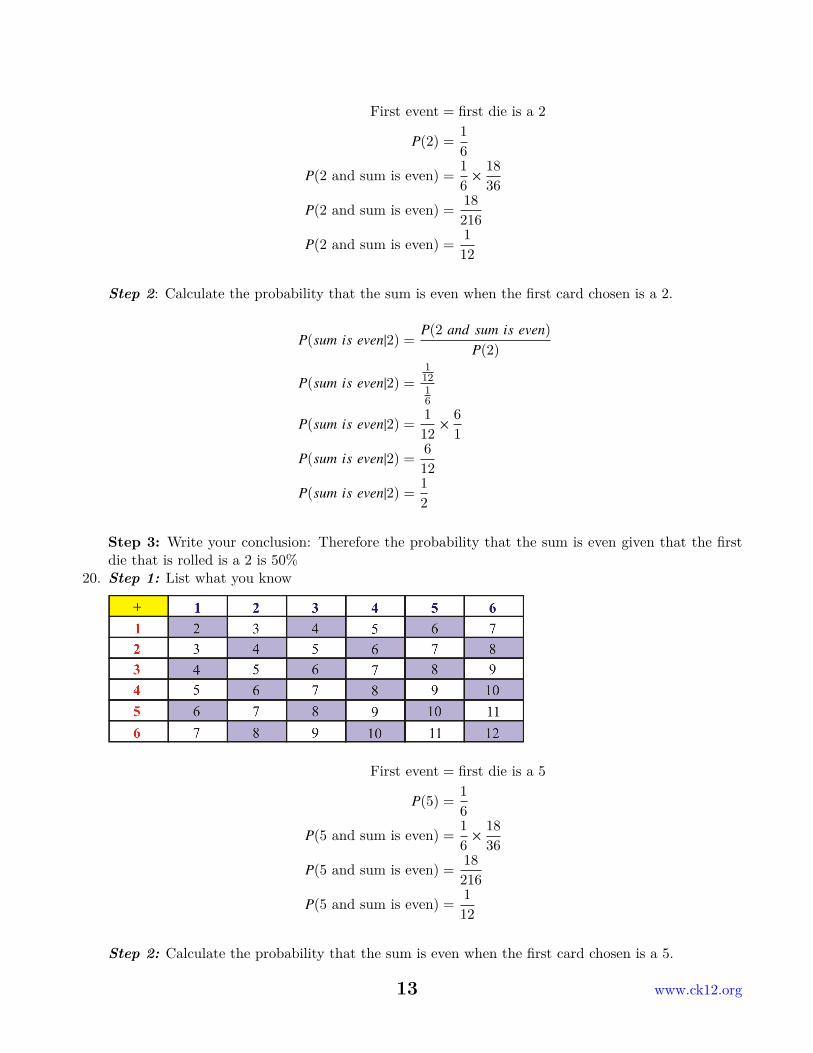
First event = first die is a 2
P(2) =16
P(2 and sum is even) =16× 18
36
P(2 and sum is even) =18216
P(2 and sum is even) =112
Step 2: Calculate the probability that the sum is even when the first card chosen is a 2.
P(sum is even|2) =P(2 and sum is even)
P(2)
P(sum is even|2) =11216
P(sum is even|2) =112× 6
1
P(sum is even|2) =612
P(sum is even|2) =12
Step 3: Write your conclusion: Therefore the probability that the sum is even given that the firstdie that is rolled is a 2 is 50%
20. Step 1: List what you know
First event = first die is a 5
P(5) =16
P(5 and sum is even) =16× 18
36
P(5 and sum is even) =18216
P(5 and sum is even) =112
Step 2: Calculate the probability that the sum is even when the first card chosen is a 5.
13 www.ck12.org
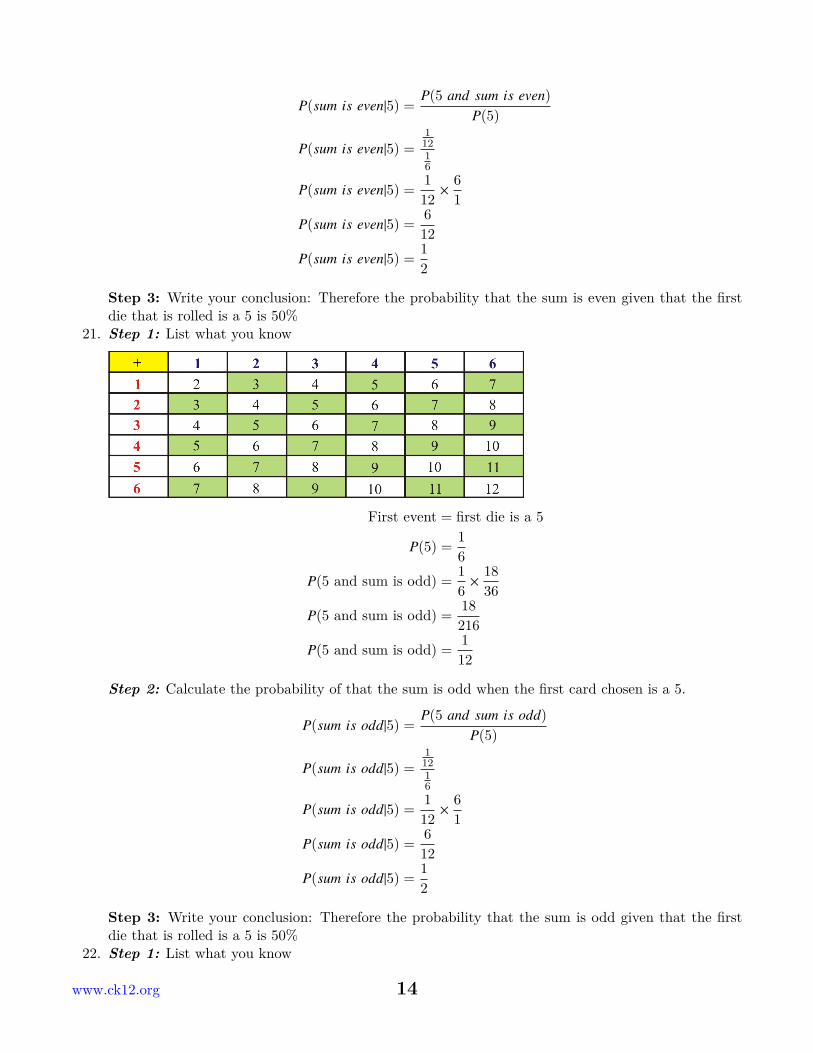
P(sum is even|5) =P(5 and sum is even)
P(5)
P(sum is even|5) =11216
P(sum is even|5) =112× 6
1
P(sum is even|5) =612
P(sum is even|5) =12
Step 3: Write your conclusion: Therefore the probability that the sum is even given that the firstdie that is rolled is a 5 is 50%
21. Step 1: List what you know
First event = first die is a 5
P(5) =16
P(5 and sum is odd) =16× 18
36
P(5 and sum is odd) =18216
P(5 and sum is odd) =112
Step 2: Calculate the probability of that the sum is odd when the first card chosen is a 5.
P(sum is odd|5) =P(5 and sum is odd)
P(5)
P(sum is odd|5) =11216
P(sum is odd|5) =112× 6
1
P(sum is odd|5) =612
P(sum is odd|5) =12
Step 3: Write your conclusion: Therefore the probability that the sum is odd given that the firstdie that is rolled is a 5 is 50%
22. Step 1: List what you know
www.ck12.org 14
First event = being dealt the king
P(King) =452
P(red card and King) =452× 26
51
P(red card and King) =1042652
P(red card and King) =26663
Step 2: Calculate the probability of choosing red card as a second card when a king is chosen as afirst card.
P(red card|King) =P(King and red card)
P(King)
P(red card|King) =26663452
P(red card|King) =26663× 52
4
P(red card|King) =13522652
P(red card|King) =2651
Step 3: Write your conclusion: Therefore the probability of selecting a red card as a second cardwhen a king is chosen as a first card is 51%.
23. Step 1: List what you know
First event = being dealt the seven
P(seven) =452
P(black card and seven) =452× 26
51
P(black card and seven) =1042652
P(black card and seven) =26663
15 www.ck12.org
Step 2: Calculate the probability of choosing black card as a second card when a seven is chosen asa first card.
P(black card|seven) =P(seven and black card)
P(seven)
P(black card|seven) =26663452
P(black card|seven) =26663× 52
4
P(black card|seven) =13522652
P(black card|seven) =2651
Step 3: Write your conclusion: Therefore the probability of selecting a black card as a second cardwhen a seven is chosen as a first card is 51%.
24. Step 1: List what you know
First event = getting an allowance for doing choresP(doing chores) = 0.55
P(doing chores and being good) = 0.25
Step 2: Calculate the probability of choosing being good given that they have received an allowance.
P(being good|doing chores) =P(doing chores and being good)
P(doing chores)
P(being good|doing chores) =0.250.55
P(being good|doing chores) = 0.45
Step 3: Write your conclusion: Therefore the probability of a child will choose to be good giventhat they are given an allowance for doing chores is 45%.
25. Step 1: List what you know
First event = student speaks FrenchP(French) = 0.45
P(French and English) = 0.15
Step 2: Calculate the probability of a student speaks English given that they can speak French.
P(English|French) =P(French and English)
P(French)
P(English|French) =0.150.45
P(English|French) = 0.33
Step 3: Write your conclusion: Therefore the probability of a student speaks English given thatthey speak French is 33%.
26. Step 1: List what you know
First event = student takes ArtP(Art) = 0.65P(Art and Statistics) = 0.10
Step 2: Calculate the probability of a student takes Statistics given that they take Art.
www.ck12.org 16
P(S tatistics|Art) =P(Art and S tatistics)
P(Art)
P(S tatistics|Art) =0.100.65
P(S tatistics|Art) = 0.15
Step 3: Write your conclusion: Therefore the probability of a student takes Statistics given thatthey are taking Art is 15%.
17 www.ck12.org
Chapter 3
Introduction to DiscreteRandom Variables, Answer Key
3.1 Answer Key for Review Questions1.
Table 3.1:
Probability Statement P(X)
a. The probability of this event will never occur. e P(X) = 1.0b. The probability of this event is highly likely. d P(X) = 0.33c. The probability of this event is very likely. c P(X) = 0.67d. The probability of this event is somewhat likely. a P(X) = 0.00e. The probability of this event is certain. b P(X) = 0.95
2.
Table 3.2:
Probability Statement P(X)
a. I bought a ticket for the State Lottery. Theprobability of a successful event (winning) is likelyto be:
d P(X) = 0.80
b. I have a bag of equal numbers of red and greenjelly beans. The probability of reaching into thebag and picking out a red jelly bean is likely to be:
b P(X) = 0.50
c. My dad teaches math and my mom chemistry.The probability that I will be expected to studyscience or math is likely to be:
c P(X) = 0.67
d. Our class has the highest test scores in the StateMath Exams. The probability that I have scored agreat mark is likely to be:
e P(X) = 1.0
www.ck12.org 18
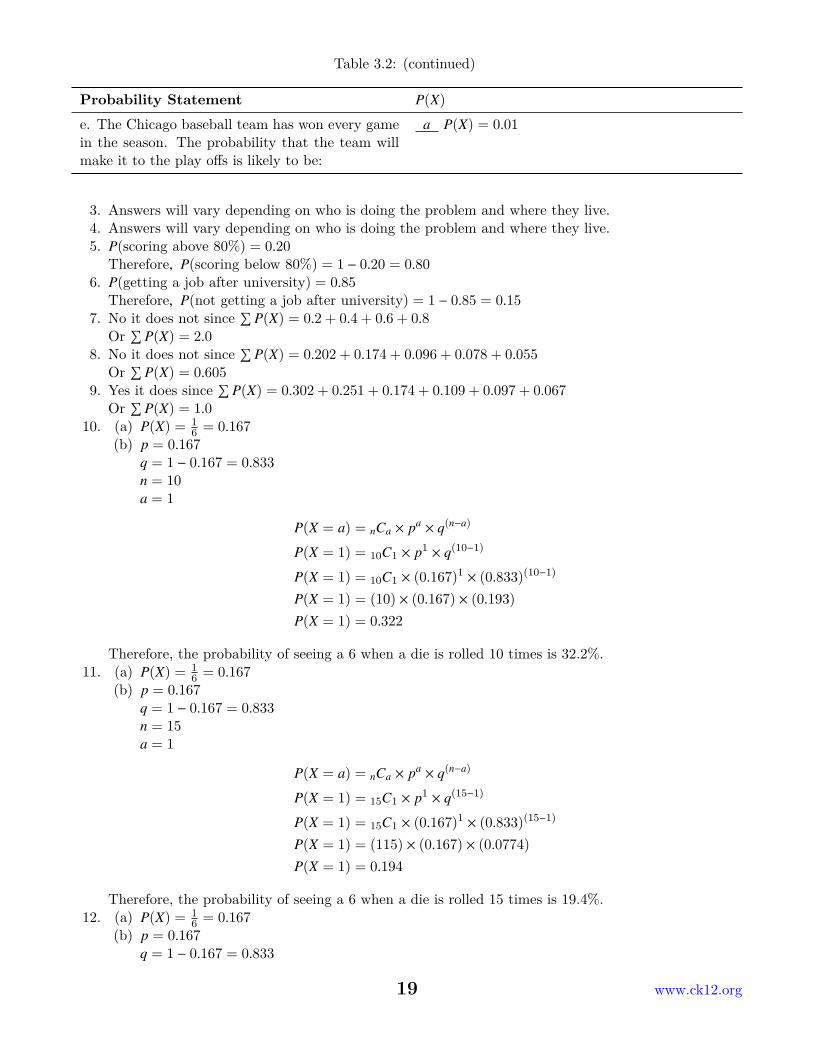
Table 3.2: (continued)
Probability Statement P(X)
e. The Chicago baseball team has won every gamein the season. The probability that the team willmake it to the play offs is likely to be:
a P(X) = 0.01
3. Answers will vary depending on who is doing the problem and where they live.4. Answers will vary depending on who is doing the problem and where they live.5. P(scoring above 80%) = 0.20Therefore, P(scoring below 80%) = 1 − 0.20 = 0.80
6. P(getting a job after university) = 0.85Therefore, P(not getting a job after university) = 1 − 0.85 = 0.15
7. No it does not since ∑ P(X) = 0.2 + 0.4 + 0.6 + 0.8Or ∑ P(X) = 2.0
8. No it does not since ∑ P(X) = 0.202 + 0.174 + 0.096 + 0.078 + 0.055Or ∑ P(X) = 0.605
9. Yes it does since ∑ P(X) = 0.302 + 0.251 + 0.174 + 0.109 + 0.097 + 0.067Or ∑ P(X) = 1.0
10. (a) P(X) = 16 = 0.167
(b) p = 0.167q = 1 − 0.167 = 0.833n = 10a = 1
P(X = a) = nCa × pa × q(n−a)
P(X = 1) = 10C1 × p1 × q(10−1)
P(X = 1) = 10C1 × (0.167)1 × (0.833)(10−1)
P(X = 1) = (10) × (0.167) × (0.193)P(X = 1) = 0.322
Therefore, the probability of seeing a 6 when a die is rolled 10 times is 32.2%.11. (a) P(X) = 1
6 = 0.167(b) p = 0.167
q = 1 − 0.167 = 0.833n = 15a = 1
P(X = a) = nCa × pa × q(n−a)
P(X = 1) = 15C1 × p1 × q(15−1)
P(X = 1) = 15C1 × (0.167)1 × (0.833)(15−1)
P(X = 1) = (115) × (0.167) × (0.0774)P(X = 1) = 0.194
Therefore, the probability of seeing a 6 when a die is rolled 15 times is 19.4%.12. (a) P(X) = 1
6 = 0.167(b) p = 0.167
q = 1 − 0.167 = 0.833
19 www.ck12.org
n = 15a = 7
P(X = a) = nCa × pa × q(n−a)
P(X = 7) = 15C7 × p7 × q(15−7)
P(X = 7) = 15C7 × (0.167)7 × (0.833)(15−7)
P(X = 7) = (6435) × (3.62 × 10−6) × (0.231)P(X = 7) = 0.00538
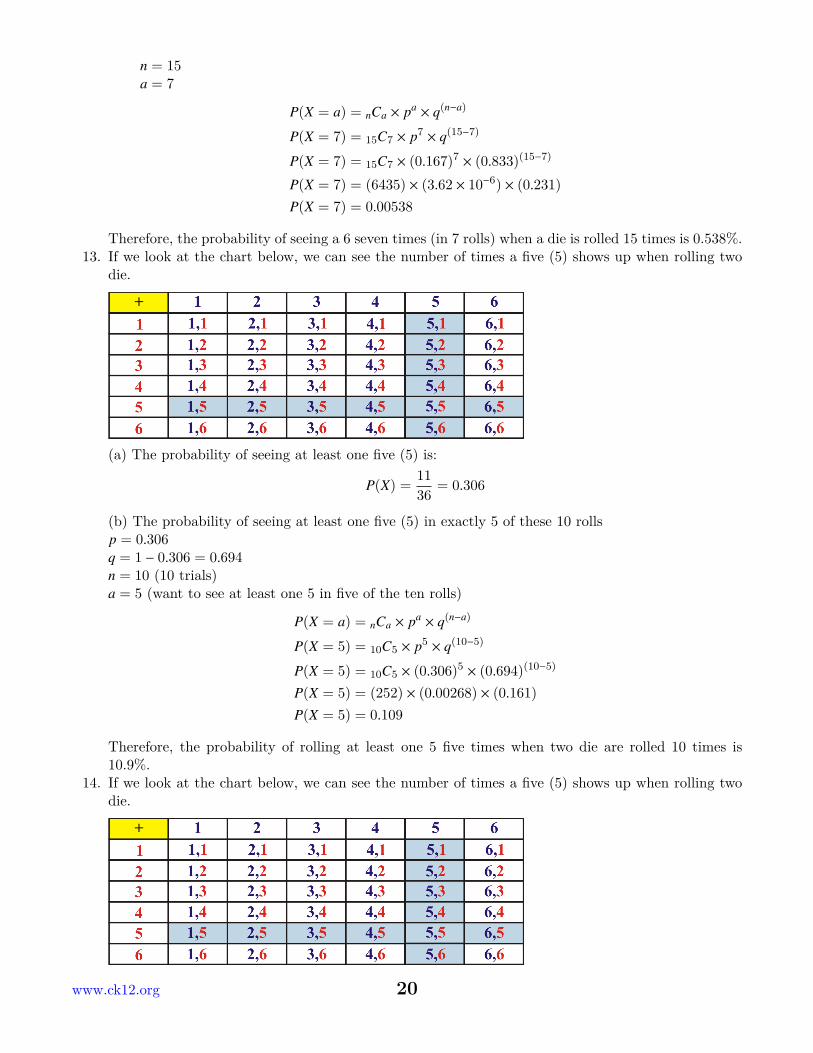
Therefore, the probability of seeing a 6 seven times (in 7 rolls) when a die is rolled 15 times is 0.538%.13. If we look at the chart below, we can see the number of times a five (5) shows up when rolling two
die.
(a) The probability of seeing at least one five (5) is:
P(X) =1136
= 0.306
(b) The probability of seeing at least one five (5) in exactly 5 of these 10 rollsp = 0.306q = 1 − 0.306 = 0.694n = 10 (10 trials)a = 5 (want to see at least one 5 in five of the ten rolls)
P(X = a) = nCa × pa × q(n−a)
P(X = 5) = 10C5 × p5 × q(10−5)
P(X = 5) = 10C5 × (0.306)5 × (0.694)(10−5)
P(X = 5) = (252) × (0.00268) × (0.161)P(X = 5) = 0.109
Therefore, the probability of rolling at least one 5 five times when two die are rolled 10 times is10.9%.
14. If we look at the chart below, we can see the number of times a five (5) shows up when rolling twodie.
www.ck12.org 20
(a) The probability of seeing at least one five (5) is:
P(X) =1136
= 0.306
(b) The probability of seeing at least one five (5) in exactly 8 of these 15 rollsp = 0.306q = 1 − 0.306 = 0.694n = 15 (15 trials)a = 8 (want to see at least one 5 in eight of the fifteen rolls)
P(X = a) = nCa × pa × q(n−a)
P(X = 8) = 15C8 × p8 × q(15−8)
P(X = 8) = 15C8 × (0.306)8 × (0.694)(15−8)
P(X = 8) = (6435) × (7.69 × 10−5) × (0.0775)P(X = 8) = 0.384
Therefore, the probability of rolling at least one 5 eight times when two die are rolled 15 times is3.84%.
15. n = 7 (7 trials)p1 = 13
52 = 0.25 (probability of drawing a heart)p2 = 13
52 = 0.25 (probability of drawing a spade)p3 = 13
52 = 0.25 (probability of drawing a club)p4 = 13
52 = 0.25 (probability of drawing a diamond)n1 = 2 (2 heart)n2 = 2 (2 spade)n3 = 2 (2 club)n4 = 3 (3 diamonds)k = 1 (for each trial there is only 1 possible outcome)
P(x = 7) =n!
n1!n2!n3! . . . nk!× (p1
n1 × p2n2 × p3
n3 . . . pknk)
P(x = 7) =7!
2!2!2!3!× (0.252 × 0.252 × 0.252 × 0.253)
P(x = 7) = 105 × (0.0625) × (0.0625) × (0.0625) × (0.015625)
P(x = 7) = 4.00 × 10⁻⁴
Therefore, the probability of choosing two hearts, two spades, two clubs, and three diamonds is0.0400%.
16. n = 7 (7 trials)p1 = 0.35 (35% probability the student watches NBX)p2 = 0.40 (40% probability the student watches FIX)p3 = 0.15 (15% probability the student watches TSA)p4 = 0.10 (10% probability the student watches MMA)n1 = 1 (1 student watching NBX)n2 = 2 (2 students watching FIX)n3 = 2 (2 students watching TSA)n3 = 3 (3 students watching MMA)k = 1 (for each trial there is only 1 possible outcome)
21 www.ck12.org

P(x = 7) =n!
n1!n2!n3! . . . nk!× (p1
n1 × p2n2 × p3
n3 . . . pknk)
P(x = 7) =7!
1!2!2!3!× (0.351 × 0.402 × 0.152 × 0.103)
P(x = 7) = 420 × (0.35) × (0.16) × (0.015) × (0.015)
P(x = 7) = 5.29 × 10⁻⁴
Therefore, the probability from this survey is 0.0529%.17. Answers will vary but should include:
Theoretical Probability – the calculated probability of an eventExperimental Probability – the actual probability of an event found through experimentation
18. (a) What is the difference between theoretical and experimental probability? The difference betweenexperimental and theoretical probability is that theoretical is calculated and experimental isactual. In theoretical probability, you are analyzing equally likely outcomes.
(b) The more data that is collected, the closer the experimental probability gets to the theoreticalprobability.
(c) Say we are going to calculate the probability of getting heads when one coin is tossed 100 times.We know that the probability of getting heads on the single coin toss is 0.5.
P(H) = 0.5 × 0.5 × 0.5 × 0.5 × 0.5 . . . (100 times)Or
P(H) = 0.5100
P(H) = 7.89 × 10⁻³¹
Now let’s say we are going to toss 100 coins just once. In order to get 100 heads, we do the followingprobability calculation.The total number of coins = 100Each coin has the outcome of either a Head (H) or Tail (T).
# o f f avorable choices =# possible letters in combination!
letter X! × letter Y!
# o f f avorable choices =100 letters!
100 head! × 0 tails!# o f f avorable choices = 1
Denominator (Bottom)The number of possible outcomes = 2100
The number of possible outcomes = 1.27 × 1030
Now we just divide the numerator by the denominator.
P(100 heads) =1
1.27 × 1030
P(100 heads) = 7.89 × 10⁻³¹
So, yes tossing one coin 100 times is the same as tossing 100 coins one time.
www.ck12.org 22
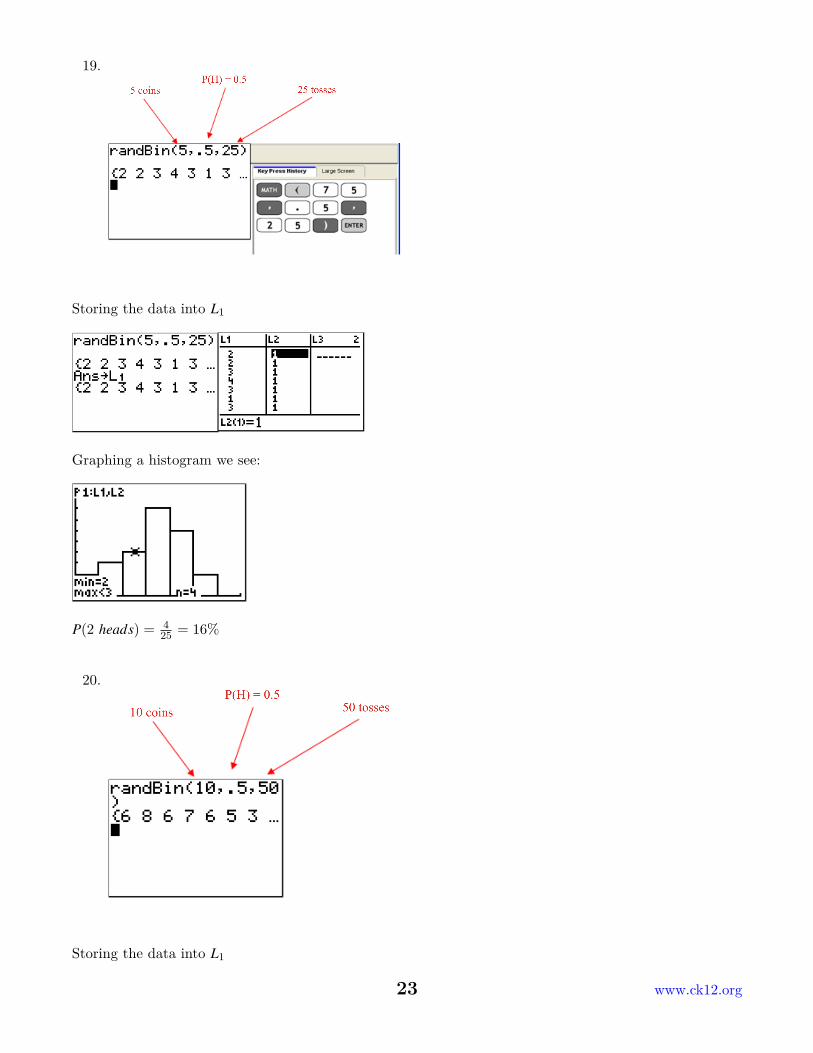
19.
Storing the data into L1
Graphing a histogram we see:
P(2 heads) = 425 = 16%
20.
Storing the data into L1
23 www.ck12.org
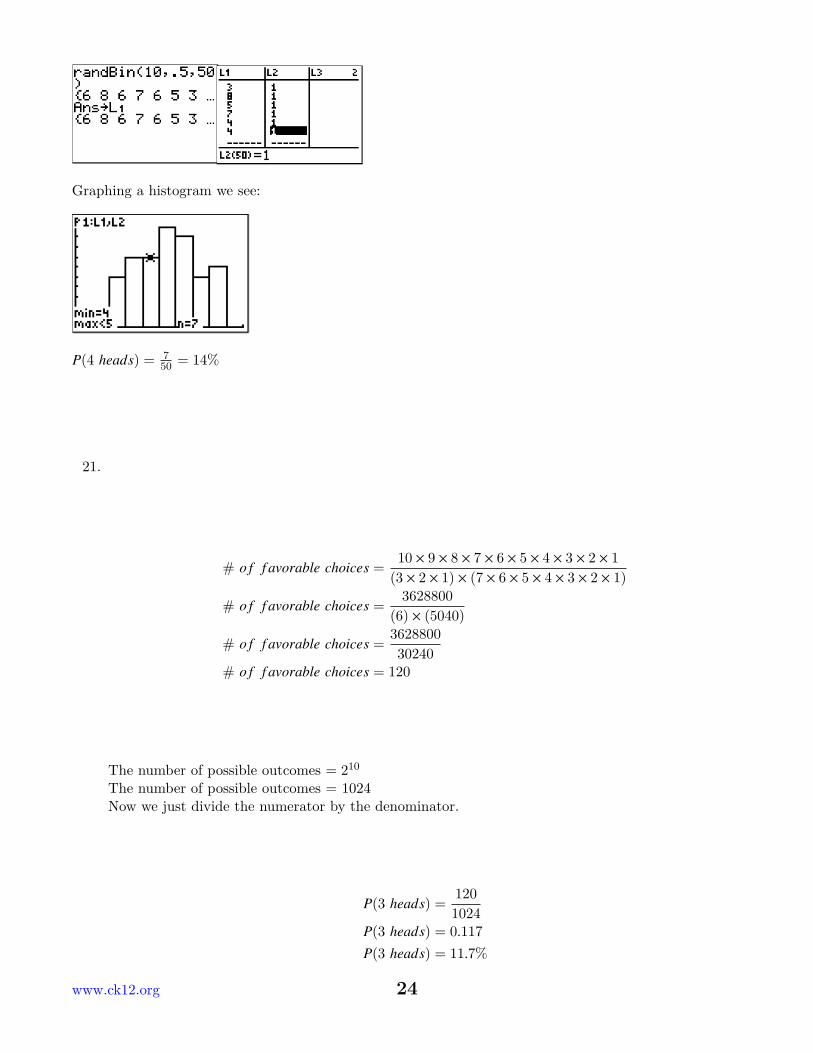
Graphing a histogram we see:
P(4 heads) = 750 = 14%
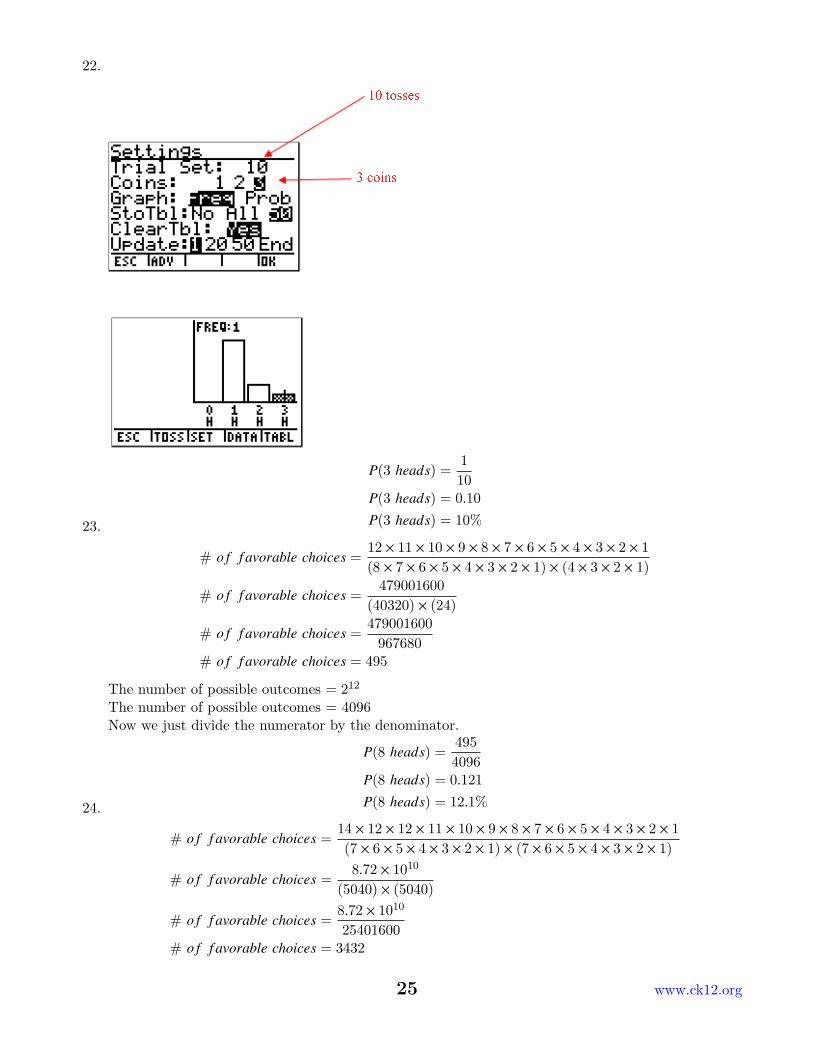
21.
# o f f avorable choices =10 × 9 × 8 × 7 × 6 × 5 × 4 × 3 × 2 × 1
(3 × 2 × 1) × (7 × 6 × 5 × 4 × 3 × 2 × 1)
# o f f avorable choices =3628800
(6) × (5040)
# o f f avorable choices =362880030240
# o f f avorable choices = 120
The number of possible outcomes = 210
The number of possible outcomes = 1024Now we just divide the numerator by the denominator.
P(3 heads) =1201024
P(3 heads) = 0.117P(3 heads) = 11.7%
www.ck12.org 24
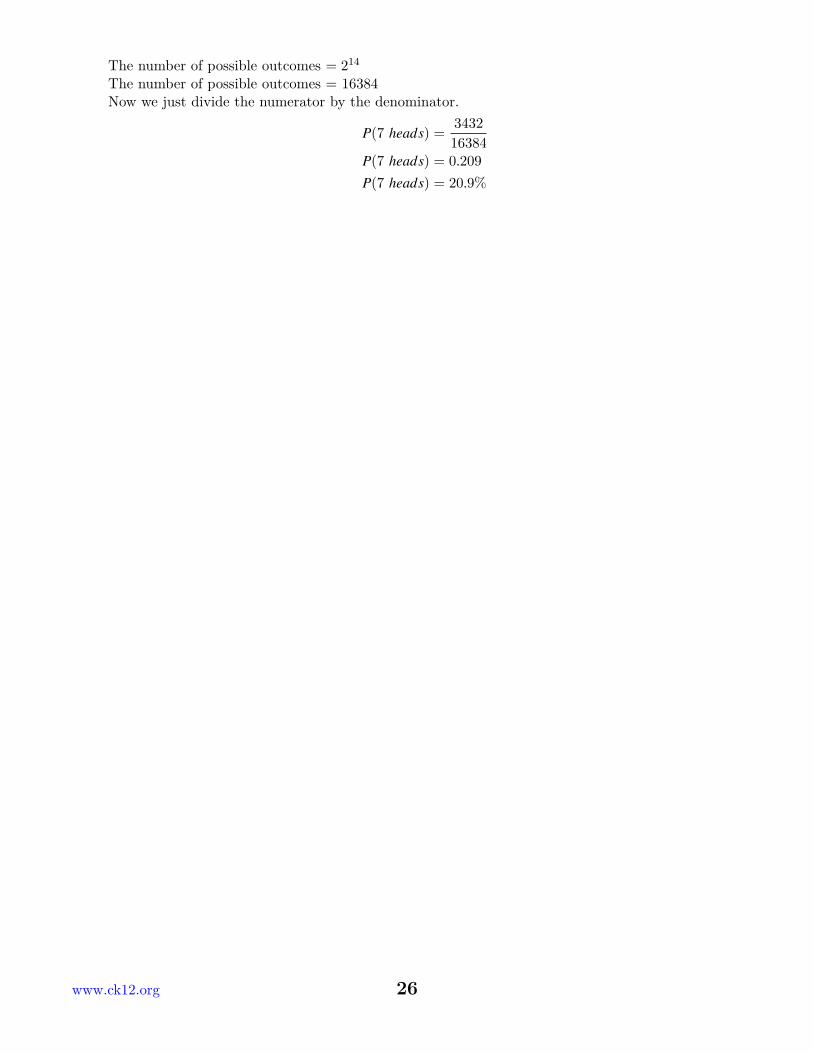
22.
P(3 heads) =110
P(3 heads) = 0.10P(3 heads) = 10%23.
# o f f avorable choices =12 × 11 × 10 × 9 × 8 × 7 × 6 × 5 × 4 × 3 × 2 × 1(8 × 7 × 6 × 5 × 4 × 3 × 2 × 1) × (4 × 3 × 2 × 1)
# o f f avorable choices =479001600
(40320) × (24)
# o f f avorable choices =479001600
967680# o f f avorable choices = 495
The number of possible outcomes = 212
The number of possible outcomes = 4096Now we just divide the numerator by the denominator.
P(8 heads) =4954096
P(8 heads) = 0.121P(8 heads) = 12.1%24.
# o f f avorable choices =14 × 12 × 12 × 11 × 10 × 9 × 8 × 7 × 6 × 5 × 4 × 3 × 2 × 1(7 × 6 × 5 × 4 × 3 × 2 × 1) × (7 × 6 × 5 × 4 × 3 × 2 × 1)
# o f f avorable choices =8.72 × 10¹⁰
(5040) × (5040)
# o f f avorable choices =8.72 × 10¹⁰
25401600# o f f avorable choices = 3432
25 www.ck12.org
The number of possible outcomes = 214
The number of possible outcomes = 16384Now we just divide the numerator by the denominator.
P(7 heads) =343216384
P(7 heads) = 0.209P(7 heads) = 20.9%
www.ck12.org 26
Chapter 4
Probability Distributions,Answer Key
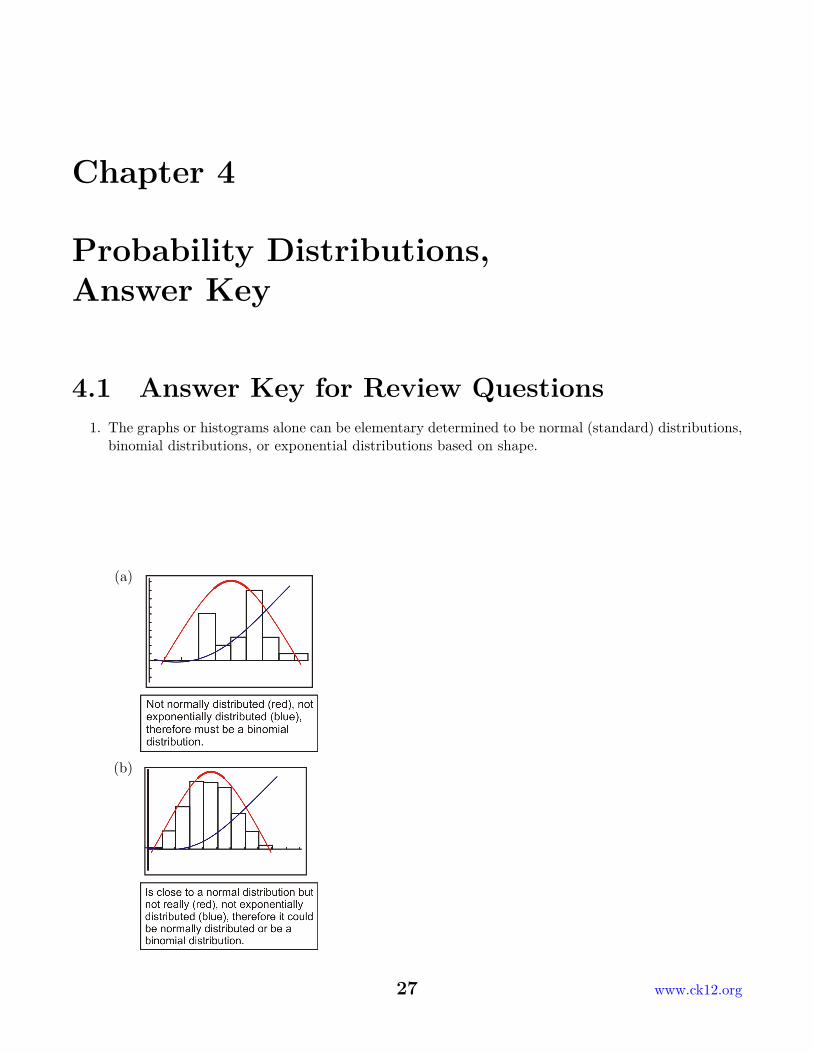
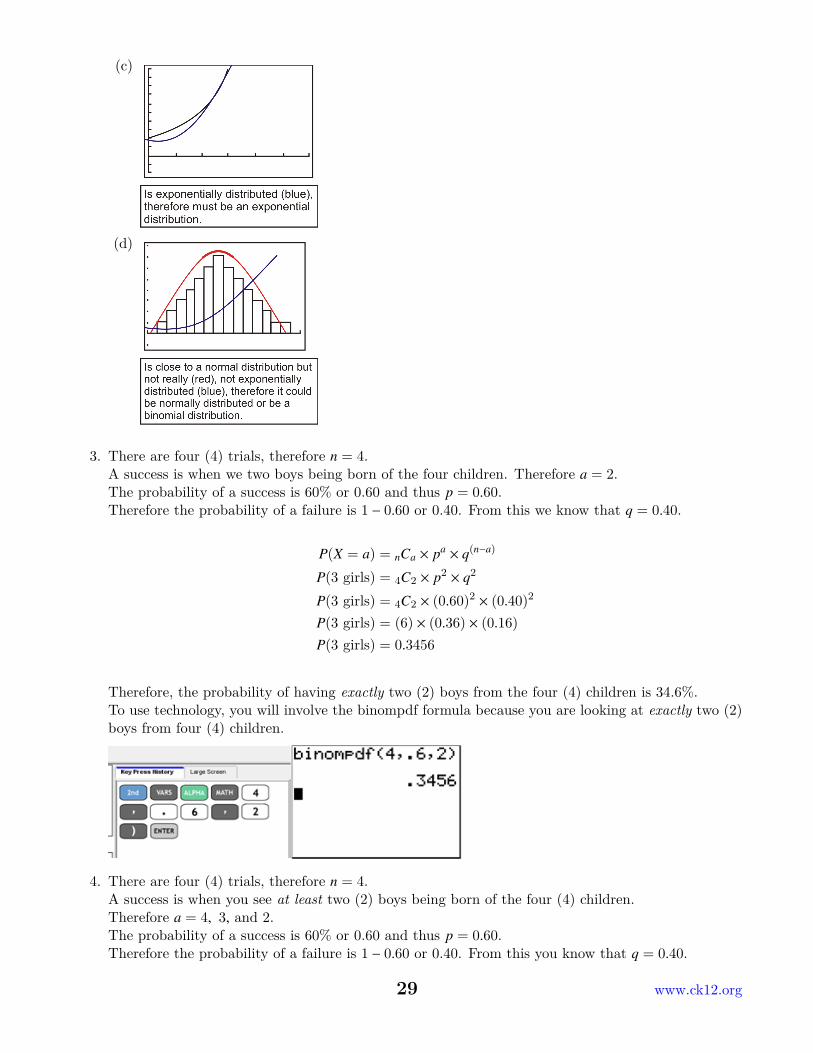
4.1 Answer Key for Review Questions1. The graphs or histograms alone can be elementary determined to be normal (standard) distributions,binomial distributions, or exponential distributions based on shape.
(a)
(b)
27 www.ck12.org
(c)
(d)
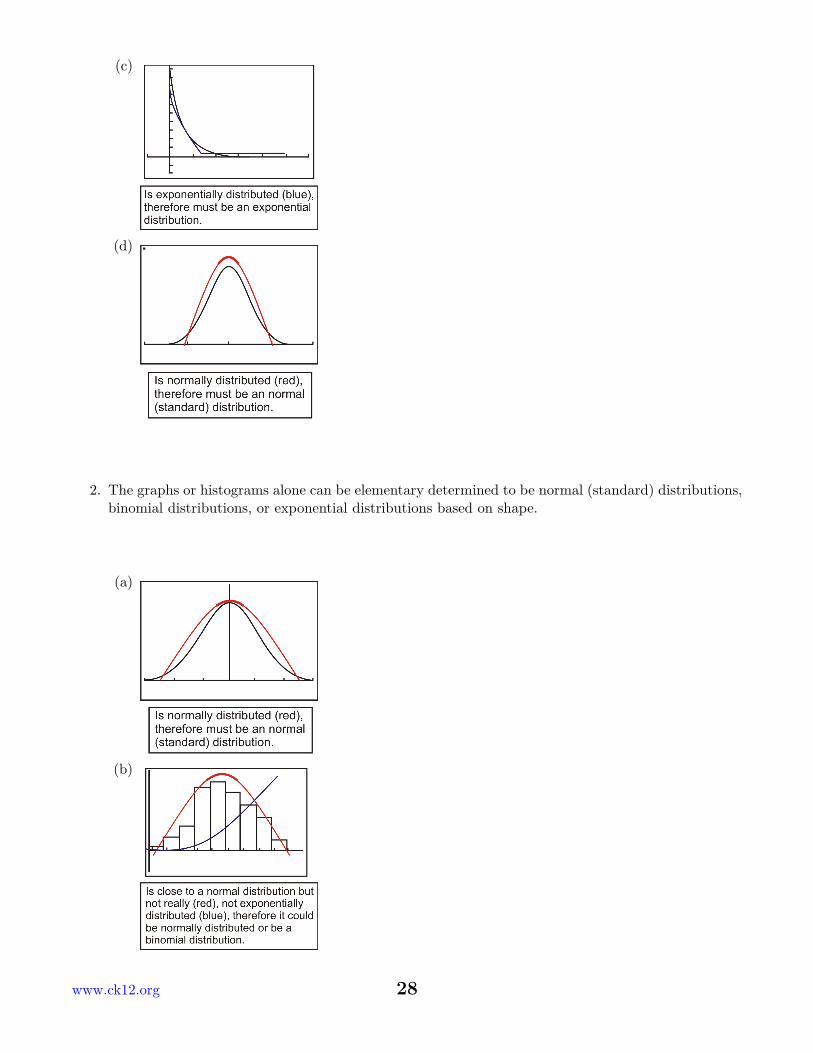
2. The graphs or histograms alone can be elementary determined to be normal (standard) distributions,binomial distributions, or exponential distributions based on shape.
(a)
(b)
www.ck12.org 28
(c)
(d)
3. There are four (4) trials, therefore n = 4.A success is when we two boys being born of the four children. Therefore a = 2.The probability of a success is 60% or 0.60 and thus p = 0.60.Therefore the probability of a failure is 1 − 0.60 or 0.40. From this we know that q = 0.40.
P(X = a) = nCa × pa × q(n−a)
P(3 girls) = 4C2 × p2 × q2
P(3 girls) = 4C2 × (0.60)2 × (0.40)2
P(3 girls) = (6) × (0.36) × (0.16)P(3 girls) = 0.3456
Therefore, the probability of having exactly two (2) boys from the four (4) children is 34.6%.To use technology, you will involve the binompdf formula because you are looking at exactly two (2)boys from four (4) children.
4. There are four (4) trials, therefore n = 4.A success is when you see at least two (2) boys being born of the four (4) children.Therefore a = 4, 3, and 2.The probability of a success is 60% or 0.60 and thus p = 0.60.Therefore the probability of a failure is 1 − 0.60 or 0.40. From this you know that q = 0.40.
29 www.ck12.org
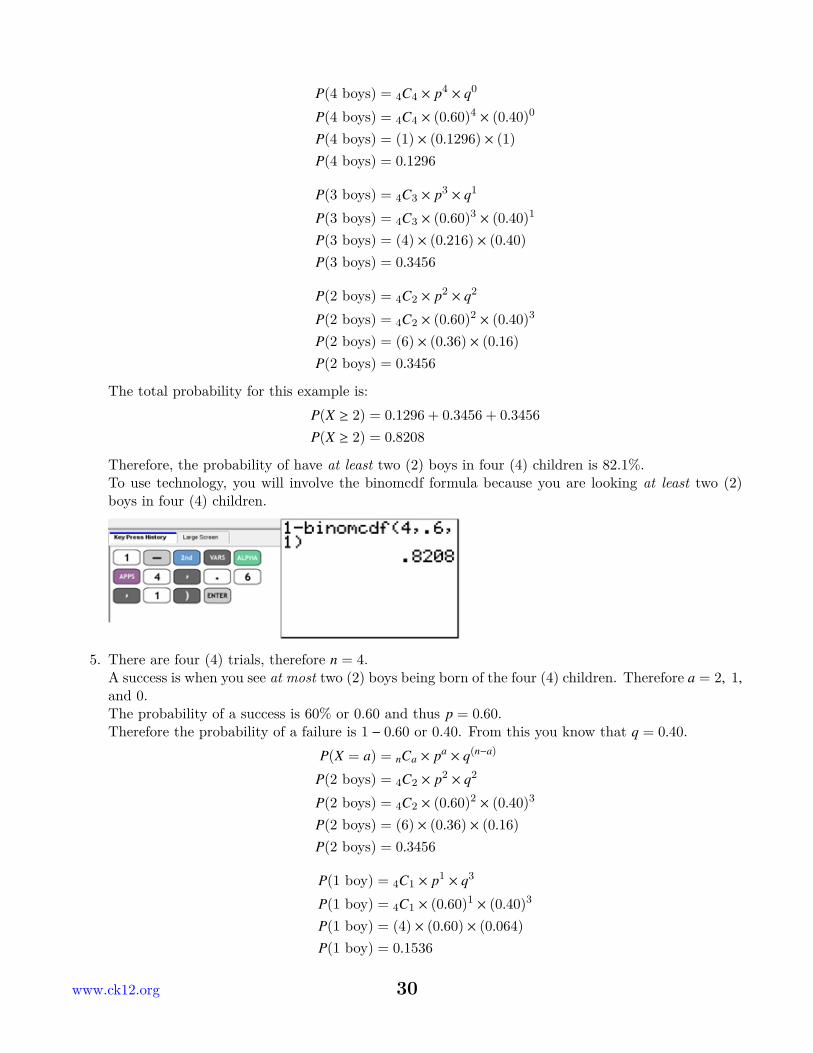
P(4 boys) = 4C4 × p4 × q0
P(4 boys) = 4C4 × (0.60)4 × (0.40)0
P(4 boys) = (1) × (0.1296) × (1)P(4 boys) = 0.1296
P(3 boys) = 4C3 × p3 × q1
P(3 boys) = 4C3 × (0.60)3 × (0.40)1
P(3 boys) = (4) × (0.216) × (0.40)P(3 boys) = 0.3456
P(2 boys) = 4C2 × p2 × q2
P(2 boys) = 4C2 × (0.60)2 × (0.40)3
P(2 boys) = (6) × (0.36) × (0.16)P(2 boys) = 0.3456
The total probability for this example is:P(X ≥ 2) = 0.1296 + 0.3456 + 0.3456P(X ≥ 2) = 0.8208
Therefore, the probability of have at least two (2) boys in four (4) children is 82.1%.To use technology, you will involve the binomcdf formula because you are looking at least two (2)boys in four (4) children.
5. There are four (4) trials, therefore n = 4.A success is when you see at most two (2) boys being born of the four (4) children. Therefore a = 2, 1,and 0.The probability of a success is 60% or 0.60 and thus p = 0.60.Therefore the probability of a failure is 1 − 0.60 or 0.40. From this you know that q = 0.40.
P(X = a) = nCa × pa × q(n−a)
P(2 boys) = 4C2 × p2 × q2
P(2 boys) = 4C2 × (0.60)2 × (0.40)3
P(2 boys) = (6) × (0.36) × (0.16)P(2 boys) = 0.3456
P(1 boy) = 4C1 × p1 × q3
P(1 boy) = 4C1 × (0.60)1 × (0.40)3
P(1 boy) = (4) × (0.60) × (0.064)P(1 boy) = 0.1536
www.ck12.org 30
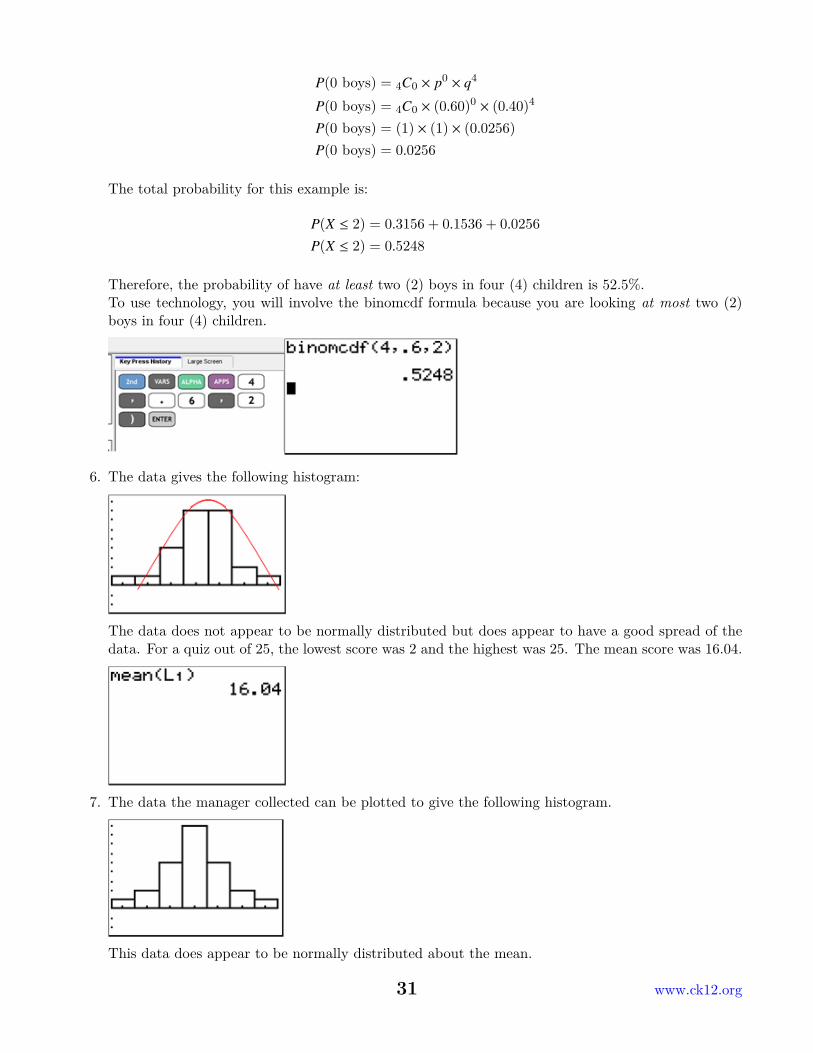
P(0 boys) = 4C0 × p0 × q4
P(0 boys) = 4C0 × (0.60)0 × (0.40)4
P(0 boys) = (1) × (1) × (0.0256)P(0 boys) = 0.0256
The total probability for this example is:
P(X ≤ 2) = 0.3156 + 0.1536 + 0.0256P(X ≤ 2) = 0.5248
Therefore, the probability of have at least two (2) boys in four (4) children is 52.5%.To use technology, you will involve the binomcdf formula because you are looking at most two (2)boys in four (4) children.
6. The data gives the following histogram:
The data does not appear to be normally distributed but does appear to have a good spread of thedata. For a quiz out of 25, the lowest score was 2 and the highest was 25. The mean score was 16.04.
7. The data the manager collected can be plotted to give the following histogram.
This data does appear to be normally distributed about the mean.
31 www.ck12.org
The movie is rated PG with an additional violence warning. A mean age of 15.56 years for moviegoers tells the manager that there are a number of very young people attending. When he looks atthe survey results, he can see that there are indeed children as young as 5 going to the movie.
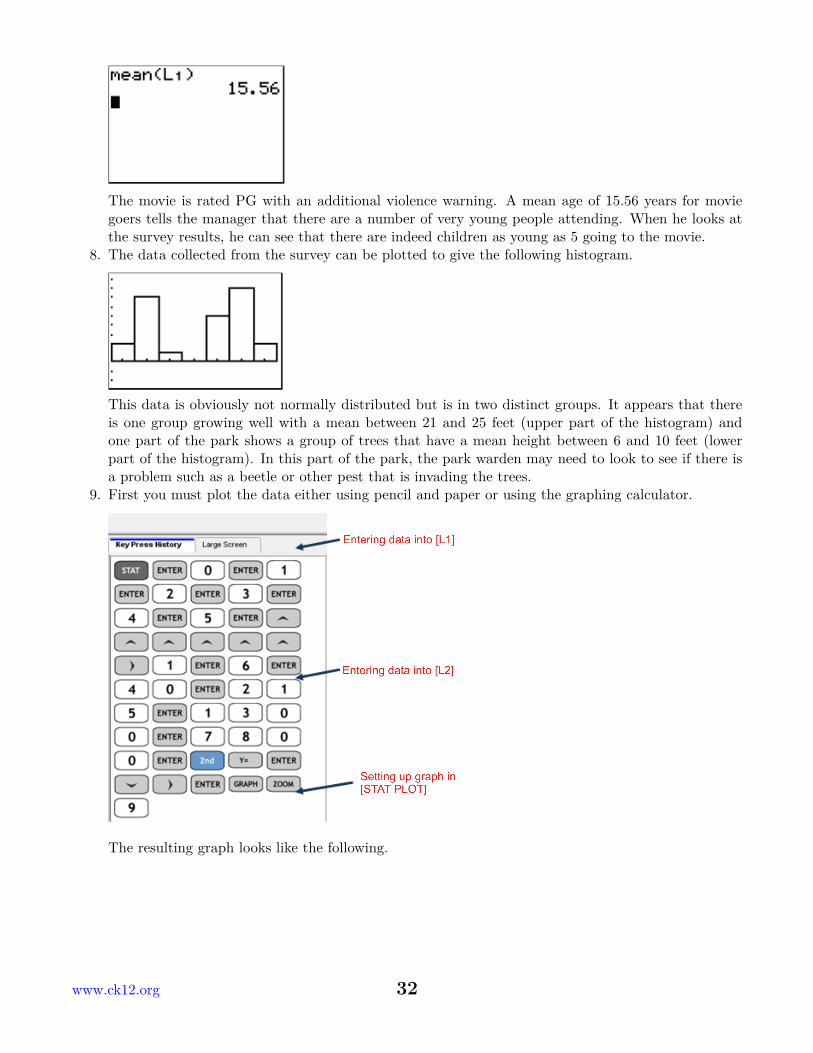
8. The data collected from the survey can be plotted to give the following histogram.
This data is obviously not normally distributed but is in two distinct groups. It appears that thereis one group growing well with a mean between 21 and 25 feet (upper part of the histogram) andone part of the park shows a group of trees that have a mean height between 6 and 10 feet (lowerpart of the histogram). In this part of the park, the park warden may need to look to see if there isa problem such as a beetle or other pest that is invading the trees.
9. First you must plot the data either using pencil and paper or using the graphing calculator.
The resulting graph looks like the following.
www.ck12.org 32
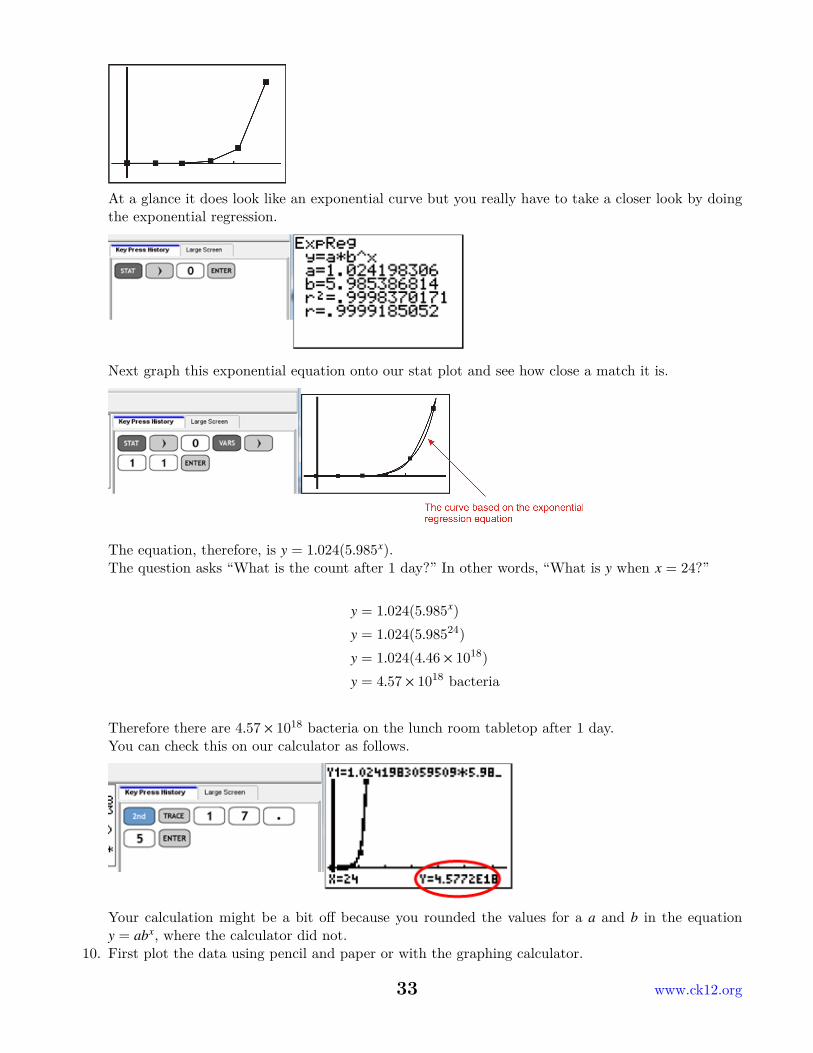
At a glance it does look like an exponential curve but you really have to take a closer look by doingthe exponential regression.
Next graph this exponential equation onto our stat plot and see how close a match it is.
The equation, therefore, is y = 1.024(5.985x).The question asks “What is the count after 1 day?” In other words, “What is y when x = 24?”
y = 1.024(5.985x)
y = 1.024(5.98524)
y = 1.024(4.46 × 10¹⁸)
y = 4.57 × 10¹⁸ bacteria
Therefore there are 4.57 × 10¹⁸ bacteria on the lunch room tabletop after 1 day.You can check this on our calculator as follows.
Your calculation might be a bit off because you rounded the values for a a and b in the equationy = abx, where the calculator did not.
10. First plot the data using pencil and paper or with the graphing calculator.
33 www.ck12.org
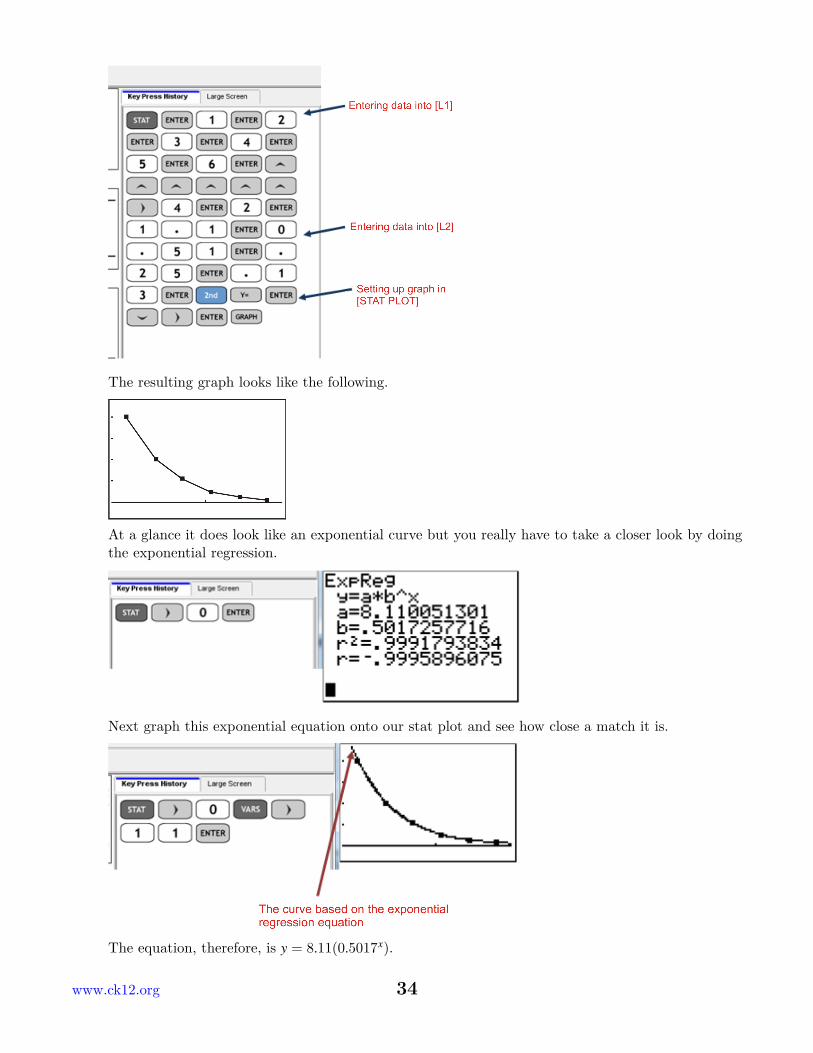
The resulting graph looks like the following.
At a glance it does look like an exponential curve but you really have to take a closer look by doingthe exponential regression.
Next graph this exponential equation onto our stat plot and see how close a match it is.
The equation, therefore, is y = 8.11(0.5017x).
www.ck12.org 34
The question asks “Why do you think his distance decreased with each jump?”Answers could vary here but a possible answer is that the grasshopper is reaching closer to a roadblocklike a fence or a tree.
35 www.ck12.org
Chapter 5
Measures of Central Tendency,Answer Key
5.1 Answer Key for Review QuestionsThe MeanSection A – Selected Response
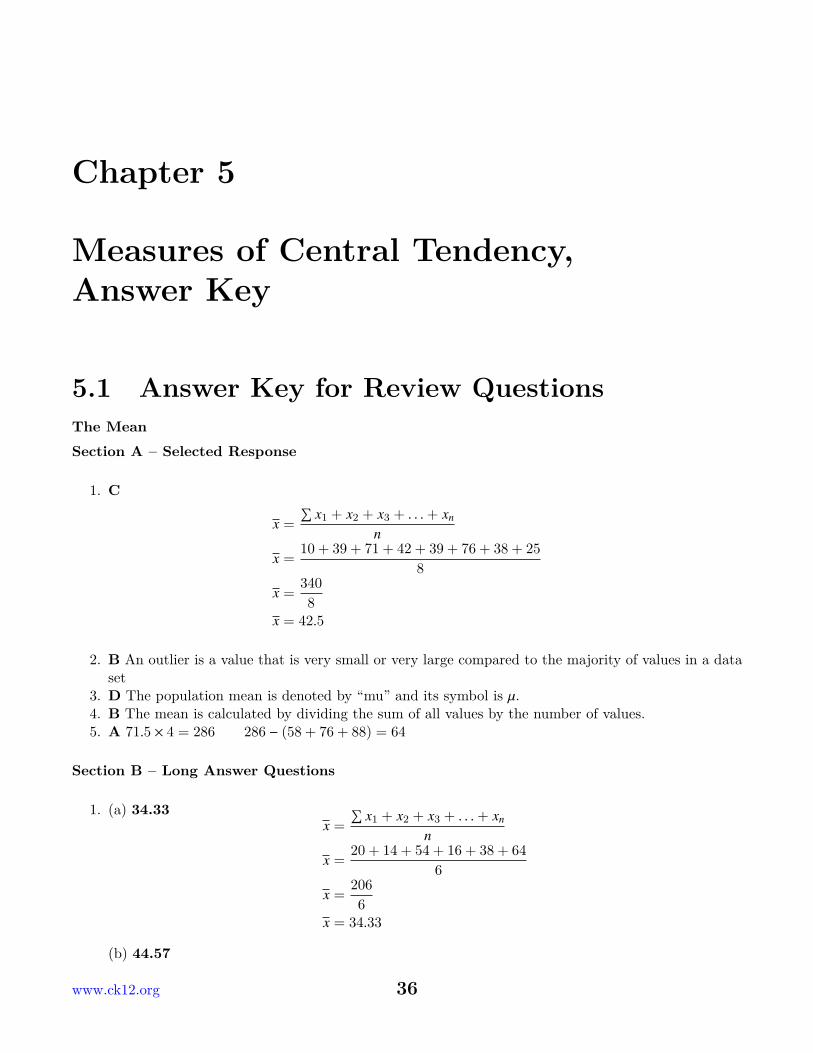
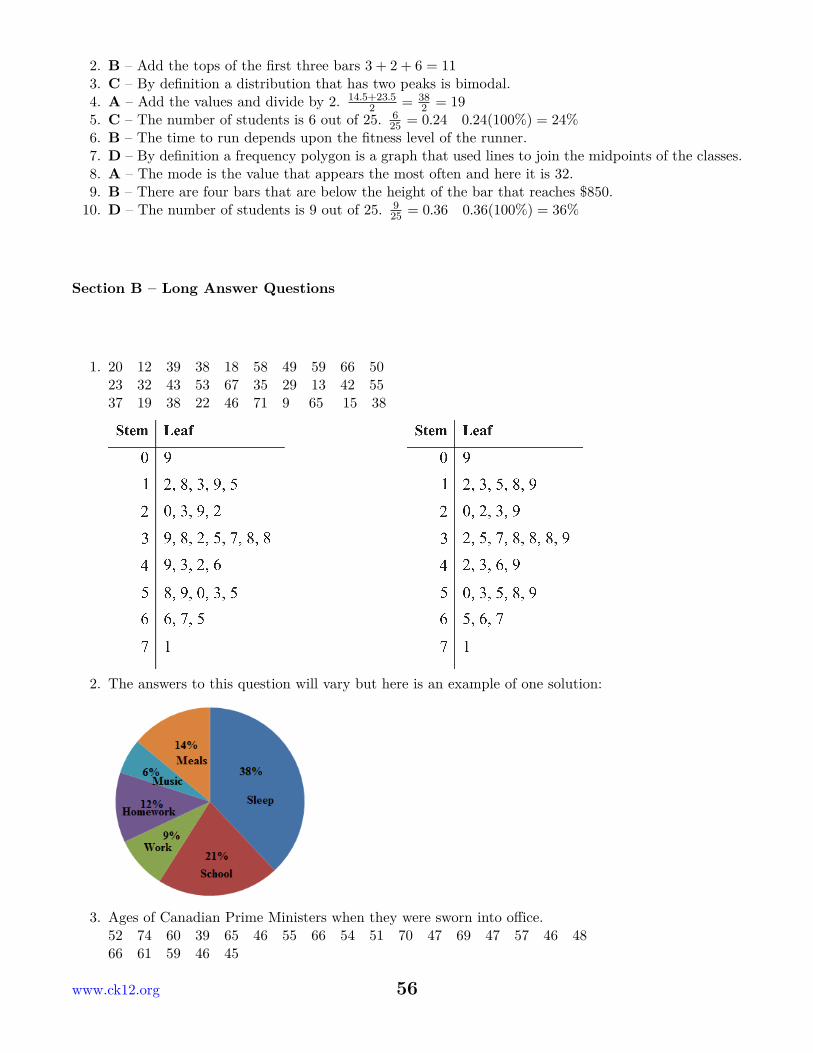
1. C
x =∑
x1 + x2 + x3 + . . .+ xn
n
x =10 + 39 + 71 + 42 + 39 + 76 + 38 + 25
8
x =3408
x = 42.5
2. B An outlier is a value that is very small or very large compared to the majority of values in a dataset
3. D The population mean is denoted by “mu” and its symbol is µ.4. B The mean is calculated by dividing the sum of all values by the number of values.5. A 71.5 × 4 = 286 286 − (58 + 76 + 88) = 64
Section B – Long Answer Questions
1. (a) 34.33x =∑
x1 + x2 + x3 + . . .+ xn
n
x =20 + 14 + 54 + 16 + 38 + 64
6
x =2066
x = 34.33
(b) 44.57
www.ck12.org 36

x =∑
x1 + x2 + x3 + . . .+ xn
n
x =22 + 51 + 64 + 76 + 29 + 22 + 48
7
x =3127
x = 44.57
(c) 62.8
x =∑
x1 + x2 + x3 + . . .+ xn
n
x =40 + 61 + 95 + 79 + 9 + 50 + 80 + 63 + 109 + 42
10
x =62810
x = 62.8
2. 171.6 pounds 167.2 × 5 = 836 836 − (158.4 + 162.8 + 165.0 + 178.2) = 171.63. 4.98 feet 12 × 5.1 + 8 × 4.8 = 99.6 f eet 99.6
20 = 4.98 f eet4. 31.0 advertisements
x =∑
x1 + x2 + x3 + . . .+ xn
n
x =43 + 37 + 35 + 30 + 41 + 23 + 33 + 31 + 16 + 21
10
x =31010
x = 31.0
5. 7.7 pounds
Table 5.1:
Weight (Pounds) Number of Babies f Midpoint of Class m Product m f
[3 - 5) 8 4 32[5 - 7) 25 6 150[7 - 9) 45 8 360[9 - 11) 18 10 180[11 - 13) 4 12 48
µ =∑
m fN
µ =770100
µ =32 + 150 + 360 + 180 + 48
100µ = 7.7 pounds
The mean weight of each baby is 7.7 pounds.
6. (a) The mean mark for the boys is72.
37 www.ck12.org
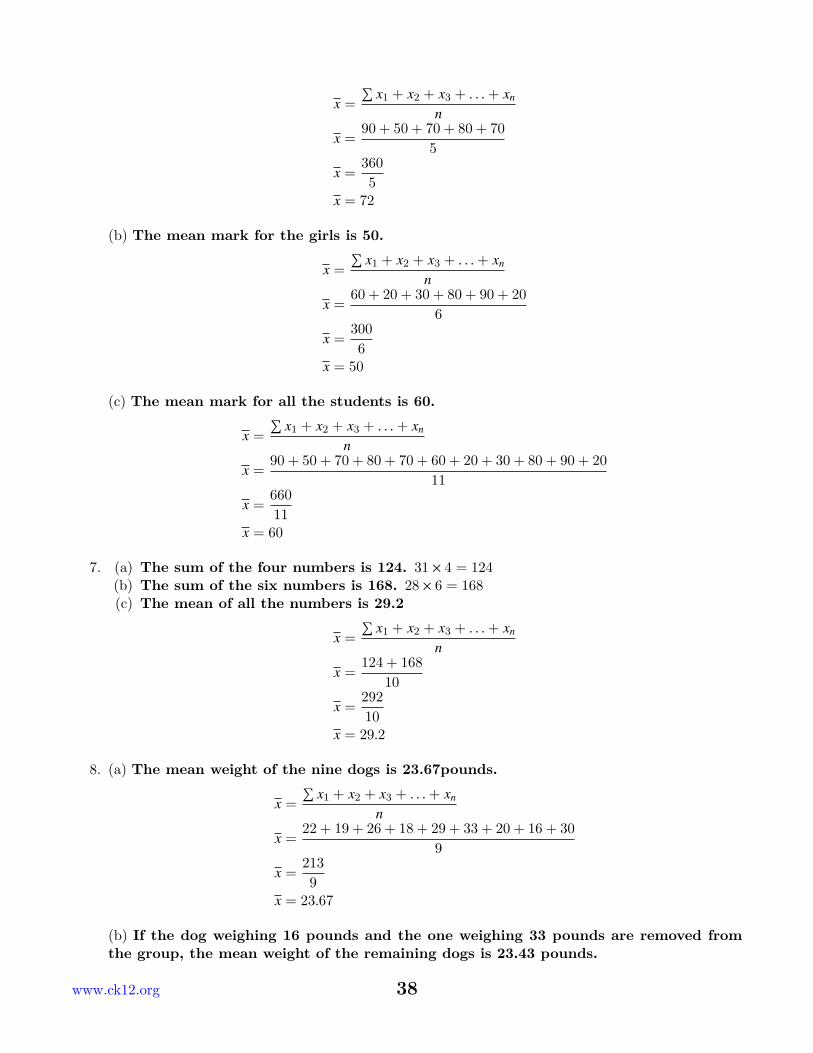
x =∑
x1 + x2 + x3 + . . .+ xn
n
x =90 + 50 + 70 + 80 + 70
5
x =3605
x = 72
(b) The mean mark for the girls is 50.
x =∑
x1 + x2 + x3 + . . .+ xn
n
x =60 + 20 + 30 + 80 + 90 + 20
6
x =3006
x = 50
(c) The mean mark for all the students is 60.
x =∑
x1 + x2 + x3 + . . .+ xn
n
x =90 + 50 + 70 + 80 + 70 + 60 + 20 + 30 + 80 + 90 + 20
11
x =66011
x = 60
7. (a) The sum of the four numbers is 124. 31 × 4 = 124(b) The sum of the six numbers is 168. 28 × 6 = 168(c) The mean of all the numbers is 29.2
x =∑
x1 + x2 + x3 + . . .+ xn
n
x =124 + 168
10
x =29210
x = 29.2
8. (a) The mean weight of the nine dogs is 23.67pounds.
x =∑
x1 + x2 + x3 + . . .+ xn
n
x =22 + 19 + 26 + 18 + 29 + 33 + 20 + 16 + 30
9
x =2139
x = 23.67
(b) If the dog weighing 16 pounds and the one weighing 33 pounds are removed fromthe group, the mean weight of the remaining dogs is 23.43 pounds.
www.ck12.org 38

x =∑
x1 + x2 + x3 + . . .+ xn
n
x =22 + 19 + 26 + 18 + 29 + 20 + 30
7
x =1647
x = 23.43
9. (a) No Melanie’s answer is not correct. The temperature of 0◦C was recorded but shedid not include it in thetotal.
x =−7 + 0 + −1 + 1 + −4 + −6 + 3
7
x =−147
x = −2◦C
(b) She divided the sum of the numbers by 6 nut should have divided by 7. The meandaily temperature should be −2◦C.
10.
x =∑
x1 + x2 + x3 + . . .+ xn
n
x =93 + 78 + 84 + 106 + 116 + 93 + 90 + 75 + 104 + 100 + 123 + 57
12
x =111912
x = 93.25 (Honest Hoopers)
x =∑
x1 + x2 + x3 + . . .+ xn
n
x =110 + 89 + 91 + 121 + 84 + 79 + 114 + 66 + 50 + 101 + 106 + 114
12
x =112512
x = 93.75 (Bouncy Baskets)
The Bouncy Baskets had the higher mean score.Section C
39 www.ck12.org

The MedianSection A – Selected Response
1. B 10, 25, 38, 39, 39, 42, 71,76The median is the number in the n+1
2 position. n+12 = 8+1
2 = 92 = 4.5
The number below the 4.5 position is 39 and the number above the 4.5 position is 39.The median is 39+39
2 = 782 = 39
2. D There are 23 seats which is an odd number.The median is the number in the n+1
2 position. n+12 = 23+1
2 = 242 = 12
The median seat is seat number 12.3. C 55, 58, 62, 63, 68, 70, 71, 79, 81,82The median is the number in the n+1
2 position. n+12 = 10+1
2 = 112 = 5.5
The number below the 5.5 position is 68 and the number above the 5.5 position is 70.The median is 68+70
2 = 1382 = 69
4. A 32, 34, 36,38The median is the number in the n+1
2 position. n+12 = 4+1
2 = 52 = 2.5
The number below the 2.5 position is 34 and the number above the 2.5 position is 36.The median is 34+36
2 = 702 = 35
5. B The median is the number of bars sold by the student in the n+12 position.
n + 12
=30 + 1
2=
312
= 15.5
The number below the 15.5 position is 21 and the number above the 15.5 position is 21.The median is 21+21
2 = 422 = 21
Section B – Long Answer Questions
1. (a) $25,825
www.ck12.org 40
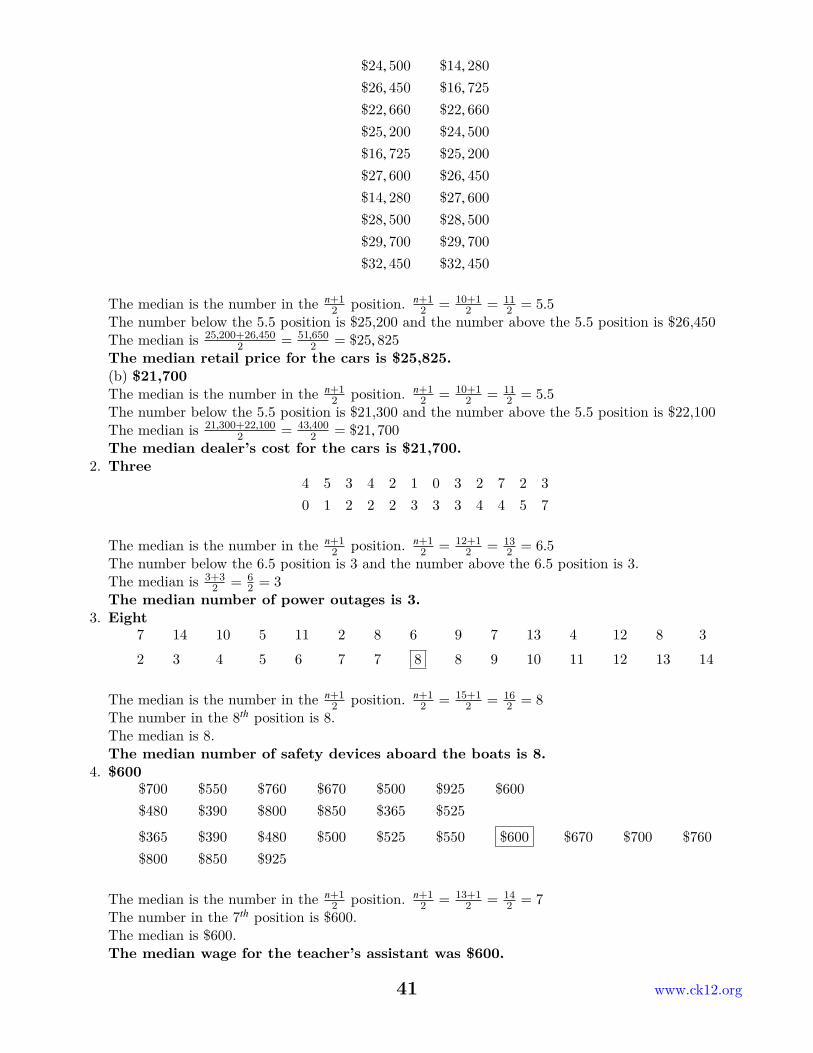
$24, 500 $14, 280$26, 450 $16, 725$22, 660 $22, 660$25, 200 $24, 500$16, 725 $25, 200$27, 600 $26, 450$14, 280 $27, 600$28, 500 $28, 500$29, 700 $29, 700$32, 450 $32, 450
The median is the number in the n+12 position. n+1
2 = 10+12 = 11
2 = 5.5The number below the 5.5 position is $25,200 and the number above the 5.5 position is $26,450The median is 25,200+26,450
2 = 51,6502 = $25, 825
The median retail price for the cars is $25,825.(b) $21,700The median is the number in the n+1
2 position. n+12 = 10+1
2 = 112 = 5.5
The number below the 5.5 position is $21,300 and the number above the 5.5 position is $22,100The median is 21,300+22,100
2 = 43,4002 = $21, 700
The median dealer’s cost for the cars is $21,700.2. Three
4 5 3 4 2 1 0 3 2 7 2 30 1 2 2 2 3 3 3 4 4 5 7
The median is the number in the n+12 position. n+1
2 = 12+12 = 13
2 = 6.5The number below the 6.5 position is 3 and the number above the 6.5 position is 3.The median is 3+3
2 = 62 = 3
The median number of power outages is 3.3. Eight
7 14 10 5 11 2 8 6 9 7 13 4 12 8 3
2 3 4 5 6 7 7 8 8 9 10 11 12 13 14
The median is the number in the n+12 position. n+1
2 = 15+12 = 16
2 = 8The number in the 8th position is 8.The median is 8.The median number of safety devices aboard the boats is 8.
4. $600$700 $550 $760 $670 $500 $925 $600$480 $390 $800 $850 $365 $525
$365 $390 $480 $500 $525 $550 $600 $670 $700 $760$800 $850 $925
The median is the number in the n+12 position. n+1
2 = 13+12 = 14
2 = 7The number in the 7th position is $600.The median is $600.The median wage for the teacher’s assistant was $600.
41 www.ck12.org
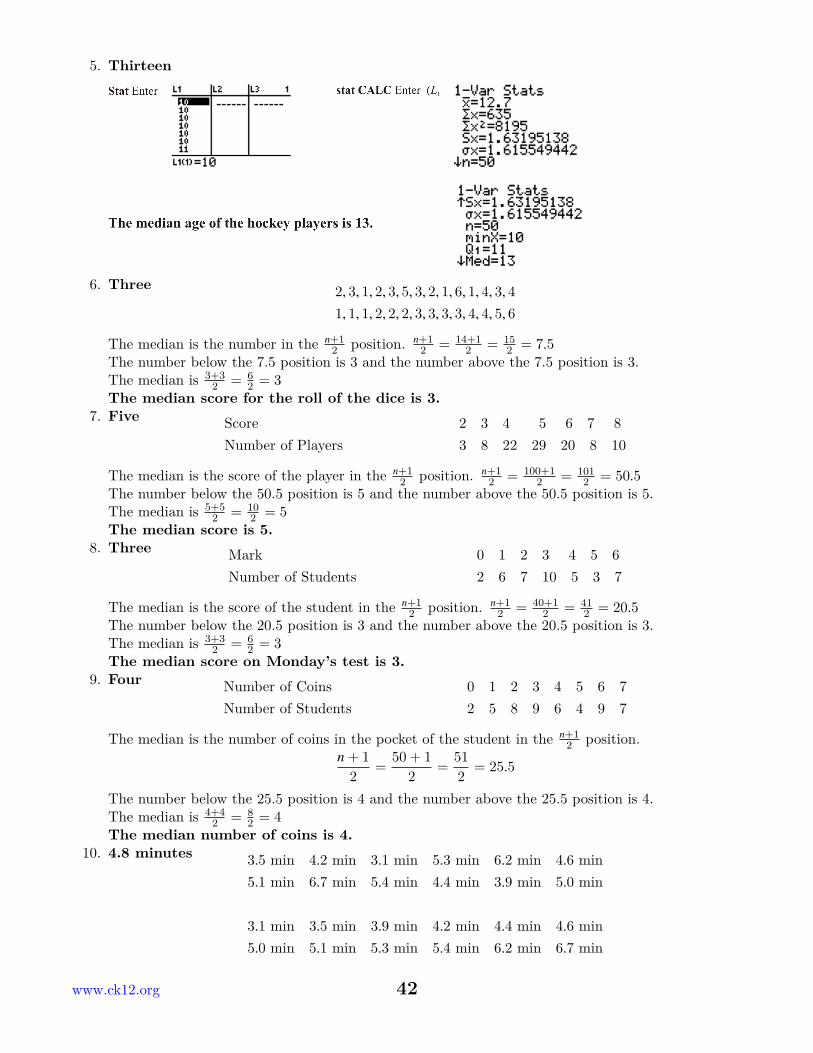
5. Thirteen
6. Three 2, 3, 1, 2, 3, 5, 3, 2, 1, 6, 1, 4, 3, 41, 1, 1, 2, 2, 2, 3, 3, 3, 3, 4, 4, 5, 6
The median is the number in the n+12 position. n+1
2 = 14+12 = 15
2 = 7.5The number below the 7.5 position is 3 and the number above the 7.5 position is 3.The median is 3+3
2 = 62 = 3
The median score for the roll of the dice is 3.7. Five Score 2 3 4 5 6 7 8
Number of Players 3 8 22 29 20 8 10
The median is the score of the player in the n+12 position. n+1
2 = 100+12 = 101
2 = 50.5The number below the 50.5 position is 5 and the number above the 50.5 position is 5.The median is 5+5
2 = 102 = 5
The median score is 5.8. Three Mark 0 1 2 3 4 5 6
Number of Students 2 6 7 10 5 3 7
The median is the score of the student in the n+12 position. n+1
2 = 40+12 = 41
2 = 20.5The number below the 20.5 position is 3 and the number above the 20.5 position is 3.The median is 3+3
2 = 62 = 3
The median score on Monday’s test is 3.9. Four Number of Coins 0 1 2 3 4 5 6 7
Number of Students 2 5 8 9 6 4 9 7
The median is the number of coins in the pocket of the student in the n+12 position.
n + 12
=50 + 1
2=
512
= 25.5
The number below the 25.5 position is 4 and the number above the 25.5 position is 4.The median is 4+4
2 = 82 = 4
The median number of coins is 4.10. 4.8 minutes 3.5 min 4.2 min 3.1 min 5.3 min 6.2 min 4.6 min
5.1 min 6.7 min 5.4 min 4.4 min 3.9 min 5.0 min
3.1 min 3.5 min 3.9 min 4.2 min 4.4 min 4.6 min5.0 min 5.1 min 5.3 min 5.4 min 6.2 min 6.7 min
www.ck12.org 42
The median is the number in the n+12 position. n+1
2 = 12+12 = 13
2 = 6.5The number below the 6.5 position is 4.6 and the number above the 6.5 position is 5.0.The median is 4.6+5.0
2 = 9.62 = 4.8
The median time for the dirt bike race is 4.8 minutes.
The ModeSection A – Selected Response
1. C2. D3. B4. A5. B
Section B – Long answer Questions
1. (a) The mode for this set of numbers is 6.(b) The mode for this set of numbers is 16.
2. There are two modes for the scores on the English quizzes. The modes are 6 and 7.3. The modal number of minutes spent studying for the Math test are 10 - 20 minutes.4. The most common number of questions that students attempted to answer was 42.5. The modal score that was rolled was 3.6. The modal number of games that students attended was 8.7. The smallest value for m is 9.8. The data set has two modes 3 and 5. Each value appears 3 times. The distribution can be describedas bimodal.
9. Answers to this question will vary. Some acceptable responses would be:• A business could use the mode to determine the most popular selling item• A sports team could use the mode to determine which player is most consistent• A teacher could use the mode to determine the length of a test by the number of questionscompleted by the students on previous tests.
• A business could use the mode to determine the most popular sizes when ordering new stock.10. The modal temperature for the month of June was 74◦F.
43 www.ck12.org
Chapter 6
The Shape, Center and Spreadof a Normal Distribution,Answer Key
6.1 Answer Key for Review Questions1. d2. a3. b4. d5. c6. b7. c8. d9. c10. b11.
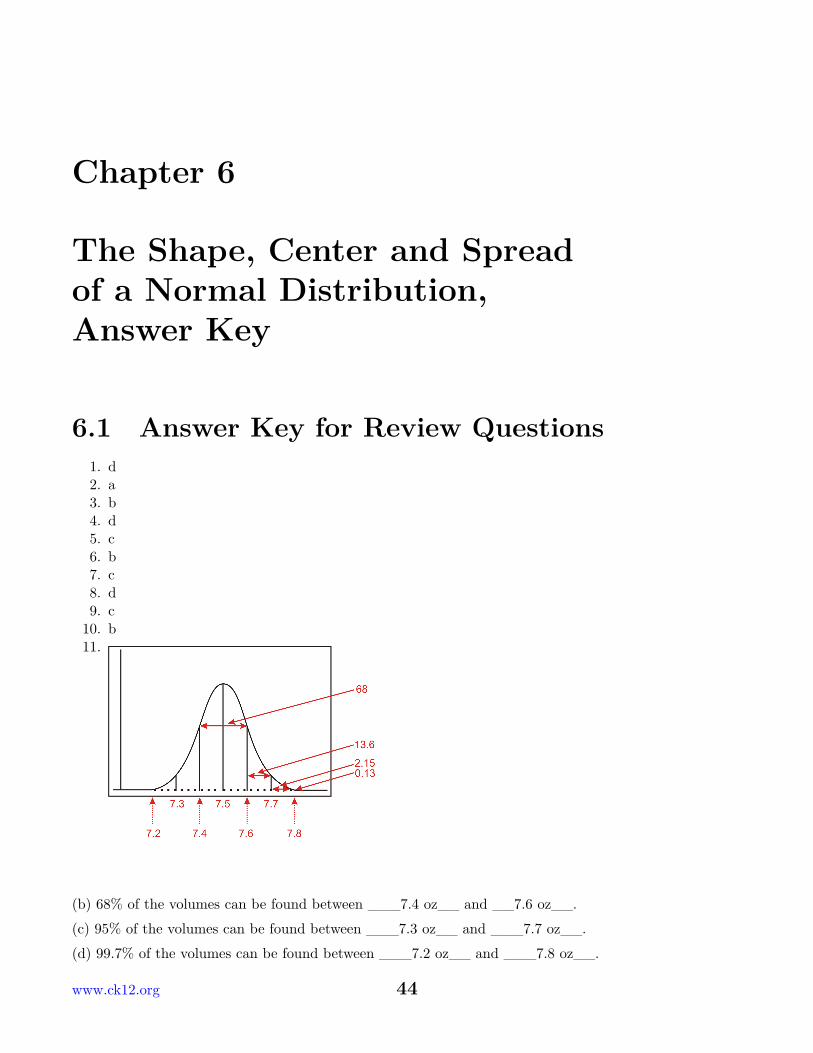
(b) 68% of the volumes can be found between ___7.4 oz__ and __7.6 oz__.(c) 95% of the volumes can be found between ___7.3 oz__ and ___7.7 oz__.(d) 99.7% of the volumes can be found between ___7.2 oz__ and ___7.8 oz__.
www.ck12.org 44
12.
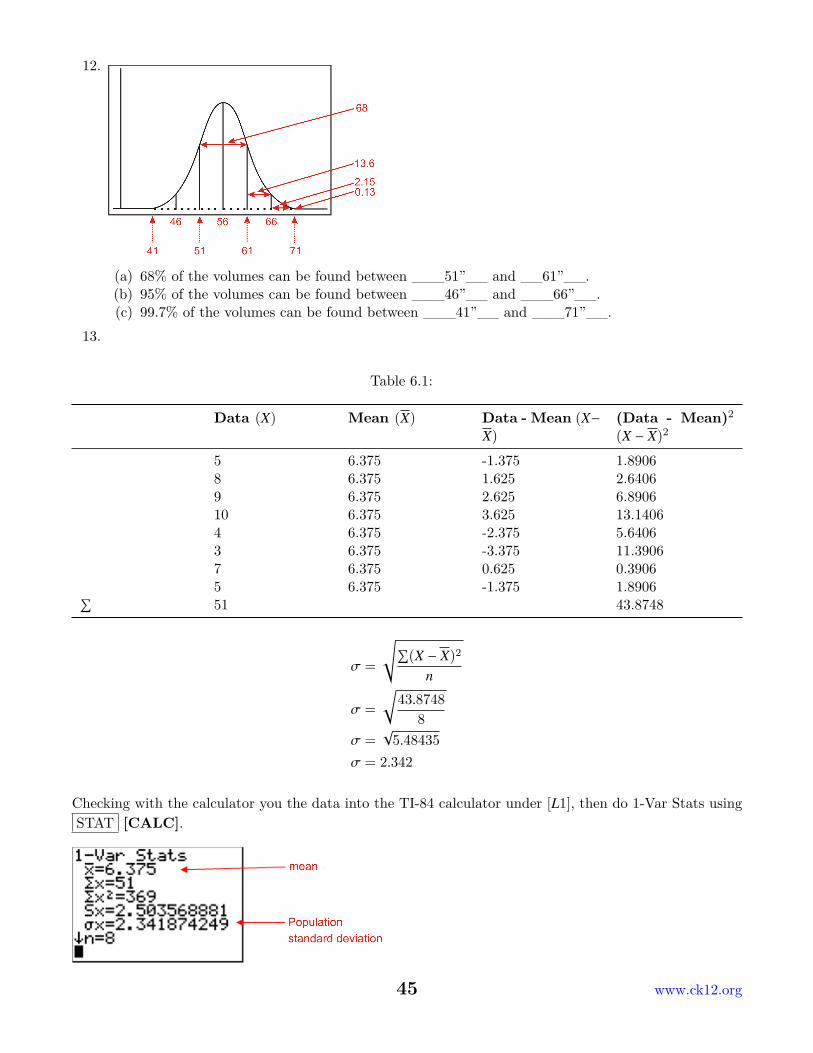
(a) 68% of the volumes can be found between ___51”__ and __61”__.(b) 95% of the volumes can be found between ___46”__ and ___66”__.(c) 99.7% of the volumes can be found between ___41”__ and ___71”__.
13.
Table 6.1:
Data (X) Mean (X) Data - Mean (X−X)
(Data - Mean)2
(X − X)2
5 6.375 -1.375 1.89068 6.375 1.625 2.64069 6.375 2.625 6.890610 6.375 3.625 13.14064 6.375 -2.375 5.64063 6.375 -3.375 11.39067 6.375 0.625 0.39065 6.375 -1.375 1.8906∑ 51 43.8748
σ =
√∑(X − X)2
n
σ =
√43.8748
8σ =
√5.48435
σ = 2.342
Checking with the calculator you the data into the TI-84 calculator under [L1], then do 1-Var Stats usingSTAT [CALC].
45 www.ck12.org
Variance = 2.3422 = 5.485
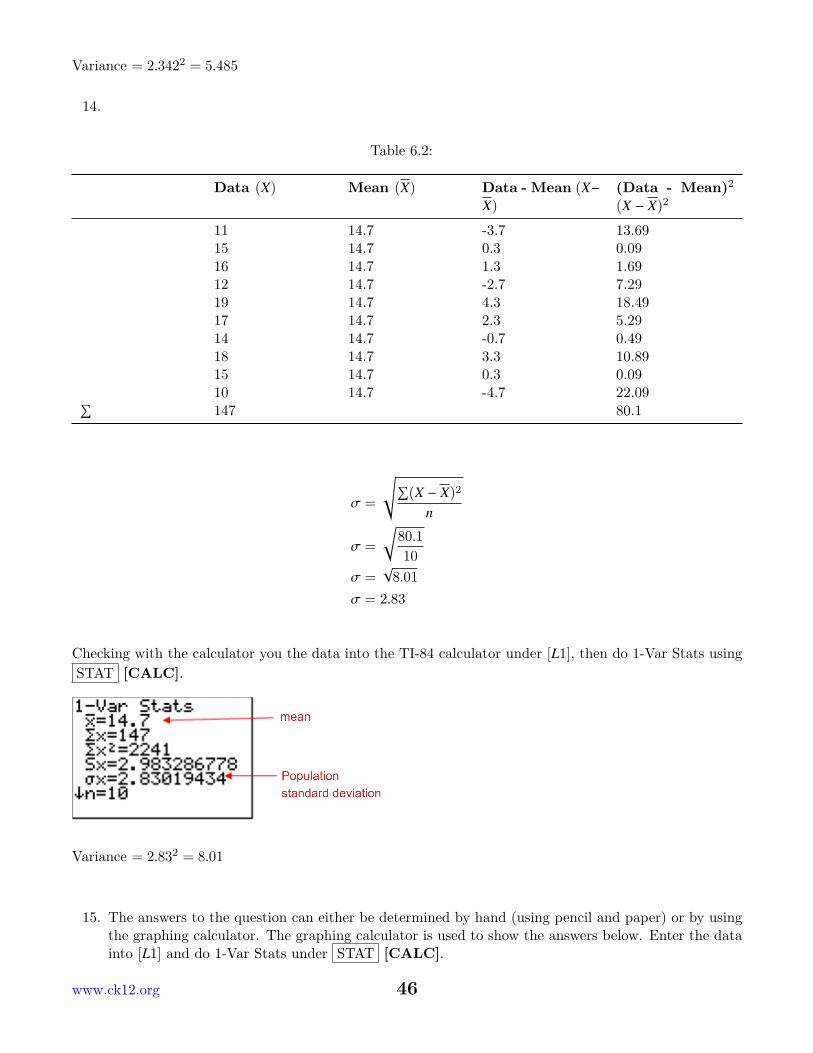
14.
Table 6.2:
Data (X) Mean (X) Data - Mean (X−X)
(Data - Mean)2
(X − X)2
11 14.7 -3.7 13.6915 14.7 0.3 0.0916 14.7 1.3 1.6912 14.7 -2.7 7.2919 14.7 4.3 18.4917 14.7 2.3 5.2914 14.7 -0.7 0.4918 14.7 3.3 10.8915 14.7 0.3 0.0910 14.7 -4.7 22.09∑ 147 80.1
σ =
√∑(X − X)2
n
σ =
√80.110
σ =√
8.01σ = 2.83
Checking with the calculator you the data into the TI-84 calculator under [L1], then do 1-Var Stats usingSTAT [CALC].
Variance = 2.832 = 8.01
15. The answers to the question can either be determined by hand (using pencil and paper) or by usingthe graphing calculator. The graphing calculator is used to show the answers below. Enter the datainto [L1] and do 1-Var Stats under STAT [CALC].
www.ck12.org 46
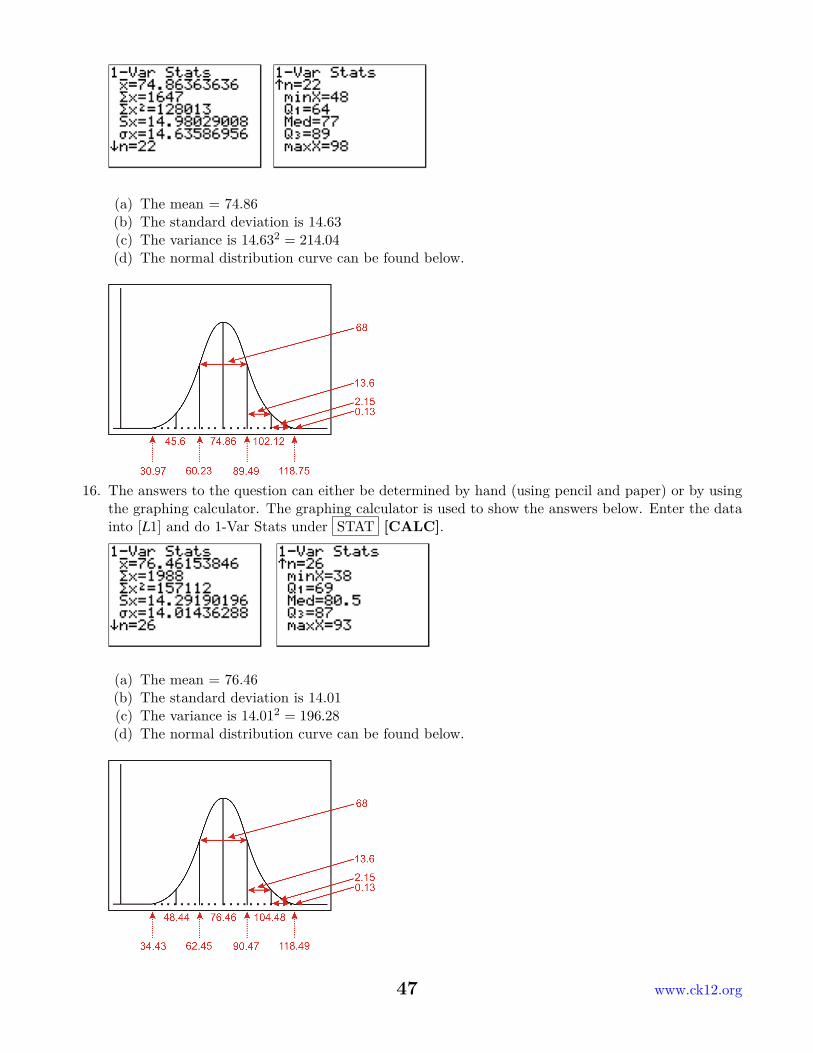
(a) The mean = 74.86(b) The standard deviation is 14.63(c) The variance is 14.632 = 214.04(d) The normal distribution curve can be found below.
16. The answers to the question can either be determined by hand (using pencil and paper) or by usingthe graphing calculator. The graphing calculator is used to show the answers below. Enter the datainto [L1] and do 1-Var Stats under STAT [CALC].
(a) The mean = 76.46(b) The standard deviation is 14.01(c) The variance is 14.012 = 196.28(d) The normal distribution curve can be found below.
47 www.ck12.org
17. To view the keystrokes for drawing the normal distribution curve on your calculator, you could followthese.
(a) How many students would you expect to wait more than 11.5 minutes?
The number of students waiting more than 11.5 minutes would be 68 + 13.6 + 2.15 + 0.13 = 83.88%of the students surveyed.
83.88% of 350 babies = 0.1588 × 350 = 55 babies
(b) How many students would you expect to wait more than 18.5 minutes?
The number of students waiting more than 18.5 minutes would be 13.6+2.15+0.13 = 15.88% of thestudents surveyed.
15.88% of 200 students = 0.1588 × 200 = 31 students
(c) How many students would you expect to wait between 11.5 and 18.5 minutes?
www.ck12.org 48
The number of students waiting between 11.5 and 18.5 minutes would be 68% of the students sur-veyed.
68% of 200 students = 0.68 × 200 = 136 students
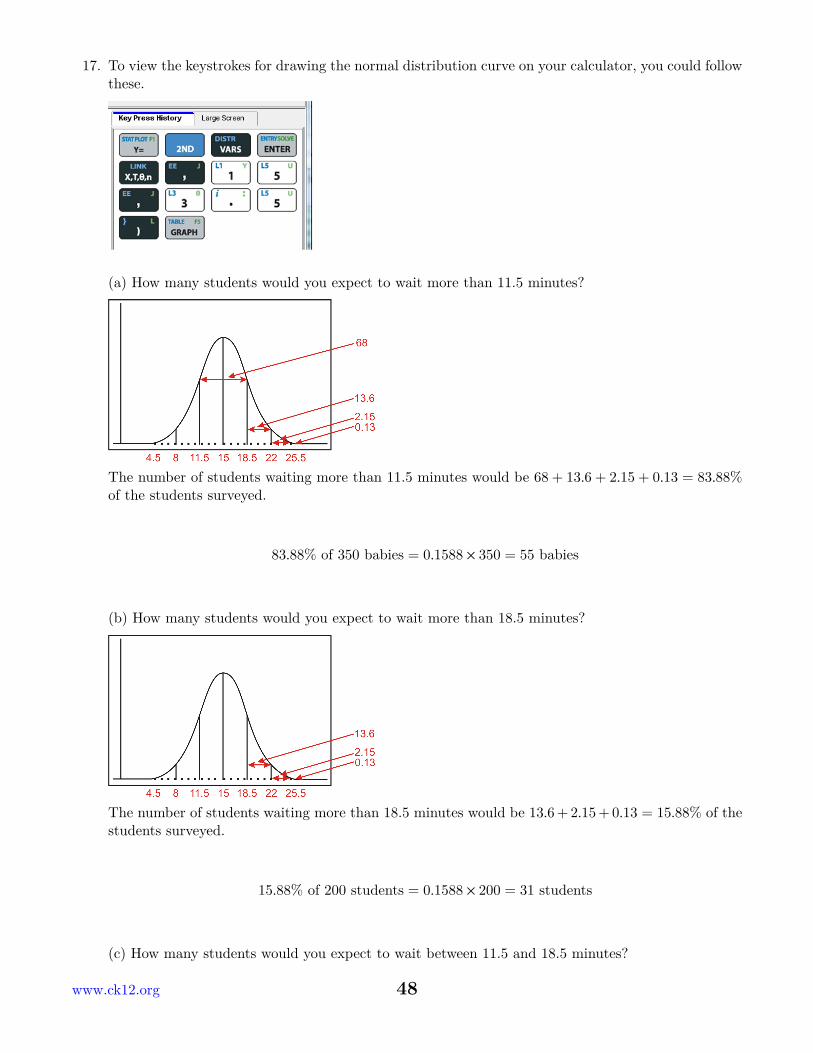
18. To view the keystrokes for drawing the normal distribution curve on your calculator, you could followthese.
(a) How many babies would you expect to weigh more than 7.3 lbs?
The number of babies weighing more than 7.3 lbs would be 13.6+2.15+0.13 = 15.88% of the babiesin the survey.
15.88% of 200 babies = 0.8388 × 200 = 167 students
(b) How many babies would you expect to weigh more than 7.8 lbs?
49 www.ck12.org
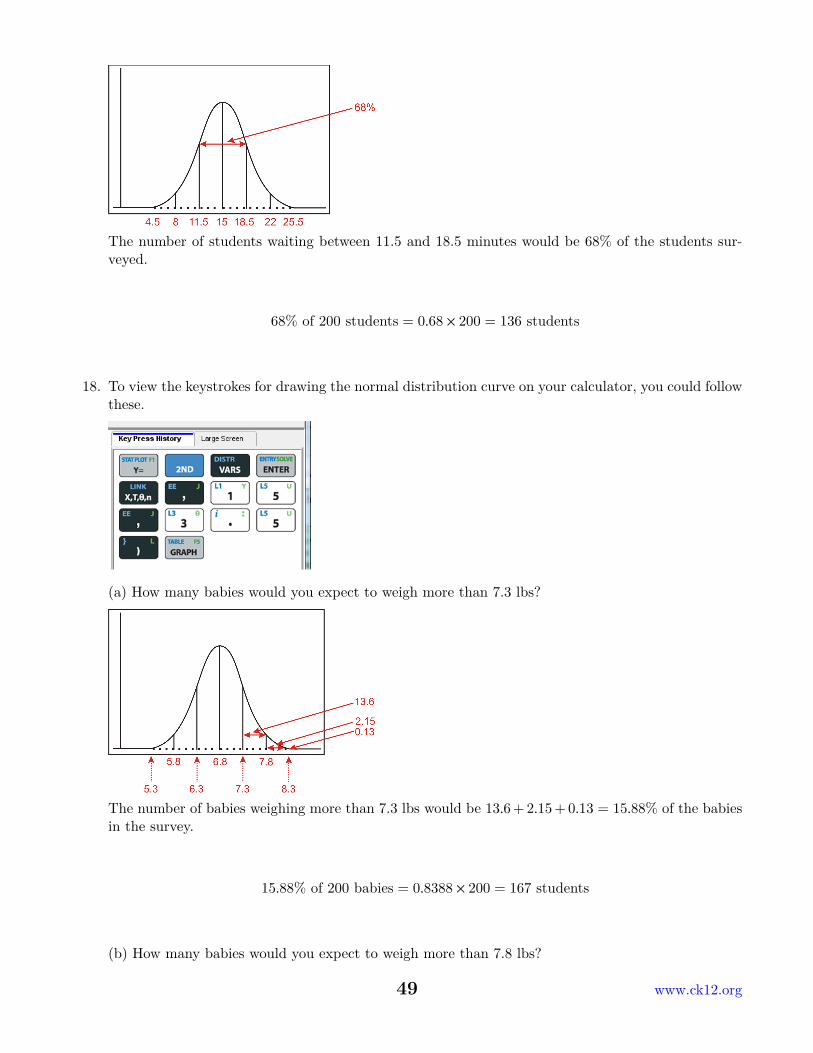
The number of babies weighing more than 7.8 lbs would be 2.15 + 0.13 = 2.28% of the babies in thesurvey.
2.28% of 350 babies = 0.0228 × 350 = 8 babies
(c) How many babies would you expect to weigh between 6.3 and 7.8 lbs?
The number of babies weighing between 6.3 and 7.8 lbs minutes would be 68% + 13.6% = 81.6% ofthe babies in the survey.
81.6% of 350 babies = 0.816 × 350 = 285 babies
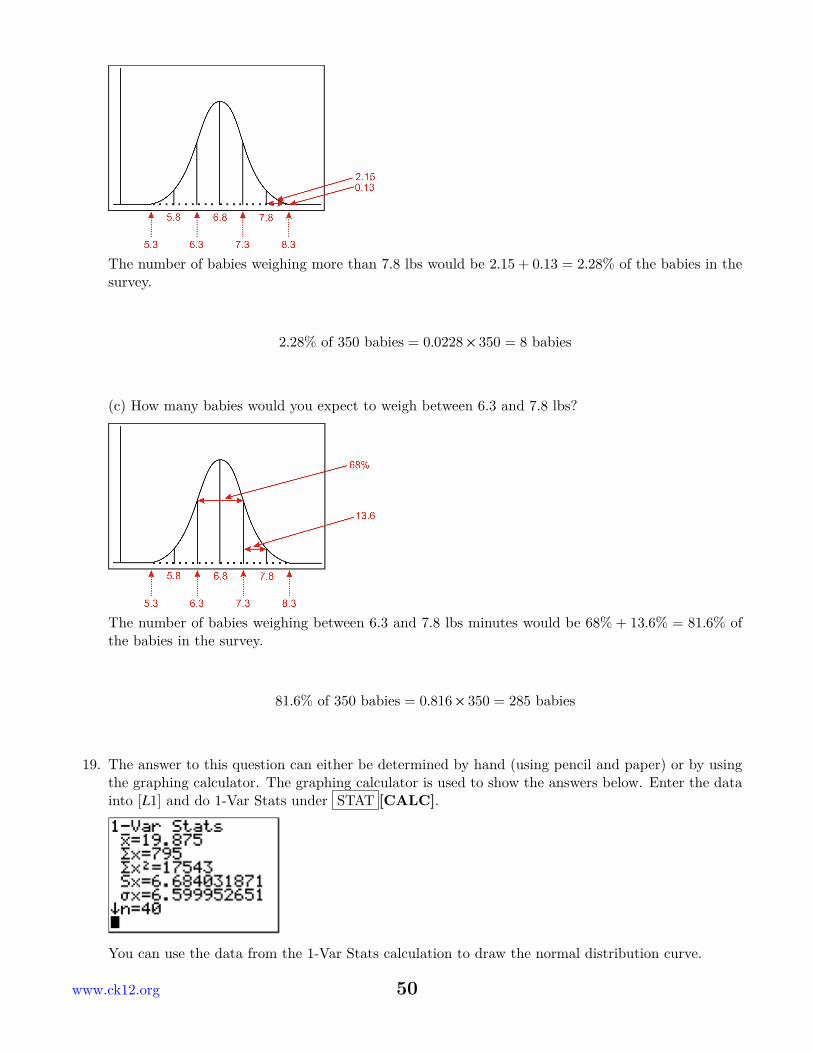
19. The answer to this question can either be determined by hand (using pencil and paper) or by usingthe graphing calculator. The graphing calculator is used to show the answers below. Enter the datainto [L1] and do 1-Var Stats under STAT [CALC].
You can use the data from the 1-Var Stats calculation to draw the normal distribution curve.
www.ck12.org 50
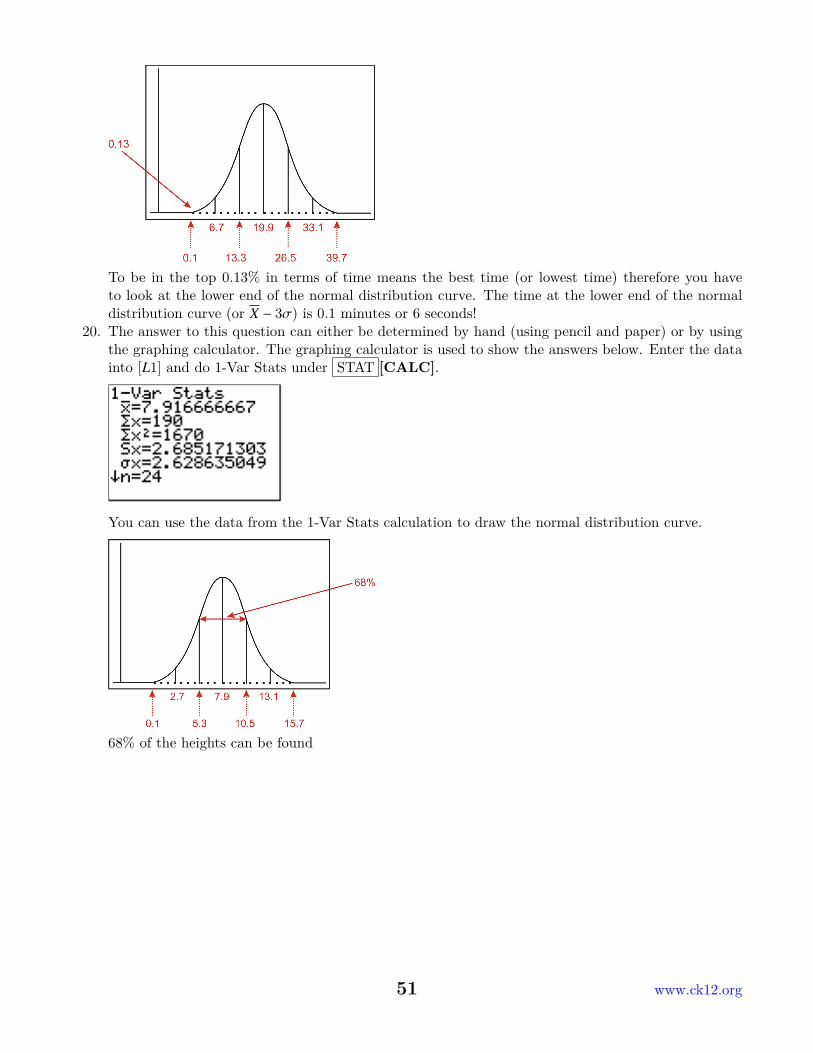
To be in the top 0.13% in terms of time means the best time (or lowest time) therefore you haveto look at the lower end of the normal distribution curve. The time at the lower end of the normaldistribution curve (or X − 3σ) is 0.1 minutes or 6 seconds!
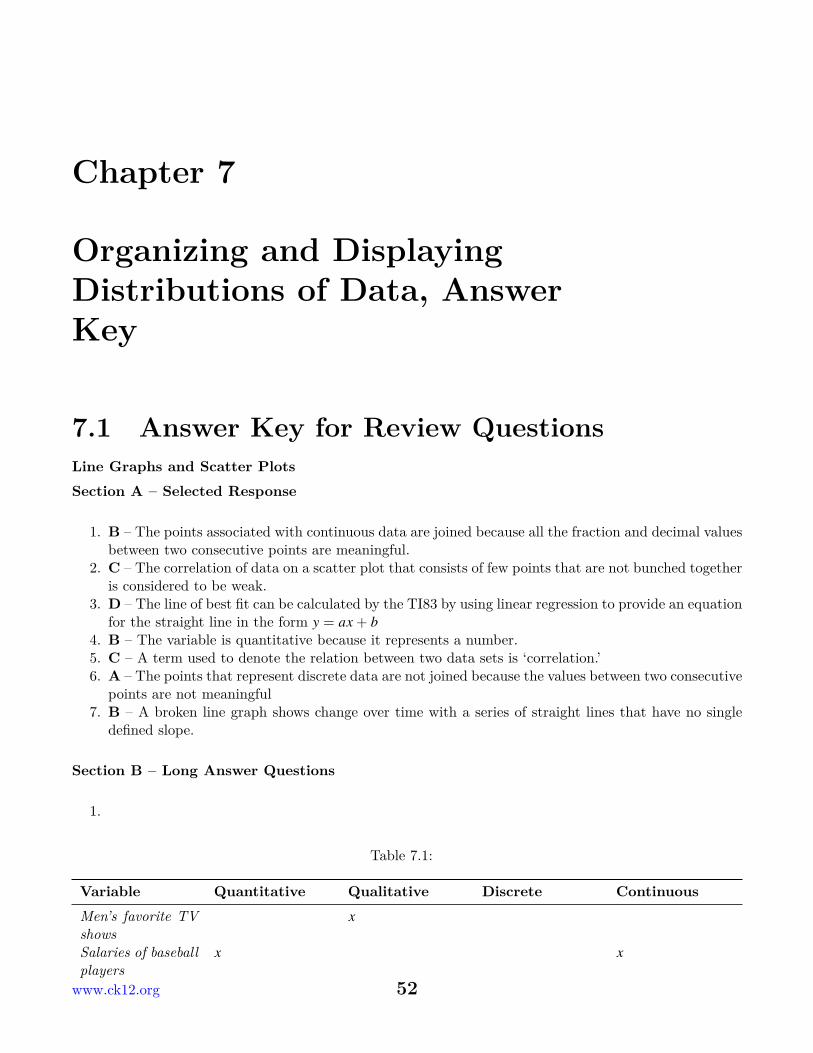
20. The answer to this question can either be determined by hand (using pencil and paper) or by usingthe graphing calculator. The graphing calculator is used to show the answers below. Enter the datainto [L1] and do 1-Var Stats under STAT [CALC].
You can use the data from the 1-Var Stats calculation to draw the normal distribution curve.
68% of the heights can be found
51 www.ck12.org
Chapter 7
Organizing and DisplayingDistributions of Data, AnswerKey
7.1 Answer Key for Review QuestionsLine Graphs and Scatter PlotsSection A – Selected Response
1. B – The points associated with continuous data are joined because all the fraction and decimal valuesbetween two consecutive points are meaningful.
2. C – The correlation of data on a scatter plot that consists of few points that are not bunched togetheris considered to be weak.
3. D – The line of best fit can be calculated by the TI83 by using linear regression to provide an equationfor the straight line in the form y = ax + b
4. B – The variable is quantitative because it represents a number.5. C – A term used to denote the relation between two data sets is ‘correlation.’6. A – The points that represent discrete data are not joined because the values between two consecutivepoints are not meaningful
7. B – A broken line graph shows change over time with a series of straight lines that have no singledefined slope.
Section B – Long Answer Questions
1.
Table 7.1:
Variable Quantitative Qualitative Discrete ContinuousMen’s favorite TVshows
x
Salaries of baseballplayers
x x
www.ck12.org 52
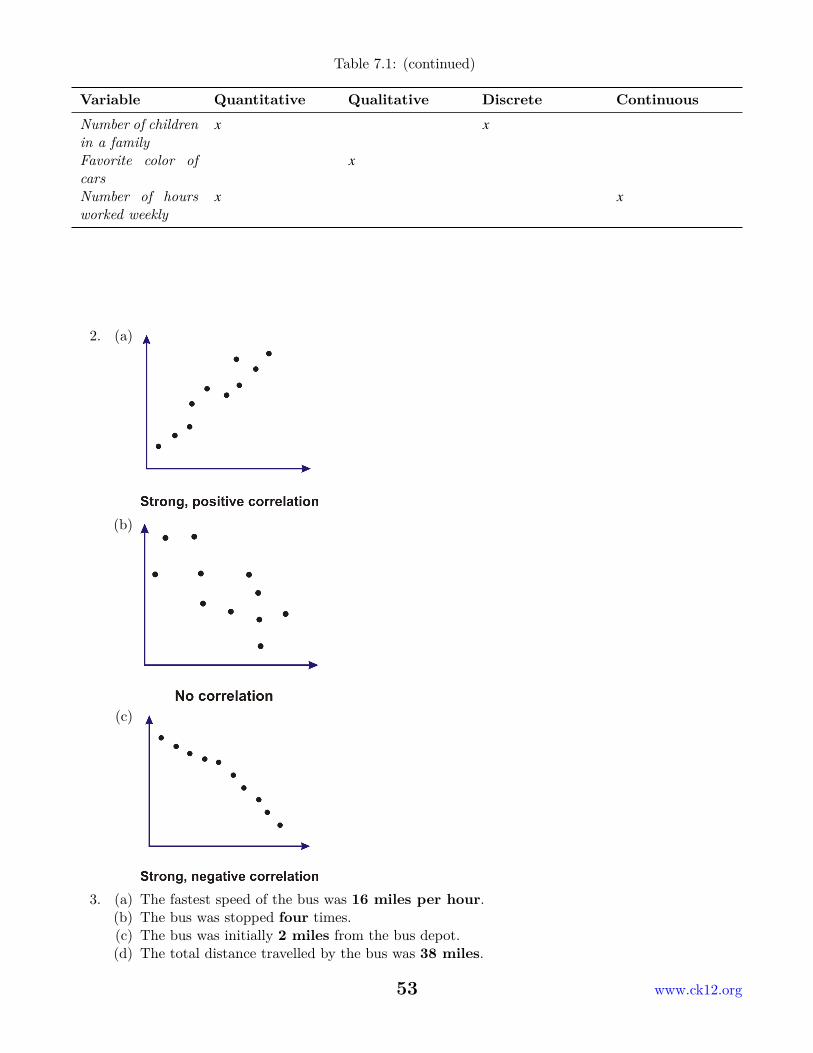
Table 7.1: (continued)
Variable Quantitative Qualitative Discrete ContinuousNumber of childrenin a family
x x
Favorite color ofcars
x
Number of hoursworked weekly
x x
2. (a)
(b)
(c)
3. (a) The fastest speed of the bus was 16 miles per hour.(b) The bus was stopped four times.(c) The bus was initially 2 miles from the bus depot.(d) The total distance travelled by the bus was 38 miles.
53 www.ck12.org
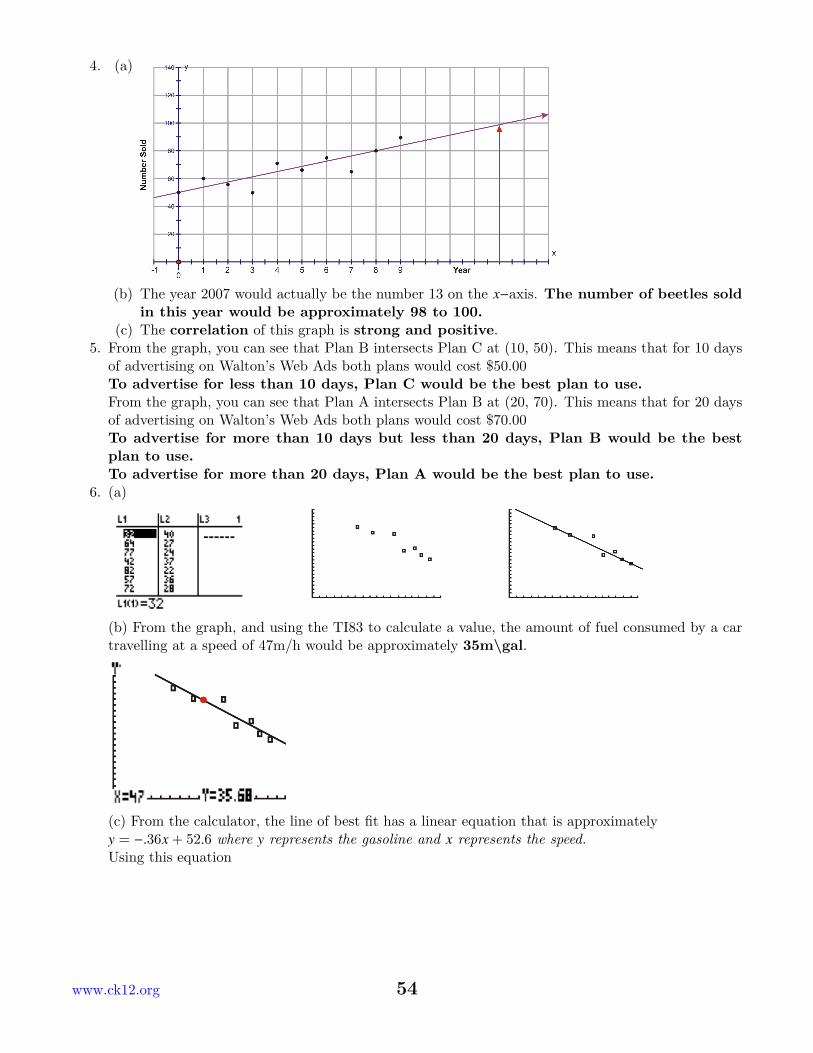
4. (a)
(b) The year 2007 would actually be the number 13 on the x−axis. The number of beetles soldin this year would be approximately 98 to 100.
(c) The correlation of this graph is strong and positive.5. From the graph, you can see that Plan B intersects Plan C at (10, 50). This means that for 10 daysof advertising on Walton’s Web Ads both plans would cost $50.00To advertise for less than 10 days, Plan C would be the best plan to use.From the graph, you can see that Plan A intersects Plan B at (20, 70). This means that for 20 daysof advertising on Walton’s Web Ads both plans would cost $70.00To advertise for more than 10 days but less than 20 days, Plan B would be the bestplan to use.To advertise for more than 20 days, Plan A would be the best plan to use.
6. (a)
(b) From the graph, and using the TI83 to calculate a value, the amount of fuel consumed by a cartravelling at a speed of 47m/h would be approximately 35m\gal.
(c) From the calculator, the line of best fit has a linear equation that is approximatelyy = −.36x + 52.6 where y represents the gasoline and x represents the speed.Using this equation
www.ck12.org 54
y = −.36x + 52.629 = −.36x + 52.6
29 − 52.6 = −.36x + 52.6 − 52.6−23.6−.36
=−.36x−.36
65.5m/h = x
The speed of the car would be approximately 65.6 miles per hour.7. Answers will vary. Students should include the beginning and end time of the trip as well as theintervals when there was a stop. Reference could also be made to the speed of the vehicle, the totaldistance travelled and the length of time necessary to complete the trip.
8. (a)m 5 14 2 10 16 4 18 2 8 11n 6 13 4 10 15 7 16 5 8 12
(b)m 13 3 18 9 20 15 6 10 21 4n 7 14 9 16 7 13 10 13 3 19
Circle Graphs, Bar Graphs, Histograms and Stem-and-Leaf PlotsSection A – Selected Response
1. D – Count the number of all digits after the number 2 in the row that has 3 as its stem There is atotal of 11 digits.
55 www.ck12.org
2. B – Add the tops of the first three bars 3 + 2 + 6 = 113. C – By definition a distribution that has two peaks is bimodal.4. A – Add the values and divide by 2. 14.5+23.5
2 = 382 = 19
5. C – The number of students is 6 out of 25. 625 = 0.24 0.24(100%) = 24%
6. B – The time to run depends upon the fitness level of the runner.7. D – By definition a frequency polygon is a graph that used lines to join the midpoints of the classes.8. A – The mode is the value that appears the most often and here it is 32.9. B – There are four bars that are below the height of the bar that reaches $850.10. D – The number of students is 9 out of 25. 9
25 = 0.36 0.36(100%) = 36%
Section B – Long Answer Questions
1. 20 12 39 38 18 58 49 59 66 5023 32 43 53 67 35 29 13 42 5537 19 38 22 46 71 9 65 15 38
2. The answers to this question will vary but here is an example of one solution:
3. Ages of Canadian Prime Ministers when they were sworn into office.52 74 60 39 65 46 55 66 54 51 70 47 69 47 57 46 4866 61 59 46 45
www.ck12.org 56
From the stem and leaf plot some information that I know is:
• The youngest Prime Minister was 39 when he was sworn into office.• The oldest Prime Minister to be sworn into office was 74.• The modal age for the Prime Ministers was 46.• The median age for a Prime Minister was 54.5 years of age.
4.
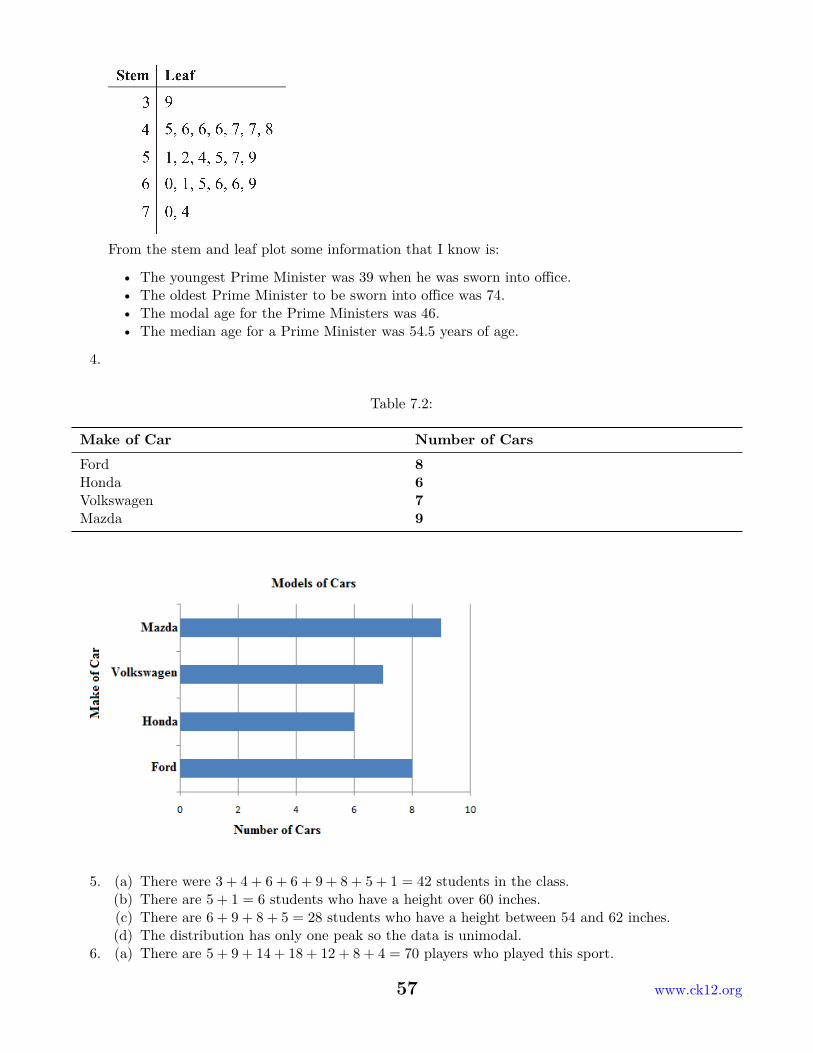
Table 7.2:
Make of Car Number of CarsFord 8Honda 6Volkswagen 7Mazda 9
5. (a) There were 3 + 4 + 6 + 6 + 9 + 8 + 5 + 1 = 42 students in the class.(b) There are 5 + 1 = 6 students who have a height over 60 inches.(c) There are 6 + 9 + 8 + 5 = 28 students who have a height between 54 and 62 inches.(d) The distribution has only one peak so the data is unimodal.
6. (a) There are 5 + 9 + 14 + 18 + 12 + 8 + 4 = 70 players who played this sport.
57 www.ck12.org

(b) The most common weight was 85 kg.(c) The sport they were playing may have been Rugby.(d) The weights of 55 kg and 105 kg are the weights that are one unit below and above the beginning
and end points of the data set.(e) There are no weights recorded for 75 kg and 80 kg.
7. (a) The parts of the circle graph are displayed with degrees and the parts should be shown withpercentages.(b) The number of students that participated in sports is135360 = 0.375 0.375(200) = 75(c) The number of students who participated in CMT is36360 = 0.1 0.1(200) = 20(d) The number of students who participated in volunteer work is90360 = 0.25 0.25(200) = 50(e)
8. 95 56 70 83 59 66 88 52 50 77 69 8054 75 68 78 51 64 55 67 74 57 73 53
Table 7.3:
Bin Frequency[50-60) 9[60-70) 5[70-80) 6[80-90) 3[90-100) 1
www.ck12.org 58
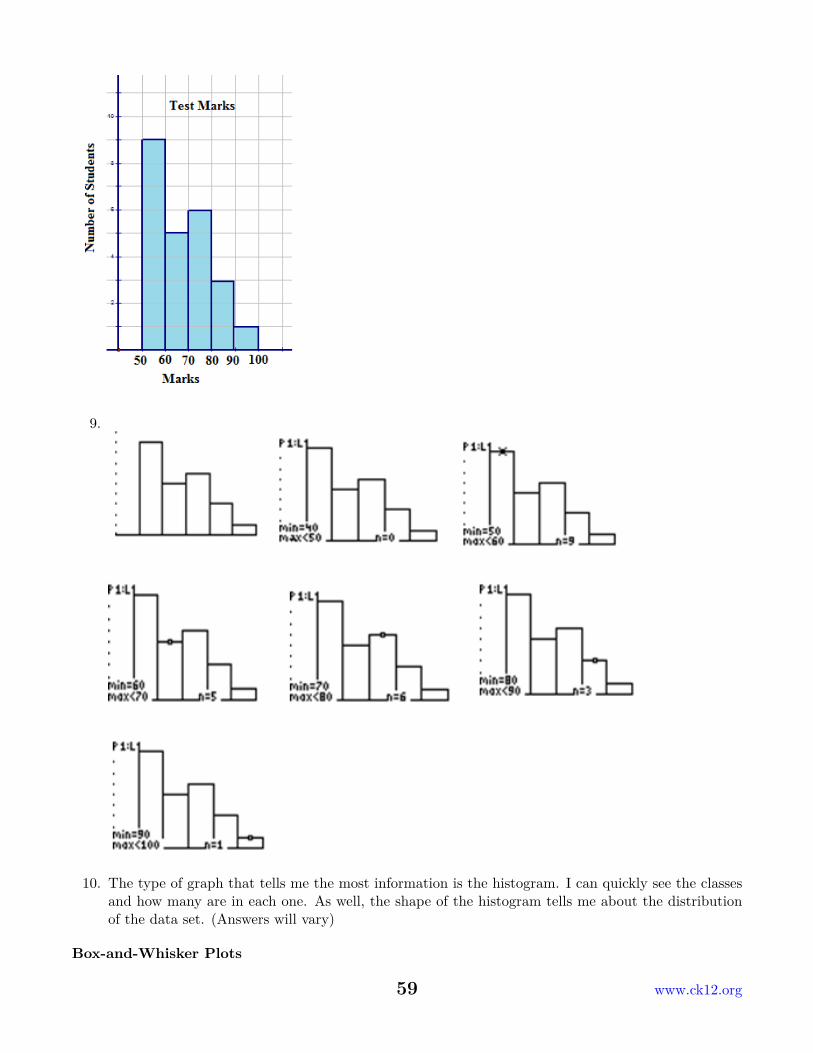
9.
10. The type of graph that tells me the most information is the histogram. I can quickly see the classesand how many are in each one. As well, the shape of the histogram tells me about the distributionof the data set. (Answers will vary)
Box-and-Whisker Plots
59 www.ck12.org
Section A – Selected Response
1. B – The five –number summary consists of the minimum value, Q1, the median, Q3 and the maximumvalue.
2. C – The box contains 50 % of the data and each whisker contains 25 % of the data.3. B – The horizontal lines on either side of the box of a box-and-whisker are called whiskers4. A – If the median is located to the left of the center of the box, the distribution is positively skewed.5. D – The two horizontal lines of the box-and-whisker join Q1 and Q3.
Section B – Long Answer Questions
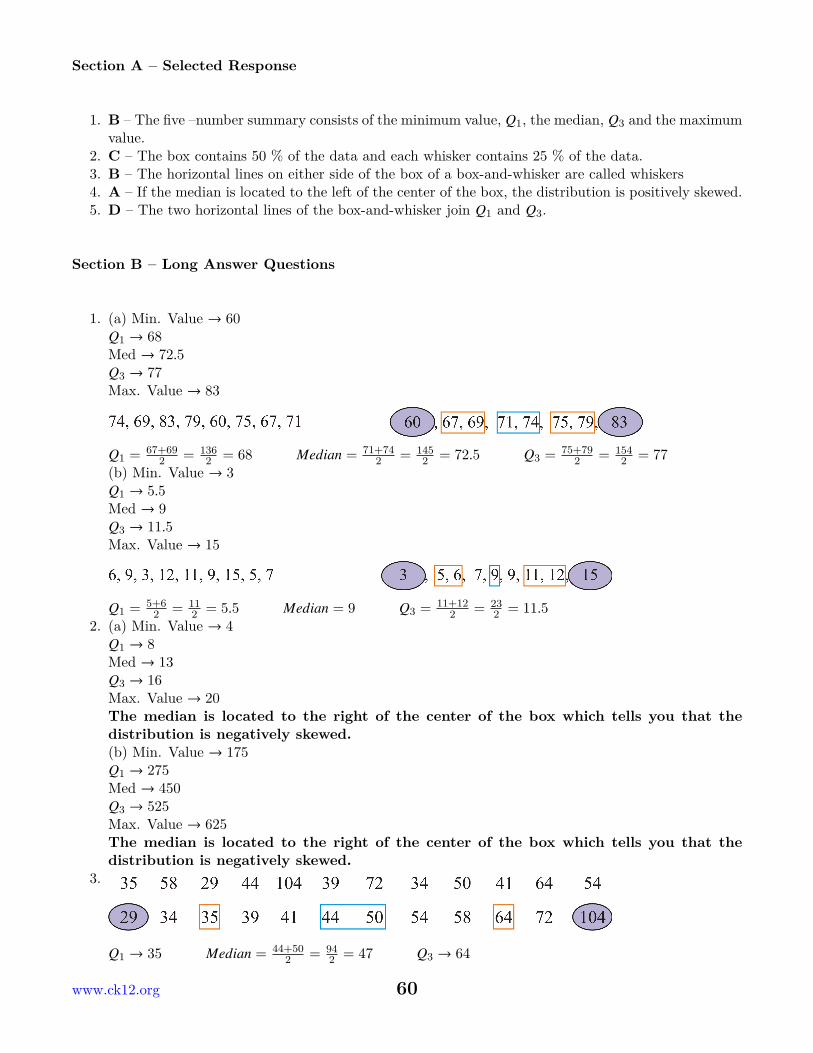
1. (a) Min. Value → 60Q1 → 68Med → 72.5Q3 → 77Max. Value → 83
Q1 = 67+692 = 136
2 = 68 Median = 71+742 = 145
2 = 72.5 Q3 = 75+792 = 154
2 = 77(b) Min. Value → 3Q1 → 5.5Med → 9Q3 → 11.5Max. Value → 15
Q1 = 5+62 = 11
2 = 5.5 Median = 9 Q3 = 11+122 = 23
2 = 11.52. (a) Min. Value → 4
Q1 → 8Med → 13Q3 → 16Max. Value → 20The median is located to the right of the center of the box which tells you that thedistribution is negatively skewed.(b) Min. Value → 175Q1 → 275Med → 450Q3 → 525Max. Value → 625The median is located to the right of the center of the box which tells you that thedistribution is negatively skewed.
3.
Q1 → 35 Median = 44+502 = 94
2 = 47 Q3 → 64
www.ck12.org 60
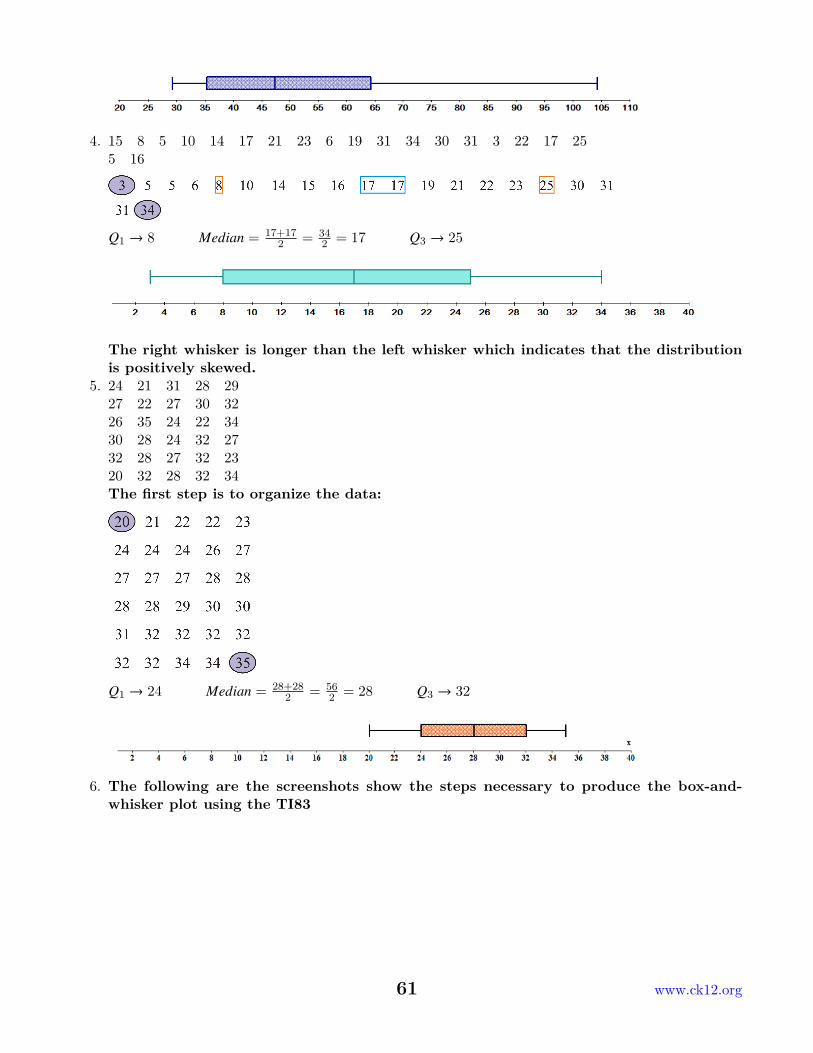
4. 15 8 5 10 14 17 21 23 6 19 31 34 30 31 3 22 17 255 16
Q1 → 8 Median = 17+172 = 34
2 = 17 Q3 → 25
The right whisker is longer than the left whisker which indicates that the distributionis positively skewed.
5. 24 21 31 28 2927 22 27 30 3226 35 24 22 3430 28 24 32 2732 28 27 32 2320 32 28 32 34The first step is to organize the data:
Q1 → 24 Median = 28+282 = 56
2 = 28 Q3 → 32
6. The following are the screenshots show the steps necessary to produce the box-and-whisker plot using the TI83
61 www.ck12.org
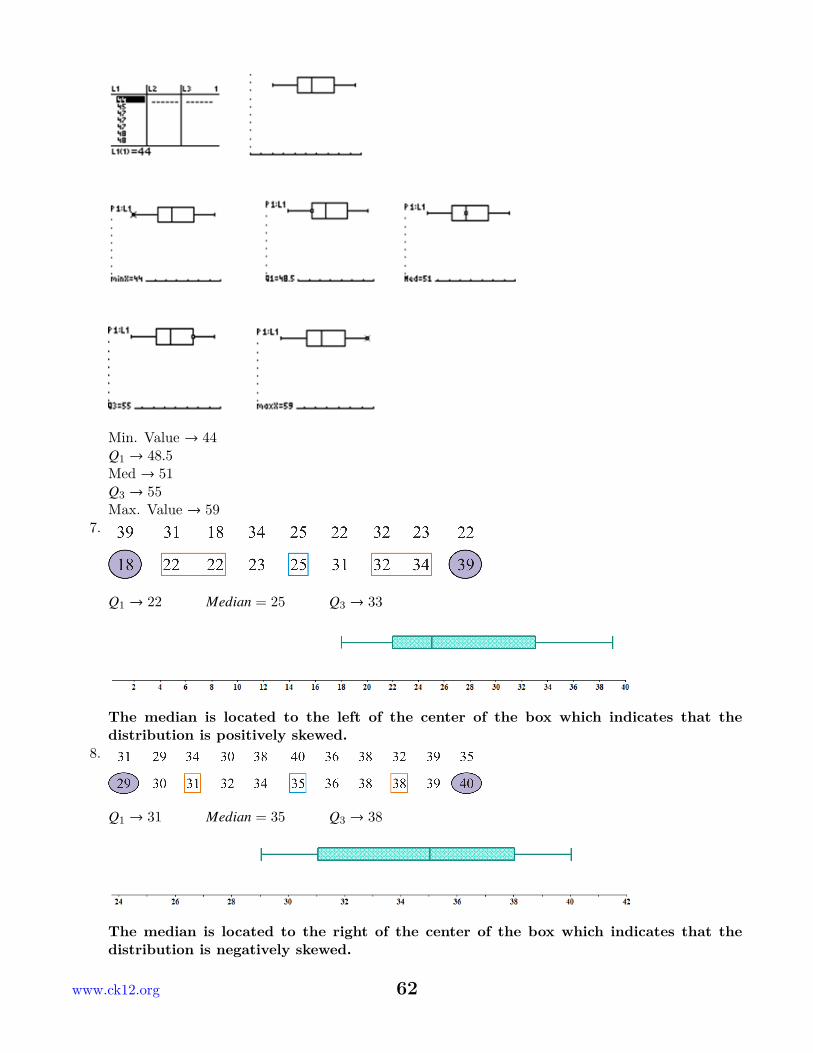
Min. Value → 44Q1 → 48.5Med → 51Q3 → 55Max. Value → 59
7.
Q1 → 22 Median = 25 Q3 → 33
The median is located to the left of the center of the box which indicates that thedistribution is positively skewed.
8.
Q1 → 31 Median = 35 Q3 → 38
The median is located to the right of the center of the box which indicates that thedistribution is negatively skewed.
www.ck12.org 62
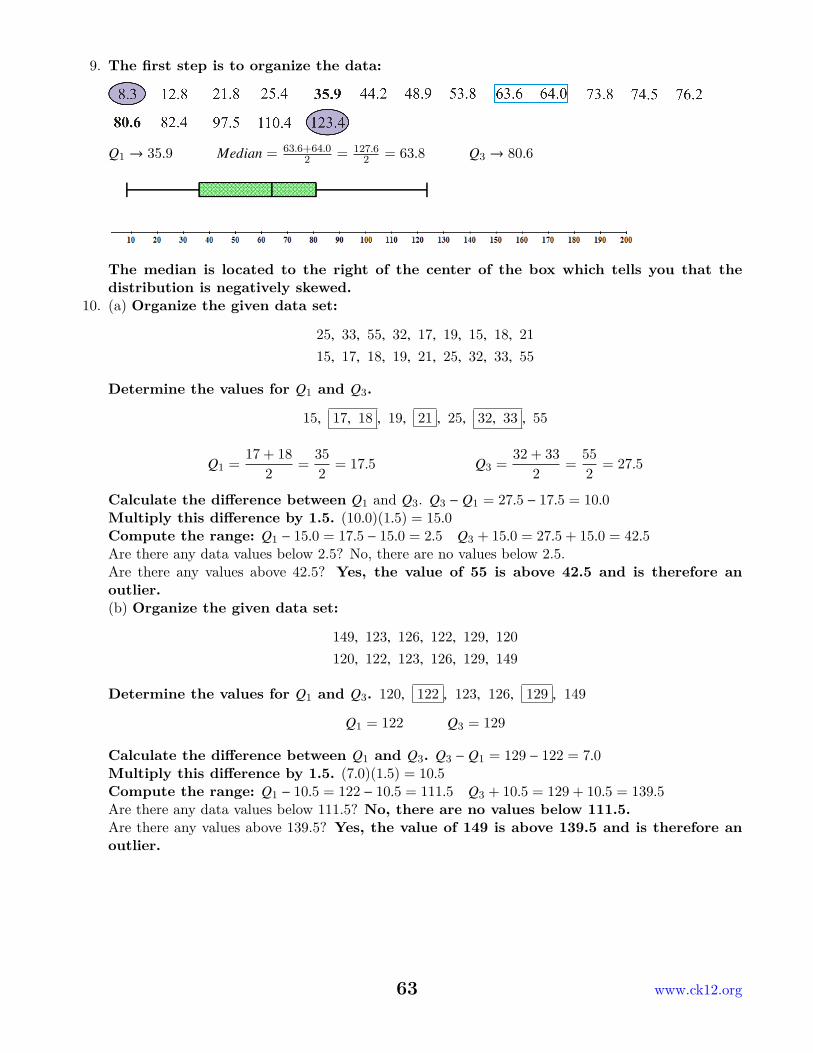
9. The first step is to organize the data:
Q1 → 35.9 Median = 63.6+64.02 = 127.6
2 = 63.8 Q3 → 80.6
The median is located to the right of the center of the box which tells you that thedistribution is negatively skewed.
10. (a) Organize the given data set:
25, 33, 55, 32, 17, 19, 15, 18, 2115, 17, 18, 19, 21, 25, 32, 33, 55
Determine the values for Q1 and Q3.
15, 17, 18 , 19, 21 , 25, 32, 33 , 55
Q1 =17 + 18
2=
352
= 17.5 Q3 =32 + 33
2=
552
= 27.5
Calculate the difference between Q1 and Q3. Q3 − Q1 = 27.5 − 17.5 = 10.0Multiply this difference by 1.5. (10.0)(1.5) = 15.0Compute the range: Q1 − 15.0 = 17.5 − 15.0 = 2.5 Q3 + 15.0 = 27.5 + 15.0 = 42.5Are there any data values below 2.5? No, there are no values below 2.5.Are there any values above 42.5? Yes, the value of 55 is above 42.5 and is therefore anoutlier.(b) Organize the given data set:
149, 123, 126, 122, 129, 120120, 122, 123, 126, 129, 149
Determine the values for Q1 and Q3. 120, 122 , 123, 126, 129 , 149
Q1 = 122 Q3 = 129
Calculate the difference between Q1 and Q3. Q3 − Q1 = 129 − 122 = 7.0Multiply this difference by 1.5. (7.0)(1.5) = 10.5Compute the range: Q1 − 10.5 = 122 − 10.5 = 111.5 Q3 + 10.5 = 129 + 10.5 = 139.5Are there any data values below 111.5? No, there are no values below 111.5.Are there any values above 139.5? Yes, the value of 149 is above 139.5 and is therefore anoutlier.
63 www.ck12.org
Chapter 8
Organizing and DisplayingData for Comparison, AnswerKey
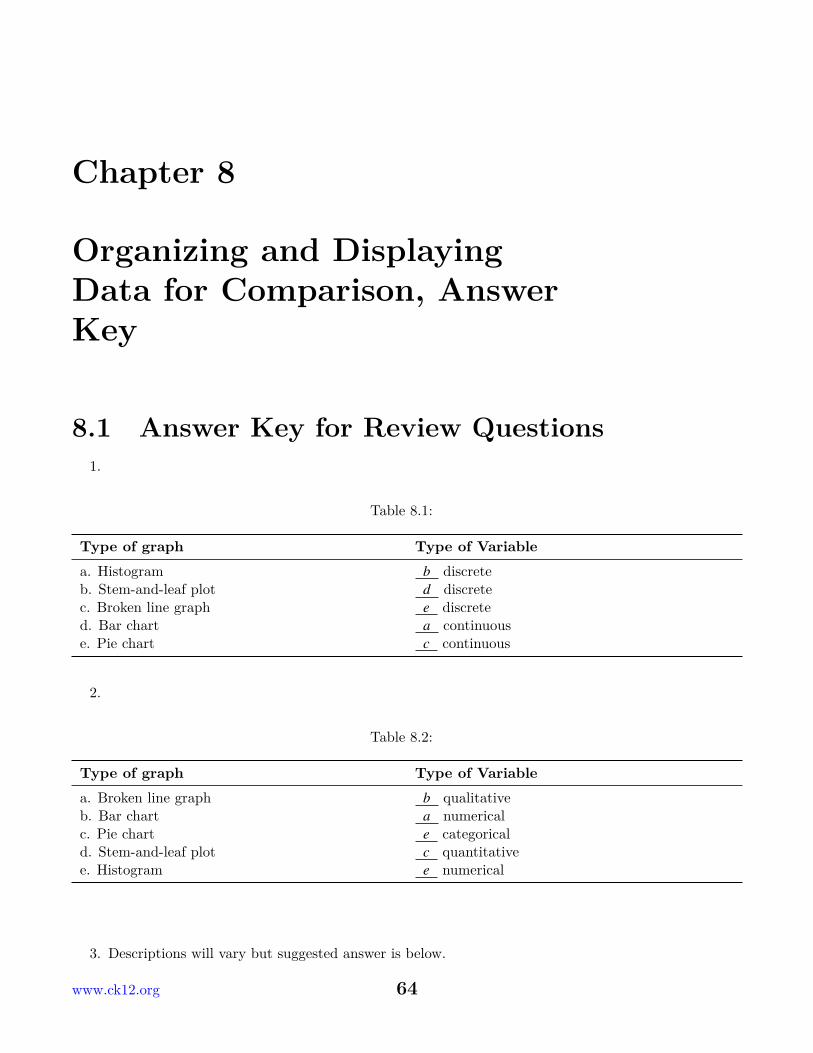
8.1 Answer Key for Review Questions1.
Table 8.1:
Type of graph Type of Variablea. Histogram b discreteb. Stem-and-leaf plot d discretec. Broken line graph e discreted. Bar chart a continuouse. Pie chart c continuous
2.
Table 8.2:
Type of graph Type of Variablea. Broken line graph b qualitativeb. Bar chart a numericalc. Pie chart e categoricald. Stem-and-leaf plot c quantitativee. Histogram e numerical
3. Descriptions will vary but suggested answer is below.
www.ck12.org 64
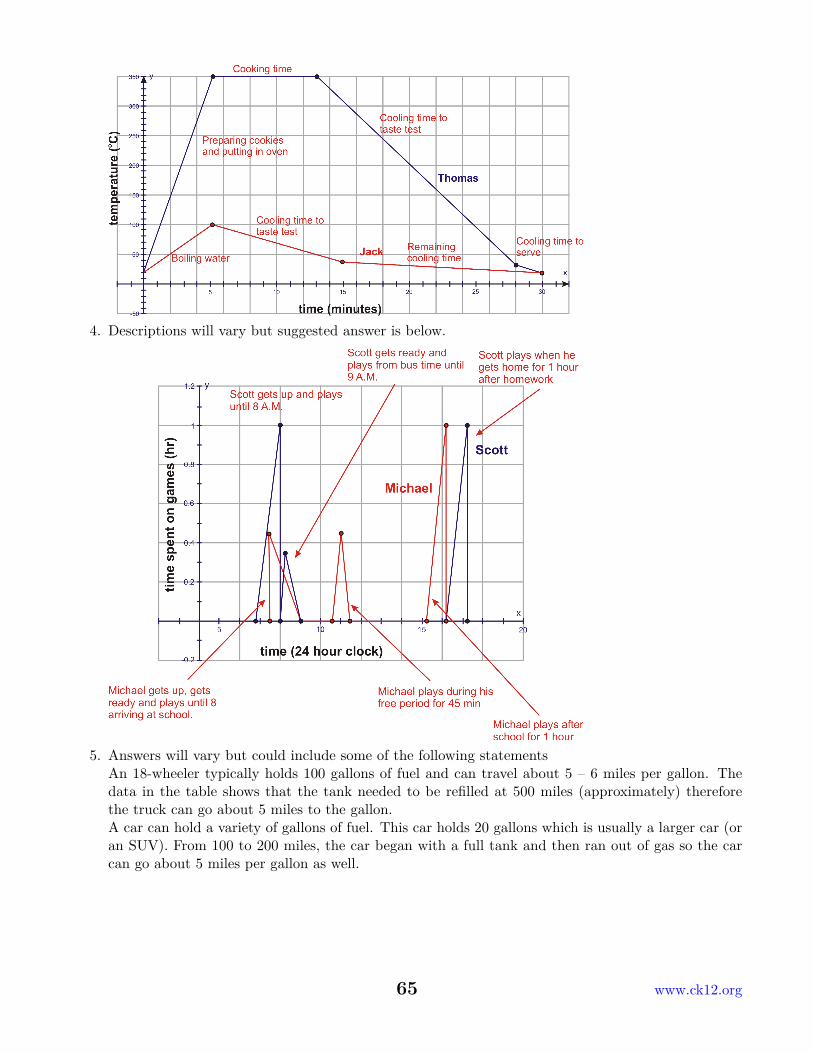
4. Descriptions will vary but suggested answer is below.
5. Answers will vary but could include some of the following statementsAn 18-wheeler typically holds 100 gallons of fuel and can travel about 5 – 6 miles per gallon. Thedata in the table shows that the tank needed to be refilled at 500 miles (approximately) thereforethe truck can go about 5 miles to the gallon.A car can hold a variety of gallons of fuel. This car holds 20 gallons which is usually a larger car (oran SUV). From 100 to 200 miles, the car began with a full tank and then ran out of gas so the carcan go about 5 miles per gallon as well.
65 www.ck12.org
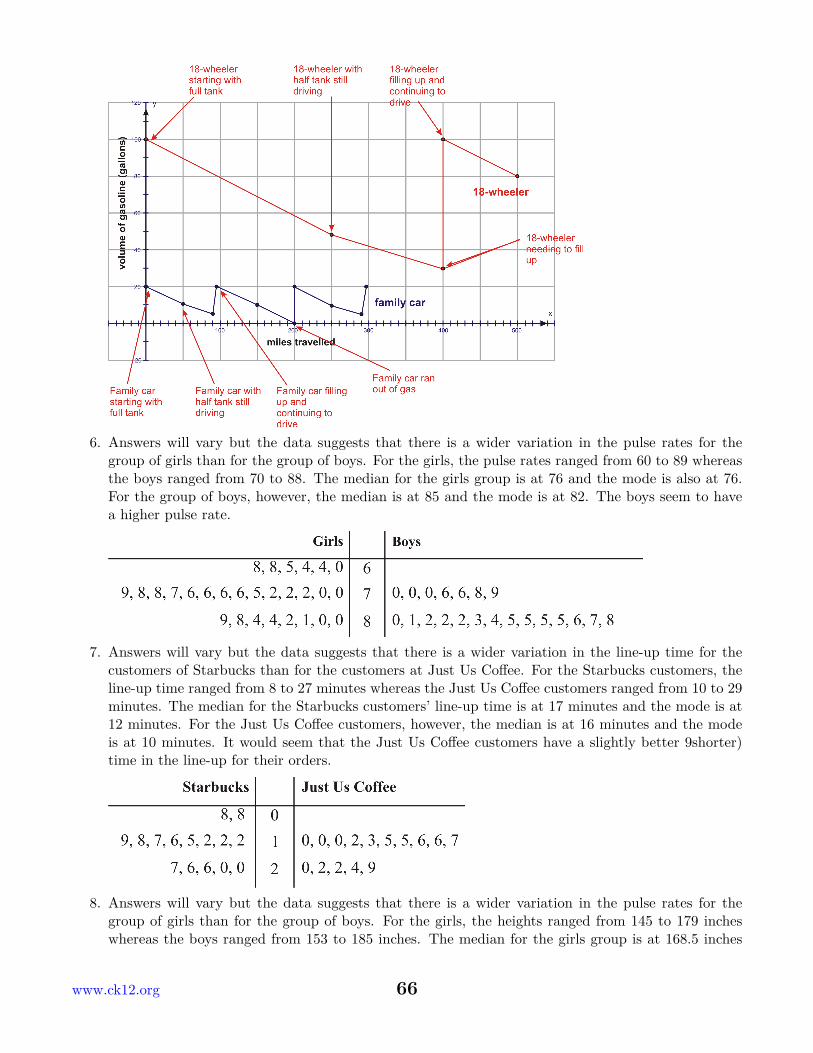
6. Answers will vary but the data suggests that there is a wider variation in the pulse rates for thegroup of girls than for the group of boys. For the girls, the pulse rates ranged from 60 to 89 whereasthe boys ranged from 70 to 88. The median for the girls group is at 76 and the mode is also at 76.For the group of boys, however, the median is at 85 and the mode is at 82. The boys seem to havea higher pulse rate.
7. Answers will vary but the data suggests that there is a wider variation in the line-up time for thecustomers of Starbucks than for the customers at Just Us Coffee. For the Starbucks customers, theline-up time ranged from 8 to 27 minutes whereas the Just Us Coffee customers ranged from 10 to 29minutes. The median for the Starbucks customers’ line-up time is at 17 minutes and the mode is at12 minutes. For the Just Us Coffee customers, however, the median is at 16 minutes and the modeis at 10 minutes. It would seem that the Just Us Coffee customers have a slightly better 9shorter)time in the line-up for their orders.
8. Answers will vary but the data suggests that there is a wider variation in the pulse rates for thegroup of girls than for the group of boys. For the girls, the heights ranged from 145 to 179 incheswhereas the boys ranged from 153 to 185 inches. The median for the girls group is at 168.5 inches
www.ck12.org 66
and the mode is at 155 inches. For the group of boys, however, the median is at 169.5 inches and themode is at 167 inches. The boys seem to have more height than the girls.
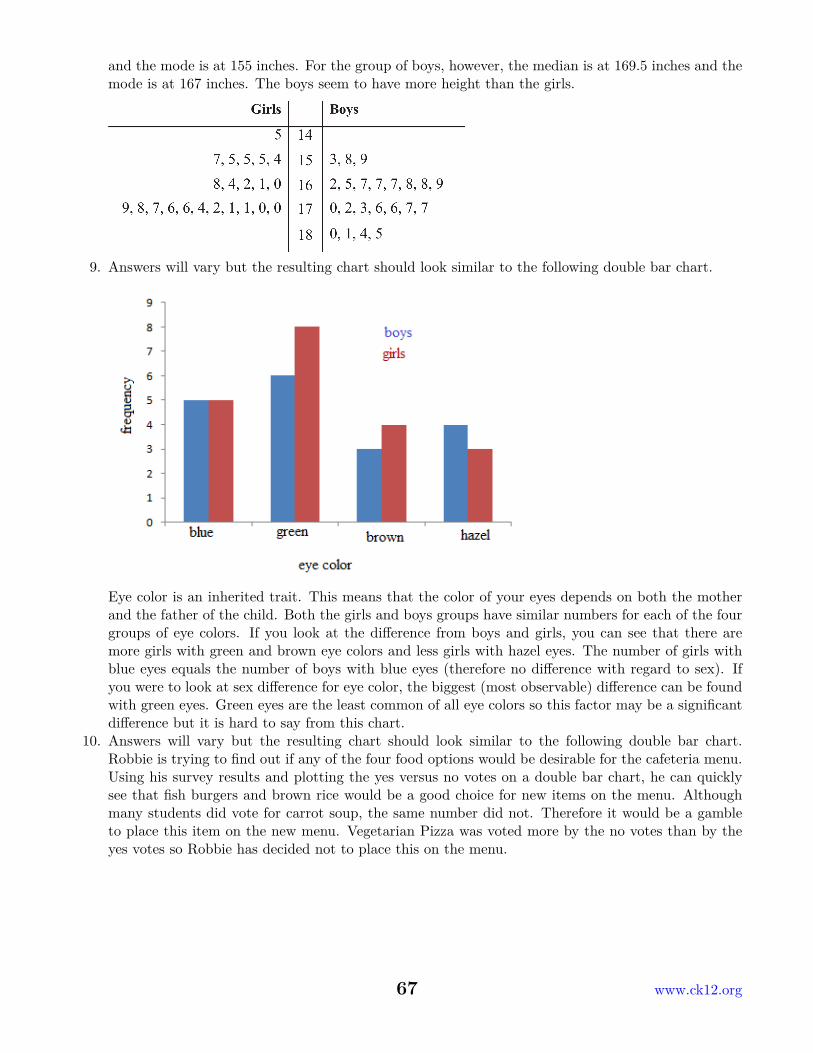
9. Answers will vary but the resulting chart should look similar to the following double bar chart.
Eye color is an inherited trait. This means that the color of your eyes depends on both the motherand the father of the child. Both the girls and boys groups have similar numbers for each of the fourgroups of eye colors. If you look at the difference from boys and girls, you can see that there aremore girls with green and brown eye colors and less girls with hazel eyes. The number of girls withblue eyes equals the number of boys with blue eyes (therefore no difference with regard to sex). Ifyou were to look at sex difference for eye color, the biggest (most observable) difference can be foundwith green eyes. Green eyes are the least common of all eye colors so this factor may be a significantdifference but it is hard to say from this chart.
10. Answers will vary but the resulting chart should look similar to the following double bar chart.Robbie is trying to find out if any of the four food options would be desirable for the cafeteria menu.Using his survey results and plotting the yes versus no votes on a double bar chart, he can quicklysee that fish burgers and brown rice would be a good choice for new items on the menu. Althoughmany students did vote for carrot soup, the same number did not. Therefore it would be a gambleto place this item on the new menu. Vegetarian Pizza was voted more by the no votes than by theyes votes so Robbie has decided not to place this on the menu.
67 www.ck12.org
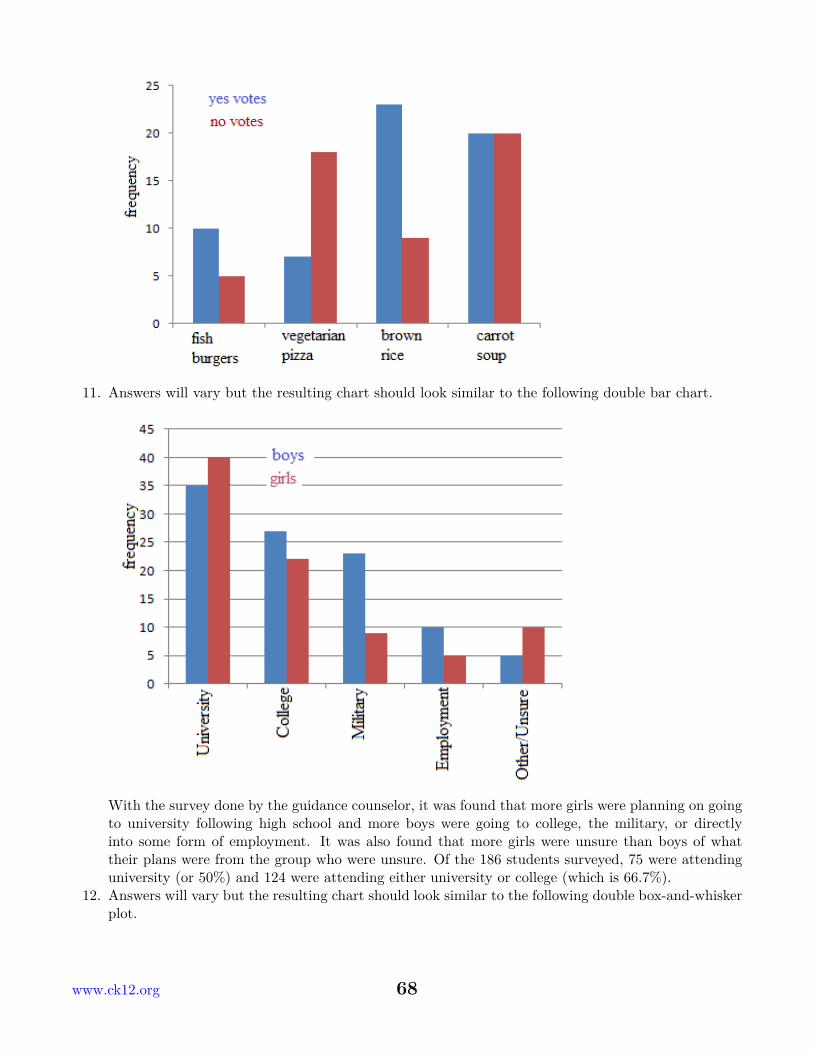
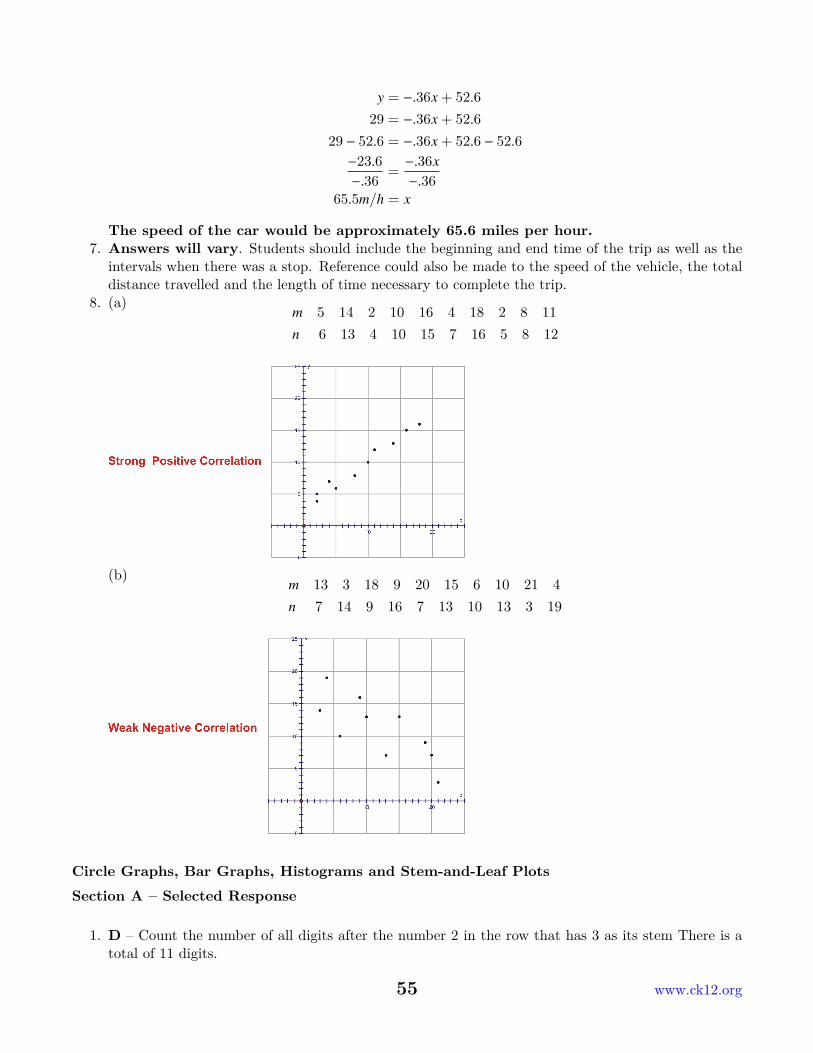
11. Answers will vary but the resulting chart should look similar to the following double bar chart.
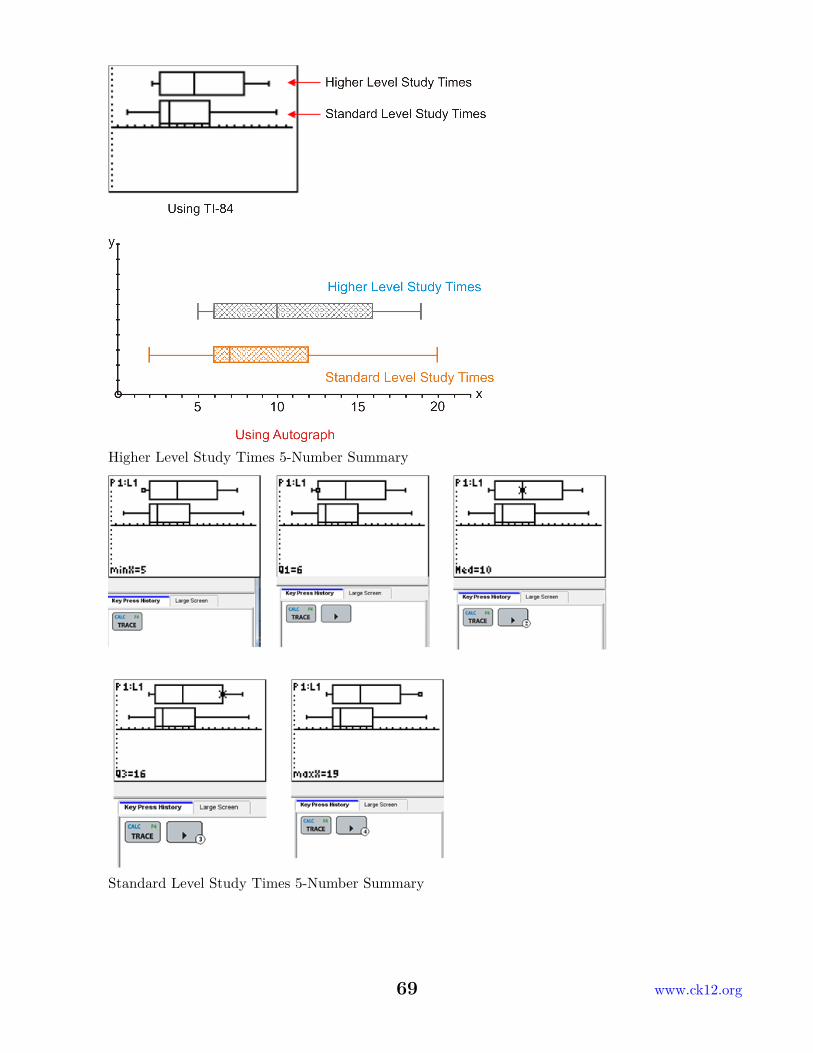
With the survey done by the guidance counselor, it was found that more girls were planning on goingto university following high school and more boys were going to college, the military, or directlyinto some form of employment. It was also found that more girls were unsure than boys of whattheir plans were from the group who were unsure. Of the 186 students surveyed, 75 were attendinguniversity (or 50%) and 124 were attending either university or college (which is 66.7%).
12. Answers will vary but the resulting chart should look similar to the following double box-and-whiskerplot.
www.ck12.org 68
Higher Level Study Times 5-Number Summary
Standard Level Study Times 5-Number Summary
69 www.ck12.org
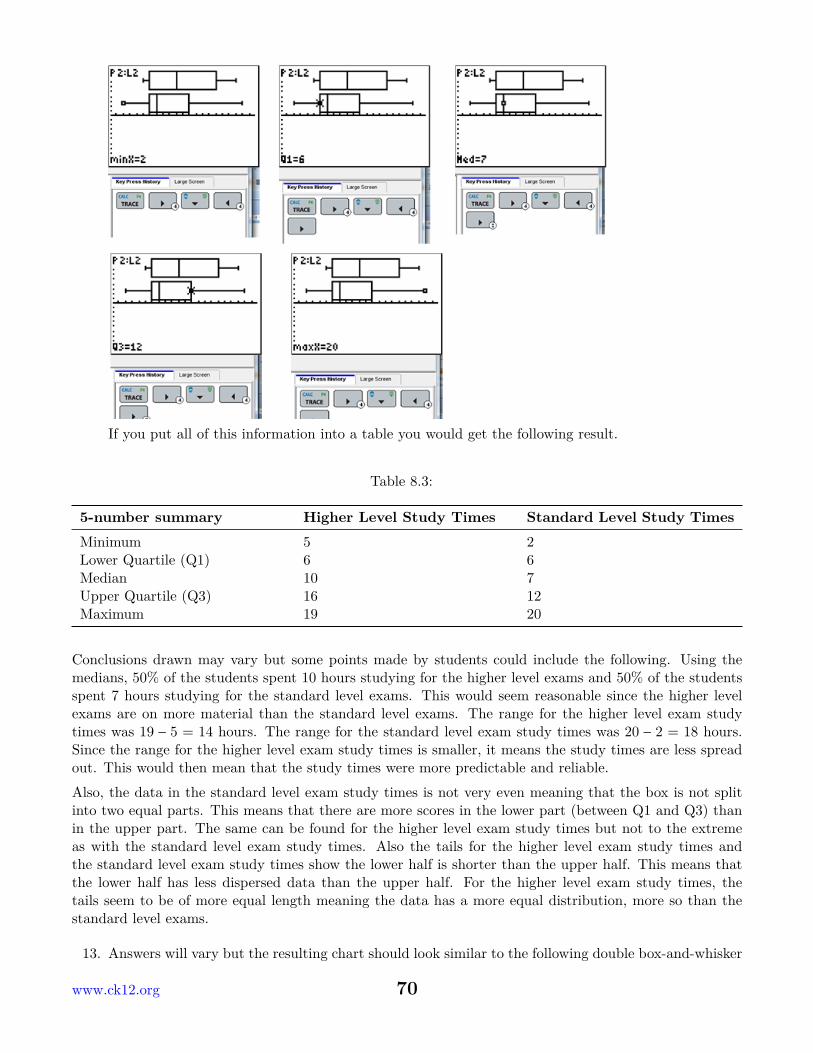
If you put all of this information into a table you would get the following result.
Table 8.3:
5-number summary Higher Level Study Times Standard Level Study TimesMinimum 5 2Lower Quartile (Q1) 6 6Median 10 7Upper Quartile (Q3) 16 12Maximum 19 20
Conclusions drawn may vary but some points made by students could include the following. Using themedians, 50% of the students spent 10 hours studying for the higher level exams and 50% of the studentsspent 7 hours studying for the standard level exams. This would seem reasonable since the higher levelexams are on more material than the standard level exams. The range for the higher level exam studytimes was 19 − 5 = 14 hours. The range for the standard level exam study times was 20 − 2 = 18 hours.Since the range for the higher level exam study times is smaller, it means the study times are less spreadout. This would then mean that the study times were more predictable and reliable.Also, the data in the standard level exam study times is not very even meaning that the box is not splitinto two equal parts. This means that there are more scores in the lower part (between Q1 and Q3) thanin the upper part. The same can be found for the higher level exam study times but not to the extremeas with the standard level exam study times. Also the tails for the higher level exam study times andthe standard level exam study times show the lower half is shorter than the upper half. This means thatthe lower half has less dispersed data than the upper half. For the higher level exam study times, thetails seem to be of more equal length meaning the data has a more equal distribution, more so than thestandard level exams.
13. Answers will vary but the resulting chart should look similar to the following double box-and-whisker
www.ck12.org 70
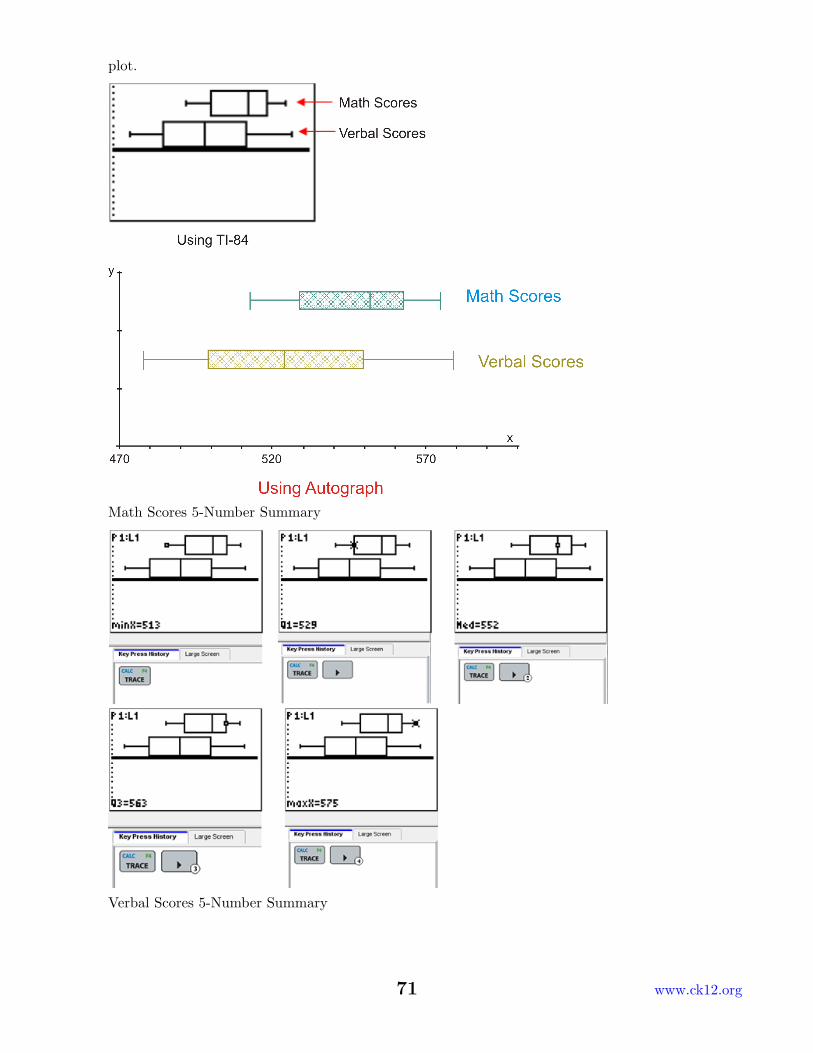
plot.
Math Scores 5-Number Summary
Verbal Scores 5-Number Summary
71 www.ck12.org
If you put all of this information into a table you would get the following result.
Table 8.4:
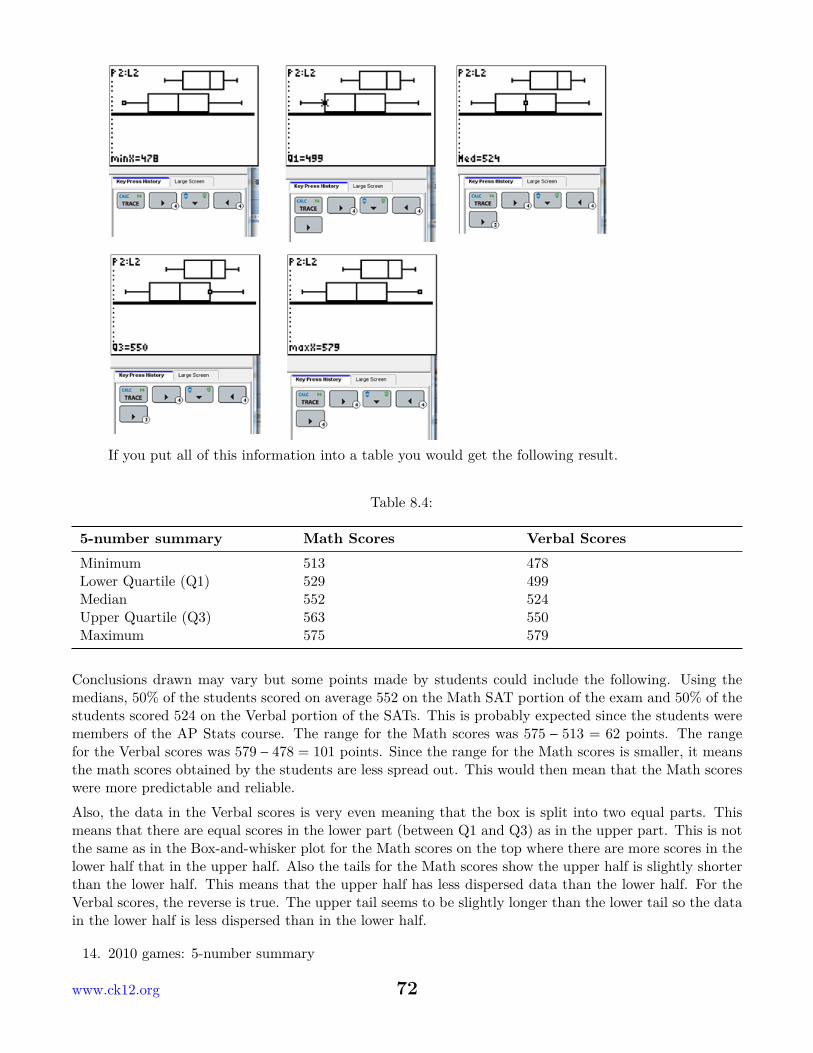
5-number summary Math Scores Verbal ScoresMinimum 513 478Lower Quartile (Q1) 529 499Median 552 524Upper Quartile (Q3) 563 550Maximum 575 579
Conclusions drawn may vary but some points made by students could include the following. Using themedians, 50% of the students scored on average 552 on the Math SAT portion of the exam and 50% of thestudents scored 524 on the Verbal portion of the SATs. This is probably expected since the students weremembers of the AP Stats course. The range for the Math scores was 575 − 513 = 62 points. The rangefor the Verbal scores was 579 − 478 = 101 points. Since the range for the Math scores is smaller, it meansthe math scores obtained by the students are less spread out. This would then mean that the Math scoreswere more predictable and reliable.Also, the data in the Verbal scores is very even meaning that the box is split into two equal parts. Thismeans that there are equal scores in the lower part (between Q1 and Q3) as in the upper part. This is notthe same as in the Box-and-whisker plot for the Math scores on the top where there are more scores in thelower half that in the upper half. Also the tails for the Math scores show the upper half is slightly shorterthan the lower half. This means that the upper half has less dispersed data than the lower half. For theVerbal scores, the reverse is true. The upper tail seems to be slightly longer than the lower tail so the datain the lower half is less dispersed than in the lower half.
14. 2010 games: 5-number summary
www.ck12.org 72
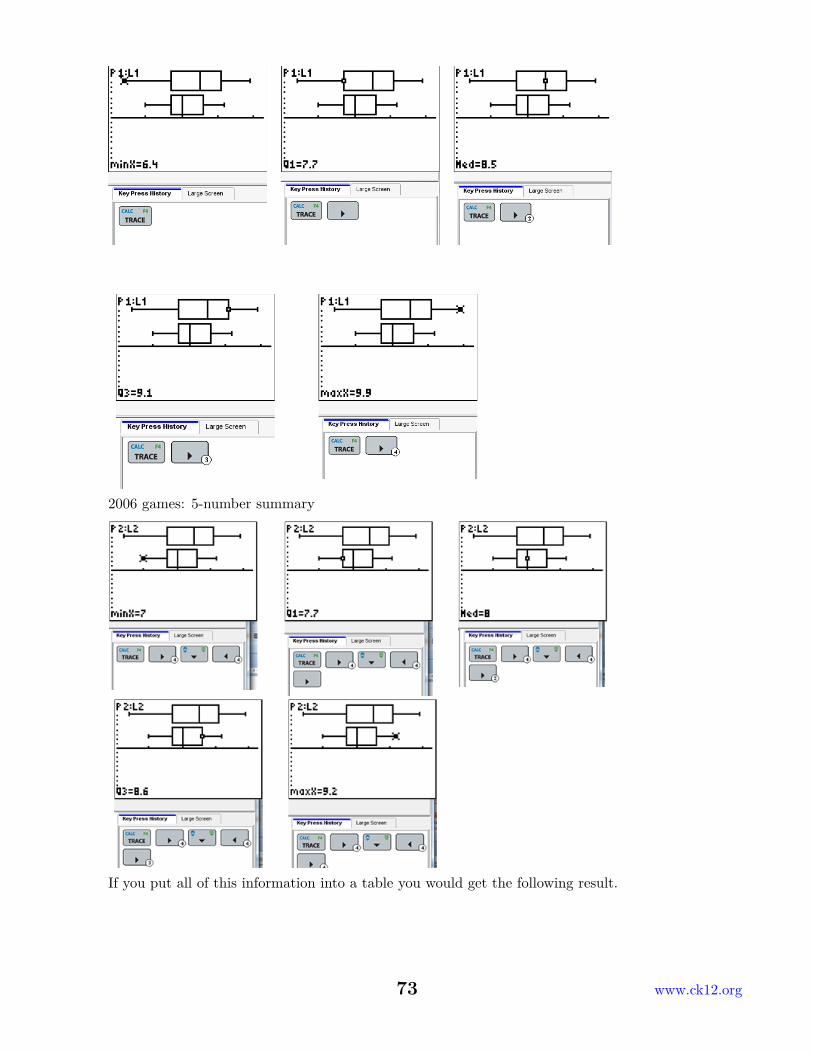
2006 games: 5-number summary
If you put all of this information into a table you would get the following result.
73 www.ck12.org
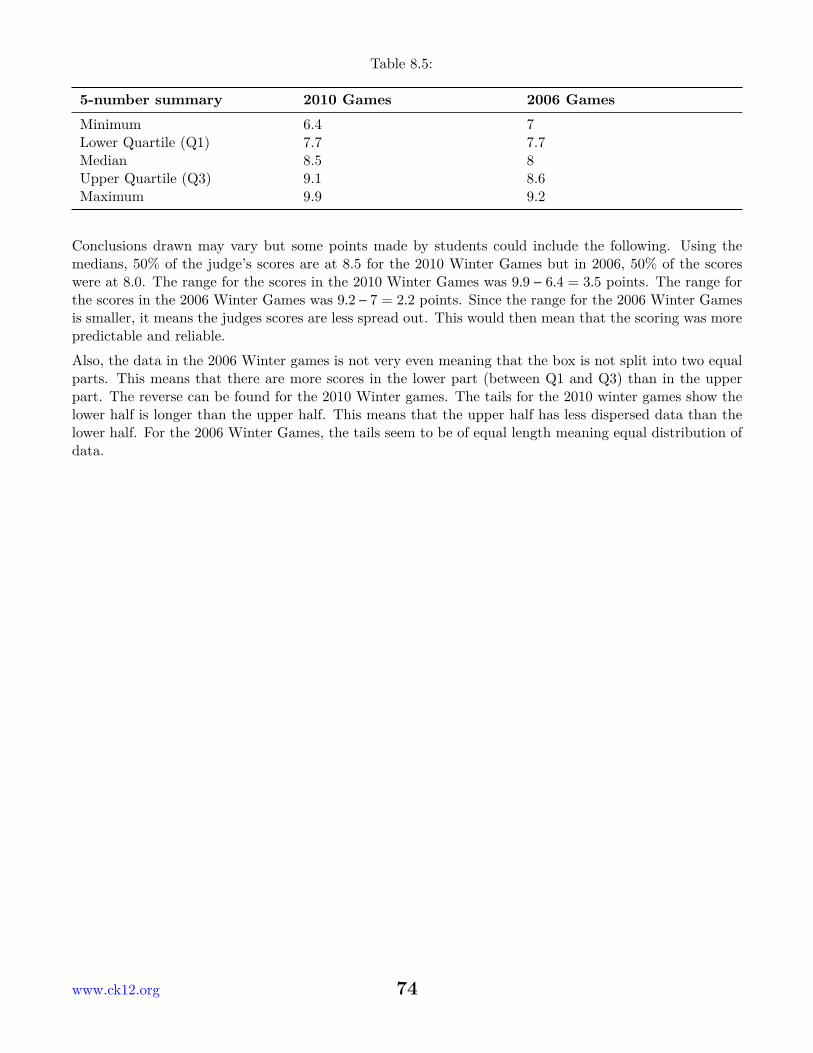
Table 8.5:
5-number summary 2010 Games 2006 GamesMinimum 6.4 7Lower Quartile (Q1) 7.7 7.7Median 8.5 8Upper Quartile (Q3) 9.1 8.6Maximum 9.9 9.2
Conclusions drawn may vary but some points made by students could include the following. Using themedians, 50% of the judge’s scores are at 8.5 for the 2010 Winter Games but in 2006, 50% of the scoreswere at 8.0. The range for the scores in the 2010 Winter Games was 9.9 − 6.4 = 3.5 points. The range forthe scores in the 2006 Winter Games was 9.2− 7 = 2.2 points. Since the range for the 2006 Winter Gamesis smaller, it means the judges scores are less spread out. This would then mean that the scoring was morepredictable and reliable.Also, the data in the 2006 Winter games is not very even meaning that the box is not split into two equalparts. This means that there are more scores in the lower part (between Q1 and Q3) than in the upperpart. The reverse can be found for the 2010 Winter games. The tails for the 2010 winter games show thelower half is longer than the upper half. This means that the upper half has less dispersed data than thelower half. For the 2006 Winter Games, the tails seem to be of equal length meaning equal distribution ofdata.
www.ck12.org 74