cityware: urban computing to bridge online and real-world ... · (bott, 1957) and the urbanisation...
TRANSCRIPT

Cityware: Urban computing to bridge online and real-world social networks
Vassilis Kostakos & Eamonn O’NeillDepartment of Computer Science
University of BathBath BA2 7AY, UK
{vk, eamonn}@cs.bath.ac.uk
ABSTRACTIn this paper we describe a platform that enables us to systematically study online social networks alongside their real-world counterparts. Our system, entitled Cityware, merges users’ online social data, made available through Facebook, with mobility traces captured via Bluetooth scanning. Furthermore, our system enables users to contribute their own mobility traces, thus allowing users to form and participate in a community. In addition to describing Cityware’s architecture, we discuss the type of data we are collecting, and the analyses our platform enables, as well as users’ reactions and thoughts.Author KeywordsSocial networks, bluetooth, Facebook, mobile phones.ACM Classification KeywordsH5.m. Information interfaces and presentation: Miscellaneous. INTRODUCTIONThe formalised study of network graphs is considered to have begun by Euler’s famous solution to the Seven Bridges of Königsberg problem in 1736 (Biggs et al., 1986). In his solution, Euler represented the four landmasses and seven bridges of Königsberg, now Kaliningrad, as four nodes and seven links respectively. Thus, he was able to prove that no route crosses each bridge only once. Graph theory has greatly advanced every since, mostly focusing on mathematical proofs and theorems on graph topology, trees and cycles.
While graphs have been used to explore relationships between social entities for over a century, it was not until the 1950’s that this became a systematic, and ultimately scientific process. Some of the first studies to engage in social network analysis are the kinship studies of Elizabeth Bott (Bott, 1957) and the urbanisation studies pioneered by Max Gluckman in Zambia (Gluckman & Aronoff, 1976). Similarly, Granovetter’s work (1973) lay the foundations for the small world hypothesis, suggesting that everyone is within six degrees of separation, while Wellman’s work gave some evidence of how large-scale social changes have affected the nature of personal communities and the support they provide (1979). Since then, social network analysis has moved from being a suggestive metaphor to becoming an analytic approach, with its own theories and research methods. In the 1970’s, Freeman developed a multitude of metrics for analysing social and communication networks (e.g. 2004), thus boosting commercial interest in the area due to companies aiming to optimise their procedures and operations. In the last decade, the identification of mathematical principles such as the small-world and scaling phenomena (Barabasi & Albert, 1999; Watts & Strogatz, 1998), underpinning many natural and man-made systems, have sparked further interest in the study of networks.
The systems design community has also been interested in the study of social networks as well as online social networks. Typical research topics in the area include the effect of social engagement on behaviour (e.g. Millen & Patterson, 2002), the issue of identity and projected identity (Lee & Nass, 2003), as well as the design of socio-technical systems (Herrmann et al., 2004). The recent proliferation of online social networking system such as Facebook, Dodgeball

and MySpace, has provided researchers with platforms for carrying out research into online social behaviour, and a journal devoted to this topic (http://www.elsevier.com/locate/socnet). In the Urban Computing domain, such studies have looked at the effect of social incentives and contextual information on the use of public transportation (Booher et al., 2007), the relationship between users’ online profiles and their online behaviour (Lampe et al., 2007), the various trust issues that emerge from using such systems (Riegelsberber & Vasalou, 2007), how such systems can help strengthen neighbourhoods (Foth, 2006), and the development of systematic grounds to base our designs (Kostakos et al., 2006).
To make inferences from online behaviour datasets, researchers still have to collect data from the real world and relate it to the online data. Thus, while social networking websites make it easy to capture large amounts of data, researchers still need to employ interviews, focus groups, questionnaires, or any other method that enables them to relate online with real world data.
In this paper we describe the development of the Cityware platform, which aims to bridge the gap between online and physical social networks. It allows users and researchers to explore an amalgamation of online and physical social networks. The key strength of our platform is that it allows the collection of vast amounts of quantitative data, both from the online and real worlds, which is immediately linked, synchronised, and available for further analysis. Furthermore, our platform enables both end users and researchers to gain a better understanding of the relationship between online and urban social networks. Here we describe the architecture of our platform, the types of data it makes available to users and researchers, the typical user-oriented scenarios that are beginning to emerge, and our planned research-oriented scenarios.CITYWAREOur platform is a massively distributed system, spanning both the online and physical worlds. Its architecture uniquely allows it to expand and contract in real time, while also enabling live data analysis. The main components of the platform are: people’s Bluetooth-enabled devices, Cityware nodes, Cityware servers, Facebook servers, Facebook application. An overview of this architecture is shown in Figure 1.
People with Bluetooth devices bumping into each other(shopping, school, work)
Cityware servers analyse data
Cityware
Facebook applicationpresents data
Cityware nodesrecord & upload data Users' social network
grows
Figure 1. Overview of the Cityware platform.

InfrastructureIn many ways the most vital element of our platform is people’s Bluetooth enabled mobile devices, such as mobile phones, PDAs or laptops. For any data to be collected, users must have switched on their Bluetooth devices, and set them to “discoverable” mode. From empirical observations, we know that, at least in certain cities in the UK, about 7.5% of observed pedestrians had Bluetooth switched on and set to discoverable (O’Neil et al., 2006). More crucially, however, Bluetooth matches very closely to people’s movement, as it typically has a short range (10 or 100 meters).
The presence of discoverable Bluetooth devices is captured via the deployment of Cityware nodes. These nodes are computers that carry out constant scanning for the unique identifier of Bluetooth devices, thus recording details about the devices in the immediate vicinity. The advantage of this approach is that the users’ mobile devices do not need to run any special software; simply enabling Bluetooth is adequate.
Initially, we deployed a small number of nodes as part of a pilot study. However, we also released open-source software that allows users to turn their Windows, Linux, and Mac OS X computers into nodes. Additionally, we modified the open-source application WirelessRope (Nicolai et al., 2005) to make it compatible with our platform, thus enabling mobile phones themselves to become Cityware nodes. So far, our platform has attracted nearly a thousand individuals for Europe, America, Asia and Australia who have set up their own nodes and are uploading data to our servers. AnalysisThe method we use to scan for Bluetooth devices generates discrete data about the presence of devices in the environment. A visualisation of our data, which we have termed timeline, can be seen in Figure 2. Here, the graph represent a specific scanning site, and each dot represents a discovery event, i.e. a point in time (x-axis) when the Bluetooth scanner picked up a specific device in the environment. By applying filters, we can see that, for example, device 16 was present in the environment between approximately 18.5 minutes and 19.5 minutes.
To study the patterns social interaction in our data, we first need to identify instances where two or more devices were present at the same place and the same time. For example, in Figure 2 we see that devices 12 and 13 encountered each other. Such encounters are effectively opportunities
Figure 2. A timeline visualisation of our Bluetooth gatecounts. Each device is given its own timeline (dashed lines) and each discovery event is plotted as a circle on the timeline.

for networking, both social and wireless. We developed filters that analyse our data and give us instances of devices encountering each other at each Cityware node location. These results take the form of records:
device1_id, device2_id, date, time, duration, Cityware node location
At this stage in our analysis we have a long list of such records, describing which devices encountered each other and by which scanner. For example, in Figure 2 we see that devices 12 and 13 encountered each other at 15.5 minutes and were together for approximately 1 minute. This list of encounters is a textual representation of the patterns of encounters across the scanning locations. To further study the patterns and structure hidden within this list, we transform it into a social network graph as follows: assuming that each device from our dataset becomes a node in the social graph, then the list of encounters indicates which nodes are connected. Proceeding in this manner, we are able to generate a social graph per Cityware node, as well as a social graph containing data from all Cityware nodes.
For illustration purposes, in Figure 3 we show the graph generated from one node’s scan data, located inside a pub. In this graph, each observed Bluetooth device is represented as a node in the graph, and connected nodes indicate devices that encountered each other at some point. We note that the scanner (i.e. Cityware node) is not represented in this graph. By visual inspection we can verify that most devices are linked to the main core, whilst some devices are islands. The latter indicates cases where a device has never encountered any other device. Additionally, the size of nodes represents the total amount of time that a device has spend in this location, while the colour of the nodes (blue to red) indicates the betweenness of a node (from 0 to 1 respectively).
Figure 3. A graph visualisation of the encounters that we recorded by one Cityware node.
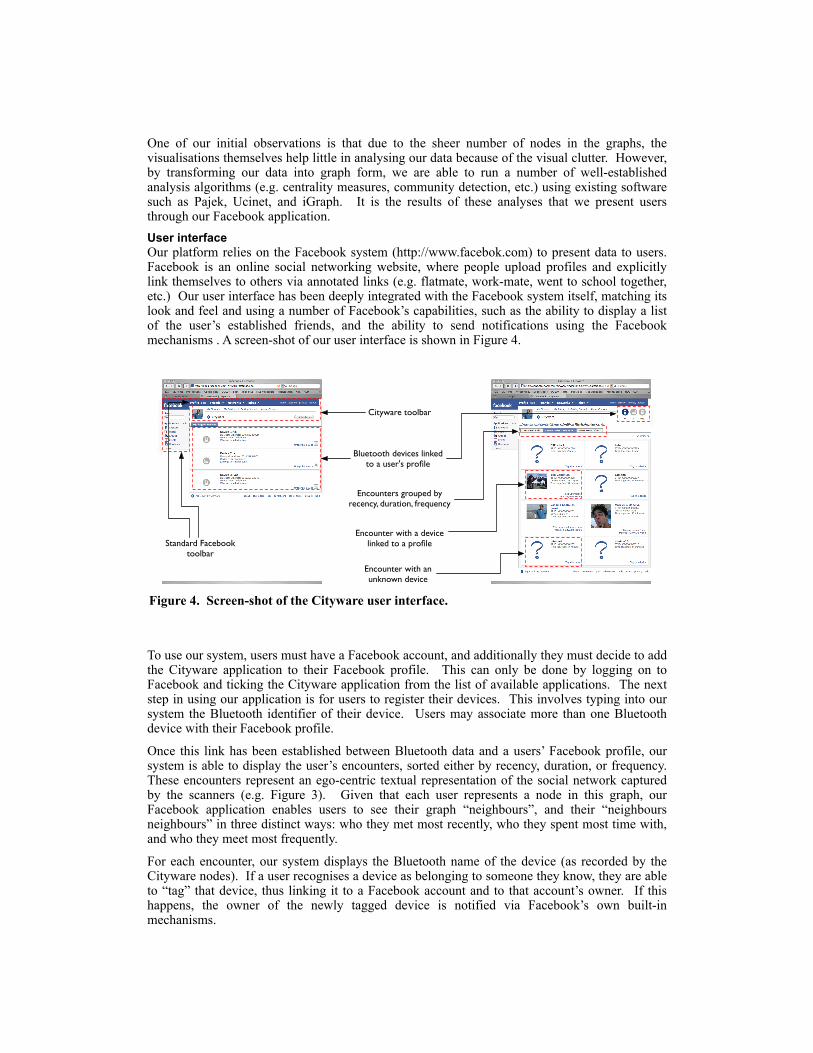
One of our initial observations is that due to the sheer number of nodes in the graphs, the visualisations themselves help little in analysing our data because of the visual clutter. However, by transforming our data into graph form, we are able to run a number of well-established analysis algorithms (e.g. centrality measures, community detection, etc.) using existing software such as Pajek, Ucinet, and iGraph. It is the results of these analyses that we present users through our Facebook application.User interfaceOur platform relies on the Facebook system (http://www.facebok.com) to present data to users. Facebook is an online social networking website, where people upload profiles and explicitly link themselves to others via annotated links (e.g. flatmate, work-mate, went to school together, etc.) Our user interface has been deeply integrated with the Facebook system itself, matching its look and feel and using a number of Facebook’s capabilities, such as the ability to display a list of the user’s established friends, and the ability to send notifications using the Facebook mechanisms . A screen-shot of our user interface is shown in Figure 4.
To use our system, users must have a Facebook account, and additionally they must decide to add the Cityware application to their Facebook profile. This can only be done by logging on to Facebook and ticking the Cityware application from the list of available applications. The next step in using our application is for users to register their devices. This involves typing into our system the Bluetooth identifier of their device. Users may associate more than one Bluetooth device with their Facebook profile.
Once this link has been established between Bluetooth data and a users’ Facebook profile, our system is able to display the user’s encounters, sorted either by recency, duration, or frequency. These encounters represent an ego-centric textual representation of the social network captured by the scanners (e.g. Figure 3). Given that each user represents a node in this graph, our Facebook application enables users to see their graph “neighbours”, and their “neighbours neighbours” in three distinct ways: who they met most recently, who they spent most time with, and who they meet most frequently.
For each encounter, our system displays the Bluetooth name of the device (as recorded by the Cityware nodes). If a user recognises a device as belonging to someone they know, they are able to “tag” that device, thus linking it to a Facebook account and to that account’s owner. If this happens, the owner of the newly tagged device is notified via Facebook’s own built-in mechanisms.
Standard Facebooktoolbar
Cityware toolbar
Bluetooth devices linkedto a user's profile
Encounters grouped byrecency, duration, frequency
Encounter with an unknown device
Encounter with a device linked to a profile
Figure 4. Screen-shot of the Cityware user interface.
The end result is that users are presented with a list of encounters that have taken place in the real world, with some of those encountered devices being linked to Facebook profiles. For such devices our system can display the owner’s picture as a well as link to that person’s profile.
Our platform’s distinctive characteristic is that it provides information that both end-users and researchers can use. This is because end-users see and explore data that is directly related to them (i.e. who they meet, and related statistics), while researchers have access to the “big picture”, thus being able to explore and understand aggregated behaviour. Additionally, the self-registration and tagging mechanisms provide the crucial links between online and real-world networks. Effectively, our system enables users to annotate our dataset, thus enriching it with all the information that users make available via their Facebook profiles.USER FEEDBACKFacebook has its own built-in discussion board mechanisms to facilitate public and private conversations. These are accessible only by logging on to Facebook. These mechanisms have proven to be invaluable for collecting and categorising user feedback. A community has begun to form around our platform, with members using the discussion board to help other users with technical difficulties, suggesting design ideas, and holding debates. The size of this community is about 4000 people, including those who are running Cityware nodes and those who have added the Cityware application.
Prominent amongst the discussion topics is troubleshooting. Many users have posted questions in relation to the node software installation, making sure the software runs constantly, how bluetooth works, as well as how Cityware works. Fellow users have responded to these queries, suggesting that a peer-support community is being formed around Cityware.
While Cityware was officially released in late July 2007, it was not until mid-August that it became widely popular, mostly due to a web article published by the BBC (Waters, 2007). Since then, we have observed an interesting phenomenon amongst users of Cityware. As if feeling somehow “connected” or part of the same social group, our users are eager in establishing new nodes all over the world. A big part of the online discussion evolves around users proudly stating that they have established “yet another node”, thus making their town or city part of Cityware. Additionally, users are eagerly posting messages requesting to know if there are any nodes near where they live. This enthusiasm is not different from what has been observed in other recent social phenomena (c.f. Rheingold, 2002).
A further interesting aspect of the feedback we have collected has to do with the context in which users are setting up nodes. While some users have reported establishing nodes in their homes, others have done so in their workplaces. Furthermore, some users of our application own shops and establishments (such as nighclubs) in which they have installed Cityware nodes. A feature that was heavily requested by users was the use of a map to visually locate Cityware nodes. Since we had not developed such functionality, we instructed users to mark their nodes on the public website http://www.wikimapia.com. This enables users all over the world to locate, as well as mark, Cityware nodes, post comments about them, or even attach pictures.
Privacy is a much-debated topic amongst users of Cityware. While some users are being critical of Cityware’s privacy implications, many are supportive. We should note that the discussion board is not public, but rather only for self-selected users of Cityware, and as such may not be representative of the general public. Certain users have expressed concern about people being tracked about a city, and having their preferences and routines being inferred by a malicious party. In response, other users commented that anyone can at any time opt-out of Cityware by switching Bluetooth to “invisible”. Additionally, it was highlighted that authorities can track people who simply own a mobile phone, regardless of Cityware. Furthermore, users commented that location is not being made available by our system, but nevertheless could be inferred. Another user noted that people are already disclosing information about themselves via their Facebook profile, and that Cityware can expose only that information. A good synopsis was offered by a user who wrote: “There are two groups of people here – one group that willingly submits to this, and the other group, that are totally opposed to any tracking/recording.” This comment very well reflects our understanding of user’s reactions towards our system. We feel
that the reactions are mixed, with some feeling very positive and others very negative towards our systems, but no consensus having been reached at the moment.RESEARCH POTENTIALWhile end users of Cityware are enjoying the functionality of our system, we are quite interested in the research possibilities that our platform has enabled. To quickly summarise some properties of our system as of late 2008: 3000 people have added Cityware to their Facebook profile, 450 nodes have been registered, while roughly 100,000 unique Bluetooth devices have been recorded by all Cityware nodes over a period of 4 months.
The dataset being collected by Cityware nodes is extremely rich as it describes people’s visiting and encounter patterns across space and time. While comparable datasets, such as the Crawdad project (Crawdad, 2007), are available to the scientific community, it is only when such quantitative data can be linked to qualitative data that interesting research possibilities open up. While Cityware collects large amounts of quantitative data on people’s movement and encounters, it also has access to the extremely rich qualitative data that people make available through their Facebook profiles.
Typically, Facebook users provide a wealth of information on their profile, including their demographics and preferences. More crucially, however, users annotate their relationships with people they know. Friends can be marked, for example, as colleagues, house-mates, or relatives. Additionally, a relationship can be annotated with dates, locations or organisations that may be relevant.
By combining the wealth of user-supplied qualitative data with the large amounts of quantitative data collected by Cityware nodes, we can begin to explore new research approaches to social metrics, system design, security, and even epidemiology. The logical next step for our research would be to compare people’s movement and encounters with the qualitative data provided by users. For example, we can begin to empirically understand how people spend their time: with friends, family, or colleagues? Do these patterns change over time, seasons, or countries? Additionally, we want to explore if “friendship”, “house-mate”, or any other type of relationship systematically manifests the same Bluetooth patterns. This would lead the way for developing context-aware systems that can automatically classify a user’s social network into friends, colleagues, etc.
Furthermore, such systems can make use of increased amounts of implicit, rather than explicit user input, which can enable them to adapt their behaviour appropriately and in certain cases understand and predict user needs. Hence, another area we are exploring related to making use of such data to make predictions about the users’ behaviour, and accordingly adapt any software they may be using. At the moment we have distributed node software that runs on mobile phones. This software could act upon predictions about user behaviour and adapt any of the phone’s functionality. Crucially, user feedback about the validity of predictions can easily be related back to our servers for further analysis.
A further research strategy is to explore the usefulness of our system for enhancing the security and privacy of users. We can conceptualise our dataset as a world map of relationships between users, annotated by users. This map may be used to inform users of security-related decisions they face (such as making a wireless payment) when entering a new context, such as a restaurant in a city they are visiting for the first time. Our servers can identify user comments about such a place, but more importantly assign weight to such comments based on the user’s “social proximity” to the authors of these comment.
Finally, the data collected by Cityware is an invaluable source for understanding how mobility and encounter patterns can help in the diffusion of ideas, innovations and viruses (Kostakos et al., 2007). This could be achieved by exploring aggregate diffusion patterns over time, and exploring how different types of information (e.g 1Kb vs 1Mb) or viruses (biological / digital) would spread through the network of encounters and people. We note that this data is a result of public observation, hence we argue that the data can be readily used by the observers. Thus, local or national governments can use such data to develop and evaluate immunisation strategies
to combat biological viruses. Similarly, telecoms operators and handset manufacturers can assess the effectiveness of their infrastructure against digital viruses that can spread via the internet, GPRS, SMS/MMS, and Bluetooth. CONCLUSION AND ONGOING WORKIn this paper we have described the Cityware platform, how users have reacted to it, and the potential for research strategies that it has enabled. As part of our ongoing work we are developing visualisations that both end users and researchers can utilise for better understanding the various patterns and properties of our dataset. We are also considering the development of software that will allow users to automatically geo-tag their data if they have a compatible GPS receiver. Furthermore, we are in the process of correlating aggregate encounter patterns with user-specified properties of those encounters. Finally we are examining the potential viral spread through users’ encounters, and relating viral spread to user-specified qualitative data.REFERENCESBarabási, A.L., Albert, R. (1999). Emergence of scaling in random networks. Science, 286, 509-512.Booher, J. M., Chennupati, B., Onesti, N. S., and Royer, D. P. (2007). Facebook ride connect. CHI 2007 Extended Abstracts, ACM Press, New York, NY, 2043-2048.Bott E. (1957). Family and Social Network. Roles, Norms and External Relationships in Ordinary Urban Families. London, Tavistock Publishers.Biggs, N., Lloyd, E. and Wilson, R. (1986). Graph Theory 1736-1936. Oxford University Press.Crawdad project. http://crawdad.cs.dartmouth.edu. Last access 22 August 2007.Foth, M. (2006). Facilitating Social Networking in Inner-City Neighborhoods. Computer 39, 9 (Sep. 2006), 44-50.Freeman, L. (2004). The Development of Social Network Analysis: A Study in the Sociology of Science. Vancouver, BC, Canada: Empirical Press.Gluckman, M. & Aronoff, M. J. (1976). Freedom and constraint : a memorial tribute to Max Gluckman. Assen: Van Gorcum.Granovetter, M. (1973). The strength of weak ties. American Journal of Sociology, 78(6), 1360-1380.Herrmann, T., Kunau, G., Loser, K., and Menold, N. 2004. Socio-technical walkthrough: designing technology along work processes. Proc. Conference on Participatory Design (PDC), ACM, New York, NY, 132-141.Kostakos, V. and O’Neill, E. (2007). Quantifying the effects of space on encounter. Proc. Space Syntax Symposium 2007, Istanbul, pp. 9701-9709.Kostakos, V., O'Neill, E., and Penn, A. (2006). Designing Urban Pervasive Systems. Computer 39, 9 (Sep. 2006), 52-59.Kostakos, V., O’Neill, E., Penn, A. (2007). Brief encounter networks. arXiv:0709.0223Lampe, C. A., Ellison, N., and Steinfield, C. (2007). A familiar face(book): profile elements as signals in an online social network. Proc. SIGCHI Conference on Human Factors in Computing Systems (CHI), ACM Press, New York, NY, 435-444.Lee, K. M. and Nass, C. 2003. Designing social presence of social actors in human computer interaction. Proc. SIGCHI Conference on Human Factors in Computing Systems (CHI), ACM, New York, NY, 289-296.Millen, D. R. and Patterson, J. F. (2002). Stimulating social engagement in a community network. Proc. Conference on Computer Supported Cooperative Work (CSCW), ACM, New York, NY, 306-313.Nicolai T., Yoneki E., Behrens N., Kenn H., (2005). Exploring Social Context with the Wireless Rope. LNCS, 4277:874-883.
O’Neill, E., Kostakos, V., Kindberg, T., Fatah gen. Schiek, A., Penn, A., Stanton Fraser, D. and Jones, T. (2006). Instrumenting the city: developing methods for observing and understanding the digital cityscape. Proc. Ubicomp 2006, 315-332.Rheingold, H. (2002). Smart Mobs: The Next Social Revolution. Cambridge, MA: Perseus.Riegelsberger, J. and Vasalou, A. (2007). Trust 2.1: advancing the trust debate. Proc. SIGCHI Conference on Human Factors in Computing Systems (CHI),Extended Abstracts, ACM Press, New York, NY, 2137-2140.Waters, D. (2007). Bluetooth helps Facebook friends. BBC, http://news.bbc.co.uk/2/hi/technology/6949473.stm (Last access 22 Auust 2007).Watts, D.J., Strogatz, S.H. (1998) Collective dynamics of small-world networks. Nature, 393, 440.
KEY TERMS AND DEFINITIONS
Social network: A structure that represents social relationships. The strutter typically consists of nodes and links between the nodes, and the nodes represent people while the links represent a specific type of relationship such as friendship, marriage, or financial relationship.
Urban computing: A research field focused on the development of computer systems that are to be used in urban space. Typically, such systems entail fixed, mobile and embedded components.
Massively distributed system: A real-time computer system with large numbers of physical and logical components spanning great geographic distances.
Bluetooth identifier: A unique 12-digit hexadecimal number used by Bluetooth components for identification.
Aggregate patterns of [behaviour/encounter/diffusion]: On an individual level each person behaves in distinct and unique ways, having specific objectives in mind. Yet, when analysed at an aggregate level, communities and cities exhibit non-random patterns that emerge from the combination of each distinct person’s activities. Such patterns are known as aggregate patterns, and can describe how people encounter each other, or how information is diffused and spread through the community.
Vassilis Kostakos is an Assistant Professor at the Department of Mathematics & Engineering, University of Madeira, and an Adjust Assistant professor at the HCI Institute, Carnegie Mellon University. He previously was appointed Research Associate at the Department of Computer Science, University of Bath. His research interests include mobile and pervasive computing, complex and social networks, security and privacy. Kostakos received a PhD in Computer Science from the University of Bath.
Eamonn O’Neill is a senior lecturer and director of postgraduate research studies in the Department of Computer Science at the University of Bath. His research interests include mobile and pervasive computing, participatory design, and technological support for creativity. O’Neill received a PhD in Computer Science from the University of London.