city san diego epa raa workshop 9-23-15 · raa data used in asset management • watershed asset...
TRANSCRIPT

The City of San Diego’s Perspectives on The City of San Diego s Perspectives on Reasonable Assurance Analysis
September 23, 2015
Drew KleisDeputy DirectorStorm Water DivisionStorm Water Division

Agenda
• The bottom line: It’s worth it!
• City of San Diego background & drivers
• City’s RAA experience
• RAA’s use in subsequent efforts:q▪ Asset management▪ Implementation projectsImplementation projects▪ Watershed master planning
• Lessons learned• Lessons learned
2

City of San Diego’s Drivers
• Regulatory Drivers:▪ New Storm Water Permit requiring outcome-based plans
B t i TMDL▪ Bacteria TMDL
▪ Dissolved Metals TMDLs
▪ Sediment TMDL▪ Sediment TMDL
• Need to strengthen linkage between budget and levels of service
N d t k h t h d h t i l t• Need to know what, where and when to implement
• Need to communicate funding and schedule needs
3

City of San Diego’s RAA Background
Use of RAA in the City of San Diego:Use of RAA in the City of San Diego:
• 2011-12 TMDL compliance plans (CLRPs)
2013 1 Q Q• 2013-15 Water Quality Improvement Plans (WQIPs)
Technical Approach:
• Watershed model as baseline
• BMP selection optimized using City’s pilot study data
• Accounted for non structural activities• Accounted for non-structural activities
• Detailed timelines and cost estimates
4

Outcomes of the RAA
• Calibrated to compliance
R lt i d t th • Results summarized at the subwatershed-level
80 d fi d BMP ti• 80+ defined BMP assumptions
• Macro-level scheduling
5

Outcomes of the RAA
Macro-level cost estimates:
• Unit costs by activity type
• Phased planning, design, construction costsp g, g ,
6
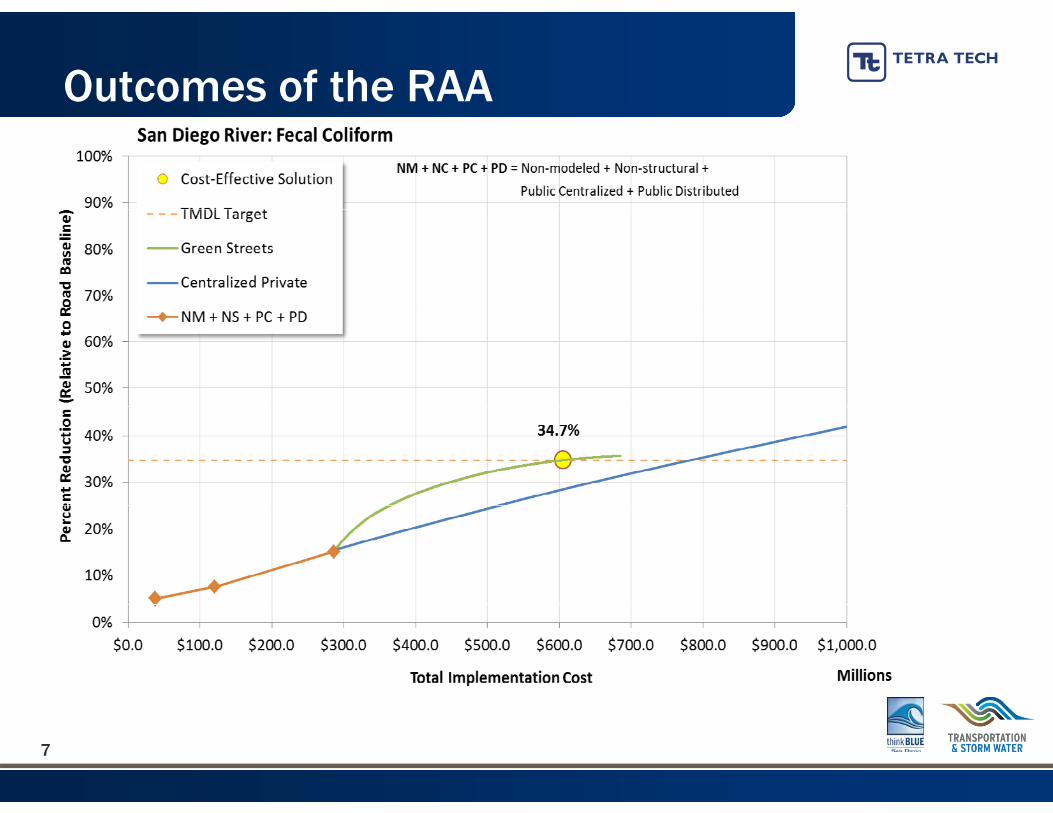
Outcomes of the RAA
7

Outcomes of the RAAPrimary Scenario (All Watershed)
$ Milli
Alternative Scenario (MS4 Only)$ Milli
Cost Savings$ Millions$ Millions $ Millions $
$1,107 $743 $364 (33%)
• Analyzed loading and costs to treat “Non-MS4” areas
• Basis for policy recommendations in WQIPs
8

How Can it be Used?
• Compliance assurance
• Long Range PlanningCompliance RAA Planning
• Budget requests• Initial info for
PlanRAAInitial info for Implementation
9

How Else Can it be Used?
• Integrate flood & li tAsset compliance costs
• Additional prioritization
Asset Management
RAA • Project integrationL i BMP
Watershed RAA • Locating BMPs• Site‐level detail
Master Planning
• TMDL SchedulesRegulations• Other?
Regulations Development
10

RAA Data Used in Asset Management
• Watershed Asset Management Plan in 2013BMP h d l i f dd d di l i • BMP type, cost, schedule info added directly into asset database
• RAA data used in risk-based prioritization of flood control and RAA data used in risk based prioritization of flood control and water quality needs
$300,000,000
$200,000,000
$250,000,000
$100,000,000
$150,000,000
$‐
$50,000,000
2016
2017
2018
2019
2020
2021
2022
2023
2024
2025
2026
2027
2028
2029
2030
2031
2032
2033
2034
2035
2036
2037
2038
2039
2040
11
2 2 2 2 2 2 2 2 2 2 2 2 2 2 2 2 2 2 2 2 2 2 2 2 2
WQIP JRMP Flood Risk Management

The Role of a Watershed Master Plan
• Purpose: Transition Long-Range compliance plans to Range compliance plans to implementation
• Specific street-level projects • Specific, street level projects and schedules
• RAA data needed to set • RAA data needed to set targets in each sub-watershed
12

What Does a Watershed Master Plan Look Like?
13

What Does a Watershed Master Plan Look Like?Example ApplicationRank Project WQ
Efficiency (lb/$)WQ
Effectiveness (lb/yr)1 MUTA-1 1 0 7
2 NS-1 9 2
3 GS 1
Rank Project WQEfficiency (lb/$)
WQEffectiveness (lb/yr)
Private Parcel Incentive Program
1 MUTA-1 1 0 7 0
2 NS-1 9 2 0
3 GS 1
Rank Project WQEfficiency (lb/$)
WQEffectiveness (lb/yr)
Private Parcel Incentive Program
Integrated Water Rating
1 MUTA-1 1 0 7 0 1
2 NS-1 9 2 0 0
3 GS 1
Rank Project WQEfficiency (lb/$)
WQEffectiveness (lb/yr)
Private Parcel Incentive Program
Integrated Water Rating
Trash CaptureRating
1 MUTA-1 1 0 7 0 1 6
2 NS-1 9 2 0 0 1 0
3 GS 1
Rank Project WQEfficiency (lb/$)
WQEffectiveness (lb/yr)
Private Parcel Incentive Program
Integrated Water Rating
Trash CaptureRating
CoordinationRating
1 MUTA-1 1 0 7 0 1 6 1
2 NS-1 9 2 0 0 1 0 0
3 GS 13 GS-1 9 9
4 GS-2 3 4
3 GS-1 9 9 0
4 GS-2 3 4 0
5 PR-1 6 1 0 1 0
3 GS-1 9 9 0 9
4 GS-2 3 4 0 1
5 PR-1 6 1 0 1 0 7
3 GS-1 9 9 0 9 5
4 GS-2 3 4 0 1 2
5 PR-1 6 1 0 1 0 7 2
3 GS-1 9 9 0 9 5 1 0
4 GS-2 3 4 0 1 2 1 0
5 PR-1 6 1 0 1 0 7 2
GREEN STREET
LID AND REGIONAL
NONSTRUCTURAL
WATER QUALITY RATING
PRIVATE PARCELS
CHANNEL REHAB
ROAD CIPROAD CIP
REGIONAL SEWER
1414

Lessons Learned
•Determine how you will use the RAA at outset•Determine how you will use the RAA at outset▪Compliance▪Asset Management▪Detailed CIP planning… Watershed Master Plan
•Involve watershed Copermittees
Q ifi i O i i i•Quantification vs. Optimization▪RAA excels at quantifying activities▪Need pilot project (efficiency) data to optimize
15

Lessons Learned
•Consider reporting costs in plans•Consider reporting costs in plans
•Consider analyzing & reporting costs of:▪ “Non-MS4” areas ▪Regulatory modificationsRegulatory modifications
•RAA (and asset management) can help justify h d l i TMDLschedules in TMDLs
16