city richmond · august 2, 2019 7) housing starts7 2017 ~-q4 lok 9k sk 7k .. 6k :1 iii > sk 4k...
TRANSCRIPT
City of Richmond
Report to Committee
To: Finance Committee Date:
From: Jerry Chong File: Director, Finance
Re: Financial Information- 2"d Quarter June 30, 2019
Staff Recommendation
August 2, 2019
03-09 7 0-09-0 1 /2 0 19-Vol 01
That the staff report titled, "Financial Information - 2"d Quarter June 30, 20 19", dated August 2, 2019 from the Director, Finance be received for information.
,/J/0 J' ~
Jerry Chong, CPA, CA Director, Finance (604-276-4064)
Att: 5
ROUTED To: Arts, Culture & Heritage Building Approvals Community Bylaws Community Social Development Development Applications Economic Development Engineering Fire Rescue Facilities Information Technology Parks Services Public Works RCMP Recreation Services Transportation Library Services
REVIEWED BY STAFF REPORT I AGENDA REVIEW SUBCOMMITTEE
6245887
REPORT CONCURRENCE
CONCURRENCE
0 g g 1M ~ g g'
&' g 10" g'
0 lilf g Gt !;21
INITIALS:
CONCURRENCE OF GENERAL MANAGER
FIN - 7

August 2, 2019 - 2-
Origin
Pre-audited financial information for the 2nd quarter ended June 30, 2019 is being provided to the Finance Committee for review. The report provides details on the economic environment, financial results and other key indicator infmmation. The financial infmmation provides Council with an overview of the City's financial results throughout the year and before the annual audited financial statements are presented.
This report supports Council's Strategic Plan 2018-2022 Strategic Focus Area #5 Sound Financial Management and #8 An Engaged and Informed Community:
5.1 Maintain a strong and robust financial position.
5.2 Clear accountability through transparent budgeting practices and effective public communication.
8. 2 Ensure citizens are well-informed with timely, accurate and easily accessible communication using a variety of methods and tools.
Analysis
Macroeconomic Indicators & Forecast
1) Global Growth- Real Gross Domestic Product (GDP)% Change1
10.0
9.0
8.0
7.0
6.0
5.0
4.0
3.0
2.0
1.0
0.0 2011 2012 2013 2014 2015 2016 2017 2018 2019f 2020f - Canada -Un~ed States - China -Wo~d
1 International Mane/my Fund, World Economic Outlook (July 2019)
6245887
• In 2019, the International Monetary Fund (IMF) projects the pace of global growth to slow down as policy uncertainty begins to impact the world's economy.
• The global growth in GDP was 3.6% in 2018 and is expected to be 3.2% in 2019 and 3.5% in 2020.
• In Canada, the GDP growth forecast is unchanged this quarter, at 1.5% for 2019 and 1.9% for 2020. The U.S. economy is forecasted to grow by 2.6% in 2019 and 1.9% in 2020.
• GDP growth for China is forecasted at 6.2% and 6.0% in 2019 and 2020, respectively.
FIN - 8

August 2, 2019 - 3 -
2) Interest Rates- US and Canadian Overnight Central Bank Rate% at Year-End2
3.00
2.50
2.00
1.50
1.00
0.50 0.00 c__ ______________ _
2011 2012 2013 2014 2015 2016 2017 2018 20191 20201 - US FED - Canada BOC
3) Exchange Rates - CADIUSD at Year-End3
1.45
1.35
1.25
1.15
1.05
0.95
0.85
2011 2012 2013 2014 2015 2016 2017 2018 20191 20201 - CAD per $1 USO
• After experiencing three upward adjustments totaling 0.75 percentage points in 2018, the Bank of Canada' s (BoC) overnight rate remained at 1.75% in Q2 2019 amidst slowing global growth and rising trade tensions.
• Canada' s overnight rate is forecasted at 1.75% in 2019 and 2020.
• The same factors caused the U.S. Federal Reserve (US FED) to hold its shmi-term rate steady at 2.50% throughout the first half of2019. On July 31 , 2019, the US FED announced an interest rate cut of 0.25% to 2.25%.
• The Canadian dollar ended Q2 2019 at $1.34 CAD per $1 USD.
• The forecasted USD/CAD exchange rates for 2019 and 2020 are $1.35 CAD per $1 USD and $1.37 CAD per $1 USD, respectively.
2 US Federal Reserve, Bank of Canada and Royal Bank Economic Research Forecast (June 2019)
3 Royal Bank Economic Research Forecast (June 2019)
6245887 FIN - 9
August 2, 2019 - 4 -
Regional & Local Economic Activity Indicators
4) Unemployment4
7.5
6.5
5.5
4.5
Q2-17 Q4-17 Q2-18 Q4-18 Q2-19
- Canada - BC - MetroVancouver
5) Consumer Price Index (CPI - 2002=100)5
140
135
130
125
120
115 ·-··---··-··-······-··-··-······-······-··-··-··-··--··-··-··-·--··-··-······-----··-----·---·---· 04-16 02-17 04-17 02-18 04-18 02-19
- Canada - BC - Metro Vancouver
4 Statistics Canada
5 Statistics Canada
6245887
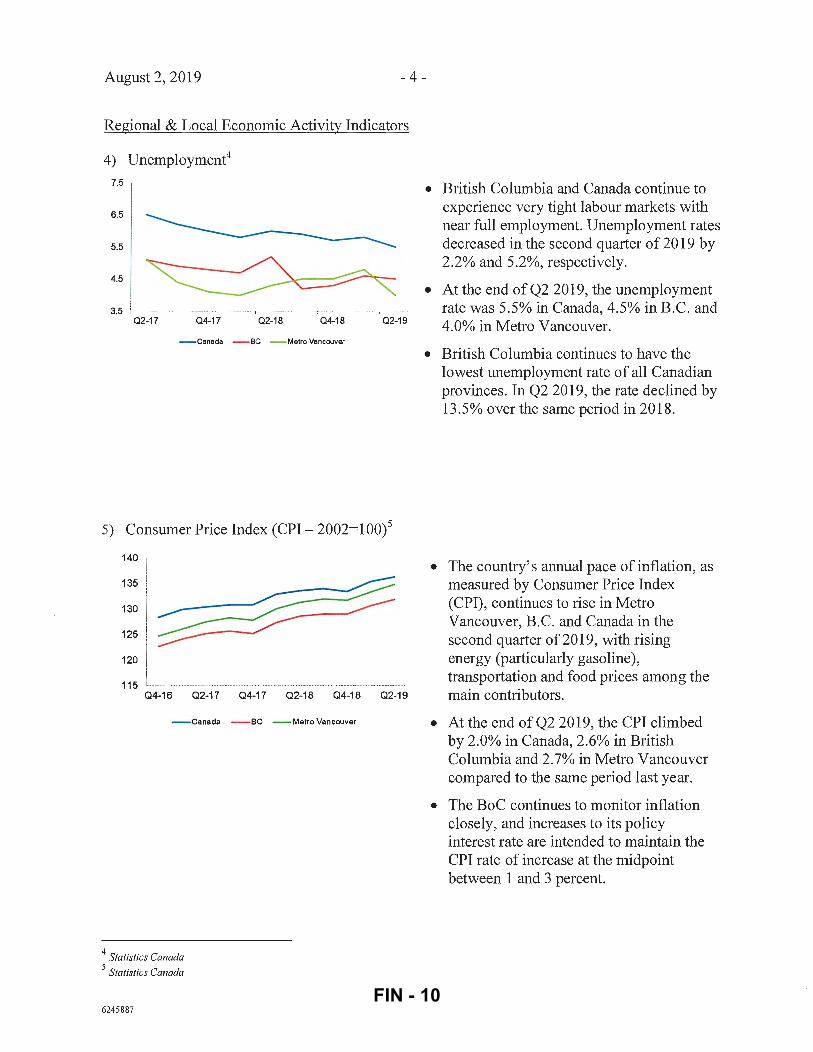
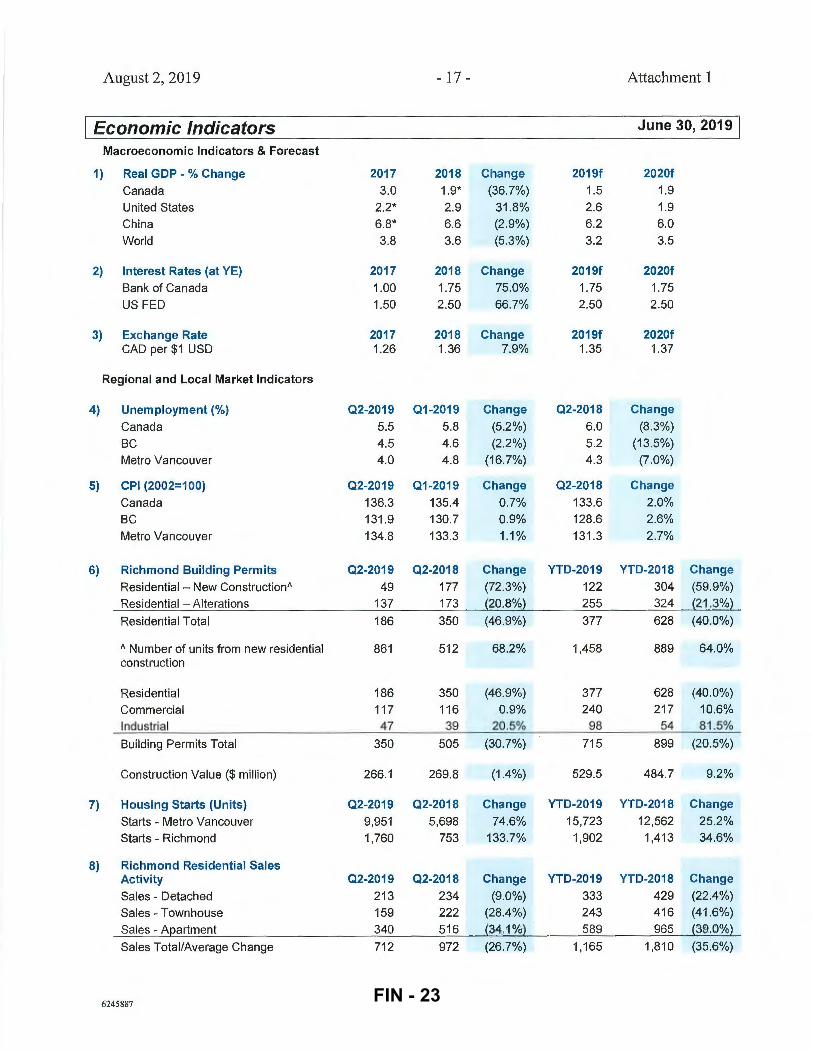
• British Columbia and Canada continue to experience very tight labour markets with near full employment. Unemployment rates decreased in the second qumier of 2019 by 2.2% and 5.2%, respectively.
• At the end ofQ2 2019, the unemployment rate was 5.5% in Canada, 4.5% in B.C. and 4.0% in Metro Vancouver.
• British Columbia continues to have the lowest unemployment rate of all Canadian provinces. In Q2 2019, the rate declined by 13.5% over the same period in 2018.
• The country' s annual pace of inflation, as measured by Consumer Price Index (CPI), continues to rise in Metro Vancouver, B.C. and Canada in the second quarter of2019, with rising energy (particularly gasoline), transpmiation and food prices among the main contributors.
• At the end ofQ2 2019, the CPI climbed by 2.0% in Canada, 2.6% in British Columbia and 2.7% in Metro Vancouver compared to the same period last year.
• The BoC continues to monitor inflation closely, and increases to its policy interest rate are intended to maintain the CPI rate of increase at the midpoint between 1 and 3 percent.
FIN - 10

August 2, 2019 - 5 -
6) Building Permits - Richmond6
Richmond Building Permits Issued P• rmliTyp•
2017 2018 2019 • ""'~~"'' --···--=-=~=--------+---=-"'-"~---! • ComtnOI'ci:ll
. lndus!riDJ
Q3 Q4 Q1 Q2 Q3 Q4 Ql Q2
• In Q2 2019, there were 186 residential, 117 commercial, and 4 7 industrial building permits issued in Richmond.
• The 186 residential building permits issued consist of 49 permits for new residential construction and 13 7 permits for residential alterations.
• While the total number of residential building permits issued throughout the first half of 2019 decreased by 60% compared to the first six months of2018, the total number of units increased by 64% which indicates a larger proportion of multifamily developments.
• During the first six months of 2019, building permits were issued to construct 1,458 residential units compared to 889 units in the same period of2018.
• Commercial building permits increased by 11% and industrial petmits increased by 82% over the same period last year.
L[ _____________ __:_::RI=ch=m=o=n-=-d --=-Co=-=-n=st::.:..ru=c=tlo=n'--'V:..::ac:.::lu=e ------_-·-_---___,"] • The total value of construction activity in
... ~.c.cc.-......... ... j· ................................... 2.0.1.~ ... .
Q3 Q4 Ql Q2 Q3 Q4 Ql Q2
6 City of Richmond Building Permits
6245887
the first half of2019 totaled $530 million .
• During the first six months of2019, the total value of construction activity increased by 9.2% over the same period last year. Large multi-family developments, as well as increased construction and labour costs, contributed to this increase.
FIN - 11

August 2, 2019
7) Housing Starts7
2017
~ - Q4
lOK
9K
SK
7K
6K .. :1 iii SK >
4K
3K
2K
lK
OK -
7 Canada Mortgage and Housing Corporation
- 6 -
• In Q2 2019, there were 1,760 housing starts in Richmond and 9,951 in Metro Vancouver, as measured by the Canada Mortgage and Housing Corporation (CMHC) and based on a verification that construction work has commenced8
.
• Over the first six months of 2019, the total number of housing starts increased by 35% in Richmond and 25% in Metro Vancouver compared to the same period in 2018 .
• While home-ownership demand has slowed with recent policy measures, current project statis reflect projects pre-sold in previous years when the market was significantly stronger.
• The increase in CHMC's housing start data for Richmond in Q2 2019 does not directly compare to the change in residential building permits issued by the City. This is mainly due to the varying timing between issuing a residential building pe1mit and determining a housing start.
8 Housing Start is defined as the beginning of construction work on a building, generally when the concrete has been poured for the whole of the
f ooting around the structure, or an equivalent stage where a basement will not be part of the structure.
6245887 FIN - 12
August 2, 2019 - 7 -
8) Commercial Space9
a) Industrial Space
Industrial Space Inventory ('000 SF) • Metro Vaneouver
---,....-!-- = ---\-----===------+----==------l • Richmond
Industrial Space Vacancy {!J6}
Q3·17 Q4-17 Ql-18 Q2-18 Q3-18 Q4-18 Ql-19 Q2-19
b) Office Space
Office Space Inventory ('000 SF) • Metro vencouver • Rkhmond
Office Space Vacancy(%)
10J --
1! : ~ ~ 41
i 2 ~
i 0 j Q3-17 Q4-17 Ql-18 Q2-18 Q3·18 Q4-18 01·19 Q2·19
9 Cushman & Wakefield Office and Industrial Market Beat Rep orts
6245887
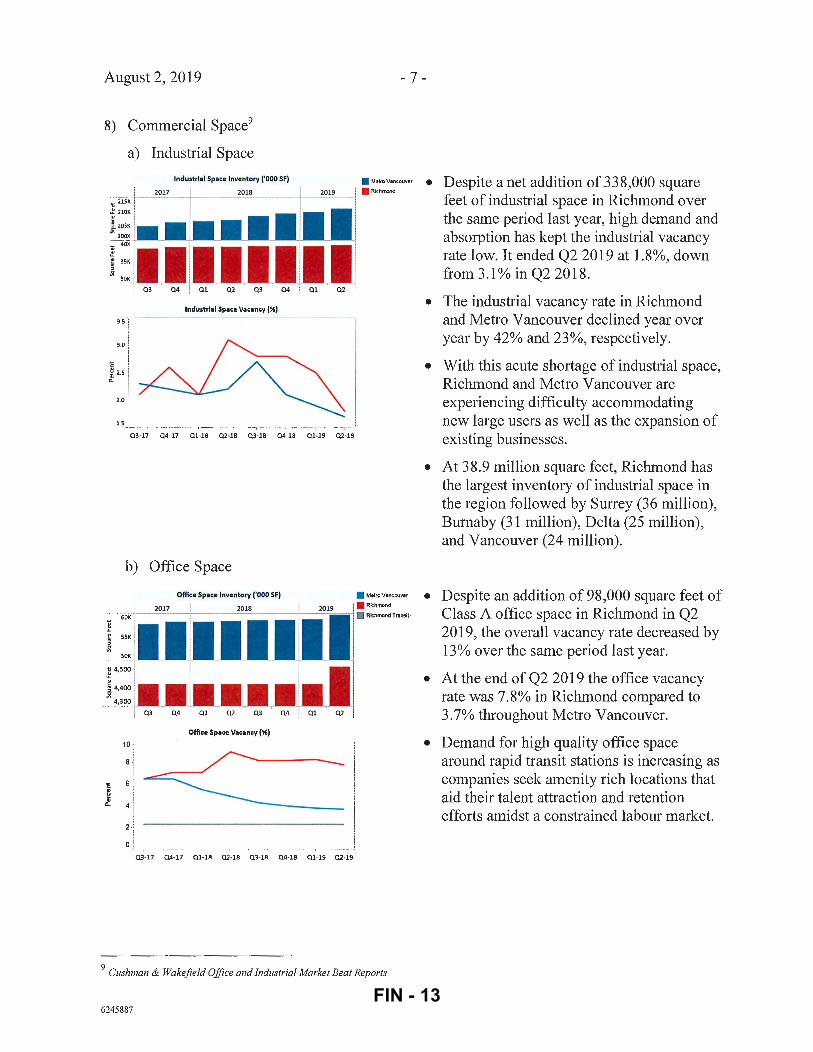
• Despite a net addition of 338,000 square feet of industrial space in Richmond over the same period last year, high demand and absorption has kept the industrial vacancy rate low. It ended Q2 2019 at 1.8%, down from 3.1% in Q2 2018.
• The industrial vacancy rate in Richmond and Metro Vancouver declined year over year by 42% and 23%, respectively.
• With this acute shortage of industrial space, Richmond and Metro Vancouver are experiencing difficulty accommodating new large users as well as the expansion of existing businesses.
• At 38.9 million square feet, Richmond has the largest inventory of industrial space in the region followed by SmTey (36 million), Burnaby (31 million), Delta (25 million), and Vancouver (24 million).
• Despite an addition of 98,000 square feet of Class A office space in Richmond in Q2 2019, the overall vacancy rate decreased by 13% over the same period last year.
• At the end of Q2 2019 the office vacancy rate was 7.8% in Richmond compared to 3. 7% throughout Metro Vancouver.
• Demand for high quality office space around rapid transit stations is increasing as companies seek amenity rich locations that aid their talent attraction and retention effmis amidst a constrained labour market.
FIN - 13

August 2, 2019
9) Business Growth - Richmond
a) New Business Licences
- 8 -
• There were 1,070 new business licences issued in Richmond during the first half of 2019, an increase of9% over the same period in 2018.
• The addition of 3,846 jobs was attributed to these new businesses.
b) New Business Licences- Commercial Space
New Business Licences - Commercial Space Added i~m"'
A'"•'"'---------"'='----f---=~--+! - = '------i • Rol4il
. warohouso
QJ Q4 Ql Q2 QJ Q4 Ql Q2
6245887
• 869,000 square feet of commercial space absorption was related to the new business licences issued throughout the first half of 2019.
• As industrial users typically require more space, 4 7% of total commercial space absorption was attributed to warehousetype industrial space.
• 32% of commercial absorption in the first half of2019 was related to office-based businesses and 21% of commercial space absorption throughout this period was from retail businesses.
FIN - 14

August 2, 2019 - 9 -
1 0) Goods and People Movement
a) Regional Cargo Movement 10
Regional Cargo Movement
2017 2018 2019 Q3 Q4 Q1 Q2 Q3 Q4 Q1
900K
600K
3D OK
! OK • • • '• • • •
b) Airpmi Passengers 11
Airport Passengers
2017 2018
8
-;;;-c § .§.
" "' 0..
"' > >-
8 3 ..... t1 8 Cf
10 Pori of Vancouver Monthly Cargo Statistics
11 YVR Monthly Statistics
6245887
Q2
•
3
Cargo Movom11nl • Air Cargo (Tonnos)
• Port Cont:Jinors (TEU)
2019
..... t1 Cf
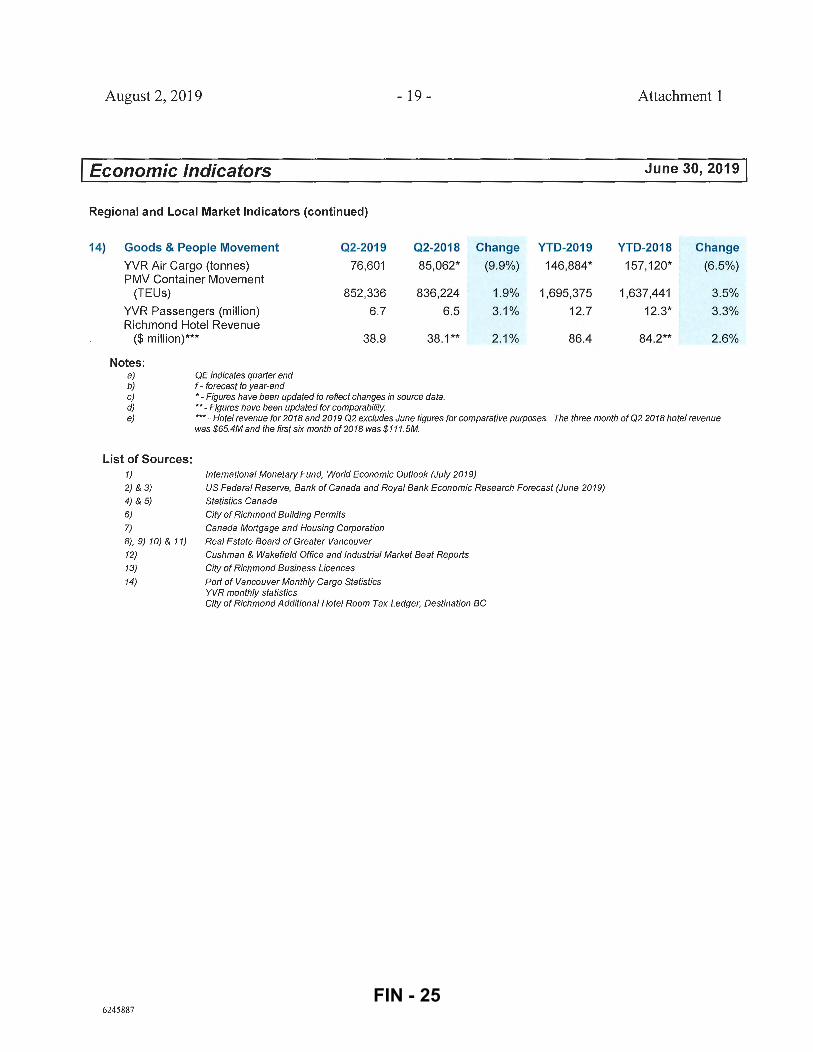
• Data indicators of regional trade activity varied in the first half of2019. While there was an increase in container movements at the Port of Vancouver, the Vancouver International Airport (YVR) experienced a decline in the volume of air cargo it handled.
• In the first half of 2019, there were 1. 7 million Twenty Foot Equivalent Units (TEUs) of container movements at the Pmi of Vancouver, an increase of 3.5% over the same period in 2018.
• At YVR, 147,000 tonnes of air cargo was handled throughout the first six months of 2019, a decrease of 6.5% over the same period last year.
• YVR continued to experience passenger growth. 6.7 million passengers travelled through the airport in Q2 2019, an increase of3.1% over Q2 2018 . The year-to-date passenger traffic also increased by 3.3%.
FIN - 15
August 2, 2019 - 10-
., " c
~ a: E 0 0 a:
c) Richmond Hotel Room Revenue 12
Richmond Hotel Room Revenue
• Q2 data for 2019 include figures from April and May. June figures not yet available.
Residential Real Estate 13
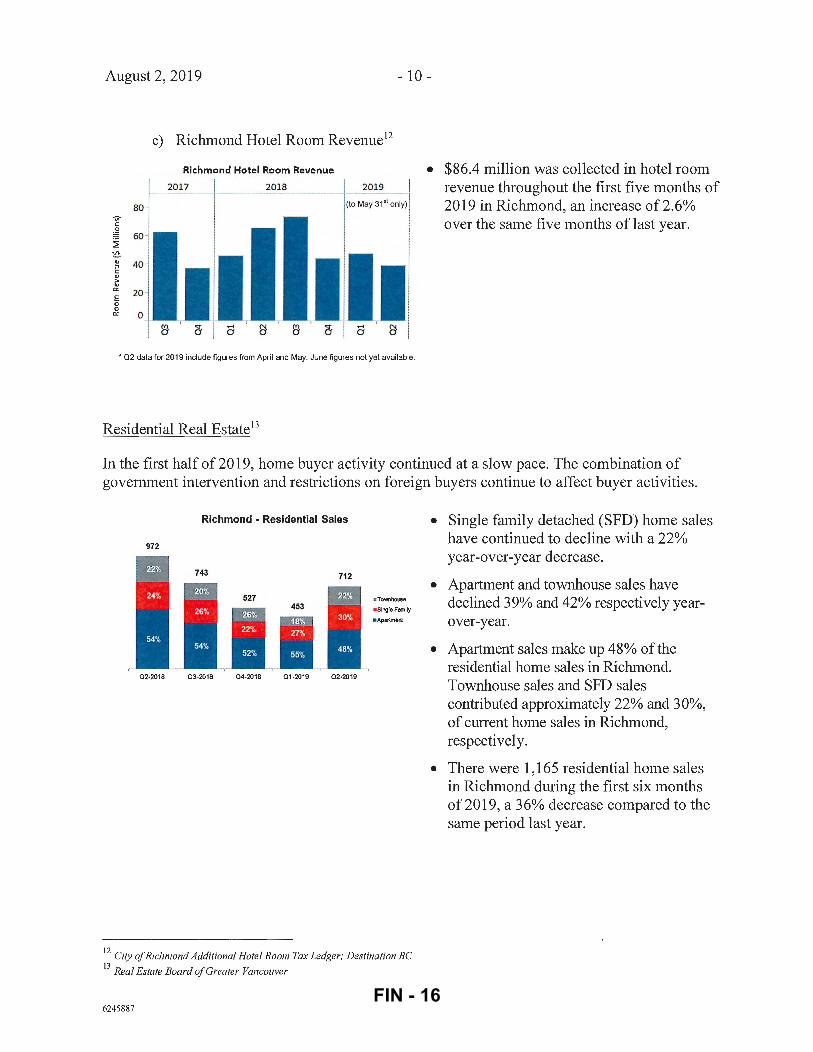
• $86.4 million was collected in hotel room revenue throughout the first five months of 2019 in Richmond, an increase of2.6% over the same five months of last year.
In the first half of2019, home buyer activity continued at a slow pace. The combination of government intervention and restrictions on foreign buyers continue to affect buyer activities.
972
02·2018
Richmond - Residential Sales
03·2018 04·2018 01·2019 02·2019
• Tov..nhouse
• Single F.-rally
• Apartment
12 City of Richmond Additional Hotel Room Tax Ledger; Destination BC
13 Real Estate Board of Greater Vancouver
6245887
• Single family detached (SFD) home sales have continued to decline with a 22% year-over-year decrease.
• Apartment and townhouse sales have declined 39% and 42% respectively yearover-year.
• Apartment sales make up 48% of the residential home sales in Richmond. Townhouse sales and SFD sales contributed approximately 22% and 30%, of cunent home sales in Richmond, respectively.
• There were 1,165 residential home sales in Richmond during the first six months of2019, a 36% decrease compared to the same period last year.
FIN - 16

August 2, 2019 - 11 -
Richmond ·Average Days on Market ro ,-----------------------------
40
30
- srngle FamRy
.- To\'mhouse - Apartment
20
10 r-----------------------------
02-2018 0 3-2018 04-2018 01-2019 02-2019
Greater Vancouver ·Average Days on Market ~ ,------------------------------
50
- single Family 30 ························ -.-Tov.nhouse
20
10 r------------------------------
02-2018 0 3-2018 04-2018 01 -2019 02-2019
Richmond vs. Greater Vancouver Residential Home Price Index (HPJ)
-.-Richmond Sin(le Family
$1,300,000 . ·------·----------------··---·-··---.-Richmond Townhouse
$1,100,000 r--------------------
S900,000 · --··F -· ·· --· ....... .. I • --GreaterVancowerTO'Mlhoose $700,000 ........ il • . ....... ... . .....• . . .... 4 $500,000 --- ····---···-·-·-····-·-·--·----- - RidlmoodApartment
$300,000 r---~--....---..,--------, 02-2018 03-2018 04-2018 01-2019 02-2019 - GrearerVancower Apartment
• At Q2 2019, SFD properties in Richmond had an average of 51 days on the market, an 11% increase compared to Q2 2018. Townhouses and apatiments had an average of 38 and 43 days on the market, respectively, representing a 23% and 87% increase over the same period last year.
• At Q2 2019, SFD propetiies in GVRD had an average of 48 days on the market, which increased by 26% compared to Q2 2018. Both townhouses and apatiments had an average of 34 days on the market, which represent an increase of 48% and 79%, respectively, over the same period in2018.
• Compared to the average at Q2 2018, the residential real estate markets in both Richmond and GVRD are slowing down.
• The Home Price Index (HPI) 14 for SFD propetiies in Richmond is $1 ,484,600 as at June 30,2019, a decrease of 10% compared to the same period last year. The GVRD housing market has also slowed down with SFD properties prices at $1,423,500, which is an 11% decrease compared to Q2 2018.
• The HPI for townhouse propetiies in Richmond is $779,200, a decrease of 8.8% compared to Q2 2018. The HPI for townhouse propetiies in GVRD is $774,700, which represents a 10% decrease compared to the same period last year.
• The HPI for apatiments is $628,500, which decreased by 8. 0% compared to Q2 2018 . The GVRD's apartment prices decreased to $654,700, which is a 7.0% decrease from Q2 2018.
14 Home Price Index is a tool to measure home prices trends in Metro Vancouver and other maj or markets in the country. It is an alternative
measure of real estate prices that provides the market trends over traditional tools such as mean or median average prices.
6245887 FIN - 17

August 2, 2019 - 12-
Gaming Revenue
In accordance with the Host Financial Assistance Agreement with the Province of BC, the Province pays 10% of net gaming income to the City. Net gaming revenue is calculated as net win from casino games less (i) fees payable by BC Lottery Corporation (BCLC) to the service provider and (ii) BCLC's administrative and operating costs. Distributions are subject to volatility due to fluctuations in net winnings from casino games, operating costs and accounting adjustments.
Gaming Revenue by Quarter
$6.0M
$4.0M
$2.0M
• 2017
• 2018
• Gaming revenue for Q2 2019 decreased by 15.7% to $3.70M compared to $4.39M in Q2 2018.
• Q2 2019 increased by 0.1% compared to the previous qumier.
2019 • At the end of Q2 2019, the City received
$0.0M 01 02 03 04
$7.40M or 44.9% ofthe 2019 annual budgeted of $16.5M for gaming revenue.
Since the beginning of2018, River Rock has steadily declined in Table Drop15 revenue as a result ofthe BCLC source of funds procedures 16 enacted in early 2018.
However, the second qumier gaming revenue holds steady compared to the first qumier of the year. This quatier plateaued the declining trend for the first time since the beginning of2018. Year over year comparison of gaming revenue received for the first six months of the year still shows a 15% decrease relative to the same period in 2018.
At the February 11,2019 Council meeting, the 2019 Budget was approved which included the gaming revenue allocation for 2019. The distribution of these funds is detailed in Table 1 with any surplus revenue or shortfall to be adjusted from the Capital Building and Infrastructure Reserve. The distribution is consistent with the 2018 gaming revenue allocation.
Table 1: Distribution of the 2019 gaming revenue allocation
Capital Reserves Grants Council Community Initiatives Account Debt Servicing Operating (RCMP) Capital Building and Infrastructure Reserve
Distribution 2019 Budget 30% $5.0M 15% 2.5M 2% 0.3M
Fixed 5.0M Four Officers 0.7M
Remainder 3.0M Total $16.5M
15 Table drop means the co11ective amount of money customers dep osit to purchase casino chips to wager on table games.
16 Source of fzmds p rocedures requires a11 BC casinos to obtain a bank receipt f or any buy-ins of $10,000 or more over a 24-hourperiod. The
original receipt must be fz·om the same day of the transaction and it must display the financial institution, branch and account number.
6245887 FIN - 18

August 2, 2019 - 13 -
Operating Activity
Table 2 compares budget to unaudited actual activity up to June 30,2019. The net figure represents combined revenue and expense amounts. Actuals includes estimates for revenues earned and expenses incuned to date where invoices may not yet be issued or received.
. . - ' l1. · , ' l
' ' ' I.' ' l I ' I I • :u1 Net operational activity 1
-
Unaudited 2019 results
2019 YTD Variance
2019 YTD Actuals and Variance YTD ($)
Division/Department2 Net Budget Commitments3 YTD(%)
Community Safetl Community Services Corporate Administration Engineering and Public Works Finance and Corporate Services Fire Rescue Library Planning and Development Policing Fiscal
($1 ,312) 22,325
5,532 22,379 13,053 20,250
5,083 2,346
27,236 (90,257)
($2,026) 21,835
4,973 21 ,360 12,121 18,833 5,070
922 25,364
(90,936)
$714 490 559
1,019 932
1,417 13
1,424 1,872
679 TotalOperating $26,635 $17,516 $9,119 Water utility Sanitary sewer utility Sanitation and recycling utility
4,197 3,749
4
2,993 2,683
(1 ,174)
1,204 1,066 1,178
Total Utilities $7,950 $4,502 $3 ,448
54% 2%
10% 5% 7% 7% 0%
61% 7% 1%
29% 28%
1Net Operational Activity does not include amounts related to capital such as: contributed assets, developer contributions, amortization, etc. 2Based on organizational structure in place as of June 30, 201 9 ' Includes budgeted equity transactions such as transfer to reserves, transfer to provision etc. 4Jncludes Community Safety Administration, Business Licences, Community Bylaws and Emergency Programs.
The following section provides an explanation on a Divisional/Depatimental basis of year to date variances in relation to the 2019 Financial Plan:
• Community Safety' s (excluding fire and policing) favourable variance is driven by business licence revenue and community bylaw revenue.
• Community Services' favourable variance is mainly from Parks expenditures as more activity is expected to be incuned in the summer months.
• Corporate Administration' s favourable variance is mainly due to vacant positions.
• Engineering and Public Works' favourable variance is mainly due to underpinning and petmit fee revenue, and timing of expenditures.
6245887 FIN - 19

August 2, 2019 - 14-
• Finance and Corporate Services' favourable variance is mainly due to vacant positions.
• Fire Rescue's favourable variance is mainly due to vacant positions as an additional 12 firefighters were approved on March 11, 2019 in the 2019 Operating Budget. The recruitment process is underway and the positions are expected to be filled in October.
• The Library is on budget.
• Planning and Development's favourable variance is primarily due to building permit revenue related to multi residential buildings and vacant positions.
• Policing's favourable variance is mainly due to vacant positions as an additional 19 officers were approved on March 11, 2019 in the 2019 Operating Budget resulting in lower than budgeted RCMP contract costs.
• Fiscal's favourable variance is due to higher than budgeted investment income and timing of expenditures.
• Water Utility's favourable variance is mainly due to unbudgeted revenue received from developers for water consumption charges during construction of new residential developments. Any surplus at year end will be transfelTed to the Water Levy Stabilization Provision.
• Sanitary Sewer Utility's favourable variance is mainly due to unbudgeted revenues received from developers for sanitary sewer user fees during construction of residential developments. Any surplus at year end will be transfetTed to the Sewer Stabilization Provision.
• Sanitation and Recycling Utility's favourable variance is mainly due to higher than budgeted Recycle BC revenue and recycling collection fees. Any surplus at year end will be transfened to the General Solid Waste and Recycling Provision.
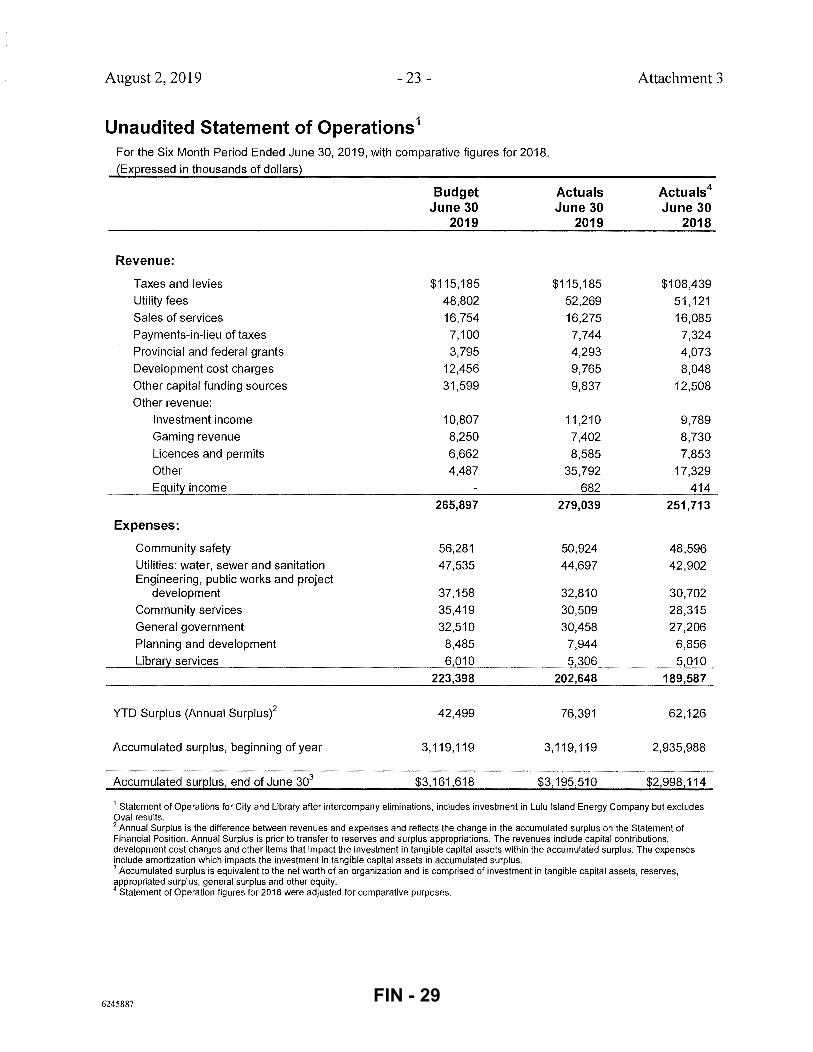
The presentation of the figures for the Financial Statement, Statement of Operations is different than the Net Budget presentation above. The above presentation combines revenues and expenses and presents the net amount inclusive of transfers. The Statement of Operations presents the revenues and expenses separately and prior to any appropriations and transfer to reserves. The Statement of Operations for the Six Month Period Ended June 30, 2019, with comparative figures for 2018 is included in Attachment 3.
6245887 FIN - 20

August 2, 2019 - 15 -
Cash and Investment Portfolio
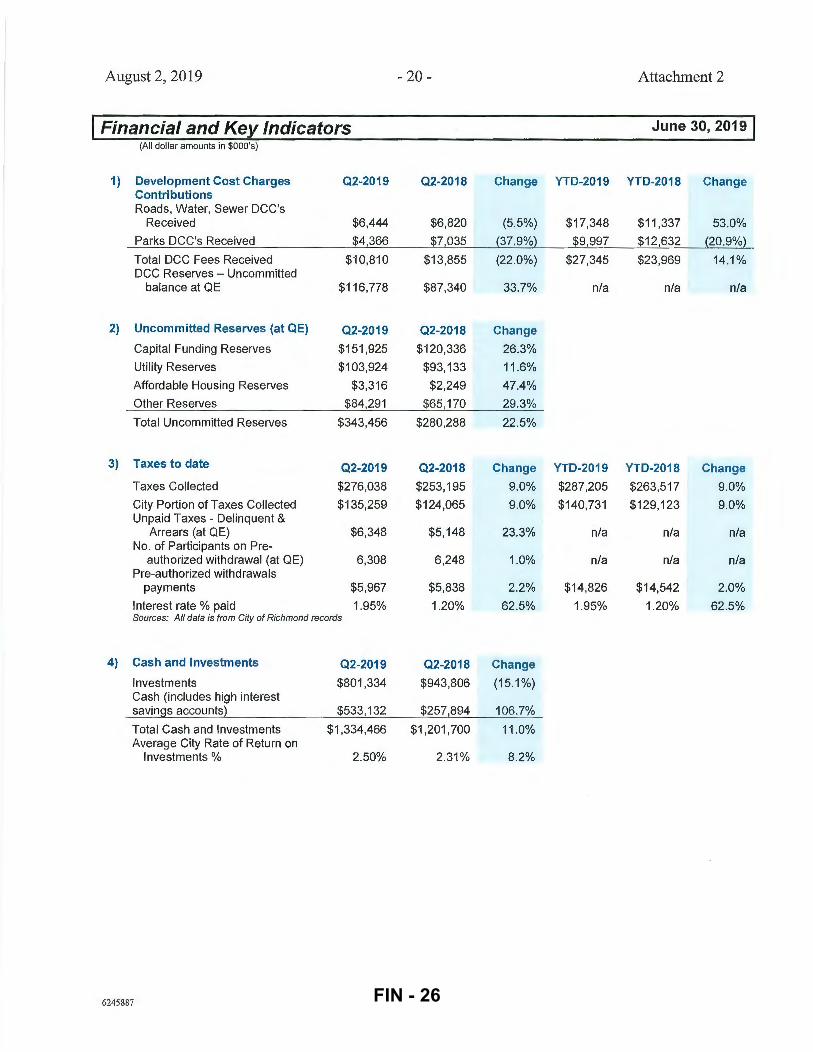
As of June 30, 2019, the City's total cash and investment balance was $1.33 billion with a weighted average yield of 2.50%.
The overall cash and investment balance is comprised of $801.3 million in investments (see holdings in Attachment 4) and $53 3.1 million in high interest savings cash accounts. The high cash balance is mainly due to the collection of propetiy taxes during June and the more favourable yield being realized on shmier term deposits caused by the inversion of the yield curve as discussed below.
Table 3: Market Interest Rates (for analytical purposes only) -
June 30, 2019 March 31, 2019 2 Year Government of Canada Bonds 1.46% 1.46% 5 Year Government of Canada Bonds 1.40% 1.43% 10 Year Government of Canada Bonds 1.50% 1.54%
Source: Bank of Canada
Trade tensions and the overall uncertainty of the global conditions continued to contribute to the synchronous slowdown across many countries. In response, many central banks have signed a slower pace of monetary policy normalization. In the U.S. , with the incoming economic data releases and the trade tension between the U.S. and China, the U.S. Federal Reserve announced its interest rate cut of0.25% to 2.25% on July 31,2019.
The Bank of Canada showed no urgency at its July 10, 2019 meeting to make a policy change even though the U.S. Federal Reserve had already signed its intention to lower the U.S. interest rate. The Bank of Canada kept its interest rate unchanged at the current level of 1. 7 5% in its latest interest rate announcement meeting. This was the sixth-straight policy meeting where the Bank of Canada has kept its overnight interest rate at the same level since the last interest rate increase in October 2018.
As shown in the Canadian Government yield curve below, the market is in an inverted yield curve environment where long-te1m debt instruments have a lower yield than short-te1m debt instruments for the same credit quality. It is therefore more favourable for the City to keep its available funds in cash and equivalent short-term products in order to optimize the earning potential ofthe City's funds.
Conodlan Govern ment Yi eld Curve 23
? I
I 0
I 3 - Juo302015 - 0..1.3 1?015 - JunXI2'0 19
II
09 1 2 3 ..1 !» G 7 & Q 10 1t 12 13 !J tS 1£i 17 16 19 20 21 22 Zl 2.1 2S 11'6 27 25 29 ~0 31
6245887 FIN - 21

August 2, 2019 - 16-
Cash balance as of June 30, 2019 was $533.1 million. The cash balance is anticipated to drop by around $220 million during July and August 2019 when propetiy tax collections are being remitted to the various taxing agencies.
The City continues to comply with its Investment Policy (3703) by carrying a cash and investment portfolio with strong credit quality, meeting the objectives of managing its investment activities in a manner that seeks to preserve capital and to realize a reasonable rate of return.
Contract A wards
This report provides information on the formal contracts awarded by the City during the second quarter. In accordance with Policy 3104, 33 contracts greater than $75,000 were awarded totalling over $17.1 million (Attachment 5).
Financial Impact
None.
Conclusion
The City of Richmond is maintaining its strong financial position through the second quatier of 2019. Building construction and development activity are showing signs of moderating from the extreme levels of the past yem·s due to the constraints on new constructions. It is expected that these trends will continue throughout 2019.
Cind ~an1., CMA Manager, Financial Reporting (604) 276-4077
Att. 1: Att. 2: Att. 3: Att. 4: Att. 5:
6245887
Economic Indicators Financial and Key Indicators Unaudited Statement of Operations Cash and Investment Portfolio Contract Awards greater than $75,000
FIN - 22
August 2, 2019 - 17 - Attachment 1
I Economic Indicators June 30, 2019 I Macroeconomic Indicators & Forecast
1) Real GOP - % Change 2017 2018 Change 2019f 2020f
Canada 3.0 1.9* (36.7%) 1.5 1.9
United States 2.2* 2.9 31 .8% 2.6 1.9
China 6.8* 6.6 (2.9%) 6.2 6.0
World 3.8 3.6 (5.3%) 3.2 3.5
2) Interest Rates (at YE) 2017 2018 Change 2019f 2020f
Bank of Canada 1.00 1.75 75.0% 1.75 1.75
US FED 1.50 2.50 66.7% 2.50 2.50
3) Exchange Rate 2017 2018 Change 2019f 2020f CAD per $1 USD 1.26 1.36 7.9% 1.35 1.37
Regional and Local Market Indicators
4) Unemployment(%) 02-2019 01-2019 Change 02-2018 Change
Canada 5.5 5.8 (5.2%) 6.0 (8.3%)
BC 4.5 4.6 (2.2%) 5.2 (13.5%)
Metro Vancouver 4.0 4.8 (16.7%) 4.3 (7.0%)
5) CPI (2002=1 00) 02-2019 01 -2019 Change 02-2018 Change
Canada 136.3 135.4 0.7% 133.6 2.0%
BC 131 .9 130.7 0.9% 128.6 2.6%
Metro Vancouver 134.8 133.3 1.1% 131 .3 2.7%
6) Richmond Building Permits 02-2019 02-2018 Change YTD-2019 YTD-2018 Change
Residential - New Construction" 49 177 (72.3%) 122 304 (59.9%)
Residential - Alterations 137 173 {20.8%} 255 324 {21.3%}
Residential Total 186 350 (46.9%) 377 628 (40.0%)
" Number of units from new residential 861 512 68.2% 1,458 889 64.0% construction
Residential 186 350 (46.9%) 377 628 (40.0%)
Commercial 117 116 0.9% 240 217 10.6%
Industrial 47 39 20.5% 98 54 81 .5%
Building Permits Total 350 505 (30.7%) 715 899 (20.5%)
Construction Value ($ million) 266.1 269.8 (1.4%) 529.5 484.7 9.2%
7) Housing Starts (Units) 02-2019 02-2018 Change YTD-2019 YTD-2018 Change
Starts - Metro Vancouver 9,951 5,698 74.6% 15,723 12,562 25.2%
Starts - Richmond 1,760 753 133.7% 1,902 1,413 34.6%
8) Richmond Residential Sales Activity 02-2019 02-2018 Change YTD-2019 YTD-2018 Change
Sales - Detached 213 234 (9.0%) 333 429 (22.4%)
Sales- Townhouse 159 222 (28.4%) 243 416 (41 .6%)
Sales - A~artment 340 516 {34.1%} 589 965 {39.0%}
Sales Total/Average Change 712 972 (26.7%) 1,165 1,810 (35.6%)
6245887 FIN - 23

August 2, 2019 - 18- Attachment 1
I Economic Indicators June 30, 2019 I
Regional and Local Market Indicators (continued)
9) Richmond Sales to Active Listings Ratio(%) Q2-2019 Q2-2018 Change
Single Family Detached 6.3 9.2 (31 .5%)
Townhouse 9.7 26.6 (63.5%)
Apartment 12.5 36.8 (66.0%)
10) Average Days on Market
Richmond Metro Vancouver
Property Type Q2-2019 Q2-2018** Change Q2-2019 Q2-2018** Change
Single Family Detached 51 46 10.9% 48 38 26.3%
Townhouse 38 31 22.6% 34 23 47.8%
Apartment 43 23 87.0% 34 19 78.9%
11) Home Price Index ($000 at QE)
Richmond Metro Vancouver
Property Type Q2-2019 Q2-2018 Change Q2-2019 Q2-2018 Change
Single Family Detached 1,485 1,649 (9.9%) 1,424 1,598 (10.9%)
Townhouse 779 855 (8.8%) 775 860 (9.9%)
Apartment 629 684 (8.0%) 655 704 (7.0%)
12) Commercial Space (at QE) Richmond Metro Vancouver
Q2-2019 Q2-2018 Change Q2-2019 Q2-2018 Change
Office Vacancy(%) 7.8 9.0 (13.3%) 3.7 4.9 (24.5%)
Transit Oriented Office Vacancy (%) 2.3 2.3 0.0% 13.6 13.6 0.0%
Office Inventory (000 sf) 4,517 4,419 2.2% 59,678 58,243 2.5%
Industrial Vacancy (%) 1.8 3.1 (41 .9%) 1.7 2.2 (22.7%)
Industrial Inventory (000 sf) 38,877 38,539 0.9% 211,126 207,097 1.9%
13) Richmond Business Growth Q2-2019 Q2-2018 Change YTD-2019 YTD-2018 Change Total Valid Business Licences
(at QE) n/a n/a n/a 14,737 14,368 2.6%
New Licences- Number Issued 611 529 15.5% 1 ,070* 982 9.0%
New Licences - Employees 2,281 1,747 30.6% 3,846 3,556 8.2%
New Licences - Office Added (sf) 151 ,327 137,396 10.1% 273,711 296,656 (7.7%)
New Licences - Retail Added (sf) 91,977 73,035 25.9% 189,681 129,665 46.3%
New Licences- Industrial Added (sf) 261,708 208,990 25.2% 405,301 538,743 (24.8%)
Total Space Added (sf)/Avg . Change 505,012 419,421 20.4% 868,693 965,064 (10.0%)
6245887 FIN - 24
August 2, 2019
Economic Indicators
Regional and Local Market Indicators (continued)
14) Goods & People Movement
YVR Air Cargo (tonnes) PMV Container Movement
(TEUs)
YVR Passengers (million) Richmond Hotel Revenue
($ million)***
Notes: a) b)
QE indicates quarter end f- forecast to year-end
Q2-2019
76,601
852,336
6.7
38.9
- 19-
Q2-2018
85,062*
836,224
6.5
38.1 **
c) d)
•- Figures have been updated to reflect changes in source data. **- Figures have been updated for comparability.
Attachment 1
June 30, 2019
Change YTD-2019 YTD-2018 Change
(9.9%) 146,884* 157,120* (6.5%)
1.9% 1,695,375 1,637,441 3.5%
3.1% 12.7 12.3* 3.3%
2.1% 86.4 84.2** 2 .6%
e) *** -Hotel revenue for 2018 and 2019 Q2 excludes June figures for comparative purposes. The three month of Q2 2018 hotel revenue was $65.4M and the first six month of 2018 was $111.5M.
List of Sources: 1)
2) & 3)
4) & 5)
6)
7)
8), 9) 10) & 11)
12)
13)
14)
6245887
International Monetary Fund, World Economic Outlook (July 2019)
US Federal Reserve, Bank of Canada and Royal Bank Economic Research Forecast (June 2019)
Statistics Canada
City of Richmond Building Permits
Canada Mortgage and Housing Corporation
Real Estate Board of Greater Vancouver
Cushman & Wakefield Office and Industrial Market Beat Reports
City of Richmond Business Licences
Port of Vancouver Monthly Cargo Statistics YVR monthly statistics City of Richmond Additional Hotel Room Tax Ledger, Destination BC
FIN - 25
August 2, 2019 -20- Attachment 2
I Financial and Key Indicators June 30, 20191 (All dollar amounts in $000's)
1) Development Cost Charges 02-2019 02-2018 Change YTD-2019 YTD-2018 Change Contributions Roads, Water, Sewer DCC's
Received $6,444 $6,820 (5.5%) $17,348 $11 ,337 53.0%
Parks DCC's Received $4,366 $7,035 {37.9%} $9,997 $12,632 (20.9%}
Total DCC Fees Received $10,810 $13,855 (22.0%) $27,345 $23,969 14.1% DCC Reserves - Uncommitted
balance at QE $116,778 $87,340 33.7% n/a n/a n/a
2) Uncommitted Reserves (at OE) 02-2019 02-2018 Change
Capital Funding Reserves $151,925 $120,336 26.3%
Utility Reserves $103,924 $93,133 11.6%
Affordable Housing Reserves $3,316 $2,249 47.4%
Other Reserves $84,291 $65,170 29.3%
Total Uncommitted Reserves $343,456 $280,288 22.5%
3) Taxes to date 02-2019 02-2018 Change YTD-2019 YTD-2018 Change
Taxes Collected $276,038 $253,195 9.0% $287,205 $263,517 9.0%
City Portion of Taxes Collected $135,259 $124,065 9.0% $140,731 $129,123 9.0% Unpaid Taxes - Delinquent &
Arrears (at QE) $6,348 $5,148 23.3% n/a n/a n/a No. of Participants on Pre-
authorized withdrawal (at QE) 6,308 6,248 1.0% n/a n/a n/a Pre-authorized withdrawals
payments $5,967 $5,838 2.2% $14,826 $14,542 2.0%
Interest rate % paid 1.95% 1.20% 62.5% 1.95% 1.20% 62.5% Sources: All data is from City of Richmond records
4) Cash and Investments 02-2019 02-2018 Change
Investments $801 ,334 $943,806 (15.1%) Cash (includes high interest savings accounts} $533,132 $257,894 106.7%
Total Cash and Investments $1,334,466 $1,201,700 11 .0% Average City Rate of Return on
Investments % 2.50% 2.31 % 8.2%
6245887 FIN - 26

August 2, 2019 - 21 - Attachment 2
I Financial and Key Indicators June 30, 20191 (All dollar amounts in $000's)
Financial and Key Indicators (continued)
5) Planning and Development Q2-2019 02-2018 Change YTD-2019 YTD-2018 Change Building Permit Fees
Collected $1,857 $2,568 (27.7%) $4,732 $5,169 (8.5%) Development Applications
Received 44 62 (29.0%) 82 111 (26.1%) Development Applications
Fees $150 $335 (55.2%) $344 $568 (39.4%)
6) Business Licences Q2-2019 Q2-2018 Change YTD-2019 YTD-2018 Change Revenue Received for
Current Year Licences $1 '191 $1 '159 2.8% $3,128 $3,009 4.0% Revenue Received for Next
Year (Deferred} $307 $262 17.2% $367 $352 4.3%
Total Licence Revenue $1,498 $1,421 5.4% $3,495 $3,361 4.0% Year to date valid licences and revenue include current year licences issued in the prior year.
7) Other Revenues Q2-2019 Q2-2018 Change YTD-2019 YTD-2018 Change
Parking Program Revenue $544 $524 3.8% $1,076 $974 10.5%
Gaming Revenue $3,702 $4,389 (15.7%) $7,402 $8,730 (15.2%)
Traffic Fine Revenue $1,926 $1,985 (3 .0%) $1,926 $1,985 (3.0%)
8) Employees Q2-2019 Q2-2018 Change Full Time Equivalent (FTE)
Employees (at QE) 1,577 1,583 (0.4%) (City and Library) FTE includes Regular Full Time, Temporary and Auxiliary status employees. The calculation is based on actual results.
9) Operating Indicators Q2-2019 Q2-2018 Change YTD-2019 YTD-2018 Change
Fire Rescue Responses 2,326 2,433 (4.4%) 4,612 5,093 (9.4%) RCMP - Calls for Service
Handled 19,699 16,910 16.5% 38,032 32,191 18.1%
Public Works calls for Service 4,053 3,847 5.4% 7,181 7,054 1.8%
6245887 FIN - 27

August 2, 2019 -22-
I Financial and Key Indicators (All dollar amounts in $DOD's)
Financial and Key Indicators (continued)
10) Housing Units Secured Since 2007 02-2019 02-2018 Change (at OE)
Affordable Housing
Non-Market Rental (units) 529 449* 17.8%
Affordable Rental (LEMR**) (units) 798 510* 56.5%
ARTS Rental (units) 37 37 0.0%
Entry Level Home Ownership (units) 25 25* 0.0%
Market Housing
Market Rental (units) 726 411 76.6% Secondary Suite I Coach House
(units} 287 269* 6.7%
Total Housing Units 2,402 1 '701 * 41 .2%
* Figures have been updated to reflect changes in source data and methodology. ** LEMR units refer to Low End Market Rental units.
Attachment 2
June 30, 2019j"
*** The floor space secured refers to square footage negotiated through phased developments. The number remains unchanged, as the development applications for subsequent phases have not come forward at this time with the unit breakdown and mix. LEMR units are still consistently secured through standard rezoning and development applications.
11) Richmond Population Estimate Year End
2019f
227,407 Population figures provided by City of Richmond - Policy Planning
Notes: a) All figures presented above are unaudited b) f- forecast to year-end
6245887
2018
222,945
FIN - 28
August 2, 2019 - 23- Attachment 3
Unaudited Statement of Operations 1
For the Six Month Period Ended June 30, 2019, with comparative figures for 2018.
~Exeressed in thousands of dollars~
Budget Actuals Actuals4
June 30 June 30 June 30 2019 2019 2018
Revenue:
Taxes and levies $115,185 $115,185 $108,439 Utility fees 48,802 52,269 51' 121 Sales of services 16,754 16,275 16,085 Payments-in-lieu of taxes 7,100 7,744 7,324 Provincial and federal grants 3,795 4,293 4,073 Development cost charges 12,456 9,765 8,048
Other capital funding sources 31,599 9,837 12,508 Other revenue:
Investment income 10,807 11,210 9,789 Gaming revenue 8,250 7,402 8,730 Licences and permits 6,662 8,585 7,853 Other 4,487 35,792 17,329
Eguit~ income 682 414
265,897 279,039 251,713
Expenses:
Community safety 56,281 50,924 48,596 Utilities: water, sewer and sanitation 47,535 44,697 42,902 Engineering, public works and project
development 37,158 32,810 30,702 Community services 35,419 30,509 28,315 General government 32,510 30,458 27,206
Planning and development 8,485 7,944 6,856 Library services 6,010 5,306 5,010
223,398 202,648 189,587
YTD Surplus (Annual Surplus)2 42,499 76,391 62,126
Accumulated surplus, beginning of year 3,119,119 3,119,119 2,935,988
Accumulated surelus, end of June 303 $3,161,618 $3,195,510 $2,998,114
1 Statement of Operations for City and Library after intercompany eliminations, includes investment in Lulu Island Energy Company but excludes Oval results. 2 Annual Surplus is the difference between revenues and expenses and reflects the change in the accumulated surplus on the Statement of Financial Position. Annual Surplus is prior to transfer to reserves and surplus appropriations. The revenues include capital contributions, development cost charges and other items that impact the investment in tangible capital assets within the accumulated surplus. The expenses include amortization which impacts the investment in tangible capital assets in accumulated surplus. 3 Accumulated surplus is equivalent to the net worth of an organization and is comprised of investment in tangible capital assets, reserves, appropriated surplus, general surplus and other equity. 4 Statement of Operation figures for 2018 were adjusted for comparative purposes.
6245887 FIN - 29

August 2, 2019 - 24-
Cash and Investment Portfolio June 30, 2019 (in OOO's)
DBRS Asset Long Term Rating Class Issuer Term Net Book Value
Provincial M(high) Alberta 2019-2022 $ A(high) Manitoba 2021 A(high) Quebec 2022-2023
M(high) British Columbia 2021 M(low) Ontario 2024 A (high) Nova Scotia 2021 A(high) Saskatchewan 2019-2020 A(high) New Brunswick 2021
Total $ Chartered Banks
M Bank of Nova Scotia 2019-2022 $ M Royal Bank 2019-2023 M TO Bank 2019-2023
M(low) National Bank of Canada 2019-2021 A(high) HSBC Bank of Canada 2021-2023
M Bank of Montreal 2022-2025 M CIBC 2019-2022
A(low) Canadian Western Bank 2019 Total $
BC Credit Unions BC Credit Unions Vancity 2019-2020 $ BC Credit Unions Gulf and Fraser 2019-2020 BC Credit Unions Coast Capital Savings 2019
Federal Credit Union Coast Capital Savings 2020
BC Credit Unions Westminster Savings 2019 BC Credit Unions Blue Shore Financial 2019
Total $ Pooled Investments
MFA Pooled Investment Fund $
Total Investment Portfolio Balance $ Cash Balance (includes high interest saving products with terrns less than 90 days) $ Total Cash and Investment Balance
6 to 7 years • 5 to 6 years • 4 to 5 years
3 to 4 years
2 to 3 years
1 to 2 years
6 months to 1 year
3to 6 months
0 to 3 months
6245887
$
Investment Maturity
I
50
I
100
Millions (S)
68,135 22,494 22,154 15,042
11 '199 10,503 10,235 5,187
164,949
119,890 69,884 51,219 43,506 32,131 29,955 24,887 23,982
395,454
72,204 41,606 31,018 20,546 18,164 10,644
194,182
46,749
801,334 533,132
1,334,466
150
Attachment 4
Investment %of Total Limit(% of Portfolio Portfolio)
8.50% 2.81% 2.76% 1.88% 1.40% 1.31% 1.28% 0.65%
20.59% 50%
14.96% 8.72% 6.39% 5.43% 4.01% 3.74% 3.11% 2.99%
49.35% 50%
9.01% 5.19% 3.87% 2.56% 2.27% 1.33%
24.23% 30%
5.83% 20%
100.00%
200
FIN - 30

August 2,, 2019 - 25 -
2
3
4
5
6
7
8
9
10
11
12
13
14
15
16
17
6245887
Contract Awards greater than $75,000 Apri l 1st to June 301
h, 2019
Provision of Producer and Production Anigraph Productions 124,293 Services for Richmond Maritime Festival Ltd.
Rental of three (3) dump trucks and one The Driving Force 77,420 ( 1) flat deck truck
Tree Relocation at River Parkway Project Tree Wisemen 138,400 Landscaping Ltd .
Watermania Cooling Tower Replacement ESC Automation 234,369
Consulting Services for Network Nettraffic Technologies 175,000 Architecture and Project Management Consulting Inc.
2019 GIS Enterprise Licence Agreement ESRI Canada Ltd. 172,500 Renewal
Library Cultural Centre (LCC) Mechanical Williams Engineering 85,550 Upgrade - Consulting Services for Canada Inc. Detailed Design and Construction Administration
On-Call Refrigeration Contractor CIMCO Refrigeration 300,000
Cisco 8851 IP Phones and Licenses Telus Communications 93,542 Inc.
Terra Nova Adventure Playground Tower Kinsel Timber Systems 134,086 Renewal : Design-Build Services Ltd .
Pipe Relining at North side of Park Road Mar-Tech Underground 86,000 Services Ltd.
2019 Public Sector Maintenance Support lnfor Canada Ltd . 104,695 Renewal (Hansen)
Firefighter Candidate Assessment BL Associates Corporate 95,550 Psychologists Inc.
Supply and Installation of Test VXRail Turning Point 333,887 Server Environment Technologies
Supply and Delivery of a Professional Sapphire Sound Inc. 85,802 Audio System
City Centre Community Police Office Edifice Construction Inc. 4,705,500 Tenant Improvement Project
Hugh Boyd Park - Synthetic Sports Astro Turf West 1,499,000 Surfacing Replacement Distributors Ltd .
Attachment 5
Community Services
Engineering & Public Works
Engineering & Public Works
Engineering & Public Works
Finance & Corporate Services
Finance & Corporate Services
Engineering & Public Works
Engineering & Public Works
Finance & Corporate Services
Community Services
Engineering & Public Works
Finance & Corporate Services
Community Safety
Finance & Corporate Services
Engineering & Public Works
Engineering & Public Works
Community Services
FIN - 31
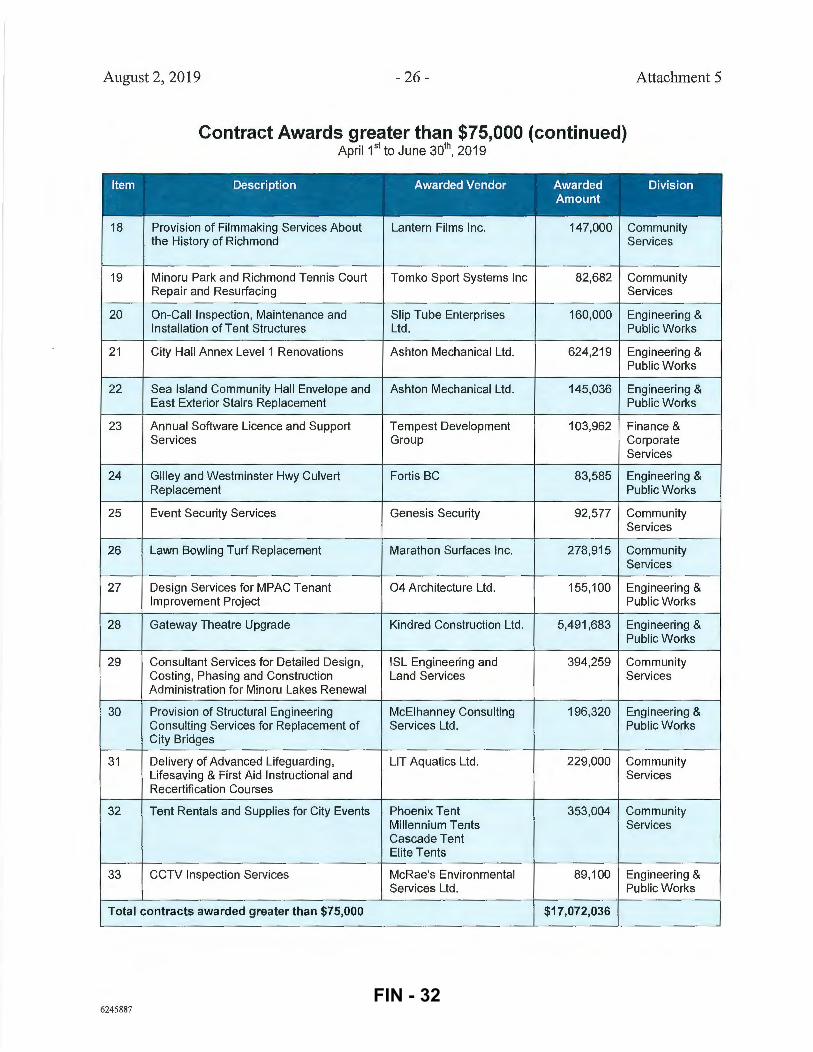
August 2, 2019 - 26- Attachment 5
Contract Awards greater than $75,000 (continued) April 1st to June 301
h, 2019
Item Description Awarded Vendor Awarded Division Amount
18 Provision of Filmmaking Services About Lantern Films Inc. 147,000 Community the History of Richmond Services
19 Minoru Park and Richmond Tennis Court Tomko Sport Systems Inc 82,682 Community Repair and Resurfacing Services
20 On-Call Inspection , Maintenance and Slip Tube Enterprises 160,000 Engineering & Installation of Tent Structures Ltd . Public Works
21 City Hall Annex Level 1 Renovations Ashton Mechanical Ltd. 624,219 Engineering & Public Works
22 Sea Island Community Hall Envelope and Ashton Mechanical Ltd. 145,036 Engineering & East Exterior Stairs Replacement Public Works
23 Annual Software Licence and Support Tempest Development 103,962 Finance & Services Group Corporate
Services
24 Gilley and Westminster Hwy Culvert Fortis BC 83,585 Engineering & Replacement Public Works
25 Event Security Services Genesis Security 92,577 Community Services
26 Lawn Bowling Turf Replacement Marathon Surfaces Inc. 278,915 Community Services
27 Design Services for MPAC Tenant 04 Architecture Ltd . 155,100 Engineering & Improvement Project Public Works
28 Gateway Theatre Upgrade Kindred Construction Ltd. 5,491,683 Engineering & Public Works
29 Consultant Services for Detailed Design, ISL Engineering and 394,259 Community Costing , Phasing and Construction Land Services Services Administration for Minoru Lakes Renewal
30 Provision of Structural Engineering McEihanney Consulting 196,320 Engineering & Consulting Services for Replacement of Services Ltd . Public Works City Bridges
31 Delivery of Advanced Lifeguarding , LIT Aquatics Ltd . 229,000 Community Lifesaving & First Aid Instructional and Services Recertification Courses
32 Tent Rentals and Supplies for City Events Phoenix Tent 353,004 Community Millennium Tents Services Cascade Tent Elite Tents
33 CCTV Inspection Services McRae's Environmental 89,100 Engineering & Services Ltd . Public Works
Total contracts awarded greater than $75,000 $17,072,036
6245887 FIN - 32