city of tacoma public utility board friday, november 8, 2019 … · public utility board friday,...
TRANSCRIPT

The City of Tacoma does not discriminate on the basis of disability in any of its programs, activities,
or services. To request this information in an alternative format or to request a reasonable
accommodation, please contact the TPU Director’s Office at 253-502-8201. TTY or speech to speech
users please dial 711 to connect to Washington Relay Services.
City of Tacoma Public Utility Board
Friday, November 8, 2019 Environmental Services Building (West Room)
9850 64th St W, University Place WA 98467
Budget/Financing for 2021/2022 biennium – topic agenda
Estimated time Topic
11:00 – 12:00 Public Process
Recap of last year
Discussion on what went well, areas for improvement
Draft 2020 calendar
1:00 – 2:00 Finance
Financial plans
Scenarios
Revenue/load forecast
2:00 – 3:00 Budget
Value initiatives & budget efficiencies
Current variance reporting
Preview of items for upcoming biennium
3:15 – 4:00 Rates
Trends, observations and policy considerations
Reserves

Public Utility Board Special Meeting
Handouts: Budget/Financing for 2021/2022 Biennium
November 8, 2019
11:00-4:15

Tacoma Water Long Range Financial Plan Summary
Water Projected Rate Adjustments
Scenario 2019 2020 2021 2022 2023 2024 2025 2026 2027 2028 2029 2030 2031 2032 2033 2034
Base Case:Current Demand Forecast
2.5% 2.5% 2.5% 2.5% 2.5% 2.5% 2.5% 2.5% 2.5% 2.5% 2.5% 2.5% 3.0% 3.0% 3.5% 3.5%
Wholesale Revenue Growth
2.5% 2.5% 2.0% 2.0% 2.0% 2.0% 2.0% 2.0% 2.0% 2.0% 2.5% 2.5% 2.5% 2.5% 2.0% 2.0%
Loss of Large Customer
2.5% 2.5% 4.0% 4.0% 4.0% 4.0% 3.0% 3.0% 3.0% 3.0% 3.0% 3.0% 3.0% 3.5% 3.5% 3.5%
High Case CIP 2.5% 2.5% 2.5% 2.5% 3.0% 3.0% 3.0% 3.0% 3.0% 3.0% 3.0% 3.0% 3.0% 3.0% 3.5% 3.5%
Finance
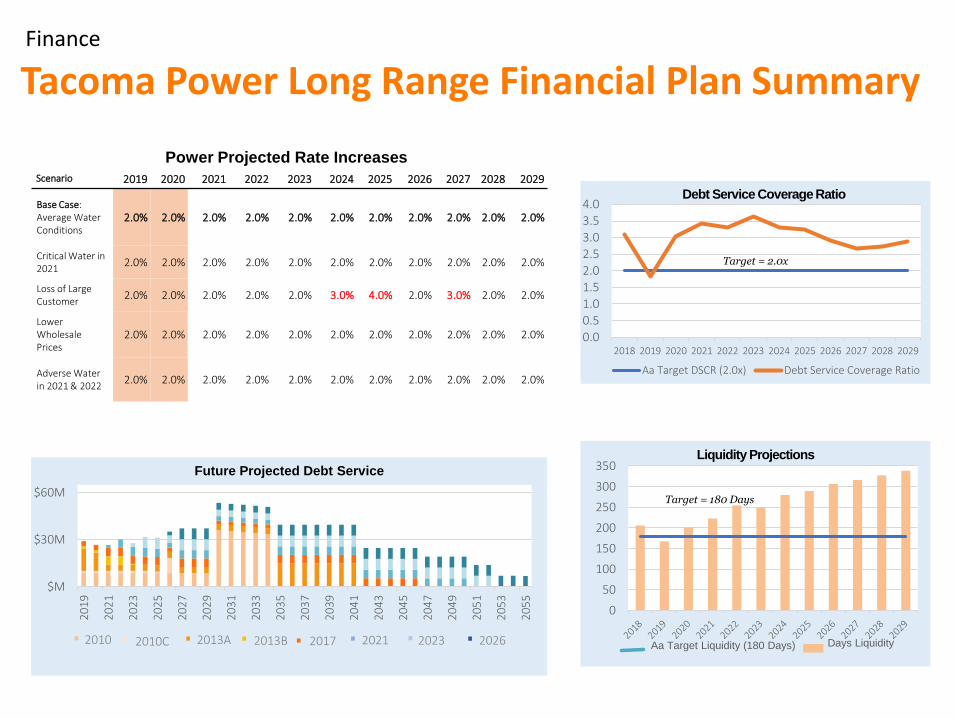
Tacoma Power Long Range Financial Plan Summary
Power Projected Rate Increases
Scenario 2019 2020 2021 2022 2023 2024 2025 2026 2027 2028 2029
Base Case:Average Water Conditions
2.0% 2.0% 2.0% 2.0% 2.0% 2.0% 2.0% 2.0% 2.0% 2.0% 2.0%
Critical Water in 2021
2.0% 2.0% 2.0% 2.0% 2.0% 2.0% 2.0% 2.0% 2.0% 2.0% 2.0%
Loss of Large Customer
2.0% 2.0% 2.0% 2.0% 2.0% 3.0% 4.0% 2.0% 3.0% 2.0% 2.0%
Lower Wholesale Prices
2.0% 2.0% 2.0% 2.0% 2.0% 2.0% 2.0% 2.0% 2.0% 2.0% 2.0%
Adverse Water in 2021 & 2022
2.0% 2.0% 2.0% 2.0% 2.0% 2.0% 2.0% 2.0% 2.0% 2.0% 2.0%
3
0.0
0.5
1.0
1.5
2.0
2.5
3.0
3.5
4.0
2018 2019 2020 2021 2022 2023 2024 2025 2026 2027 2028 2029
Aa Target DSCR (2.0x) Debt Service Coverage Ratio
Debt Service Coverage Ratio
Target = 2.0x
0
50
100
150
200
250
300
350
Days LiquidityAa Target Liquidity (180 Days)
Target = 180 Days
Liquidity Projections
Future Projected Debt Service
$M
$30M
$60M
20
19
20
21
20
23
20
25
20
27
20
29
20
31
20
33
20
35
20
37
20
39
20
41
20
43
20
45
20
47
20
49
20
51
20
53
20
55
2010 2010C 2013A 2013B 2017 2021 2023 2026
Finance

Tacoma Rail 0% Loans Summary
Finance

Long Term Investments to Deliver Value
• Asset Management Budget PMO
• Alignment with our vision and strategic objectives
• Identification of uncertainty and risks
• Consistent and systematic framework
• Integrated and informed decision making
• Identification of efficiencies in business processes
Budget

Efficiencies – Revenue/Financial
Operations StreamliningResourcing Technology
Efficiencies
Revenue/Financial
Active Debt
Management
Revenue Innovations
Budget

Rates
Power Utility Ratemaking - Basic Principles
Rates are set to recover costs
Costs largely fixed
Today, the price of electricity based on amount consumed (not fixed)
Customers are generally grouped into classes based on similar cost profiles
Size
Usage Patterns
Costs are allocated to classes based on their share of the system costs
Generally deemed equitable (“user pays” principle)
Effort to minimize subsidies within and across classes
Why is this an issue now?
Declining retail use
Changing industry landscape

Rates
Tacoma Power Residential Class Ratemaking Considerations
Fixed Cost Recovery
• Sales figures are declining, which means fixed cost recovery drives rate increases• 66% of costs are fixed• 18% of revenues are fixed
Policy Issues
• Today, higher-usage customers pay more than their share of the utility’s fixed costs
• Individual customer bill impacts, especially low-income bill impacts, are a key concern
• Rate design changes impact policy objectives, such as the promotion of:
• energy efficiency,
• electric vehicle, and
• solar energy adoption
Usage-related variable
costs
Usage Charge
($/kWh)
Capacity costs (allocation of fixed system
costs)
Customer Charge
($/month)
0%
10%
20%
30%
40%
50%
60%
70%
80%
90%
100%
Cost Revenue
Residential
Customer-related fixed costs
System-capacity-related fixed costs

Rates
Load Factor Measures the Efficiency of a Load
How do you use 10 kWh?
1 kW per hour for 10
hours
10 kW for 1 hour
Average Usage
compared to Usage at
Peak Consumption
High-load-factor customers use most of their capacity at all time.
Low-load-factor customers have excess capacity for much of the time.

Rates
• G class is broad and diverse. There is no “typical” G customer, yet there is one rate for all of them
• Some G class customers are bigger than some HVG customers. Size may be a better class distinction than voltage
• Customers with a higher load factor (average usage ÷ maximum usage) are less costly to serve and so should arguably pay a lower average rate
• Fixed cost recovery is also an issue for this class
Usage-related variable
costs
Usage Charge
($/kWh)
Production Capacity
Transmission Capacity
Capacity Charge ($/kW)
Distribution Capacity
Distribution Fixed
Customer Charge ($/month)
0%
10%
20%
30%
40%
50%
60%
70%
80%
90%
100%
Cost Revenue
Nonresidential
Customer-related fixed
System-capacity-related fixed costs
Tacoma Power Nonresidential Ratemaking Considerations