city of san diego 2011 2015 of san diego 2011–2015 ... chief financial officer financial...
TRANSCRIPT

CITY OF SAN DIEGO
2011–2015 Five-Year Financial Outlook
October 1st
, 2009
Jerry Sanders Jay M. Goldstone Mayor Chief Operating Officer Mary Lewis Nader Tirandazi Chief Financial Officer Financial Management
Director Disclaimer:
The City files its official statements for bond offerings, audited financial statements, comprehensive annual financial reports, annual financial information, material event notices, and voluntary disclosures with the Municipal Securities Rule Making Board (MSRB). The Five Year Financial Outlook will not be filed with the MSRB and investors should not rely upon the Five Year Financial Outlook to make any investment decisions. The City will be submitting the Five Year Financial Outlook to the rating agencies, its bond insurers and other interested parties, and welcomes and encourages their careful review of this document. Readers are cautioned that the numbers presented in this document are the City’s best estimate for the next five years based on facts and factors currently known to the City and do not represent actual performance. No representation is made by the City that as of the date this document is read that there is not a material difference between the City’s actual performance as of such date and the financial data presented in the Five Year Financial Outlook. Certain statements in this document constitute forward-looking statements or statements which may be deemed or construed to be forward-looking statements within the meaning of the Private Securities Litigation Reform Act of 1995. Forward-looking statements involve, and are subject to known and unknown risks, uncertainties and other factors which could cause the City's actual results, performance (financial or operating) or achievements to differ materially from the future results, performance (financial or operating) or achievements expressed or implied by such forward-looking statements. All forward-looking statements herein are expressly qualified in their entirety by the abovementioned cautionary statement. The City disclaims any obligation to update forward-looking statements contained in this document.
Page | 1

EXECUTIVE SUMMARY The City of San Diego FY 2011-2015 Five-Year Financial Outlook continues to serve as a guide for long-range fiscal planning and provides the framework for the development of the annual budget. The 2011-2015 Outlook incorporates a variety of economic assumptions and new mandated expenditure requirements that will likely influence revenues and expenditures over the next five years.
The Government Finance Officers Association (GFOA) recommends that local governments follow a financial planning process that combines the forecasts of revenues and expenditures into a single financial model over a three- to five-year period to be used as a tool to assess the long-term financial implications of current and proposed policies, programs, and assumptions in developing appropriate strategies to achieve established goals. The Financial Outlook is consistent with the GFOA best practices recommendations.
Scope of the Forecast The City’s General Fund is the primary focus of the 2011-2015 Outlook. The 2011-2015 Outlook forecasts General Fund revenues and expenditures for the next five years, beginning in FY 2011. Approximately 66 percent of the City’s major revenues consist of four revenue sources: property tax, sales tax, transient occupancy tax, and franchise fees. Approximately 70 percent of the City’s General Fund expenditures constitute personnel expenses.
Overview In November 2006, the Mayor released the first Five-Year Financial Outlook for FY 2008-2012. At least once each year the Five-Year Financial Outlook is revised and provides a framework for budgetary decisions by communicating the City’s fiscal priorities and outlining the City’s strengths as well as any fiscal challenges.
The global economy is currently in the deepest recession since World War II, and the national economy contracted sharply in the fourth quarter of 2008 and continued into the first two quarters of 2009. This has placed severe economic pressures on the State of California and the cities throughout California, including the City of San Diego. Declining retail sales and tourism, weakened consumer confidence, and high unemployment rates in San Diego and the region are directly influencing the City’s tax revenues. However, certain parts of the economy are showing indications of potential economic stabilization. The local housing market, which has contracted sharply, has been showing signs of stabilization in recent months.
The staff has revised the City’s revenue and expenditure forecasts in this updated FY 2011-2015 Five-Year Financial Outlook. Negative economic factors have resulted in a downward revision to revenue projections for the FY 2010 Annual Budget and served as a base for the five-year outlook. The updated 2011-2015 Outlook identifies current and future revenue and expenditure trends. It also discusses risks and opportunities that affect fiscal decisions and the City’s ability to accomplish its strategic goals over the next five-year period. These goals include:
Meet contractual obligations and fund mandated programs Contribute the full payment of the Annual Required Contribution (ARC) for the City’s pension system
Page | 2

Maintain General Fund and other reserves according to the City’s Reserve Policy Preserve City services to the fullest extent possible
The 2011-2015 Outlook is divided into two sections: the General Fund revenue forecast and the General Fund expenditure forecast. The General Fund revenue forecast section covers the development of the revenue projections and includes an overview of current economic trends and their affect on the City’s major revenues. The General Fund expenditure forecast section outlines the expenditure forecast including future expenditure requirements and expected cost growth rates. Attachment I provides detailed information on General Fund revenue and expenditure forecast for FY 2011-2015 and the projected shortfall for each fiscal year.
Revenue Forecast The General Fund revenue categories and the related background information are discussed in the revenue forecast section along with methods and assumptions affecting growth projections for each major revenue source. There are four major General Fund revenue sources: property tax, sales tax, transient occupancy tax, and franchise fees, which make up nearly 66 percent of General Fund revenue and are affected by changes in local, State, and national economic conditions. Other General Fund revenue sources such as licenses and permits, fines, forfeitures, and penalties are also influenced by economic conditions to varying degrees. A change in existing fees or the implementation of a new City Council policy for existing programs can reduce or increase projected revenue derived from fees. The General Fund revenue forecast is based on the City’s FY 2010 Annual Budget adjusted for the removal of one-time revenues (See Attachment II for detailed information on the elimination of one-time revenues from FY 2010 budget).
Expenditure Forecast The General Fund expenditure categories and the related background information are discussed in the expenditure forecast section along with methods and assumptions affecting growth projections for each expenditure category. The General Fund expenditure forecast is based on the City’s FY 2010 Annual Budget adjusted for the removal of one-time expenditures (see Attachment II for one-time adjustments) and assumes inflationary rate changes for certain expense categories. The expenditure categories discussed include salaries and wages, fringe benefits, supplies and services, information technology, utilities, and equipment outlay.
The major changes from the FY 2010 Adopted Budget for revenues and expenditures as follows:
Page | 3

Revenue Change $ (67)
Pension Payment $ 57McGuigan Settlement 32City Hall Fire Sprinkler System 6Various Reserves 16Deferred Maintenance Debt Service 5Net Other Savings (4)
Expense Change $ 112
Total Change $ (179)
Additionally, there are no committed expenditures included in the Outlook other than new departmental facility costs that are outlined in this write-up. Please see Attachment III for information on new facilities.
Funding for significant areas that have been addressed in prior years in order to restore or preserve the fiscal health of the City and/or meet its legal operational or community obligations are also included in the Outlook. The projected increase in funding in FY 2011 above FY 2010 budgeted amounts required for these areas are $113 million. The rationale for funding each area is discussed further in the report. Below is the summary of incremental contributions above FY 2010 budgeted levels for significant areas in FY 2011:
Incremental Contributions in FY 2011 to FY 2010 Baseline Funding retirement system based on projected FY 2011 Annual Required Contribution (ARC) ($56.7 million General Fund portion, $70.6 million Citywide) Funding the General Fund reserves ($4.2 million to achieve 7.5 percent Reserve Policytarget in FY 2011)Funding deferred maintenance and capital improvement needs ($4.6 million)Funding retiree healthcare obligations/Other Post Employment Benefits ($3.5 million)Funding new obligations under Storm Water Runoff Permits (no additional contribution;funding equivalent to FY 2010 budget)Funding the Americans with Disabilities Act obligations (no additional contribution;funding equivalent to FY 2010 budget). This is completed with capital raised from the sale of City owned real estate. Funding the Workers’ Compensation reserves (General Fund contribution of $4.1 millionto achieve 30 percent Reserve Policy target in FY 2011)Funding the Public Liability reserves ($8.1 million to achieve 25 percent Reserve Policytarget in FY 2011)McGuigan settlement payment ($31.7 million General Fund portion of a $39.1 million totalCity payment; one-time expense in FY 2011)
Page | 4

Revenue Baseline Forecast The revenue forecast combines an analysis of the economic factors driving the City’s revenue base and the specific revenue sources available to the City. While San Diego’s economy is increasingly diverse, the City’s revenue structure has a lower tax base compared to most other large cities in California. For example, the City does not levy a utility user tax or trash collection fee and has low business license taxes. The City’s revenues continue to be affected by decisions made by the State regarding the allocation of local revenue. Three of the City’s largest historical General Fund revenues – property tax, sales tax, and motor vehicle license fees – are all subject to State legislative actions, and have been significantly impacted by past State budget decisions resulting in significant revenue loss to the City. In November 2004, California voters passed Proposition 1A in order to prevent the State government from taking local government resources to balance the State budget. This proposition has made changes in the law to protect local government revenues from further State intervention. Facing serious financial challenges, the State declared a state of fiscal emergency in 2009 allowing the suspension of Proposition 1A, and allowing the State to borrow local government property taxes. The impact of the State budget actions is described further in this report.
Economic Environment The FY 2011-2015 Five-Year Financial Outlook is based on updated projections for FY 2010 for major revenue sources and expenditures that affect base year amounts to which new growth rates are applied. The economic environment on a local, State, and national level continued to decline further than was previously forecasted during FY 2009 due to an extended and expanding decline in consumer spending and tourism. Based on actual performance of these economic indicators up to the beginning of FY 2010, the base year revenue amount for the General Fund was adjusted to reflect updated forecasts formed with current economic information and expectations for a delayed economic recovery.
The continued decline in consumer spending, which accounts for 70 percent of United States’ GDP, can be attributed to increasing unemployment, declining per capita income, and an increased savings rate due to lack of confidence in an economic recovery in the short term. The graph below illustrates the stagnation in personal income and the individual savings rate change since December 2003. National personal income has averaged 0.5 percent growth per month from 2003 to December 2007 (beginning of the current recession) and has subsequently dropped to 0 percent average growth per month until July 2009; while the average consumer savings rate has increased to over 4 percent currently from a 0 percent savings rate at the beginning of the recession. All of the above factors, along with stagnation of personal income, the increase in the savings rate, and a decrease in consumer spending have resulted in reduced revenues for the City, primarily in sales tax and transient occupancy tax (TOT).
Page | 5

NATIONAL PERSONAL INCOME & SAVINGS RATE ($ in billions)
$12,500
Beginning of Recession
7.0%
$12,000 6.0%
5.0%$11,500
4.0% $11,000
3.0% $10,500
2.0% Personal $10,000
1.0% Income $9,500 Savings Rate
0.0%
$9,000 -1.0%
$8,500 -2.0%
$8,000 -3.0%
20
03
20
04
20
04
20
04
20
04
20
05
20
05
20
05
20
05
20
06
20
06
20
06
20
06
20
07
20
07
20
07
20
07
20
08
20
08
20
08
20
08
20
09
20
09
The increasing unemployment rate in California and the City has also placed an additional economic strain on revenue sources. The State unemployment rate as of August 2009 has risen to 12.2 percent from 7.6 percent from August 2008, an increase of 61 percent. Comparatively, the City’s current unemployment rate is 10.4 percent, and has increased from 6.4 percent, or 63 percent from August 2008 compiled statistics. These compiled statistics do not reflect the entire health of the local and State employment situation due to the number of under-employed workers in addition to the number of people who have stopped looking for work and have been eliminated from the worker pool (officially termed “discouraged workers”). The under-employed category of workers includes those who have high levels of skills who are currently in low wage jobs, and those who can only find part-time work. While not compiled on a State or local level, the variance between the official total United States unemployment rate of 9.7 percent and the unemployment rate when accounting for the under-employed and discouraged workers, 16.8 percent, illustrates the true impact of the current employment market on the state of the economy. For a rebound in consumer spending to occur, both the number of unemployed and under-employed must decrease to create a sustainable level of spending and investment.
Fiscal Year 2009 Results The economic environment on a local, State, and national level continued to decline further than was previously forecasted during FY 2009 due to a protracted decline in consumer spending, increasing unemployment rates, and other economic drivers signaling a continued economic slump. This trend created a variance between expected revenues for FY 2009 and actual revenue received in major and departmental revenues for the General Fund. The variance between projected versus actual revenue receipts in FY 2009 contributed to the net negative impact of $13.2 million between actual revenues and expenditures, including FY 2009 encumbrances.
Page | 6

The fourth quarter forecasts for FY 2009 projected a decline in sales tax of 9 percent as compared to the prior year’s comparable quarter, where actual results for the quarter showed a 15 percent decline. Additionally, transient occupancy tax was forecasted to decline 5.3 percent in the final quarter of FY 2009, with actual results showing a 16.5 percent decline over the comparable quarter from the prior fiscal year. These variances from projected results in actual receipts in the fourth quarter affected projections for major General Fund revenues for the first quarter of FY 2010 and the overall projected revenue growth for the General Fund in FY 2010. On the positive side, actual property tax receipts in FY 2009 exceeded the year-end forecasted results by 0.8 percent as compared to projections.
Based on the lower than expected revenues in sales and transient occupancy tax in FY 2009, and the continued revenue decline in some of the City’s major revenues into the first quarter of FY 2010, the budgeted major General Fund revenues have been reviewed to reflect the current economic environment. New forecasts may be prepared as updated economic information is received in FY 2010. The decline in sales and transient occupancy tax experienced in FY 2009 and the more negative growth rates in the first quarter of FY 2010 may result in revised annual growth rates for these major revenues.
The current forecasts used in the FY 2011-2015 Five-Year Financial Outlook for property tax, sales tax, and TOT have created a variance between the FY 2010 Adopted Budget and the current FY 2010 baseline used in forecasting the upcoming five-year financial performance. These adjustments to major revenues are as outlined in the following table:
Major Revenue (in millions) FY10 Adopted Budget FY 10 Revised Projection FY 10 Change in
Revenue Property Tax $382.6 $391.6 $9.0 Sales Tax $210.1 $185.4 ($25.0) TOT $75.9 $71.9 ($4.0) Safety Sales Tax $7.1 $6.5 ($1.0) TOTAL $675.7 $662.1 ($21.0)
In addition to adjustments made to major revenue sources, one-time revenues and expenses totaling $39.2 million and $9.6 million, respectively, were removed from the FY 2010 Adopted Budget revenue base to adjust for non-recurring items (See Attachment II).
State of California Budget Impacts California’s Proposition 1B (known as the Highway Safety, Traffic Reduction, Air Quality, and Port Security Bond Act), passed in 2006 for the improvement of roadway infrastructure throughout the State, has allocated and distributed $550.0 million to cities throughout the State. The second round of disbursements was expected to occur in FY 2010; however, with the deterioration in the national credit markets, the $187.0 million in Proposition 1B bonds that were to be issued by the State to raise the monies for this distribution were not sold. These bonds that were attempted to be sold on the open market in December 2008 faced difficulties due to California’s budget shortfalls and downgraded credit ratings. The State is expected to issue the bonds once the State’s credit rating and the overall debt market improves. The City of San Diego does not expect any Proposition 1B funds from this $187 million second round of State distributions in FY 2010; however, the City may receive Proposition 1B funds in FY 2011.
Page | 7

The fiscal measures the State of California recently adopted in an attempt to address the $26 billion budgetary shortfall have placed additional pressure on the City’s FY 2010 financial outlook. The fiscal measures include an estimated $1.9 billion in property tax revenues borrowed from local municipalities and $1.7 billion in funds that are being taken away from redevelopment agencies throughout the State. More specifically, the State of California’s budget borrows an estimated $36 million in property tax revenue that is due to the City for FY 2010 to aid in addressing the State’s budgetary shortfall. The property tax revenues that are being appropriated from the City will be secured by the State with a promissory note that will specify repayment of the funds, plus a designated interest rate.
The California Statewide Communities Development Authority (CSCDA) has introduced a securitization program to collateralize participating governments’ notes payable from the State of California to repay these lost revenues. The State Senate and Assembly will be reconvened for a special session to finalize details and to allow the CSCDA to operate the securitization program under SB67 and AB185. This will allow the CSCDA to acquire the full interest from local governments for the State notes payable and to borrow funds on a tax-exempt basis to pay local governments. After the State Assembly and Senate ratify their respective bills, each local government’s City Council must approve the purchase and sale agreement as set forth by CSCDA before November 6, 2009 to transfer their interest to CSCDA. Two equal payments from the CSCDA on January 15, 2010 and May 3, 2010 will then be made to all participants to repay the full amount of revenues taken from each local government.
Additionally, the State has communicated the potential need to take gas tax revenues from local governments to aid in balancing a potentially expanding projected revenue shortfall for the State of California. As of the time this forecast was prepared, no clear indication had been given by the State on whether these revenues would be appropriated. The City has budgeted $24.3 million in gas tax revenues in FY 2010. If these revenues are taken by the State, the projected General Fund deficit will increase by approximately $24.3 million in FY 2011.
GENERAL FUND REVENUES
The following section will provide details of major and departmental revenue sources in summary for the FY 2010 revenue base in addition to currently forecasted growth rates used in the Five-Year Financial Outlook.
Property Tax ($ in millions)
UNAUDITED ACTUALS
2009BUDGET
2010FORECAST
2010FORECAST
2011FORECAST
2012FORECAST
2013FORECAST
2014FORECAST
2015
$398.70 $382.60 $391.60 $391.60 $399.40 $411.40 $427.80 $444.90- - - 0.0% growth 2.0% growth 3.0% growth 4.0% growth 4.0% growth
Page | 8

PROPERTY TAX REVENUE FORECAST ($ in millions)
$310
$330
$350
$370
$390
$410
$430
$450
$470
Actuals Actuals Actuals Actuals Budget Forecast Forecast Forecast Forecast Forecast Forecast 2006 2007 2008 2009 FY 2010 FY 2010 FY 2011 FY 2012 FY 2013 FY 2014 FY 2015
Low Outlook High
*FY 2009 unaudited actuals
Based on the previously outlined revision in property tax revenue for the base year forecast used in the Five-Year Financial Outlook, the total property tax revenue forecasted for FY 2010 is $390.6 million; a decrease of $8 million or 2percent from the estimated actual receipts from FY 2009. This is due in part to a large number of negative reassessment applications granted by the County of San Diego Assessor’s Office during FY 2008 and 2009. According to the Assessor’s Office, over 100,000 total reassessment applications were received during the past two fiscal years, driving down gross assessed value in the County and City. The FY 2010 forecasted property tax revenue amount for the City is based on the estimated decline in Citywide assessed valuation provided by the County Assessor’s Office which may be adjusted upward at his discretion when the current market value of the property recovers beyond the depressed assessed value.
There is 0 percent growth forecasted in property tax revenue in FY 2011 due to the forecasted offsetting commercial and residential markets. Economists estimate that the City’s residential market will experience stabilization in average home prices and a corresponding recovery in assessed valuation in FY 2011; however, this estimated recovery in assessed values of residential properties is forecasted to be tempered by the delayed effect of the current recession on the commercial real estate market. Currently, the decline in consumer spending is leading to reduced revenues for service providers, retailers, and other commercial businesses. This decrease in revenue is causing retailers to lower inventories, reduce staffing, and close stores or cease expansion to save costs. The decline in market value of commercial properties is forecasted to lead to a decline in assessed value of commercial properties and is expected to offset any potential gain in revenue from the forecasted strengthening in the local residential market.
Page | 9

Consumer spending is anticipated to stabilize in late FY 2010 and recover in FY 2011, and property tax revenue is expected to recover in FY 2012. Property tax revenue in the Outlook is forecasted to return to a 2 percent growth rate in FY 2012, 3 percent in FY 2013, and 4 percent in FY 2014-2015. These growth rates are predicated on the assumption that the large increases in residential and commercial assessed value during the late 1990s and early 2000s will not return during the forecasted five-year period.
PROPERTY TAX REVENUE SENSITIVITY ANALYSIS
SCENARIO $ Revenue in Millions
FORECAST 2010
FORECAST 2011
FORECAST 2012
FORECAST 2013
FORECAST 2014
FORECAST 2015
LOW $ REVENUE $385.8 $380.0 $380.0 $383.8 $395.3 $407.2
% GROWTH - -1.5% 0.0% 1.0% 3.0% 3.0%
OUTLOOK $ REVENUE $391.6 $391.6 $399.4 $411.4 $427.8 $444.9
% GROWTH - 0.0% 2.0% 3.0% 4.0% 4.0%
HIGH $ REVENUE $394.5 $396.5 $406.4 $422.7 $439.6 $461.6
% GROWTH - 0.5% 2.5% 4.0% 4.0% 5.0%
The property tax revenue sensitivity analysis is based on the rate of recovery in assessed value of residential and commercial properties, as determined by the County Assessor’s Office, among other factors. As previously mentioned, the Outlook includes an increase in assessed values of residential properties in FY 2011, which will provide an offset to the forecasted decline in commercial assessed valuation; however, if the forecasted increase in residential value does not occur, a continued drop in property tax revenue is possible. The low forecast is based on flat growth in FY 2011 and a slow recovery in the remaining five-year forecast period. The high scenario is based on the assumption that the growth in residential assessed values will exceed the decline in commercial values (since residential properties comprise the great majority of the City’s total assessed valuation), providing additional revenue growth in FY 2011. The remaining five-year forecast is based on the assumption that property tax revenue will grow at a faster rate than in the outlook scenario, ending at 5 percent growth in FY 2015.
Property Transfer Tax ($ in millions)
UNAUDITED ACTUALS
2009
BUDGET 2010
FORECAST 2011
FORECAST 2012
FORECAST 2013
FORECAST 2014
FORECAST 2015
$4.6 $4.5 $4.9 $5.2 $5.4 $5.6 $5.8
- - 8.0% growth 6.0% growth 4.0% growth 4.0% growth 4.0% growth
The FY 2010 property transfer tax budget is $4.5 million, or a 1.8 percent decrease from the estimated actual receipts from FY 2009. The budgeted property transfer tax revenue for FY 2010
Page | 10

was based on the assumption that average home sale prices in the City will continue to stabilize or increase marginally (as experienced during the first six months of calendar year 2009) throughout FY 2010. The forecasted growth rate in the average home price will continue to be marginal during the fiscal year due to the number of available foreclosed properties on the market and the difficulty in obtaining financing. Moreover, the economic crisis has slowed both the number of real estate sales transactions and the market price of homes, which in turn, has materially affected property transfer tax.
Property transfer tax revenue is forecasted to experience a 1.8 percent decline in FY 2010, an 8 percent growth in FY 2011, 6 percent growth in FY 2012; and 4 percent growth in FY 2013-2015. The high growth rate in FY 2011 is due to the expectation that home prices will rise at an increasing rate in FY 2011 as home sales increase. This increase in home sales is forecasted to be in line with an overall economic recovery. The forecasted declining growth rate is based on the assumption that buying will temper as prices increase year-over-year.
Transient Occupancy Tax ($ in millions)
TOT
UNAUDITED ACTUALS
2009BUDGET
2010FORECAST
2010FORECAST
2011FORECAST
2012FORECAST
2013FORECAST
2014FORECAST
2015Total City 141.6 144.9 135.9 137.3 141.4 146.4 152.2 158.3
General Fund $74.20 $75.90 $71.20 71.9 74.1 76.7 79.7 82.9
- - -1.0% growth
3.0% growth
3.5% growth
4.0% growth
4.0% growth
TRANSIENT OCCUPANCY TAX REVENUE FORECAST ($ in millions)
$60
$65
$70
$75
$80
$85
$90
Actuals Actuals Actuals Actuals Budget Forecast Forecast Forecast Forecast Forecast Forecast 2006 2007 2008 2009 FY 2010 FY 2010 FY 2011 FY 2012 FY 2013 FY 2014 FY 2015
Low Outlook High
*FY 2009 unaudited actuals
Page | 11

The current state of economy has had a more negative effect on San Diego tourism and transient occupancy tax revenues in FY 2009. TOT revenues had continually shown positive growth from FY 1996 through FY 2008, with the trend reversing in FY 2009. Total City TOT revenues decreased by $18.7 million in FY 2009, from $159.4 million in FY 2008 to $140.7 million, and General Fund TOT revenues respectively decreased by $9.5 million, from $83.7 million to $74.2 million. The outlook for TOT revenues in FY 2010 is a continued negative growth caused by a decline in consumer discretionary spending. Based on recent FY 2009 TOT receipts and further expected reduction in tourism, projections for TOT revenue in FY 2010 have been revised downward to $71.2 million from the FY 2010 Adopted Budget figure of $75.9 million (the total Citywide FY 2010 Adopted Budget figure is $144.9 million and has been revised downwards to $135.9 million in this outlook).
According to the most recent tourism report from the San Diego Convention and Visitors Bureau (CONVIS), a 3.5 percent decline in total visitors to San Diego is expected in calendar year 2009, while overnight visits will decline by 4.9 percent. Major factors that closely correlate with TOT revenues are room demand and the average daily room rate (ADR) for hotel rooms in the City. CONVIS currently has forecasted room demand to decline by 7.5 percent, while ADR is projected to decline by 8.8 percent to $129 from $141.5 from calendar year 2008 to calendar year 2009. Tourism trends are currently forecasted to reverse in early 2010 from the negative trend in 2009. Compared with calendar year 2009, the total number of visitors to San Diego is expected to increase by 1.4 percent with overnight visits increasing by the same amount in calendar year 2010, while room demand and the ADR are expected to increase by 2.8 percent and 0.8 percent, respectively. The forecasted growth for FY 2011 based on this estimation is 1 percent, and continued growth in each fiscal year thereafter. TOT revenue is forecasted to improve annually after FY 2011 and to gradually return to historical growth rates. The growth rate is estimated to increase to 3 percent in FY 2012, 3.5 percent in FY 2013, and 4 percent in FY 2014-2015.
TRANSIENT OCCUPANCY TAX SENSITIVITY ANALYSIS
SCENARIO $ Revenue in Millions
FORECAST 2010
FORECAST 2011
FORECAST 2012
FORECAST 2013
FORECAST 2014
FORECAST 2015
LOW $ REVENUE $68.0 $67.3 $68.0 $69.7 $72.1 $75.0
% GROWTH - -1.0% 1.0% 2.5% 3.5% 4.0%
OUTLOOK $ REVENUE $71.2 $71.9 $74.1 $76.7 $79.7 $82.9
% GROWTH - 1.0% 3.0% 3.5% 4.0% 4.0%
HIGH $ REVENUE $71.9 $73.0 $75.9 $78.9 $82.9 $87.0
% GROWTH - 1.5% 4.0% 4.0% 5.0% 5.0%
The TOT sensitivity analysis is based on the varying expectations in a rebound in consumer discretionary spending. As the economic slowdown has continued, consumers have been spending significantly less on travel and tourism-related activities, which has translated into a steep decline in TOT revenue to the City. The TOT forecast built into the FY 2011-2015 Outlook is based on the assumption that tourism and business travel will begin to increase as consumer
Page | 12

spending is forecasted to increase in late FY 2010. The low scenario for TOT revenue is based on a continued decline in consumer discretionary spending through FY 2010 and the first half of FY 2011, which will have a continued impact on spending for travel and tourism-related activities. The forecasted recovery beyond FY 2011 in the low scenario is based on the assumption that discretionary spending on travel and tourism will slowly recover as consumers continue to spend conservatively. Additionally, the low scenario is based on business spending on travel and conference attendance growing at a reduced pace as businesses continue to spend less. The high scenario is based on the assumption of improved recovery in consumer spending beyond what is forecasted in the Outlook, with improvement coming in mid-FY 2010. The high scenario also forecasts a return to long-run growth rates in TOT in FY 2012 as compared to the projection in the Outlook where a recovery in consumer spending and economic growth is expected in late FY 2011.
Sales Tax ($ in millions)
UNAUDITED ACTUALS
2009BUDGET
2010FORECAST
2010FORECAST
2011FORECAST
2012FORECAST
2013FORECAST
2014FORECAST
2015
$206.2 $210.1 $185.4 $176.3 $186.0 $193.2 $200.8 $211.2-4.9% growth 5.5% growth 3.9% growth 3.9% growth 5.2% growth
SALES TAX REVENUE FORECAST ($ in millions)
$155
$165
$175
$185
$195
$205
$215
$225
$235
$245
Actuals Actuals Actuals Budget FY Forecast Forecast Forecast Forecast Forecast Forecast 2007 2008 2009 2010 FY 2010 FY 2011 FY 2012 FY 2013 FY 2014 FY 2015
Low Outlook High
*FY 2009 unaudited actuals
The downward trend in taxable sales has continued each quarter for the past twelve months and is forecasted to continue to show negative growth through the second quarter of FY 2011, flat
Page | 13

growth in the third quarter of FY 2011, and then recovering slowly over the next four quarters to long-run growth rates. The continued negative trend was expected to stabilize in the final quarter of FY 2009, but the decline has continued into the first quarter of FY 2010, exceeding a 19 percent decline as compared to prior fiscal year quarter. Based on this continued trend of large declines in consumer spending, mixed economic indicators that are not providing any sign of recovery in spending, and continual gains in the number of unemployed in the State and San Diego County, the sales tax budget was revised downwards in the Outlook in the FY 2010 base by $24.8 million. This updated projection is a 10 percent decline from FY 2009 unaudited actual receipts.
Economists forecast that taxable sales will begin to grow around mid-FY 2011, as compared to the previous fiscal year comparable quarter, and will continue to recover thereafter to a sustainable long-run growth rate. Taxable sales (not City’s sales tax revenue) are forecasted to continue to grow approximately 3 percent annually, according to a long-term forecast prepared by the State Board of Equalization. These growth rates do not directly correspond to the sales tax growth rates shown in the forecast.
The forecasted revenue amount in FY 2011 shown in the above table is forecasted to be below the prior fiscal year’s revenue amount even though an increase is projected in taxable sales. This is due to the lag effect in the triple-flip portion of sales tax revenue (the triple-flip is a property tax backfill previously established to compensate jurisdictions for a reduction in sales tax revenues that were diverted to the State to pay for educational programs). The triple-flip portion of sales tax revenue is collected in the preceding fiscal year (based on performance of taxable sales in the fiscal year when collected) and paid in the current fiscal year which causes different growth rates in the Bradley-Burns sales tax receipts and triple-flip receipts as shown in the table above. The FY 2011 forecast for sales tax reflects a decline of $57.1 million or 24.5 percent from FY 2007 actual sales tax receipts of $233.4 million.
SALES TAX SENSITIVITY ANALYSIS
SCENARIO$ Revenue in
MillionsFORECAST
2010FORECAST
2011FORECAST
2012FORECAST
2013FORECAST
2014FORECAST
2015
$ REVENUE $180.1 $167.4 $177.3 $184.0 $191.5 $199.6% GROWTH - -7.1% 5.9% 3.8% 4.1% 4.2%
$ REVENUE $185.4 $176.3 $186.0 $193.2 $200.8 $211.2% GROWTH - -4.9% 5.5% 3.9% 3.9% 5.2%
$ REVENUE $188.5 $182.1 $192.6 $201.1 $211.6 $222.7% GROWTH - -3.4% 5.7% 4.4% 5.2% 5.2%
LOW
OUTLOOK
HIGH
The sales tax revenue sensitivity analysis is based on the timing of the recovery in consumer spending on discretionary items. The growth in consumer confidence, employment figures, average per capita personal income, and savings rates, in addition to other factors, determine when a rebound in consumer spending may occur. Economists forecast that the stabilization in these drivers will occur in late FY 2010; however, an extended decline in consumer spending has persisted and has consistently exceeded forecasted estimates. The low scenario is based on a
Page | 14

delayed recovery in these indicators that occurs in mid-FY 2011 and an extended period of recovery prior to reaching long-term growth rates in revenue. The high scenario assumes that the economic indicators mentioned above will rebound in early FY 2011. The recovery of sales tax revenue growth in a higher scenario to future growth levels is slightly higher than the outlook scenario, creating greater revenue over the five-year forecast period.
Safety Sales Tax
UNAUDITED ACTUALS
2009BUDGET
2010FORECAST
2010FORECAST
2011FORECAST
2012FORECAST
2013FORECAST
2014FORECAST
2015
$6.90 $7.10 $6.20 $6.40 $6.70 $6.90 $7.30 $7.60
- - - 3.0% growth 4.0% growth 4.0% growth 5.0% growth 5.0% growth
($ in millions)
Forecasted safety sales tax amounts are based on the same factors as previously discussed for sales tax. The adjusted forecast in FY 2010 is also due to the unexpected large decline in taxable sales in the fourth quarter of FY 2009. The growth rates in safety sales tax mirror the Bradley-Burns sales tax growth rates in FY 2011–2014.
Revenue from Money & Property ($ in millions)
UNAUDITED ACTUALS
2009
BUDGET 2010
FORECAST 2011
FORECAST 2012
FORECAST 2013
FORECAST 2014
FORECAST 2015
$ 118.4 $ 123.8 $ 122.8 $ 126.2 $ 129.7 $ 133.8 $ 138.7
- - -0.8% growth 2.7% growth 2.7% growth 3.2% growth 3.7% growth
Revenue from money and property includes: franchise fees from San Diego Gas and Electric (SDG&E), and cable television providers for the use of the City’s rights-of-way; franchise fee revenue from refuse haulers based on the total amount of refuse hauled annually, interest earnings, and rents and concessions from miscellaneous City-owned properties. The FY 2010 budget for revenue from the money and property revenue category is $123.8 million, which is comprised of $73.7 million in franchise fees. Revenue from SDG&E and cable television (which make up 81.7 percent of budgeted franchise fees) are projected to grow annually at 3.0 and 2.5 percent, respectively, between FY 2011-2015. The remaining franchise fees are anticipated to grow annually at a rate of 3 percent during the same time frame. These growth rates are conservative estimates based on historical growth rates and expected increases in operating revenues from franchise fee companies.
Revenues from rents and concessions are budgeted at $46 million in FY 2010; including $28.1 million from Mission Bay rents, which are projected to grow at 1.4 percent in FY 2011-2015.
Page | 15
The remaining rents and concessions are projected to be flat in FY 2011-2015. Additionally, a one-time transfer in revenue of $1.7 million from the Concourse and Parking Garages Fund budgeted in FY 2010 has been removed as an ongoing source of revenue in the Five-Year Financial Outlook. Also included in this category are interest earnings on General Fund revenues, which have been reduced to reflect the updated General Fund reduced total revenue based on current major and departmental revenues for all five fiscal years.
Licenses & Permits ($ in millions)
BUDGET 2010
FORECAST 2011
FORECAST 2012
FORECAST 2013
FORECAST 2014
FORECAST 2015
$32.4 $29.3 $29.7 $30.2 $30.6 $31.0
- -9.4% growth 1.4% growth 1.4% growth 1.4% growth 1.4% growth
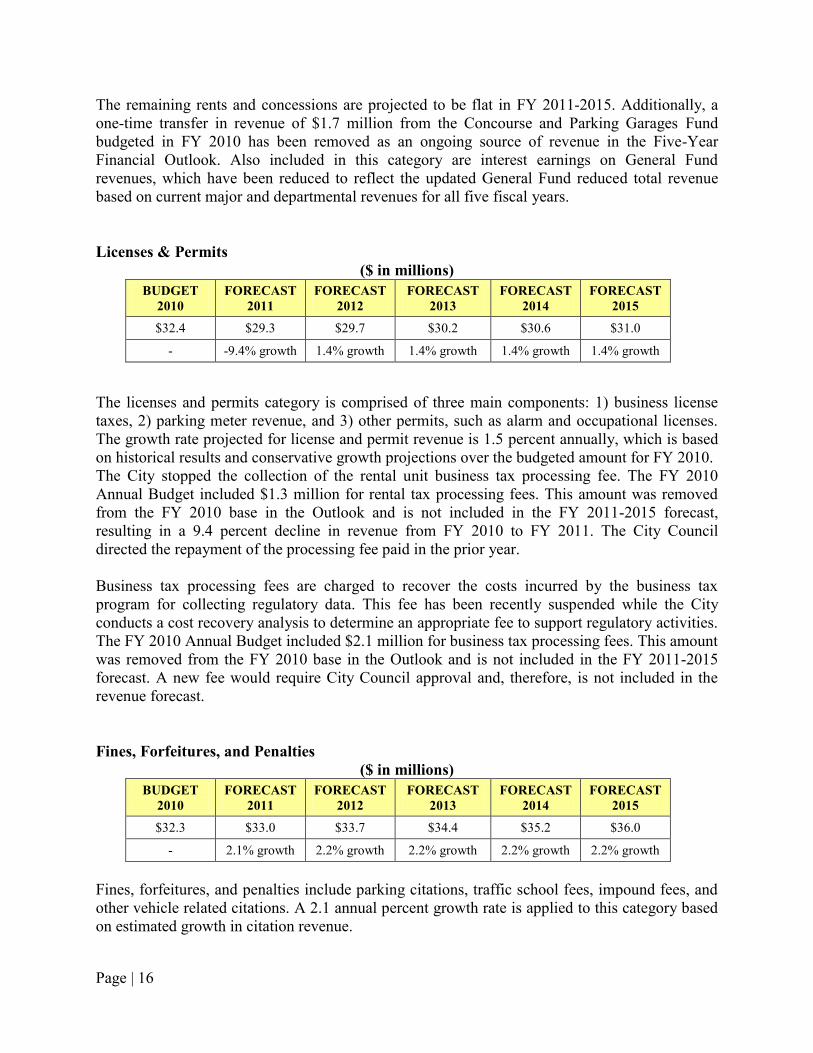
The licenses and permits category is comprised of three main components: 1) business license taxes, 2) parking meter revenue, and 3) other permits, such as alarm and occupational licenses. The growth rate projected for license and permit revenue is 1.5 percent annually, which is based on historical results and conservative growth projections over the budgeted amount for FY 2010. The City stopped the collection of the rental unit business tax processing fee. The FY 2010 Annual Budget included $1.3 million for rental tax processing fees. This amount was removed from the FY 2010 base in the Outlook and is not included in the FY 2011-2015 forecast, resulting in a 9.4 percent decline in revenue from FY 2010 to FY 2011. The City Council directed the repayment of the processing fee paid in the prior year.
Business tax processing fees are charged to recover the costs incurred by the business tax program for collecting regulatory data. This fee has been recently suspended while the City conducts a cost recovery analysis to determine an appropriate fee to support regulatory activities. The FY 2010 Annual Budget included $2.1 million for business tax processing fees. This amount was removed from the FY 2010 base in the Outlook and is not included in the FY 2011-2015 forecast. A new fee would require City Council approval and, therefore, is not included in the revenue forecast.
Fines, Forfeitures, and Penalties ($ in millions)
BUDGET 2010
FORECAST 2011
FORECAST 2012
FORECAST 2013
FORECAST 2014
FORECAST 2015
$32.3 $33.0 $33.7 $34.4 $35.2 $36.0
- 2.1% growth 2.2% growth 2.2% growth 2.2% growth 2.2% growth
Fines, forfeitures, and penalties include parking citations, traffic school fees, impound fees, and other vehicle related citations. A 2.1 annual percent growth rate is applied to this category based on estimated growth in citation revenue.
Page | 16

Revenues from Other Agencies ($ in millions)
BUDGET 2010
FORECAST 2011
FORECAST 2012
FORECAST 2013
FORECAST 2014
FORECAST 2015
$12.4 $12.2 $12.3 $12.4 $12.5 $12.7
- -1.1% growth 0.7% growth 0.7% growth 1.0% growth 1.1% growth
The revenues from other agencies category include federal and State grants and motor vehicle license fees (MVLF). No growth is assumed for State and federal grants, and allocations are currently budgeted at flat growth for the forecasted period. In addition, the City is expected to receive funding from the federal stimulus package which includes such areas as: general infrastructure, transportation, water, housing, public safety, and energy. However, no funding from the federal stimulus package will support the General Fund operating budget.
MVLF is currently budgeted at $3.9 million in FY 2010, with 2 percent growth in revenue in FY 2011–2013 and increases to 3 percent growth in FY 2014-2015. Moderate growth in MVLF is currently forecasted due to uncertainty in the correlation between an economic recovery and new vehicle purchases. As the economy recovers, governmental incentives in addition to incentives from manufacturers will be reduced and consumers may choose to spend discretionary income on other purchases other than new vehicles. Additionally, the level of impact on revenue from the “cash-for-clunkers” program and other initiatives taken by vehicle manufacturing companies are currently not known.
Charges for Current Services ($ in millions)
BUDGET 2010
FORECAST 2011
FORECAST 2012
FORECAST 2013
FORECAST 2014
FORECAST 2015
$138.6 $132.7 $135.2 $137.7 $140.3 $142.9
- -4.3% growth 1.9% growth 1.9% growth 1.9% growth 1.9% growth
The revenue forecasted in charges for current services is comprised of charges for services provided to the public and other City funds. The major components in this category in FY 2010 budget are Engineering Department’s services to other City funds totaling $30.8 million and general government services totaling $35.6 million. See Attachment IV for the FY 2010 Adopted Budget breakout of this category.
The decline in this revenue category from FY 2010 to FY 2011 is due to the elimination of $8.3 million in one-time revenues in the Outlook forecast (see Attachment II for breakout). The annual growth rate for revenue in this category is 1.9 percent based on expected levels of service provided to other departments and historical growth in reimbursement amounts.
Page | 17

Transfers from Other Funds ($ in millions)
BUDGET 2010
FORECAST 2011
FORECAST 2012
FORECAST 2013
FORECAST 2014
FORECAST 2015
$108.5 $78.0 $82.8 $84.6 $79.8 $79.1
- -28.1% growth 6.2% growth 2.1% growth -5.6% growth1 -0.9% growth2
1- Due to the elimination of $11. 3 million CCDC payment for PETCO Park debt service, reducing the TOT transfer to the General Fund 2- Due to the elimination of $4.5 million Unified Port District payment for Convention Center debt service, reducing the TOT transfer to
the General Fund
Transfers from other funds includes the one cent transfer from the Transient Occupancy Tax Fund (which is directed by the City Council’s discretion), TransNet and Gas Tax revenues, securitized tobacco revenues, and other miscellaneous revenue sources. The forecast for FY 2011 excludes $25.7 million in one-time revenues that have been eliminated from the forecast (see Attachment II for breakout). The growth rate for this category varies from the prior fiscal year based on changes in the amount of transferred revenue from the Transient Occupancy Tax Fund.
The total amount of transient occupancy tax revenue transfer is based on the growth in total TOT funds as previously discussed. However, beginning in FY 2014, the agreement with the CCDC for PETCO Park debt will expire and $11.3 million in City TOT revenue will be required to pay this portion of debt service and will be unavailable to the City during FY 2014 and FY 2015. Additionally, in FY 2015, the Unified Port of San Diego ceases payments on outstanding Convention Center debt and as a result of paying this obligation our of the TOT fund, the $4.5 million payment reduces the TOT transfer amount to the General Fund.
GENERAL FUND EXPENDITURES
General Fund expenditures are comprised of personnel and non-personnel expenses, including funding for the City’s eight significant areas.
The Outlook continues funding for the Eight Significant Areas as the City of San Diego remains committed to restoring fiscal stability, addressing its financial obligations, and meeting its responsibility to provide essential core services to San Diego residents. The following section describes each of the Eight Significant Areas and funding for each priority.
General Fund Reserves The General Fund Reserves are comprised of emergency, appropriated, and unappropriated reserves. The City Reserve Policy requires that the General Fund reserves equal 8 percent of General Fund revenues by FY 2012. Contributions to the reserves are forecast to meet Policy requirements to maintain adequate reserves during emergencies. The 2011-2015 Outlook assumes a contribution of $4.2 million in FY 2011 to reach the required target rate of 7.5 percent. The following table contains contributions forecasted to meet the General Fund Reserve policy goal of 8 percent.
Page | 18

General Fund Reserve FORECAST 2011
FORECAST 2012
FORECAST 2013
FORECAST 2014
FORECAST 2015
Operating Revenue ($ millions) $1,062 $1,094 $1,125 $1,157 $1,197 Reserve Policy Target 7.5% 8.0% 8.0% 8.0% 8.0% Contribution to Reserves ($ millions) $4.2 $7.9 $2.5 $2.5 $3.2 Reserve Balance ($ millions) $79.6 $87.5 $90.0 $92.5 $95.7
Workers’ Compensation Fund Reserve The City works to build sufficient reserves to pay accrued and forecasted liabilities, based on annual valuation reports prepared by an independent actuary. The City’s workers’ compensation liabilities are estimated annually based on changes in claims experience and updated actuarial information. The City’s total outstanding liability changes annually, based on new claims and short-term liabilities. Based on the latest estimate, as of June 30, 2009, there is a $148.2 million worker’s compensation liability in filed claims Citywide, of which $118 million is attributable to the General Fund.
According to the City’s Reserve Policy, dedicated reserves equal to 50 percent of the value of outstanding claims shall be maintained no later than FY 2014 in order to properly fund current and future liabilities. The following table contains the total annual reserve contribution forecasted in the FY 2011-2015 Outlook to meet the Workers’ Compensation Reserve Policy goal.
Workers’ Compensation BUDGET 2010
FORECAST 2011
FORECAST 2012
FORECAST 2013
FORECAST 2014
FORECAST 2015
Workers’ Comp Reserve Policy Target 22% 30% 35% 42% 50% 50% Contributions– Total City ($ millions) $5.0 $10.2 $7.4 $10.4 $11.9 Contributions– GF only ($ millions) $4.0 $8.1 $5.9 $8.3 $9.4 -
Public Liability Fund Reserve The City continues to build sufficient reserves to pay outstanding and forecasted obligations, similar to the Workers’ Compensation Fund Reserve. The latest draft valuation prepared as of June 30, 2009, indicated that the total public liability that the City’s General Fund faces is currently $129.4 million.
The City’s Reserve Policy calls for 50 percent of outstanding claims to be placed in reserves for General Fund liabilities no later than FY 2014. The following table contains the reserve goals and annual contributions forecasted in the FY 2011-2015 Outlook. The contributions forecasted for FY 2011-2015 needed to meet the reserve target are as follows:
Public Liability BUDGET 2010
FORECAST 2011
FORECAST 2012
FORECAST 2013
FORECAST 2014
FORECAST 2015
Public Liability Reserve Policy Target 15% 25% 35% 45% 50% 50% Contributions– GF only ($ millions) $7.1 $15.2 $12.9 $12.9 $6.5 -
Page | 19

The following chart summarizes the contributions from the above-mentioned reserves.
FORECASTED RESERVE CONTRIBUTIONS ($ in millions)
$0
$2
$4
$6
$8
$10
$12
$14
$16
Budget 2010 Forecast FY Forecast FY Forecast FY Forecast FY Forecast FY 2011 2012 2013 2014 2015
Public Liability Fund Reserve
Workers' Compensation Fund Reserve
General Fund Reserves
Deferred Maintenance Deferred maintenance and related capital improvements include needed repairs to City facilities as well as repairs and improvements to streets, sidewalks, and storm drains. In FY 2009, the City issued $103 million in bonds for deferred maintenance. It is estimated that the City’s total deferred maintenance needs may be $800 to $900 million, not including Water and Wastewater projects.
Proposition 1B, approved by California voters in November 2006, allocates funding to local governments for projects that improve local roads and highways. Proposition 42, approved by voters in 2002, dedicates a portion of the sales tax on gasoline to also fund transportation projects. The City did not budget any Proposition 1B funding in FY 2010 due to a change in the program that changed allocation of funds to local jurisdictions. Based on the latest available information from the State, the City may receive a disbursement of $19.6 million from the State in future fiscal years, which would be used to complete new street projects that are not currently included in future fiscal year expense amounts. It is unknown when this disbursement would occur from the State due to their current fiscal shortfall.
The City expects to refund current outstanding deferred maintenance bonds in FY 2010 and issue new deferred maintenance bonds in FY 2011 and FY 2013, dependant on completing existing projects on current schedules, and the full and timely utilization of capital on new projects. Debt service payments are forecasted for FY 2012-2015 as follows:
Page | 20

Deferred Maintenance Bond Issuances FY 2010 FY 2011 FY 2012 FY 2013 FY 2014 FY 2015
2009A Bonds (Private Placement) 4.9$
Proposed Issuances
2010 Refunding Bonds 9.5$ 9.5$ 9.5$ 9.5$ 9.5$
2011 Bonds 9.2$ 9.2$ 9.2$ 9.2$
2013 Bonds 9.2$ 9.2$
Total $4.9 $9.5 $18.7 $18.7 $27.9 $27.9
Estimated Annual Debt Service ($million)
The amount budgeted in FY 2010 is $4.9 million for existing bonds that will be refunded with the first issuance of bonds listed above. The amount budgeted in each fiscal year of the Outlook is the incremental portion of debt service over this $4.9 million budgeted amount.
Storm Water Runoff Compliance Compliance with federal and State of California storm water regulations imposes an expenditure obligation on the City. In FY 2010, $37.7 million was budgeted for the Storm Water Department.
The Storm Water Department believes it will be able to maintain compliance with the existing municipal permit based on current funding levels. The permit is due to expire in 2012, and a new permit with potentially more regulations will be issued by the Regional Water Quality Control Board (RWQCB) in January 2013. The RWQCB has recently released a list of new mandates that will affect the City. These new mandates may potentially add significant costs for compliance, and alternatives are currently being reviewed for cost-effective ways to stay within these limits.
The actual needs and funding requirements for storm water compliance are currently under review, and if these do not align with the level of funding currently budgeted, a potential budget adjustment may take place and the Outlook will be updated accordingly.
American with Disabilities Act Compliance The Americans with Disabilities Act (ADA) requires that the facilities and infrastructure of all public and private agencies be universally accessible. Capital improvement projects supported by the ADA budget are funded through a portion of proceeds from the sale of City-owned real estate assets. Per the City Charter requirement, the proceeds from real estate sales cannot be used to support General Fund operations, but should be deposited in the Capital Outlay Fund and are restricted for capital projects. To date, the City has sold assets totaling nearly $34 million. The City has been allocating $10 million per fiscal year for ADA projects with the proceeds from real estate asset sales beginning in FY 2008. For FY 2008 projects, $5.1 million has been expended of the $13.8 million in projects (combined $10 million in land sales and $3.8 million in CDBG projects), while $1.8 million of $11.3 million (CDBG $1.3 million and $10 million in land sales) in projects for FY 2009 has been expended. In FY 2010, the ADA budget is $10.0 million. As the target for the sale of City-owned properties remains $10.0 million through FY 2015, the 2011-2015 Outlook assumes that allocations for ADA projects will be $10.0 million for FY 2011-2015.
Page | 21

Pension Plan A new pension plan was negotiated by the Mayor and the impacted labor organizations, and was approved by the City Council in FY 2009. This new plan will lower the City’s pension related risk and expenses in future years. In addition, the City modified the retirement factor for sworn police personnel hired after July 1, 2009 to 3 percent at age 55 from 3 percent at age 50. The City’s savings from the new pension plan will be reflected in the actuarial valuation to determine future ARC payments. The City’s FY 2010 ARC payment is $154.2 million, with the General Fund portion of $125.3 million as determined by the San Diego City Employees’ Retirement System (SDCERS) actuary. On September 18th, 2009, SDCERS’ actuary, Cheiron, released projected ARC payments for future fiscal years based on actuarial methodologies determined by the SDCERS’ Board.
The forecasted ARC payments for FY 2011-2015, shown in the table below, do not take into account the following changes that took effect on July 1, 2009: 1) the reduced DROP interest rate for retirees; 2) lower budgeted salaries for FY 2010 based on negotiated savings with individual bargaining units; and 3) savings from the new pension plan for new hires. One of the variables in the forecasted ARC is the assumption that annual pay increases by 4.25 percent. For FY 2010, salary increases have been frozen for all City employees. The forecasted ARC for FY 2011 shown in the table below may be lower by approximately $12 million Citywide ($9.7 million for the General Fund) since the assumption used in the forecast provided by Cheiron does not reflect the salary freeze for FY 2010. A new valuation to be used for the development of the FY 2011 budget is expected at the end of calendar year 2009.
The FY 2010 budget and FY 2011-2015 forecasts for the City’s ARC payments are presented in the following table.
ARC ($ millions) BUDGET 2010
FORECAST 2011
FORECAST 2012
FORECAST 2013
FORECAST 2014
FORECAST 2015
Citywide ARC Payment $154.2 $224.8 $250.9 $274.9 $297.1 $318.1 General Fund ARC Portion $125.3 $182.0 $203.1 $222.6 $240.5 $257.5
Page | 22

RETIREMENT ARC CONTRIBUTIONS (in millions)
$350
$0
$50
$100
$150
$200
$250
$300
Budget 2010 Forecast FY Forecast FY Forecast FY Forecast FY Forecast FY 2011 2012 2013 2014 2015
Citywide Pension Payment General Fund Pension Payment
Other Post-Employment Benefits Other Post-Employment Benefits (OPEB) represent the cost for retiree healthcare. The City has been prefunding future liabilities for the past two years in addition to funding the pay-as-you-go portion that provides for annual healthcare coverage for City retirees. As of the June 30, 2009 actuarial valuation, the FY 2011 OPEB ARC is $120.3 million for the City’s post-retirement medical benefit program. The valuation assumed a 6.69 percent discount rate and a total actuarial accrued liability of $1.3 billion. The Outlook assumes that the City will continue to fund the current year post-employment healthcare obligation (pay-as-you-go) assuming an average growth of 12.6 percent for FY 2011-2015. Additionally, the Outlook assumes that the City will contribute $25.0 million annually to the CalPERS Employer Retiree Benefit Trust to pre-fund future liabilities. Although, not legally required, if the City was to fully fund the OPEB ARC in FY 2011, an additional contribution of $58.2 million Citywide ($40.4 million General Fund) will be needed.
OPEB ($ millions) BUDGET 2010
FORECAST 2011
FORECAST 2012
FORECAST 2013
FORECAST 2014
FORECAST 2015
Citywide OPEB $57.1 $62.2 $67.3 $72.5 $77.9 $83.2 General Fund OPEB Portion $39.7 $43.2 $46.8 $50.4 $54.2 $57.8
Salaries and Wages Between FY 2011 and FY 2015, there is no projected growth in salaries and wages. In FY 2011 salaries and wages are funded at the FY 2010 budgeted level of $516.1 million. If salaries should increase by 1 percent, an estimated $5.2 million increase in annual salary and fringe costs will result in the General Fund.
Page | 23

Fringe Benefits Fringe expenditures consist of fixed and variable costs to provide employee benefits. These include: retirement, other post-employment retiree health care benefits, flexible benefits, workers’ compensation, long-term disability, supplemental pension savings plan, employee offset savings, Medicare, risk management administration, unemployment insurance, and unused sick leave. Of these expenditures, retirement is the most significant component of the total fringe cost.
Excluding retirement, workers’ compensation, and the post-employment healthcare obligation (pay-as-you-go), the remaining fringe expenditures are expected to remain flat from FY 2011-2015.
Vacancies During the course of a year, departments accumulate savings in personnel expenditures through under-filled, newly-filled, and vacant positions. Vacant positions may arise from attrition, leaves of absence, and other factors. In FY 2010, the budgeted vacancy savings is $36.0 million, based on a 3.5 percent vacancy factor. The vacancy savings factor used in the model for the five year forecast period is based on the assumption that there will be more stability in staffing levels in later years.
Vacancy Factor BUDGET 2010
FORECAST 2011
FORECAST 2012
FORECAST 2013
FORECAST 2014
FORECAST 2015
Vacancy Factor ($ millions) $36.0 $38.3 $31.3 $26.5 $27.1 $27.5 Vacancy Factor Rate (%) 3.5 4.4 3.5 2.9 2.9 2.9
The current FY 2011 vacancy factor of 4.4 percent for the entire General Fund is based on the expectation that the current hiring freeze can increase savings over the FY 2010 budgeted amount. The vacancy factor then decreases in FY 2012 as this hiring freeze realizes cost savings and reduces the ability to keep open positions vacant without affecting service levels. Finally, in the last three fiscal years the vacancy factor rate decreases to 2.9 percent.
Retirement Offset Contribution and Employee Offset Payment The employee offset payment and retirement offset contribution paid by the City on an annual basis were negotiated between the City and its labor groups. The Retirement Offset amount paid by the City for retirement contributions was reduced through labor negotiations to achieve savings to balance the projected revenue shortfall in FY 2010. The amounts budgeted in FY 2010 reflect these negotiated savings, and carry through the five-year forecast period. Additionally, these contributions are calculated as a percent of salaries and wages, and consequently do not increase during the forecast period due to the assumed 0 percent growth in salaries.
($ millions) BUDGET 2010
FORECAST 2011
FORECAST 2012
FORECAST 2013
FORECAST 2014
FORECAST 2015
Retirement Offset Contribution $5.2 $5.2 $5.2 $5.2 $5.2 $5.2 Employee Offset Payment $10.0 $10.0 $10.0 $10.0 $10.0 $10.0
Page | 24

McGuigan Settlement The City has another retirement funding commitment from a settlement agreement reached in September 2006 between the City of San Diego and William J. McGuigan (also known as the “McGuigan Settlement”). McGuigan filed the class action suit related to underfunding of the pension system in 2005. Under this settlement, the City was obligated to pay $173.0 million into SDCERS by June 2011 to address previous underfunding, which occurred between 1996 and 2005. Funding contributions through securitization of future tobacco revenues, actual tobacco revenue receipts, and payments in excess of ARC City contributions result in a remaining obligation of $39.1 million, of which $31.7 million needs to be paid from the General Fund.
New Pension Plan Savings In an effort to reduce the long-term liability and cost of the pension system, the City negotiated a new pension plan with the City’s labor organizations. Pension savings are expected from the elimination of incentives and subsidies for early retirement resulting in lower pension plan costs to achieve savings for taxpayers. In addition, the new plan provided for fair and reasonable retirement benefits to recipients at age 65, and the creation of more equitable investment risk-sharing between the City and members of the pension system. The 2011-2015 Outlook forecasts the following General Fund savings from this pension reform: $1.1 million in FY 2011, $1.9 million in FY 2012, $2.6 million in FY 2013, $3.3 million in FY 2014, and $4.2 million in FY 2015.
Flexible Benefits Flexible Benefits is an Internal Revenue Service (IRS) qualified plan designed to allow employees to choose their health benefits. Costs are variable with respect to positions and increase as the number of positions increases. Growth is not expected between FY 2011-2015 under the assumption that growth in positions will be limited. In FY 2010, $39.0 million was budgeted; the flexible benefits budget is expected to remain at this level through FY 2015.
Accrued Leave Liability In the past, the City had not completely funded the additional expense of unpaid leave given to employees who end their employment with the City with accrued balances. While a portion of future leave liability expense has been absorbed in departmental budgets, there will be a large number of employees with high leave balances expected to retire over the next several years. The FY 2010 Annual Budget includes $4.3 million and is based on anticipated retirements from the Deferred Retirement Option Plan (DROP) within the fiscal year and the projected value of the accrued leave balance. The forecast declines to $2.7 million in FY 2011, increases to $16.0 million in FY 2014, and declines to $2.9 million based on the expected number of retirees.
($ millions) BUDGET 2010
FORECAST 2011
FORECAST 2012
FORECAST 2013
FORECAST 2014
FORECAST 2015
Accrued Leave Liability $4.3 $2.7 $4.9 $6.4 $16.0 $2.9
The figures in the above table represent approximately 800 employees with DROP retirement dates scheduled between FY 2011-2015.
Page | 25

Supplies and Services, Information Technology, Energy and Utilities, Equipment Outlay All non-personnel expenditures can be classified into the four expenditure categories of supplies and services, information technology, energy and utilities, and equipment outlay. The FY 2010 budget for these categories totals $344.2 million. Annual growth is based on an estimated inflation rate of 1.5 percent for supplies and services, 0 percent for information technology, 5 percent for energy and utilities, and 0 percent for equipment outlay.
($ millions) ANNUAL GROWTH
FORECAST 2011
FORECAST 2012
FORECAST 2013
FORECAST 2014
FORECAST 2015
Supplies & Services 1.5% $264.4 $270.9 $275.0 $277.6 $284.6 Information Technology 0% $36.7 $36.7 $36.7 $36.7 $36.7 Energy & Utilities 5% $29.8 $31.3 $32.8 $34.5 $36.2 Equipment Outlay 0% $9.9 $9.9 $9.9 $9.9 $9.9
Information Technology
Starting in FY 2007, the City has been implementing technology improvements to bring its information systems up to current levels and setting standards to reduce overall costs. Over the last four fiscal years, time and cost saving efforts have included implementing standard software tools to centrally manage all PC systems, standardized core software for PC systems, and upgrading to Microsoft Office 2007 to take advantage of its features and integration with other products. By standardizing on a core set of PC software products, in combination with using standard, business-class PC hardware, the ongoing support costs are reduced due to increased efficiency with standardized systems. Additionally in 2009, the City began implementation of it first Enterprise Resource Planning (ERP) system, called OneSD, using the SAP software suite to manage Citywide financial and procurement functions under one software platform. The initial implementation will be completed in FY 2010 with the addition of human resources management, Public Budget Formulation. Over the next two years, the City will continue to implement additional ERP modules to further integrate business processes within OneSD for more efficient operations.
In 2009, the City also began the process of selectively sourcing its Information Technology (IT) services by opening competitive bids, with the goal of maintaining or increasing service performance levels at the same or lower costs. Selected IT services include the Help Desk and Desktop Support, SAP as-needed technical support, Telecommunications, and Data Center. Other services will be evaluated in the future. These bidding efforts and implementation of these services are expected to continue into FY 2012, and account for the projected 0 percent growth in General Fund IT expenses.
New Facilities Additional costs for new facilities for the Fire-Rescue and Park and Recreation Departments are included in this Outlook as outlined below:
Fire Department FY 2012 – FY 2015 - $100,000 per fiscal year for additional Bay Side station operating costs FY 2012 – $367,323 Mission Valley station grant match
Page | 26

Park and Recreation Department: FY 2011 – $557,108 Additional 5.49 FTEs FY 2012 – $1,255,223 Additional 8.42 FTEs FY 2013 – $519,545 Additional 6.36 FTEs FY 2014 – $646,144 Additional 4.84 FTEs
There are no new police stations scheduled to open within the next five years; therefore, no additional costs for new planned Police Department facilities are included in the Outlook. Construction of a new downtown library is currently under consideration and additional operating cost of the new library ($2 million annually) will be supported by donation for the first five years of operation.
Convention Center Expansion The impact of the proposed expansion of the Convention Center to the General Fund has not been included due to the uncertainty associated with development options and other specific details.
Civic Center Development Feasibility information and various analyses for the development of a new Civic Center are currently being reviewed by the City. The newly constructed Civic Center would consist of a high-rise tower to replace the City Administration Building (CAB), Concourse, City Operations Building (COB), and the Parkade. This newly constructed property would also consolidate all City employees who are in the downtown area, currently in leased space, into one property. For the Five-Year Financial Outlook, economic and financial analyses with three scenarios have been performed to determine the fiscal impact of different development options to the City. Each scenario evaluates the need to complete deficient maintenance items in the City-owned buildings mentioned above. The analysis was based on the financial analysis report prepared by Jones, Lang, LaSalle, a real estate consulting firm; and the facilities condition and engineering report prepared by DMJM, Inc., an engineering firm. The three scenarios that have been analyzed and reviewed by the City for the Five-Year Financial Outlook are discussed below, with the corresponding impact on General Fund expenditures for each scenario at bottom.
Scenario 1 is based on the assumption that the new Civic Center construction will begin in FY 2011 and the newly constructed property would be delivered in FY 2014, with little to no additional costs incurred above currently budgeted items. No capital outlays for deficient maintenance items for City-owned properties are included due to the short time frame in which the new property would be delivered. This scenario is the same as the current “baseline” five-year financial forecast with the same revenue shortfalls. The only additional cost added for this scenario is an estimated $1.3 million to move employees and equipment from City owned and leased properties into the new Civic Center building.
Scenario 2 is also based on the assumption that the new Civic Center construction will begin in FY 2011 and be delivered in FY 2014. However, this scenario incorporates the funding for the deficient maintenance items outlined in the facility condition report’s short time frame scenario. This includes fire sprinkler installation and spot asbestos treatment in the City Administration Building, in addition to mechanical, plumbing, and ADA compliance outlays in 2011. This
Page | 27

scenario then assumes that the costs for deferred maintenance items outlined in the deficient maintenance items report (Five-year scenario) would be undertaken for the Parkade structure in FY 2011 and COB in FY 2012. (The pro-rata cost incurred to the General Fund in this scenario is based on the General Fund department occupancy in COB). No costs are incurred on the Concourse building in this scenario due to the property’s expected demolition and the construction of the new Civic Center building on the same plot of land for delivery in FY 2014.
Scenario 3 assumes that construction on the new Civic Center building would not begin during the forecasted five-year time frame. This “Hold Steady” scenario assumes that the costs for deficient maintenance items shown in the facility condition report over the long-range scenario would be undertaken for all four City-owned properties. (The costs added to this scenario for maintenance and life/safety items are based on the General Fund’s occupancy percentage for each property: CAB 100 percent, COB 37 percent, Concourse 77 percent, Parkade 100 percent.) These deficient items include sprinkler installation and asbestos spot treatment in CAB in addition to mechanical, plumbing, and electrical repair expenditures in all four properties. It is assumed for this scenario that expenditures for repairs to CAB would occur in FY 2011; the City Operations Building in FY 2012; and the Concourse and Parkade in FY 2013.
This scenario also includes the effect of renewing leases in other City-occupied properties during FY 2013-2014 as compared to their previous rental rates (based on expected market conditions during renewal). This assumes that the City would negotiate an extended lease term for each property currently occupied to be co-terminus with the completion of the new Civic Center building. Discounting by 5 percent, the renewal rates outlined in the letters-of-intent that the Real Estate Assets Department has received from the respective landlords of each occupied property still result in increased rental costs due to the low rental rates that the City currently has in each property. These current low rates are attributable to when the leases were created and the low cost of tenant improvements in each property.
Scenario 4 includes completing only the fire and life safety items described in the prepared facilities condition report. The total cost for asbestos spot removal and the installation of fire sprinklers in the City Administration Building totals $5.6 million in FY 2011 and no additional costs incurred for other deferred maintenance items or fire/life safety in other City-owned buildings.
The additional cost for each scenario outlined above is as follows:
ITEM ($ millions) FORECAST 2011
FORECAST 2012
FORECAST 2013
FORECAST 2014
FORECAST 2015
Scenario 1 - - - $1 -Scenario 2 $13 $1 - - -Scenario 3 “Hold Steady” $17 $2 $13 - $1 Scenario 4 $5.6 - - - -
The costs for earthquake retrofitting for the City Administration Building, City Operations Building, Concourse Building, and the Parkade have not been considered in any of the scenarios outlined above. If this retrofitting is to be completed, an additional cost of approximately $50 million would be added to the five-year forecasted time frame.
Page | 28

The costs outlined above may not impact the General Fund if the repairs to City owned building extend the useful life of the property. If the repairs undertaken extend the life of the building, deferred maintenance funds discuss previously in the outlook may be used to complete the repairs. However, if the repairs do not qualify in extending the life of the property, then the expended funds would be taken out of the General Fund to comply with life and safety regulations. Currently, scenario 4 is included in the outlook, and is fully paid for by the General Fund.
Election Costs The cost for City elections in FY 2011-2015 have also been included in supplies and services to account for additional expenses incurred during these years.
CONCLUSION
This Five-Year Financial Outlook is a comprehensive, long-range analysis of the City’s General Fund revenues and expenditures and it serves as a basis for the preparation of the City’s annual budget.
This long-term forecast identifies structural challenges facing the City. Given the magnitude of the obligations needed to be addressed to close the projected revenue shortfall, service levels will be affected in FY 2011. To address the scope of the problem presented in this Outlook, a dialogue with elected officials, staff, labor representatives, as well as the public will be needed to formulate the course of action to address the projected deficit and identify potential solutions.
Potential solutions for the revenue shortfall forecasted in FY 2011 are currently being analyzed. There are two options to approach this forecasted shortfall in FY 2011: 1) addressing the shortfall with mid-FY 2010 budget adjustments; or 2) addressing the shortfall with spending cuts that would be enacted as part of the FY 2011 annual budget process.
The first option would be to adopt an 18-month budget that would be implemented in mid-FY 2010. This would require the Council to reopen the fiscal year 2010 budget and make the necessary budget reductions mid- fiscal year. Those savings would be carried forward into FY 2011. This would offset the need for a larger reduction in FY 2011. This 18-month solution would result in expenditure reductions of approximately $120 million in FY 2010 mid-year or approximately 1,620 Full-Time Equivalent positions (FTEs).
The second option would be to reduce staffing and programs during the normal FY 2011 budget process. This solution would then require more significant cuts in staffing and programs in FY 2011. Approximately an additional $59 million or 800 FTEs ($179 Million and 2,420 FTEs in total) with additional associated service reductions would need to be eliminated to achieve a balanced budget in FY 2011.
As solutions are identified to address the City’s fiscal challenges, they will be incorporated into subsequent versions of the Financial Outlook.
Page | 29

FORECAST FORECAST FORECAST FORECAST FORECASTGeneral Fund Revenues 2011 2012 2013 2014 2015Property Tax (incl. Transfer Tax) 396.4$ 404.5$ 416.7$ 433.4$ 450.7$ Sales Tax (incl. Safety Sales) 182.7 192.7 200.2 208.1 218.8 Transient Occupancy Tax 71.9 74.1 76.7 79.7 82.9 Franchise Fees 75.0 76.7 78.5 80.3 82.2 Motor Vehicle Licensing Fees 4.0 4.1 4.1 4.3 4.4 Licenses and Permits 29.3 29.7 30.2 30.6 31.0 Fines, Forfeitures & Penalties 33.0 33.7 34.4 35.2 36.0 Rents and Concessions 44.6 45.0 45.4 45.8 46.2 Revenue from Other Agencies 8.3 8.3 8.3 8.3 8.3 Charges for Current Services 132.7 135.2 137.7 140.3 142.9 Transfers from Other Funds 78.9 84.2 85.9 81.6 81.2 Interest Earnings 3.2 4.5 5.7 7.6 10.3 Other Revenue 1.6 1.6 1.6 1.6 1.6 TOTAL GENERAL FUND REVENUES 1,061.6$ 1,094.1$ 1,125.4$ 1,156.8$ 1,196.6$
General Fund Expenditures 2011 2012 2013 2014 2015Salaries & Wages 547.8$ 547.8$ 547.8$ 547.8$ 547.8$ Salary Vacancy Savings Factor (36.0) (36.0) (36.0) (36.0) (36.0) Accrued Leave Liability 4.3 4.3 4.3 4.3 4.3 Retirement 182.0 203.1 222.6 240.5 257.5 Retirement Offset 5.2 5.2 5.2 5.2 5.2 Employee Offset Savings 10.0 10.0 10.0 10.0 10.0 OPEB/Retiree Health 39.7 39.7 39.7 39.7 39.7 Fringe (w/o Ret or Flex) 50.5 50.5 50.5 50.5 50.5 Flexible Benefits 39.0 39.0 39.0 39.0 39.0 Supplies & Services 264.4 270.9 275.0 277.6 284.6 Information Technology 36.7 36.7 36.7 36.7 36.7 Energy / Utilities 29.8 31.3 32.8 34.5 36.2 Equipment Outlay 9.9 9.9 9.9 9.9 9.9 TOTAL GENERAL FUND EXPENDITURES 1,183.5 1,212.6 1,237.7 1,259.9 1,285.7
Major Project Expenditures1
OPEB Contribution 3.5 7.1 10.7 14.5 18.1 Deferred Maintenance Debt Service 4.6 13.8 13.8 23.0 23.0 Accrued Leave Liability (1.6) 0.6 2.0 11.7 (1.4) Vacancy Savings Factor (2.4) 4.6 9.4 8.9 8.4 City Hall Fire Sprinkler System 5.5 - - - - New Facilities 0.6 1.7 0.6 0.7 0.1 General Fund Reserves 4.2 7.9 2.5 2.5 3.2 TOT Discretionary Above 1 Cent - (1.3) (2.9) - - Workers' Compensation Fund 4.1 1.9 4.3 5.5 - Public Liability Fund 8.1 5.8 5.8 (0.6) - New Pension Plan Savings (1.1) (1.9) (2.6) (3.3) (4.1) McGuigan Settlement 31.7 - - - - TOTAL MAJOR PROJECT EXPENDITURES 57.2 40.3 43.7 62.9 47.4
TOTAL GENERAL FUND EXPENDITURES 1,240.7$ 1,253.0$ 1,281.4$ 1,322.7$ 1,333.0$
GENERAL FUND PROJECTED SHORTFALL (179.1)$ (158.8)$ (155.9)$ (165.9)$ (136.5)$
1Incremental funding to expenditure baseline
ATTACHMENT ICITY OF SAN DIEGO FY 2011 - 2015 FIVE-YEAR FINANCIAL OUTLOOK
PRO-FORMA GENERAL FUND REVENUE & EXPENSES (in millions)
Page | 30

REVENUE EXPENSES
1) City Treasurer:
Franchise Tax Board Fee2 593,000
Prepaid Parking 50,000
2) Citywide:1
Fund Balance Relief Elimination2 3,961,925
Citywide Elections 2,000,000
Appropriated Reserve 1,666,935
3) Community & Legislative Services2 75,000 75,000
4) Fire-Rescue:
Helicopter Fund2 1,074,000
FEMA Reimbursement2 490,000
Flight Simulator Training 74,000
Station Alerting System 1,600,000
5) Major General Fund Revenues:
Parking Garage3 1,695,140
Rate Stabilization Reserves4 17,836,967
Library Improvement Fund4 4,339,833
TOT Transfer from Trolley Fund4 2,847,906
PC Replacement Funds4 705,593
6) Park & Recreation :
Antenna Revenue2 816,000
Fire Pit Maintenance2 172,875
FEMA Brush Management2 1,160,315
New Facility NPE 290,000
Re-Budgeting of Balances 97,551
7) Business & Rental Unit Processing Fee5 3,451,444
8) City Planning & Community Investment 3,790,174
39,219,998$ 9,643,660$
1 - GF Portion Only
2 - Eliminated from Charges for Current Services
3 - Eliminated from Rents & Concessions
4 - Eliminated from Transfer from Other Funds
5 - Eliminated from FY 2010 base
ONE TIME REVENUE & EXPENSE ADJUSTMENTS FROM FY 2010 BASELINE
ATTACHMENT II
Page | 31

Department Facility Name FTE Fiscal Impact
Park & Recreat ion Carmel Valley NP
Park & Recreat ion Del M ar M esa NP
Park & Recreat ion Carson Elementary School Joint Use Improvements
Park & Recreat ion Sefton Field NP
Park & Recreat ion West Lewis & Falcon Streets M P
Park & Recreat ion Linda Vista Terrace/Ed Cramer Park
Park & Recreat ion M ontgomery Academy Joint Use improvements
Park & Recreat ion Angier Elementary Joint Use Improvements
Park & Recreat ion Encanto CP Concession stand expansion and ADA upgrades/expansion of comfort stat ion 0.00 5,036$
Park & Recreat ion Angier Joint Use
Park & Recreat ion Carson Joint Use
Park & Recreat ion Carmel Valley NP (# 8)
Park & Recreat ion Del M ar M esa NP
Park & Recreat ion Sefton NP
Park & Recreat ion Linda Vista Terrace NP
Park & Recreat ion West Lewis M P
Park & Recreat ion M ontgomery Academy Joint Use
Park & Recreat ion Addit ional Open Space Acreage 1.00 106,484$
Park & Recreat ion Carmel Valley CP South (Ocean Air)
Park & Recreat ion Carmel Valley CP South Building (Ocean Air)
Park & Recreat ion NTC/Liberty Stat ion - Phase II
Park & Recreat ion Alice Birney Joint Use 0.08 9,751$
Park & Recreat ion Roosevelt Joint Use 0.10 10,930$
Park & Recreat ion Vehicle costs from previous year 0.00 (188,000)$
5.4 9 557,10 8$
Facility Name FTE Fiscal Impact
Park & Recreat ion Wegeforth Elementary School Joint Use Improvements
Park & Recreat ion Cabrillo Heights NP Improvements
Park & Recreat ion West M aple Canyon M P
Park & Recreat ion North Chollas CP, Phase 1C 0.36 29,998$
Park & Recreat ion Pacif ic Breezes CP 2.10 243,390$
Park & Recreat ion Pacif ic Breezes CP (Ocean View)
Park & Recreat ion Wegeforth Joint Use
Park & Recreat ion Cabrillo Hts NP
Park & Recreat ion West M aple Canyon M P
Park & Recreat ion Wightman NP
Park & Recreat ion Addit ional Open Space Acreage 1.00 106,484$
Park & Recreat ion Angier Elementary School Joint Use Improvements 0.48 43,000$
Park & Recreat ion Vehicle needed for Pacif ic Breezes park maintenance 0.00 35,000$
Fire & Rescue Bayside Fire Stat ion Addit ional Operat ing Costs 0.00 100,000$
Fire & Rescue M ission Valley Fire Stat ion Grant M atch 0.00 367,323$
8 .9 2 1,72 2 ,556$
1.73 239,616$
1.00 138,710$
1.58 234,581$
ATTACHMENT IIIFACILITIES INCLUDED IN FY 2011-2015 FIVE YEAR FINANCIAL OUTLOOK
FISCAL YEAR 2011
FISCAL YEAR 2012
0.98 43,400$
4.00 753,961$
Page | 32

Facility Name FTE Fiscal Impact
Park & Recreat ion Black M ountain Ranch CP
Park & Recreat ion M ira M esa CP Expansion (Carroll NP Development)
Park & Recreat ion Language Academy/M ontezuma Elementary School, 0.10 11,818$
Park & Recreat ion Riviera Del Sol Neighborhood Park (Otay M esa) 0.40 44,762$
Park & Recreat ion Hidden Trails NP 0.56 72,804$
Park & Recreat ion 252 Corridor Park Improvements-Phase II 0.40 43,474$
Park & Recreat ion Language/M ontezuma Joint Use
Park & Recreat ion M ira M esa Community Park Expansion (Carroll NP Park Development)
Park & Recreat ion Hidden Trails NP
Park & Recreat ion Riviera Del Sol NP
Park & Recreat ion 252 Corridor Park
Park & Recreat ion Addit ional Open Space Acreage 1.00 106,484$
Park & Recreat ion 2 Vehicles needed for park maintenance 0.00 70,000$
Park & Recreat ion Vehicle needed for Pacif ic Breezes park maintenance in FY 2012 0.00 (35,000)$
Park & Recreat ion Vehicle costs from previous year 0.00 (456,000)$
Fire & Rescue Bayside Fire Stat ion Addit ional Operat ing Costs 0.00 100,000$
6 .3 6 6 19 ,54 5$
Facility Name FTE Fiscal Impact
Park & Recreat ion M cAulif fe Community Park 0.24 13,514$
Park & Recreat ion Dennery Ranch NP 1.60 173,256$
Park & Recreat ion Azalea Neighborhood Park Expansion 0.00 1,575$
Park & Recreat ion Azalea Recreat ion Center improvements 0.00 1,375$
Park & Recreat ion Azalea NP
Park & Recreat ion Dennery Ranch NP
Park & Recreat ion M cAulif fe CP Expansion
Park & Recreat ion Addit ional Open Space Acreage 1.00 123,034$
Park & Recreat ion Vehicle needed for Dennery Ranch NP 0.00 35,000$
Park & Recreat ion Vehicles needed in FY 2013 0.00 (70,000)$
Fire & Rescue Bayside Fire Stat ion Addit ional Operat ing Costs 0.00 100,000$
4 .8 4 74 6 ,14 4$
FISCAL YEAR 2014
ATTACHMENT III (continued)FACILITIES INCLUDED IN FY 2011-2015 FIVE YEAR FINANCIAL OUTLOOK
2.00 222,203$
2.00 368,390$
1.90 439,000$
Page | 33

FY 2010ADOPTED
BUDGETCHARGES FOR CURRENT SERVICES (revenues) Cemetery Revenue 877,614$ Community Services to Other City Funds 281,139 Election Fees 8,600 Emergency Medical Services 166,500 Engineering Services 5,777,461 Engineering Services to Other City Funds 30,827,107 Facilities Maintenance Services to Other City Funds 3,158,553 Fire Services 10,123,441 General Government and Financial Services to Other City Funds 35,591,705 Golf Course Revenue 236,133 Library Revenue 1,477,775 Miscellaneous Recreation Revenue 4,416,782 Miscellaneous Services to Other City Funds 4,749,500 Other Services1 24,352,933 Parking Citation Processing 130,000 Planning and Miscellaneous Filing Fees 5,300 Police Services 3,524,307 Real Estate Assets Services to Other City Funds 890,150 Repair and Damage Recoveries 235,000 Services to Transient Occupancy Tax Fund 921,994 Services to Unified Port District 3,263,000 Street Division Services to Other Funds 6,356,864 Swimming Pool Revenue 1,199,087Total Charges for Current Services 138,570,945$
1Includes $18 million in services provided to Water and Sewer Funds.
ATTACHMENT IV
Page | 34