city of playford
TRANSCRIPT

City of Playford
2016 Resident Satisfaction Survey
Summary of key Findings
Prepared by: Micromex Research
Date: August 2016

The information contained herein is believed to be reliable and accurate.
However, no guarantee is given as to its accuracy and reliability, and no
responsibility or liability for any information, opinions or commentary contained
herein, or for any consequences of its use, will be accepted by Micromex
Research, or by any person involved in the preparation of this report.

Table of Contents
Background and Methodology ................................................................................................ 4
Sample Profile ............................................................................................................................ 7
Key Findings ............................................................................................................................... 9
Summary and Recommendations ......................................................................................... 26
Detailed Findings – Importance of, and Satisfaction with, Council Services & Facilities .. 28
Section A – Customer Service ............................................................................................... 58
Contact with Council ................................................................................................................... 59
Method of Contact with Council ................................................................................................ 60
Nature of Resident Enquiries......................................................................................................... 61
Customer Service .......................................................................................................................... 62
Issues Regarding Customer Service ............................................................................................. 63
Overall Satisfaction with Customer Service ................................................................................ 64
Preferred Method of Contacting Council .................................................................................. 65
Online Tasks ................................................................................................................................... 66
Section B – Communication with Council ............................................................................ 67
How Residents Hear About Programs, Events and Initiatives .................................................... 68
Overall Satisfaction with Level of Communication .................................................................... 69
Information for Residents .............................................................................................................. 70
Section C – Services ................................................................................................................ 71
Overall Satisfaction with Presentation ......................................................................................... 72
Facilities Visited .............................................................................................................................. 73
Section D – Strategic Priorities ................................................................................................ 74
Section E – Living in Playford ................................................................................................... 76
Image and Reputation ................................................................................................................. 77
Continued Residence in the City of Playford ............................................................................. 78
Overall Satisfaction with the Performance of Council ............................................................... 79
Section F - Demographics ...................................................................................................... 80
Appendix A – Questionnaire .................................................................................................. 83
Appendix B – City of Playford Strategic Priorities.................................................................. 96
Appendix C – City of Playford Wards..................................................................................... 98

Background and
Methodology

City of Playford
2016 Resident Satisfaction Survey
August 2016 Page | 5
Background and Methodology
City of Playford Council sought to examine community attitudes and perceptions towards current and
future services and facilities provided by Council. Key objectives of the research included:
Assessing and establishing the community’s priorities and satisfaction in relation to Council
activities, services and facilities
Identifying the community’s overall level of satisfaction with Council’s performance
Identifying methods of communication and engagement with Council
Identifying the community’s support for Council’s strategic priorities
To facilitate this, Micromex Research was contracted to develop a survey template that enabled Council
to effectively analyse attitudes and trends within the community.
Questionnaire
Micromex Research, together with City of Playford, developed the questionnaire.
A copy of the questionnaire is provided in Appendix A.
Data collection
The survey was conducted during the period 4th July – 12th July 2016 from 4:30pm to 8:30pm Monday to
Friday, and from 10am to 4pm Saturday.
Survey area
City of Playford Government Area.
Sample selection and error
A total of 605 resident interviews were completed by phone. 451 of the 605 respondents were selected
by means of a computer based random selection process using the electronic White Pages. The
remaining 154 respondents were ‘number harvested’ via face-to-face intercept at a number of areas
around the City of Playford LGA, i.e. Elizabeth Shopping Centre, Munno Para Shopping Centre, Elizabeth
Train Station and Smithfield Train Station.
A sample size of 605 residents provides a maximum sampling error of plus or minus 4.0% at 95%
confidence. This means that if the survey was replicated with a new universe of N=605 residents, 19 times
out of 20 we would expect to see the same results, i.e. +/- 4.0%.
For the survey under discussion the greatest margin of error is 4.0%. This means, for example, that an
answer such as ‘yes’ (50%) to a question could vary from 46% to 54%.
The sample was weighted by age and gender to reflect the 2011 ABS census data for the City of Playford
council.
Interviewing
Interviewing was conducted in accordance with the AMSRS (Australian Market and Social Research
Society) Code of Professional Behaviour.

City of Playford
2016 Resident Satisfaction Survey
August 2016 Page | 6
Background and Methodology Prequalification
Participants in this survey were pre-qualified as being over the age of 18, and not working for, or having
an immediate family member working for City of Playford.
Data analysis
The data within this report was analysed using Q Professional. To identify the statistically significant
differences between the groups of means, ‘One-Way Anova tests’ and ‘Independent Samples T-tests’
were used. ‘Z Tests’ were also used to determine statistically significant differences between column
percentages.
Ratings questions
The Unipolar Scale of 1 to 5, where 1 was the lowest importance or satisfaction and 5 the highest
importance or satisfaction, was used in all rating questions.
This scale allowed us to identify different levels of importance and satisfaction across respondents.
Note: Residents ascribing comparably low levels of importance to a service or facility, if asked, may
assign satisfaction ratings to that service based on different criteria to others. They may indicate
low satisfaction if they feel that the service is provided too widely, i.e. they feel that it is carried
out to too high a standard, or high satisfaction if they perceive that the service is currently
provided to an appropriately low standard. As such, only respondents who rated
services/facilities a 4 or 5 in importance were asked to rate their satisfaction with that
service/facility.
Percentages
All percentages are calculated to the nearest whole number and therefore the total may not exactly
equal 100%.
Micromex Benchmarks
These benchmarks are based on 60 LGAs that we have conducted community research for, and were
revised in 2016 to ensure the most recent comparable data. Since 2008 Micromex has worked for over 70
NSW councils and conducted 100+ community satisfaction surveys across NSW
Errors: Data in this publication is subject to sampling variability because it is based on information
relating to a sample of residents rather than the total number (sampling error).
In addition, non-sampling error may occur due to imperfections in reporting and errors made in
processing the data. This may occur in any enumeration, whether it is a full count or sample.
Efforts have been made to reduce both sampling and non-sampling error by careful design of
the sample and questionnaire, and detailed checking of completed questionnaires.
As the raw data has been weighted to reflect the real community profile of City of Playford, the
outcomes reported here reflect an ‘effective sample size’; that is, the weighted data provides
outcomes with the same level of confidence as unweighted data of a different sample size. In
some cases this effective sample size may be smaller than the true number of surveys
conducted.

Sample Profile

City of Playford
2016 Resident Satisfaction Survey
August 2016 Page | 8
41%
22%
18%
14%
5%
4%
2%
38%
23%
9%
15%
10%
32%
68%
24%
76%
9%
12%
18%
11%
17%
32%
16%
22%
28%
34%
51%
49%
0% 20% 40% 60% 80% 100%
More than 20 years
11 – 20 years
6 – 10 years
2 – 5 years
Less than 2 years
Extended family household
Group household
Married/de facto with children
Married/de facto with no children
Single parent with children
Single with no children
Living at home with parents
Non-ratepayer
Ratepayer
Other
Australia
Ward 6
Ward 5
Ward 4
Ward 3
Ward 2
Ward 1
65 years and over
50 – 64
35 – 49
18 – 34
Female
Male
Age
Ratepayer status
Residential status
Gender
Country of birth
Sample Profile
Base: N = 605, Ratepayer and Residential status base: N = 604
A sample size of 605 residents provides a maximum sampling error of plus or minus 4.0% at 95% confidence. The sample has been
weighted by age and gender to reflect the 2011 ABS community profile of the City of Playford.
Note: 1 respondent did not answer residential status or ratepayer status.
Area lived in
Time lived in the area

Key Findings

City of Playford
2016 Resident Satisfaction Survey
August 2016 Page | 10
Key Findings
Overview (Overall satisfaction)
93% of residents are at least ‘somewhat satisfied’ with the performance of City of Playford Council.
Satisfaction significantly increased in 2016 compared to 2015, continuing the upward trend that has been
occurring since 2014. A mean rating for overall satisfaction of 3.76 is significantly higher than the mean
satisfaction scores for both ‘metro councils’ and ‘all councils’.
Females were significantly more satisfied than males, along with those aged 65 years and over and
residents of ward 5.
Q8. Overall for the last 12 months, how satisfied are you with the performance of City of Playford, not just on one
or two issues but across all responsibility areas?
Overall
2016
Overall
2015 Male Female 18-34 35-49 50-64 65+ Ratepayer
Non-
ratepayer
Mean
ratings 3.76▲ 3.57 3.66 3.87▲ 3.86 3.68 3.63 3.90▲ 3.70 3.90
Ward 1 Ward 2 Ward 3 Ward 4 Ward 5 Ward 6
Mean
ratings 3.64 3.83 3.63 3.67 4.14▲ 3.92
LGA Brand
Scores Metro
All
Councils
City of
Playford
2016
Mean ratings 3.45▼ 3.31▼ 3.76▲
2016 2015 2014 2013 2012 2011 2010 2009 2007 2005 2004 2003 2002 2001
Satisfaction
mean ratings 3.76 3.57 3.35 3.50 3.50 3.60 3.65 3.80 3.80 3.75 3.70 3.85 3.70 3.55
Percentage
conversion 73% 69% 65% 68% 68% 70% 71% 74% 74% 73% 72% 75% 72% 69%
Scale: 1 = not at all satisfied, 5 = very satisfied
▲▼= significantly higher/lower level of satisfaction (by group)
69% 72%
75% 72% 73% 74% 74%
71% 70% 68% 68% 65%
69% 73%
0%
10%
20%
30%
40%
50%
60%
70%
80%
90%
100%
2001 2002 2003 2004 2005 2007 2009 2010 2011 2012 2013 2014 2015 2016
Overall Satisfaction Score as a Percentage

City of Playford
2016 Resident Satisfaction Survey
August 2016 Page | 11
Key Findings
Overview (Overall satisfaction) continued…
1%
6%
36%
50%
7%
3%
4%
26%
47%
20%
0% 10% 20% 30% 40% 50%
Not at all satisfied
Not very satisfied
Somewhat satisfied
Satisfied
Very satisfied
2016: N = 605 2015: N = 601

City of Playford
2016 Resident Satisfaction Survey
August 2016 Page | 12
Key Findings
Key Performance Indicators – Year-on-Year Change
Summary
‘Overall satisfaction with Council’ experienced a significant increase compared to 2015. All other
measures have remained steady, with ‘presentation of the City’ trending upwards since 2011.
Note: due to a change in methodology, mean scores taken from 2014 and earlier have been recalculated to fit a 5-point scale in
order to compare against the 2016 results
Measure 2016 2015 2014 2013 2012 2011 2010
Overall satisfaction with Council 3.76▲ 3.57 3.35 3.50 3.50 3.60 3.65
Overall satisfaction with Council’s level of customer
service 3.95 3.76 3.90 3.90 4.00 3.80 3.60
Presentation of the City 3.64 3.57 3.50 3.45 3.45 3.35 N/A
Planning for the future 3.56 3.55 3.30 3.45 3.45 3.50 2.90
Being open and accountable to the community 3.25 3.32 3.00 3.25 3.20 3.30 2.85
Community input to Council decision-making 3.16 3.23 2.80 3.05 3.05 2.95 2.60
Council provide value for money for the rates paid 2.94 3.00 2.60 2.85 2.65 2.80 2.85
Measure 2016 2015 2014 2013 2012 2011 2010 2009 2007 2005 2004 2003 2002 2001
Overall
satisfaction
with Council
3.76▲ 3.57 3.35 3.50 3.50 3.60 3.65 3.80 3.80 3.75 3.70 3.85 3.70 3.55
▲▼= significantly higher/lower level of satisfaction (by year)

City of Playford
2016 Resident Satisfaction Survey
August 2016 Page | 13
5%
4%
4%
1%
1%
3%
1%
2%
10%
6%
2%
3%
1%
1%
1%
20%
26%
15%
10%
10%
7%
9%
4%
25%
28%
30%
30%
28%
19%
23%
19%
39%
36%
49%
55%
60%
70%
66%
75%
0% 20% 40% 60% 80% 100%
Reducing council rates for
businesses
Development of Playford Sports
Precinct
Development of Elizabeth CBD
City presentation and
appearance
Delivering value for money via
efficiency & effectiveness…
Sustaining & establishing an
advanced manufacturing…
Collection & reuse of rainwater
Development of the Lyell McEwin
Health Precinct
Not at all supportive Not very supportive Somewhat supportive Supportive Completely supportive
Key Findings Summary
Support for ‘development of the Lyell McEwin Health Precinct’ remained the most supported strategic
priority in 2016, with 94% of residents being ‘supportive’ or ‘completely supportive’.
Support for ‘reducing council rates for businesses’ significantly decreased in 2016 compared to 2015.
Females were significantly more supportive of ‘development of the Lyell McEwin Health Precinct’ and
‘collection & reuse of rainwater’.
18-34 year olds were significantly less supportive of ‘development of the Lyell McEwin Health Precinct’,
‘sustaining & establishing an advanced manufacturing industry’, ‘reducing Council rates for businesses’,
‘collection & reuse of rainwater’ and ‘delivering value for money via efficiency & effectiveness’.
Residents aged 50-64 and 65 and over were significantly more supportive of ‘reducing Council rates for
businesses’, ‘collection & reuse of rainwater’, ‘delivering value for money via efficiency and effectiveness
programs’. Residents aged over 65 were additionally more satisfied with ‘development of the Lyell
McEwin Health Precinct’, ‘sustaining & establishing an advanced manufacturing industry’, ‘development
of Elizabeth CBD’, and ‘development of Playford Sports Precinct’.
Ratepayers were significantly more supportive of ‘development of Playford Sports Precinct’.
Q6. City of Playford has identified 8 strategic priorities, as outlined in City of Playford’s 5 Year Strategic Plan.
Council would like to know your level of support for these priorities to make sure they align with community
need. Please indicate how supportive you are of each priority.
Note: The wording of these statements has changed since 2015, although the intent of the measures remains the same. Please see
Appendix B for the complete list of statements for both years.
Scale: 1 = not at all supportive, 5 = completely supportive
▲▼= significantly higher/lower level of support (by year)
Mean ratings
2016 2015
4.66 4.68
4.52 4.61
4.52 4.61
4.43 4.47
4.36 4.27
4.20 4.15
3.87 3.94
3.83▼ 4.31

City of Playford
2016 Resident Satisfaction Survey
August 2016 Page | 14
Key Findings Comparison to LGA Benchmarks
12 of the 22 comparable measures were rated above the benchmark threshold of 0.15, these were
‘planning for the future’ ‘protecting & improving native vegetation and biodiversity’, ‘planning and
building advice & assessment’, ‘condition of local street’, 'access to community venues’, 'Council
events’, 'supporting business and industry development’, 'managing growth and major urban
developments’, 'kerbside waste collection’, 'condition of rural roads’, 'support for volunteer programs’
and 'presentation of ovals and sports grounds’.
1 of the measures was rated lower than the benchmark threshold of -0.15, 'condition of footpaths’.
Service/Facility
City of
Playford
Satisfaction
Scores
Benchmark
Variances
Planning for the future 3.56 0.44▲
Protecting & improving native vegetation and biodiversity 3.79 0.38▲
Planning and building advice & assessment 3.54 0.38▲
Condition of local street 3.27 0.37▲
Access to community venues 3.98 0.32▲
Council events 4.14 0.31▲
Supporting business and industry development 3.54 0.31▲
Managing growth and major urban developments 3.44 0.28▲
Kerbside waste collection 4.32 0.26▲
Condition of rural roads 3.16 0.26▲
Support for volunteer programs 3.87 0.24▲
Presentation of ovals and sports grounds 4.12 0.22▲
Community input to Council decision-making 3.16 0.08
Providing support & facilities for sporting clubs 3.96 0.06
Presentation of parks and reserves 3.88 0.05
Condition of bicycle paths 3.26 -0.02
Adequate stormwater drainage 3.37 -0.03
Hard waste collection 4.01 -0.05
Library service 4.14 -0.10
Communication on Council’s visions & goals 3.31 -0.12
Council provides value for money for the rates paid 2.94 -0.14
Condition of footpaths 2.97 -0.18▼
Scale: 1 = not at all satisfied, 5 = very satisfied
▲/▼ = positive/negative difference greater than 0.15 from LGA Benchmark
Note: Benchmark differences are based on assumed variants of +/- 0.15, with variants beyond +/- 0.15 more likely to be
significant

City of Playford
2016 Resident Satisfaction Survey
August 2016 Page | 15
Key Findings Key Importance Trends
Compared to the previous research conducted in 2015, there were significant increases in residents’
levels of importance with 2 of the comparable 37 services and facilities provided by Council, these were:
2016 2015
Access to community venues 4.14 3.96
Public health & safety 4.74 4.57
There were no significant decreases in residents’ levels of importance relative to 2015.
Key Satisfaction Trends
Over the same period there were significant increases in residents’ levels of satisfaction for 3 of the
comparable 37 services and facilities provided by Council, these were:
2016 2015
Condition of local streets 3.27 3.06
Hard waste collection 4.01 3.79
Providing support & facilities for sporting clubs 3.96 3.78
Residents’ levels of satisfaction declined for 1 of the comparable 37 services and facilities provided by
Council, this was:
2016 2015
Adequate stormwater drainage 3.37 3.66

City of Playford
2016 Resident Satisfaction Survey
August 2016 Page | 16
Key Findings
Identifying Priorities via Specialised Analysis (Explanation)
The specified research outcomes required us to measure both community importance and community
satisfaction with a range of specific service delivery areas. In order to identify core priorities, we
undertook a 2 step analysis process on the stated importance and rated satisfaction data, after which
we conducted a third level of analysis. This level of analysis was a Shapley Regression on the data in
order to identify which facilities and services are the actual drivers of overall satisfaction with Council.
By examining both approaches to analysis we have been able to:
1. Identify and understand the hierarchy of community priorities
2. Inform the deployment of Council resources in line with community aspirations
Step 1. Performance Gap Analysis (PGA)
PGA establishes the gap between importance and satisfaction. This is calculated by subtracting the
mean satisfaction score from the mean importance score. In order to measure performance gaps,
respondents are asked to rate the importance of, and their satisfaction with, each of a range of different
services or facilities on a scale of 1 to 5, where 1 = low importance or satisfaction and 5 = high
importance or satisfaction. These scores are aggregated at a total community level.
The higher the differential between importance and satisfaction, the greater the difference is between
the provision of that service by City of Playford and the expectation of the community for that
service/facility.
In the table on the following page, we can see the 37 services and facilities that residents rated by
importance and then by satisfaction.
When analysing the performance gaps, it is important to recognise that, for the most part, a gap of up to
1.0 is acceptable when the initial importance rating is 4.0+, as it indicates that residents consider the
attribute to be of ‘high’ to ‘very high’ importance and that the satisfaction they have with City of
Playford’s performance on that same measure, is ‘moderate’ to ‘moderately high’.
For example, ‘managing growth and major urban developments’ was given an importance score of
4.42, which indicates that it is considered an area of ‘very high’ importance by residents. At the same
time it was given a satisfaction score of 3.44, which indicates that residents have a ‘moderate’ level of
satisfaction with City of Playford’s performance and focus on that measure.
In the case of a performance gap such as for ‘Council events’ (3.84 importance vs. 4.14 satisfaction), we
can identify that the facility/service is of ‘moderately high’ importance to the broader community, but
for residents who feel that this facility is important, it is providing a ‘high’ level of satisfaction.

City of Playford
2016 Resident Satisfaction Survey
August 2016 Page | 17
Key Findings
When analysing performance gap data, it is important to consider both stated satisfaction and the
absolute size of the performance gap.
Performance Gap Ranking
Ranking
2015
Ranking
2016 Service/ Facility
Importance
Mean
Satisfaction
Mean
Performance
Gap
1 1 Council provides value for money for the rates paid 4.58 2.94 1.64
5 2 Being open & accountable to the community 4.72 3.25 1.47
4 3 Removal of illegally dumped rubbish 4.65 3.20 1.45
6 4 Community input to Council decision-making 4.45 3.16 1.29
3 5 Condition of footpaths 4.25 2.97 1.28
14 6 Adequate stormwater drainage 4.61 3.37 1.24
2 7 Condition of local streets 4.44 3.27 1.17
8 8 Planning for the future 4.61 3.56 1.05
8 9
Condition of rural roads 4.19 3.16 1.03
10 Representation by Elected Members 4.17 3.14 1.03
12 11 Managing growth and major urban developments 4.42 3.44 0.98
12 12 Communication on Council’s visions & goals 4.27 3.31 0.96
7 13 Supporting business and industry development 4.45 3.54 0.91
15 14 Public health & safety 4.74 3.84 0.90
22 15 Presentation of street verges 3.94 3.15 0.79
10 16 Rapid response service 4.56 3.78 0.78
16 17 Enforcement of local laws 4.52 3.77 0.75
19 18 Safety of playgrounds 4.56 3.93 0.63
24 19 Removal of graffiti 4.25 3.66 0.59
26 20 Presentation of parks and reserves 4.47 3.88 0.59
23 21 Health initiatives 4.44 3.86 0.58
26 22 Condition of street kerbs 3.93 3.36 0.57
18 23 Protecting & improving native vegetation and
biodiversity 4.35 3.79 0.56
20 24 Supporting local community development 4.26 3.76 0.50
29 25 Planning and building advice & assessment 4.01 3.54 0.47
17 26 Availability of community services 4.28 3.82 0.46
20 27 Hard waste collection 4.45 4.01 0.44
29 28 Presentation of street trees 3.90 3.49 0.41
28 29 Kerbside waste collection 4.71 4.32 0.39
25 30 Support for volunteer programs 4.25 3.87 0.38
33 31 Immunisation service 4.49 4.28 0.21
34 32 Access to community venues 4.14 3.98 0.16
31 33 Providing support & facilities for sporting clubs 4.05 3.96 0.09
32 34 Presentation of ovals and sports grounds 4.17 4.12 0.05
36 35 Library service 4.11 4.14 -0.03
35 36 Condition of bicycle paths 3.18 3.26 -0.08
37 37 Council events 3.84 4.14 -0.30
Scale: 1 = not at all important/not at all satisfied, 5 = very important/very satisfied

City of Playford
2016 Resident Satisfaction Survey
August 2016 Page | 18
Key Findings
When we examine the 10 largest performance gaps, we can identify that all of the services or facilities
have been rated as ‘high’ to ‘extremely high’ in importance. Resident satisfaction for all of these areas is
between 2.94 and 3.56, which indicates that resident satisfaction for these measures is ‘moderately low’
to ‘moderate’.
Ranking Service/ Facility Importance
Mean
Satisfaction
Mean
Performance
Gap
1 Council provides value for money for the rates
paid 4.58 2.94 1.64
2 Being open & accountable to the community 4.72 3.25 1.47
3 Removal of illegally dumped rubbish 4.65 3.20 1.45
4 Community input to Council decision-making 4.45 3.16 1.29
5 Condition of footpaths 4.25 2.97 1.28
6 Adequate stormwater drainage 4.61 3.37 1.24
7 Condition of local streets 4.44 3.27 1.17
8 Planning for the future 4.61 3.56 1.05
9 Condition of rural roads 4.19 3.16 1.03
10 Representation by Elected Members 4.17 3.14 1.03
The key outcomes of this analysis would suggest that, while there are opportunities to improve satisfaction
across a range of services/facilities, ‘Council provides value for money for the rates paid’ is the area of
lowest relative satisfaction.
Note: Performance gap is the first step in the process, we now need to identify comparative ratings
across all services and facilities to get an understanding of relative importance and satisfaction at an
LGA level. This is when we undertake step 2 of the analysis.

City of Playford
2016 Resident Satisfaction Survey
August 2016 Page | 19
Key Findings Quadrant Analysis
Step 2. Quadrant Analysis
Quadrant analysis is often helpful in planning future directions based on stated outcomes. It combines
the stated importance of the community and assesses satisfaction with delivery in relation to these needs.
This analysis is completed by plotting the variables on x and y axes, defined by stated importance and
rated satisfaction. We aggregate the mean scores for stated importance and rated satisfaction to
identify where the facility or service should be plotted. For these criteria, the average stated importance
score was 4.31 and the average rated satisfaction score was 3.62. Therefore, any facility or service that
received a mean stated importance score of ≥ 4.31 would be plotted in the higher importance section
and, conversely, any that scored < 4.31 would be plotted into the lower importance section. The same
exercise is undertaken with the satisfaction ratings above, equal to or below 3.62. Each service or facility
is then plotted in terms of satisfaction and importance, resulting in its placement in one of four quadrants.
ImproveHigher importance, lower satisfaction
MaintainHigher importance, higher satisfaction
Imp
ort
an
ce
NicheLower importance, lower satisfaction
SatisfactionCommunity
Lower importance, higher satisfaction
Quadrant Analysis – Importance v Satisfaction
Council provides value
for money for the rates
paid
Being open & accountable
to the community
Removal of illegally dumped rubbish
Community input to Council
decision-making
Condition of footpaths
Adequate stormwater
drainage
Condition
of local
streets
Planning for the future
Condition of rural roads
Representation by Elected
Members
Managing growth and
major urban
developments
Communication on Council's
visions & goals
Supporting business and
industry development
Public health & safety
Presentation of street verges
Rapid response service
Enforcement of local laws
Safety of playgrounds
Removal of
graffiti
Presentation of parks and reserves
Health initiatives
Condition of street kerbs
Protecting & improving native vegetation and biodiversity
Supporting local
community
development
Availability of community services
Planning and building
advice & assessment
Hard waste collection
Presentation
of street trees
Kerbside waste collection
Support for volunteer programs
Immunisation service
Access to
community venues
Providing support & facilities for sporting
clubs
Presentation of ovals and
sports grounds
Library service
Council events
3.8
3.9
4.0
4.1
4.2
4.3
4.4
4.5
4.6
4.7
4.8
2.9 3.1 3.3 3.5 3.7 3.9 4.1 4.3 4.5
Condition of bicycle paths
(3.26, 3.18)

City of Playford
2016 Resident Satisfaction Survey
August 2016 Page | 20
Key Findings Explaining the 4 quadrants
Attributes in the top right quadrant, MAINTAIN, such as ‘kerbside waste collection’, are Council’s core
strengths, and should be treated as such. Maintain, or even attempt to improve your position in these
areas, as they are influential and address clear community needs.
Attributes in the top left quadrant, IMPROVE, such as ‘being open & accountable to the community’ are
key concerns in the eyes of your residents. In the vast majority of cases you should aim to improve your
performance in these areas to better meet the community’s expectations.
Attributes in the bottom left quadrant, NICHE, such as ‘presentation of street trees’, are of a relatively
lower priority (and the word ‘relatively’ should be stressed – they are still important). These areas tend to
be important to a particular segment of the community.
Finally, attributes in the bottom right quadrant, COMMUNITY, such as ‘Council events’, are core strengths,
but in relative terms they are deemed less overtly important than other directly obvious areas. However,
the occupants of this quadrant tend to be the sort of services and facilities that deliver to community
liveability, i.e. make it a good place to live.
Recommendations based only on stated importance and satisfaction have major limitations, as the
actual questionnaire process essentially ‘silos’ facilities and services as if they are independent variables,
when they are in fact all part of the broader community perception of council performance.
Residents’ priorities identified in stated importance/satisfaction analysis often tend to be in areas that are
problematic. No matter how much focus a council dedicates to ‘condition of local streets’, it will often
be found in the IMPROVE quadrant. This is because, perceptually, the condition of local streets can
always be better.
Furthermore, the outputs of stated importance and satisfaction analysis address the current dynamics of
the community, they do not predict which focus areas are the most likely agents to change the
community’s perception of Council’s overall performance.
Therefore, in order to identify how City of Playford can actively drive overall community satisfaction, we
conducted further analysis.
The Shapley Value Regression
This model was developed by conducting specialised analysis from over 30,000 LGA interviews
conducted since 2005. In essence, it proved that increasing resident satisfaction by actioning the
priorities they stated as being important does not necessarily positively impact on overall satisfaction with
the Council. This regression analysis is a statistical tool for investigating relationships between dependent
variables and explanatory variables.
In 2014, we revised the Shapley Regression Analysis to identify the directional contribution of key services
and facilities with regard to optimisers/barriers with council’s overall performance.
What Does This Mean?
The learning is that if we only rely on the stated community priorities, we will not be allocating the
appropriate resources to the actual service attributes that will improve overall community satisfaction.
Using regression analysis we can identify the attributes that essentially build overall satisfaction. We call
the outcomes ‘derived importance’.

City of Playford
2016 Resident Satisfaction Survey
August 2016 Page | 21
Key Findings
Comparison to 2015 Quadrant Analysis
Service/ Facility 2016 Quadrant 2015 Quadrant
Enforcement of local laws Maintain Maintain
Hard waste collection Maintain Maintain
Health initiatives Maintain Maintain
Immunisation service Maintain Maintain
Kerbside waste collection Maintain Maintain
Presentation of parks and reserves Maintain Maintain
Protecting & improving native vegetation and biodiversity Maintain Maintain
Public health & safety Maintain Maintain
Rapid response service Maintain Maintain
Safety of playgrounds Maintain Maintain
Communication on Council’s visions & goals Niche Niche
Condition of bicycle paths Niche Niche
Condition of footpaths Niche Improve
Condition of rural roads Niche Niche
Condition of street kerbs Niche Niche
Planning and building advice & assessment Niche Community
Presentation of street trees Niche Niche
Presentation of street verges Niche Niche
Representation by Elected Members Niche Niche
Access to community venues Community Community
Availability of community services Community Maintain
Council events Community Community
Library service Community Community
Presentation of ovals and sports grounds Community Community
Providing support & facilities for sporting clubs Community Community
Removal of graffiti Community Community
Support for volunteer programs Community Maintain
Supporting local community development Community Maintain
Adequate stormwater drainage Improve Maintain
Being open & accountable to the community Improve Improve
Community input to Council decision-making Improve Improve
Condition of local streets Improve Improve
Council provides value for money for the rates paid Improve Improve
Managing growth and major urban developments Improve Improve
Planning for the future Improve Improve
Removal of illegally dumped rubbish Improve Improve
Supporting business and industry development Improve Improve

City of Playford
2016 Resident Satisfaction Survey
August 2016 Page | 22
Key Findings Key Drivers of Satisfaction with City of Playford
The results in the chart below provide City of Playford with a complete picture of the intrinsic community
priorities and motivations, and identify what attributes are the key drivers of community satisfaction.
These top 11 services/facilities contribute to almost 50% of overall satisfaction with Council. This indicates
that the remaining 26 attributes we obtained measures on contribute a relatively lesser amount to the
community’s satisfaction with City of Playford’s performance. Therefore, whilst all 37 service/facility areas
are important, only a number of them are significant drivers of the community’s overall satisfaction with
Council.
The contributors to satisfaction are not to be misinterpreted as an indication of
current dissatisfaction
These Top 11 Indicators Contribute to Over 50% of Overall
Satisfaction with Council
3.4%
3.7%
4.1%
4.2%
4.2%
4.3%
4.4%
4.5%
5.2%
5.8%
6.6%
0.0% 1.0% 2.0% 3.0% 4.0% 5.0% 6.0% 7.0%
Supporting business and industry development
Planning for the future
Council provide value for money for the rates paid
Council events
Communication on Councils visions & goals
Availability of community services
Condition of footpaths
Managing growth and major urban developments
Community input to Council decision-making
Presentation of street verges
Presentation of parks and reserves
These 11 services/facilities are the key community priorities and by addressing these, City of Playford will
improve overall community satisfaction. The score assigned to each area indicates the percentage of
influence each attribute contributes to overall satisfaction with Council.
In the above chart, ‘supporting business and industry development’ contributes 3.4% towards overall
satisfaction, while ‘presentation of parks and reserves’ (6.6%) is a far stronger driver, contributing almost
twice as much to overall satisfaction with Council.

City of Playford
2016 Resident Satisfaction Survey
August 2016 Page | 23
Key Findings Key Drivers of Satisfaction with City of Playford: Comparison to 2015
The contribution of the top two drivers of satisfaction in 2016, ‘presentation of parks and reserves’ and
‘presentation of street verges’ both increased in 2016 compared to 2015. Other key drivers that increased
in 2016 include ‘managing growth and major urban developments’, ‘condition of footpaths’,
‘communication on Councils visions & goals’, ‘Council events’ and ‘supporting business and industry
developments’.
‘Community input to Council decision-making’, ‘availability of community services’ and ‘planning for the
future’ all remained relatively consistent in terms of their contribution to overall satisfaction in 2016.
Only one key driver had a reduction in contribution in 2016, ‘Council provide value for money for the
rates paid’.
Measure 2016 2015
Presentation of parks and reserves 6.6% 4.6%
Presentation of street verges 5.8% 3.2%
Community input to Council decision-making 5.2% 5.6%
Managing growth and major urban developments 4.5% 2.1%
Condition of footpaths 4.4% 1.2%
Availability of community services 4.3% 4.0%
Communication on Councils visions & goals 4.2% 2.7%
Council events 4.2% 1.4%
Council provide value for money for the rates paid 4.1% 5.2%
Planning for the future 3.8% 3.6%
Supporting business and industry development 3.4% 2.4%

City of Playford
2016 Resident Satisfaction Survey
August 2016 Page | 24
Key Findings Advanced Shapley Outcomes
The chart below illustrates the positive/negative contribution the key drivers provide towards overall
satisfaction. Some drivers can contribute both negatively and positively depending on the overall
opinion of the residents.
The scores on the negative indicate the contribution the driver makes to impeding transition towards
satisfaction. If we can address these areas we will see a lift in our future overall satisfaction results, as we
will positively transition residents who are currently ‘not at all satisfied’ towards being ‘satisfied’ with
Council’s overall performance.
The scores on the positive indicate the contribution the driver makes towards optimising satisfaction. If we
can address these areas we will see a lift in our future overall satisfaction results, as we will positively
transition residents who are currently already ‘somewhat satisfied’, towards being more satisfied with
Council’s overall performance.
Key Contributors to Barriers/Optimisers
Different levers address the different levels of satisfaction across the community
-3.2%
-3.6%
-3.3%
-2.5%
-3.2%
-2.1%
-3.2%
-0.3%
-2.0%
-2.4%
-2.0%
3.4%
2.2%
1.9%
2.0%
1.2%
2.2%
1.0%
3.9%
2.1%
1.3%
1.4%
-6.0% -4.0% -2.0% 0.0% 2.0% 4.0% 6.0%
Presentation of parks and reserves
Presentation of street verges
Community input to Council decision-making
Managing growth and major urban developments
Condition of footpaths
Availability of community services
Communication on Councils visions & goals
Council events
Council provide value for money for the rates paid
Planning for the future
Supporting business and industry development
Satisfiers
(47%)Dissatisfiers
(53%)

City of Playford
2016 Resident Satisfaction Survey
August 2016 Page | 25
Key Findings Clarifying Priorities
By mapping satisfaction against derived importance we can see that, for some of the core drivers,
Council is already providing ‘moderately high’ or greater levels of satisfaction, i.e. ‘Council events’,
‘presentation of parks and reserves’ and ‘availability of community services’. Council should look to
maintain/consolidate their delivery in these areas.
It is also apparent that there is room to elevate satisfaction within the variables that fall in the ‘lower’ and
‘moderate satisfaction’ regions of the chart. If City of Playford can address these core drivers, they will be
able to improve resident satisfaction with their performance.
Sta
ted
Sa
tisf
ac
tio
n
Derived Importance
Mapping Stated Satisfaction and Derived Importance Identifies the Community
Priority Areas
Moderately high to highSatisfaction
≥ 3.60
Moderate Satisfaction 3.00 - 3.59
Low Satisfaction
≤ 2.99
Presentation of parks
and reserves
Presentation of street
vergesCommunity input to
Council decision-making
Managing growth and major
urban developments
Condition of footpaths
Availability of community
services
Communication on
Council's visions & goals
Council events
Council provides
value for money for
the rates paid
Planning for the future
Supporting business and
industry development
2.9
3.0
3.1
3.2
3.3
3.4
3.5
3.6
3.7
3.8
3.9
4.0
4.1
4.2
3.4% 3.9% 4.4% 4.9% 5.4% 5.9% 6.4% 6.9%
This analysis indicates that ‘presentation of street verges’, ‘community input to Council decision-making’,
‘managing growth and major urban developments’, ‘communication on Council’s visions & goals’,
‘planning for the future’ and ‘supporting business and industry development’, could possibly be targeted
for optimisation.
Furthermore, areas such as ‘Council provides value for money for the rates paid’ and ‘condition of
footpaths’ are issues Council should be looking to understand resident expectations and/or more actively
inform/engage residents of Council’s position and advocacy across these areas.

Summary and
Recommendations

City of Playford
2016 Resident Satisfaction Survey
August 2016 Page | 27
Summary and Recommendations
Summary
Overall satisfaction with the performance of the City of Playford Council is high, with 93% of residents
being at least ‘somewhat satisfied’. Although this figure is the same as 2015, there has been a positive
shift in residents moving from the ‘somewhat satisfied’ and the ‘satisfied’ categories to the ‘very satisfied’
category. This transition has brought the mean satisfaction rating for the City of Playford up to 3.76, the
highest recorded score since 2009.
In the past year satisfaction has significantly increased in 3 service areas, ‘condition of local streets’, ‘hard
waste collection’ and ‘providing support & facilities for sporting clubs’. As ‘condition of local streets’ was
a key infrastructure issue highlighted by residents in 2015, the increase in satisfaction suggests a positive
response from the community to any actions conducted by Council in this area.
The top drivers of overall satisfaction focus around visual aesthetics of the council area, such as
‘presentation of parks and reserves’ and ‘presentation of street verges’, as well as communication and
engagement with the community by Council, such as ‘community input to Council decision-making’,
‘communication on Council’s visions and goals’ and ‘Council provides value for money for the rates
paid’. This suggests that residents value the appearance of the City of Playford, contributing to pride in
the area, but that Council also needs to ensure they inform and involve residents on actions and
decisions that are being made if they wish to increase overall satisfaction.
Satisfaction with customer service by Council is high. Though not significant, satisfaction has increased in
the past 12 months. The preferred method of contacting Council remains the ‘telephone’, however
preference for online services is high amongst younger residents.
Recommendations
Based on the findings of this research, City of Playford Council should:
Actively increase communication to the community on Council activities and inform residents
about how rates are spent and allocated to different services and facilities
Enable greater engagement from residents in Council decision-making, driving resident
participation in consultation processes across all demographics
Work to improve key infrastructure, whilst continuing to plan for the future and effectively manage
new developments
Continue to improve the presentation and visual aesthetics of Playford, with a particular focus on
enhancing green spaces

Detailed Findings – Importance of, and Satisfaction with, Council Services & Facilities

City of Playford
2016 Resident Satisfaction Survey
August 2016 Page | 29
Influence on Overall Satisfaction
A core element of this community survey was the rating of 37 facilities/services in terms of Importance
and Satisfaction. This section reports the Shapley Regression analysis undertaken on these measures – and
the detailed responses to the measures themselves.
The chart below summarises the influence of the 37 facilities/services on overall satisfaction with Council’s
performance, based on the Shapley Regression:
1.5%
1.5%
1.8%
5.6%
1.1%
4.6%
0.8%
4.5%
1.4%
1.1%
3.3%
0.5%
7.2%
2.5%
4.2%
1.3%
6.1%
2.2%
0.9%
2.8%
1.2%
2.3%
1.4%
1.8%
4.4%
1.2%
2.4%
3.6%
5.2%
2.7%
1.4%
4.0%
1.1%
2.1%
2.7%
3.2%
4.6%
0.8%
0.8%
0.9%
1.1%
1.2%
1.3%
1.3%
1.3%
1.5%
1.5%
1.6%
1.6%
1.7%
1.8%
2.0%
2.0%
2.3%
2.4%
2.4%
2.5%
2.6%
2.8%
2.9%
3.0%
3.2%
3.3%
3.4%
3.8%
4.1%
4.2%
4.2%
4.3%
4.4%
4.5%
5.2%
5.8%
6.6%
0% 1% 2% 3% 4% 5% 6% 7% 8%
Providing support & facilities for sporting clubs
Planning and building advice & assessment
Removal of graffiti
Condition of bicycle paths
Immunisation service
Representation by Elected Members
Removal of illegally dumped rubbish
Presentation of street trees
Safety of playgrounds
Condition of street kerbs
Support for volunteer programs
Kerbside waste collection
Condition of rural roads
Access to community venues
Presentation of ovals and sports grounds
Adequate stormwater drainage
Being open & accountable to the community
Library service
Enforcement of local laws
Protecting & improving native vegetation and biodiversity
Condition of local streets
Public health & safety
Rapid response service
Health initiatives
Supporting local community development
Hard waste collection
Supporting business and industry development
Planning for the future
Council provide value for money for the rates paid
Council events
Communication on Councils visions & goals
Availability of community services
Condition of footpaths
Managing growth and major urban developments
Community input to Council decision-making
Presentation of street verges
Presentation of parks and reserves
2016 2015

City of Playford
2016 Resident Satisfaction Survey
August 2016 Page | 30
Service Areas Each of the 37 facilities/services were grouped into service areas as
detailed below
We Explored Resident Response to 37 Service Areas
City Maintenance & Presentation Community Services
Condition of footpaths Support for volunteer programs
Condition of bicycle paths Supporting business and industry development
Presentation of street verges Planning and building advice & assessment
Condition of street kerbs Access to community venues
Presentation of street trees Council events
Condition of local streets Library service
Adequate stormwater drainage Providing support & facilities for sporting clubs
Condition of rural roads Availability of community services
Removal of illegally dumped rubbish Supporting local community development
Removal of graffiti Health initiatives
Presentation of parks and reserves Accountability, Advocacy & Management
Safety of playgrounds Planning for the future
Presentation of ovals and sports grounds Managing growth and major urban developments
Rapid response service Being open & accountable to the community
Health, Environment & Regulatory Services Community input to Council decision-making
Public health & safety Council provide value for money for the rates paid
Immunisation service Communication on Councils visions & goals
Enforcement of local laws Representation by Elected Members
Kerbside waste collection
Hard waste collection
Protecting & improving native vegetation and biodiversity
An Explanation
The following pages detail the Shapley findings for each service area, and summarise the stated
importance and satisfaction ratings by key demographics.
Importance
For the stated importance ratings, residents were asked to rate how important each of the criteria was to
them, on a scale of 1 to 5.
Satisfaction
Any resident who had rated the importance of a particular criterion a 4 or 5 was then asked how satisfied
they were with the performance of Council for that service or facility. There was an option for residents to
answer ‘don’t know’ to satisfaction, as they may not have personally used a particular service or facility.

City of Playford
2016 Resident Satisfaction Survey
August 2016 Page | 31
Key Service Areas’ Contribution to Overall
Satisfaction
By combining the outcomes of the regression data, we can identify the derived importance of the
different Nett Priority Areas.
Contribution to Overall Satisfaction with Council’s
Performance
13.7%
25.3%
25.4%
35.6%
0% 5% 10% 15% 20% 25% 30% 35% 40%
Nett: Health, Environment & Regulatory Services
Nett: Accountability, Advocacy & Management
Nett: Community Services
Nett: City Maintenance & Presentation
‘City maintenance & presentation’ (35.6%) is the key contributor toward overall satisfaction with Council’s
performance.
Note: This is possibly due to the fact that this grouping has 14 criteria, whilst others have only half the number.
The services and facilities grouped under this banner include:
Condition of footpaths Condition of rural raods
Condition of bicycle paths Removal of illegally dumped rubbish
Presentation of street verges Removal of graffiti
Condition of street kerbs Presentation of parks and reserves
Presentation of street trees Safety of playgrounds
Condition of local streets Presentation of ovals and sports grounds
Adequate stormwater drainage Rapid response service
This is not to indicate that the other priority areas are less important, but rather that some of the services
and facilities grouped under the banner of ‘city maintenance & presentation’ are stronger drivers of
resident satisfaction.

City of Playford
2016 Resident Satisfaction Survey
August 2016 Page | 32
Service Area 1: City Maintenance & Presentation
Shapley Regression
Contributes to Almost 36% of Overall Satisfaction with Council
0.9%
1.1%
1.3%
1.3%
1.5%
1.5%
1.7%
2.0%
2.0%
2.5%
2.9%
4.4%
5.8%
6.6%
35.6%
0% 5% 10% 15% 20% 25% 30% 35% 40%
Removal of graffiti
Condition of bicycle paths
Presentation of street trees
Removal of illegally dumped rubbish
Condition of street kerbs
Safety of playgrounds
Condition of rural roads
Presentation of ovals and sports grounds
Adequate stormwater drainage
Condition of local streets
Rapid response service
Condition of footpaths
Presentation of street verges
Presentation of parks and reserves
Nett - City Maintenance & Presentation
City of Playford
2016 Resident Satisfaction Survey
August 2016 Page | 33
Service Area 1: City Maintenance & Presentation
Overview of Importance Rating Scores by Key Demographics
Residents were asked to rate the importance of each criteria.
Importance – overall
Extremely high Removal of illegally dumped rubbish
Adequate stormwater drainage
Rapid response service
Safety of playgrounds
Very high Presentation of parks and reserves
Condition of local streets
Condition of footpaths
Removal of graffiti
High Condition of rural roads
Presentation of ovals and sports grounds
Presentation of street verges
Condition of street kerbs
Presentation of street trees
Moderate Condition of bicycle paths
Importance – by age
Residents aged 35-49 viewed ‘adequate stormwater drainage’ and ‘removal of graffiti’ to be
significantly more important, whilst residents aged 18-34 rated ‘presentation of street verges’, ‘adequate
stormwater drainage’ and ‘removal of graffiti’ as significantly less important.
Residents aged 50-64 rated ‘presentation of street trees’ as significantly more important and ‘safety of
playgrounds’ as significantly less important. Residents aged 65 years and older considered ‘removal of
graffiti’, ‘presentation of parks and reserves’ and ‘presentation of ovals and sports grounds’ to be
significantly more important, and ‘condition of bicycle paths’ to be significantly less important.
Importance – by gender
Females rated ‘condition of footpaths’, ‘condition of street kerbs’ and ‘condition of local streets’ to be
significantly more important.
Importance – by ward
Residents of Ward 3 regarded ‘presentation of street trees’, ‘condition of rural roads’ and ‘rapid response
service’ of significantly higher importance and residents of Ward 5 reported ‘condition of footpaths’,
‘presentation of street trees’ and ‘presentation of ovals and sports grounds’ to be significantly more
important. Residents of Ward 4 rated ‘presentation of street verges’ and ‘presentation of street trees’ as
significantly less important.
Importance – by ratepayer status
Ratepayers regarded ‘presentation of street verges’ to of significantly higher importance.
Importance – compared to 2015
There were no significant differences compared to 2015.

City of Playford
2016 Resident Satisfaction Survey
August 2016 Page | 34
Service Area 1: City Maintenance & Presentation
Importance Mean Scores by Key Demographics
Overall Male Female 18-34 35-49 50-64 65+ Ratepayer Non-
ratepayer
Condition of footpaths 4.25 4.06 4.43 4.15 4.18 4.39 4.38 4.30 4.14
Condition of bicycle paths 3.18 3.09 3.27 3.19 3.42 3.07 2.89 3.21 3.12
Presentation of street verges 3.94 3.94 3.95 3.71 4.02 4.11 4.09 4.05 3.72
Condition of street kerbs 3.93 3.78 4.08 3.77 3.98 4.09 3.98 3.95 3.91
Presentation of street trees 3.90 3.79 4.01 3.69 3.91 4.13 4.01 3.96 3.77
Condition of local streets 4.44 4.34 4.54 4.31 4.55 4.52 4.41 4.50 4.31
Adequate stormwater
drainage 4.61 4.58 4.64 4.43 4.79 4.72 4.52 4.61 4.60
Condition of rural roads 4.19 4.13 4.24 4.02 4.36 4.29 4.08 4.24 4.08
Removal of illegally dumped
rubbish 4.65 4.70 4.60 4.58 4.69 4.68 4.65 4.64 4.67
Removal of graffiti 4.25 4.24 4.26 3.88 4.46 4.35 4.52 4.34 4.07
Presentation of parks and
reserves 4.47 4.40 4.53 4.38 4.43 4.57 4.60 4.47 4.47
Safety of playgrounds 4.56 4.48 4.63 4.63 4.61 4.39 4.55 4.52 4.62
Presentation of ovals and
sports grounds 4.17 4.10 4.24 4.05 4.21 4.16 4.38 4.18 4.16
Rapid response service 4.56 4.52 4.60 4.50 4.61 4.65 4.49 4.56 4.55
Ward 1 Ward 2 Ward 3 Ward 4 Ward 5 Ward 6
Condition of footpaths 4.28 4.17 4.10 4.06 4.58 4.38
Condition of bicycle paths 3.29 2.92 3.43 2.96 3.28 3.30
Presentation of street verges 3.91 3.98 4.03 3.66 4.22 4.08
Condition of street kerbs 3.83 4.01 3.89 3.92 4.07 4.01
Presentation of street trees 3.84 3.90 4.20 3.51 4.24 4.08
Condition of local streets 4.45 4.39 4.59 4.28 4.54 4.54
Adequate stormwater drainage 4.54 4.64 4.65 4.56 4.69 4.73
Condition of rural roads 4.33 4.03 4.56 3.91 4.20 4.06
Removal of illegally dumped rubbish 4.63 4.58 4.78 4.67 4.75 4.50
Removal of graffiti 4.18 4.33 4.38 3.99 4.46 4.44
Presentation of parks and reserves 4.41 4.60 4.49 4.29 4.60 4.60
Safety of playgrounds 4.58 4.53 4.56 4.49 4.64 4.53
Presentation of ovals and sports
grounds 4.09 4.06 4.31 4.03 4.60 4.17
Rapid response service 4.52 4.51 4.79 4.49 4.58 4.61
Scale: 1 = not at all important, 5 = very important
Significantly higher/lower level of importance (by group)

City of Playford
2016 Resident Satisfaction Survey
August 2016 Page | 35
Service Area 1: City Maintenance & Presentation
Detailed Overall Response for Importance
Not at all
important
Not very
important
Somewhat
important Important
Very
important Total % Base
Condition of footpaths 6% 2% 15% 16% 61% 100% 605
Condition of bicycle paths 21% 12% 21% 19% 27% 100% 605
Presentation of street verges 5% 6% 20% 28% 41% 100% 605
Condition of street kerbs 5% 7% 18% 27% 42% 100% 605
Presentation of street trees 5% 7% 23% 24% 41% 100% 605
Condition of local streets 1% 2% 12% 22% 63% 100% 605
Adequate stormwater drainage 1% 2% 6% 17% 74% 100% 605
Condition of rural roads 6% 5% 12% 21% 57% 100% 605
Removal of illegally dumped rubbish 1% 1% 6% 18% 75% 100% 605
Removal of graffiti 4% 3% 13% 23% 57% 100% 605
Presentation of parks and reserves 1% 1% 10% 26% 62% 100% 605
Safety of playgrounds 3% 3% 5% 15% 75% 100% 605
Presentation of ovals and sports
grounds 3% 5% 13% 28% 50% 100% 605
Rapid response service 1% 1% 8% 20% 70% 100% 605

City of Playford
2016 Resident Satisfaction Survey
August 2016 Page | 36
Service Area 1: City Maintenance & Presentation
Overview of Satisfaction Rating Scores by Key Demographics
Residents were asked to rate their satisfaction with each criteria.
Satisfaction – overall
High Presentation of ovals and sports grounds
Safety of playgrounds
Moderately high Presentation of parks and reserves
Rapid response service
Removal of graffiti
Moderate Presentation of street trees
Adequate stormwater drainage
Condition of street kerbs
Condition of local streets
Condition of bicycle paths
Removal of illegally dumped rubbish
Condition of rural roads
Presentation of street verges
Moderately low Condition of footpaths
Satisfaction – by age
18-34 year olds were significantly more satisfied with ‘condition of local streets’ and ‘rapid response
service’. Residents aged 35-49 were significantly less satisfied with ‘presentation of parks and reserves’
and ‘presentation of ovals and sportsgrounds’, whilst residents aged 50-64 were significantly less satisfied
with ‘condition of street kerbs’, ‘presentation of street trees’, ‘condition of local streets’, ‘removal of
illegally dumped rubbish’ and ‘rapid response service’.
Residents aged 65 years and over were significantly more satisfied with ‘condition of bicycle paths’,
‘presentation of street verges’, ‘removal of illegally dumped rubbish’, ‘removal of graffiti’, ‘presentation
of parks and reserves’, ‘safety of playgrounds’ and ‘presentation of ovals and sports grounds’.
Satisfaction – by gender
Females were significantly more satisfied with ‘presentation of parks and reserves’.
Satisfaction – by area
Residents of Ward 2 were significantly more satisfied with ‘condition of local streets’ and ‘removal of
illegally dumped rubbish’, whilst residents of Ward 4 were significantly more satisfied with ‘presentation of
parks and reserves’.
Residents of Ward 5 were significantly more satisfied with:
Condition of footpaths Condition of rural roads
Presentation of street verges Removal of graffiti
Presentation of street trees Removal of illegally dumped rubbish
Condition of local streets Presentation of ovals and sports grounds
Presentation of parks and reserves
Residents of Ward 1 were significantly less satisfied with:
Condition of footpaths Condition of rural roads
Presentation of street verges Removal of illegally dumped rubbish
Condition of local street Presentation of parks and reserves
Residents of Ward 3 were significantly less satisfied with ‘presentation of street trees’.

City of Playford
2016 Resident Satisfaction Survey
August 2016 Page | 37
Service Area 1: City Maintenance & Presentation
Overview of Satisfaction Rating Scores by Key Demographics
Satisfaction – by ratepayer status
Non-ratepayers were significantly more satisfied with ‘presentation of street verges’, ‘condition of street
kerbs’, ‘presentation of street trees’ and ‘condition of local streets’, than non-ratepayers.
Satisfaction – compared to 2015
Residents were significantly more satisfied with ‘condition of local streets’ in 2016 compared to 2015, but
significantly less satisfied with ‘adequate stormwater drainage’.

City of Playford
2016 Resident Satisfaction Survey
August 2016 Page | 38
Service Area 1: City Maintenance & Presentation
Satisfaction Mean Scores by Key Demographics
Overall Male Female 18-34 35-49 50-64 65+ Ratepayer Non-
ratepayer
Condition of footpaths 2.97 2.98 2.96 3.18 2.77 2.88 3.03 2.88 3.18
Condition of bicycle paths 3.26 3.25 3.28 3.31 3.03 3.33 3.57 3.29 3.20
Presentation of street verges 3.15 3.09 3.21 3.26 3.00 2.97 3.47 3.01 3.50
Condition of street kerbs 3.36 3.40 3.33 3.55 3.24 3.14 3.56 3.22 3.69
Presentation of street trees 3.49 3.52 3.46 3.62 3.50 3.26 3.60 3.39 3.71
Condition of local streets 3.27 3.30 3.25 3.52 3.14 2.99 3.45 3.15 3.57
Adequate stormwater
drainage 3.37 3.42 3.31 3.56 3.20 3.20 3.56 3.32 3.47
Condition of rural roads 3.16 3.20 3.12 3.39 2.97 2.98 3.32 3.07 3.37
Removal of illegally dumped
rubbish 3.20 3.21 3.20 3.43 3.02 2.95 3.41 3.14 3.35
Removal of graffiti 3.66 3.70 3.61 3.76 3.56 3.50 3.84 3.63 3.73
Presentation of parks and
reserves 3.88 3.71 4.03 3.84 3.68 3.88 4.26 3.81 4.01
Safety of playgrounds 3.93 3.88 3.98 3.94 3.81 3.90 4.17 3.89 4.02
Presentation of ovals and
sports grounds 4.12 4.08 4.16 4.22 3.92 4.13 4.30 4.08 4.21
Rapid response service 3.78 3.73 3.84 4.03 3.64 3.48 3.93 3.73 3.89
Ward 1 Ward 2 Ward 3 Ward 4 Ward 5 Ward 6
Condition of footpaths 2.72 3.03 2.88 2.87 3.53 3.15
Condition of bicycle paths 3.13 3.14 3.08 3.64 3.39 3.48
Presentation of street verges 2.93 3.28 3.07 2.92 3.73 3.17
Condition of street kerbs 3.20 3.50 3.15 3.30 3.66 3.60
Presentation of street trees 3.41 3.54 3.03 3.44 4.05 3.51
Condition of local streets 3.00 3.57 3.12 3.28 3.62 3.36
Adequate stormwater drainage 3.19 3.48 3.48 3.42 3.35 3.49
Condition of rural roads 2.84 3.39 2.95 3.19 3.76 3.33
Removal of illegally dumped rubbish 2.95 3.64 2.92 3.11 3.59 3.28
Removal of graffiti 3.48 3.82 3.53 3.63 4.12 3.50
Presentation of parks and reserves 3.66 4.00 3.50 4.11 4.14 3.97
Safety of playgrounds 3.82 4.09 3.80 3.84 4.14 4.07
Presentation of ovals and sports
grounds 3.99 4.30 3.91 4.10 4.45 4.09
Rapid response service 3.71 3.88 3.83 3.86 3.83 3.57
Scale: 1 = not at all satisfied, 5 = very satisfied
Significantly higher/lower level of satisfaction (by group)

City of Playford
2016 Resident Satisfaction Survey
August 2016 Page | 39
Service Area 1: City Maintenance & Presentation
Detailed Overall Response for Satisfaction
Not at all
satisfied
Not very
satisfied
Somewhat
satisfied Satisfied
Very
satisfied Total % Base
Condition of footpaths 17% 16% 34% 19% 14% 100% 467
Condition of bicycle paths 13% 14% 25% 29% 18% 100% 276
Presentation of street verges 13% 13% 32% 29% 13% 100% 419
Condition of street kerbs 9% 11% 34% 26% 19% 100% 419
Presentation of street trees 6% 14% 26% 32% 22% 100% 397
Condition of local streets 6% 15% 38% 28% 13% 100% 514
Adequate stormwater drainage 10% 15% 24% 30% 21% 100% 548
Condition of rural roads 11% 13% 37% 27% 12% 100% 466
Removal of illegally dumped
rubbish 13% 18% 24% 26% 19% 100% 560
Removal of graffiti 7% 10% 23% 33% 28% 100% 483
Presentation of parks and reserves 5% 4% 21% 40% 30% 100% 531
Safety of playgrounds 3% 3% 25% 34% 34% 100% 538
Presentation of ovals and sports
grounds 0% 3% 17% 44% 35% 100% 472
Rapid response service 3% 4% 29% 37% 26% 100% 530

City of Playford
2016 Resident Satisfaction Survey
August 2016 Page | 40
Service Area 2: Health, Environment & Regulatory
Services
Shapley Regression
Contributes to Almost 14% of Overall Satisfaction with Council
1.2%
1.6%
2.3%
2.5%
2.8%
3.3%
13.7%
0% 5% 10% 15% 20% 25% 30% 35% 40%
Immunisation service
Kerbside waste collection
Enforcement of local laws
Protecting & improving native vegetation and
biodiversity
Public health & safety
Hard waste collection
Nett - Health, Environment & Regulatory Services

City of Playford
2016 Resident Satisfaction Survey
August 2016 Page | 41
Service Area 2: Health, Environment & Regulatory
Services
Overview of Importance Rating Scores by Key Demographics
Residents were asked to rate the importance of each criteria.
Importance – overall
Extremely high Public health & safety
Kerbside waste collection
Enforcement of local laws
Very high Immunisation service
Hard waste collection
Protecting & improving native vegetation and biodiversity
Importance – by age
Residents aged 18-34 rated ‘kerbside waste collection’ and ‘hard waste collection’ as significantly less
important, whilst those aged 50 and over considered these to be significantly more important.
Importance – by gender
Females rated ‘immunisation service’ and ‘enforcement of local laws’ as significantly more important.
Importance – by ward
Residents of Ward 1 regarded ‘hard waste collection’ and ‘protecting & improving native vegetation
and biodiversity’ as significantly less important.
Ward 3 residents considered ‘public health & safety’ and ‘protecting & improving native vegetation and
biodiversity’ as significantly higher in importance, whilst residents of Ward 4 rated ‘immunisation service’
as significantly higher. Residents of Ward 5 rated ‘hard waste collection’ as significantly more important,
and residents of Ward 6 rated ‘protecting & improving native vegetation and biodiversity’ as significantly
higher.
Importance – by ratepayer status
There were no significant differences by ratepayer status.
Importance – compared to 2015
Residents rated ‘public health and safety’ as significantly more important than in 2015.

City of Playford
2016 Resident Satisfaction Survey
August 2016 Page | 42
Service Area 2: Health, Environment & Regulatory
Services
Importance Mean Scores by Key Demographics
Overall Male Female 18-34 35-49 50-64 65+ Ratepayer Non-
ratepayer
Public health & safety 4.74 4.69 4.79 4.71 4.77 4.78 4.71 4.70 4.82
Immunisation service 4.49 4.38 4.60 4.48 4.63 4.36 4.44 4.45 4.59
Enforcement of local laws 4.52 4.42 4.62 4.57 4.44 4.53 4.57 4.47 4.64
Kerbside waste collection 4.71 4.68 4.75 4.58 4.73 4.82 4.83 4.70 4.75
Hard waste collection 4.45 4.37 4.53 4.25 4.45 4.60 4.67 4.44 4.46
Protecting & improving native
vegetation and biodiversity 4.35 4.28 4.42 4.31 4.30 4.42 4.45 4.36 4.36
Ward 1 Ward 2 Ward 3 Ward 4 Ward 5 Ward 6
Public health & safety 4.66 4.79 4.89 4.73 4.81 4.72
Immunisation service 4.43 4.42 4.54 4.70 4.49 4.33
Enforcement of local laws 4.48 4.57 4.61 4.64 4.45 4.35
Kerbside waste collection 4.61 4.78 4.75 4.75 4.80 4.74
Hard waste collection 4.29 4.48 4.49 4.50 4.71 4.46
Protecting & improving native
vegetation and biodiversity 4.22 4.37 4.58 4.28 4.35 4.69
Scale: 1 = not at all important, 5 = very important
Significantly higher/lower level of importance (by group)
Not at all
important
Not very
important
Somewhat
important Important
Very
important Total % Base
Public health & safety 1% 1% 4% 12% 82% 100% 605
Immunisation service 4% 3% 8% 13% 73% 100% 605
Enforcement of local laws 2% 3% 6% 17% 71% 100% 605
Kerbside waste collection 0% 1% 5% 16% 78% 100% 605
Hard waste collection 1% 2% 12% 21% 64% 100% 605
Protecting & improving native
vegetation and biodiversity 1% 1% 15% 27% 56% 100% 605
City of Playford
2016 Resident Satisfaction Survey
August 2016 Page | 43
Service Area 2: Health, Environment & Regulatory
Services
Overview of Satisfaction Rating Scores by Key Demographics
Residents were asked to rate their satisfaction with each criteria.
Satisfaction – overall
Very high Kerbside waste collection
Immunisation service
High Hard waste collection
Moderately high Public health and safety
Protecting & improving native vegetation and biodiversity
Enforcement of local laws
Satisfaction – by age
Residents aged 65 years and over were significantly more satisfied with ‘kerbside waste collection’ and
‘hard waste collection’, whilst 18-34 year olds were significantly less satisfied with ‘kerbside waste
collection’ but significantly more satisfied with ‘enforcement of local laws’.
Those aged 50-64 were significantly less satisfied with both ‘public health and safety’ and ‘enforcement
of local laws’.
Satisfaction – by gender
Females were significantly more satisfied with ‘immunisation service’.
Satisfaction – by area
Residents of Ward 1 were significantly less satisfied with ‘hard waste collection’, whilst residents of Ward 3
were significantly less satisfied with ‘protecting and improving native vegetation and biodiversity’.
Residents of Ward 5 were significantly more satisfied with:
Enforcement of local laws
Kerbside waste collection
Hard waste collection
Protecting & improving native vegetation and biodiversity
Satisfaction – by ratepayer status
Non-ratepayers were significantly more satisfied with ‘enforcement of local laws’ and ‘hard waste
collection’.
Satisfaction – compared to 2015
Satisfaction with ‘hard waste collection’ was significantly higher in 2016.

City of Playford
2016 Resident Satisfaction Survey
August 2016 Page | 44
Service Area 2: Health, Environment & Regulatory
Services
Satisfaction Mean Scores by Key Demographics
Overall Male Female 18-34 35-49 50-64 65+ Ratepayer Non-
ratepayer
Public health & safety 3.84 3.85 3.84 3.97 3.83 3.62 3.93 3.78 3.97
Immunisation service 4.28 4.10 4.44 4.33 4.22 4.23 4.33 4.21 4.41
Enforcement of local laws 3.77 3.74 3.80 4.07 3.62 3.54 3.70 3.66 3.98
Kerbside waste collection 4.32 4.24 4.40 4.11 4.31 4.43 4.61 4.28 4.41
Hard waste collection 4.01 3.90 4.10 4.08 3.90 3.89 4.20 3.89 4.25
Protecting & improving native
vegetation and biodiversity 3.79 3.70 3.87 3.88 3.67 3.78 3.86 3.72 3.95
Ward 1 Ward 2 Ward 3 Ward 4 Ward 5 Ward 6
Public health & safety 3.80 3.83 3.88 3.91 3.91 3.76
Immunisation service 4.24 4.32 4.45 4.25 4.40 4.01
Enforcement of local laws 3.65 3.91 3.62 3.84 4.07 3.56
Kerbside waste collection 4.23 4.30 4.42 4.23 4.63 4.32
Hard waste collection 3.75 4.13 3.98 4.10 4.37 3.95
Protecting & improving native
vegetation and biodiversity 3.77 3.76 3.48 3.83 4.15 3.82
Scale: 1 = not at all satisfied, 5 = very satisfied
Significantly higher/lower level of satisfaction (by group)
Not at all
satisfied
Not very
satisfied
Somewhat
satisfied Satisfied
Very
satisfied Total % Base
Public health & safety 1% 5% 31% 36% 28% 100% 570
Immunisation service 1% 2% 15% 31% 51% 100% 518
Enforcement of local laws 4% 10% 21% 35% 30% 100% 534
Kerbside waste collection 2% 5% 10% 27% 57% 100% 570
Hard waste collection 5% 8% 15% 26% 47% 100% 514
Protecting & improving native
vegetation and biodiversity 2% 6% 30% 36% 26% 100% 499

City of Playford
2016 Resident Satisfaction Survey
August 2016 Page | 45
Service Area 3: Community Services
Shapley Regression
Contributes to Over 25% of Overall Satisfaction with Council
0.8%
0.8%
1.6%
1.8%
2.4%
3.0%
3.2%
3.4%
4.2%
4.3%
25.4%
0% 5% 10% 15% 20% 25% 30% 35% 40%
Planning and building advice & assessment
Providing support & facilities for sporting clubs
Support for volunteer programs
Access to community venues
Library service
Health initiatives
Supporting local community development
Supporting business and industry development
Council events
Availability of community services
Nett - Community Services

City of Playford
2016 Resident Satisfaction Survey
August 2016 Page | 46
Service Area 3: Community Service
Overview of Importance Rating Scores by Key Demographics
Residents were asked to rate the importance of each criteria.
Importance – overall
Very high Supporting business and industry development
Health initiatives
Availability of community services
Supporting local community development
Support for volunteer programs
High Access to community venues
Library service
Providing support & facilities for sporting clubs
Planning and building advice & assessment
Moderately high Council events
Importance – by age
18-34 year olds considered ‘support for volunteer programs’, ‘planning and building advice &
assessment’, ‘availability of community services’ and ‘supporting local community development’ as
significantly less important.
35-49 year olds valued ‘supporting local community development’ as significantly more important, whilst
50-64 year olds rated ‘support for volunteer programs’ as significantly more important. Residents aged 65
years and over considered ‘support for volunteer programs’, ‘planning and building advice &
assessment’, ‘access to community venues’, ‘council events’ and ‘availability of community services’ as
significantly more important.
Importance – by gender
Females rated ‘support for volunteer programs’, ‘access to community venues’, ‘council events’, ‘library
service’, ‘availability of community services’, ‘supporting local community development’ and ‘health
initiatives’ as significantly higher in importance.
Importance – by ward
Residents of Ward 1 considered ‘support for volunteer programs’ as significantly less important, whilst
residents of Ward 3 rated ‘support for volunteer programs’ as significantly more important. Both ward 3
and Ward 5 rated ‘planning and building advice & assessment’ as significantly more important’.
Importance – by ratepayer status
Non-ratepayers rated ‘access to community venues’ and ‘council events’ as significantly more
important.
Importance – compared to 2015
‘Access to community venues’ was rated as significantly more important than in 2015.

City of Playford
2016 Resident Satisfaction Survey
August 2016 Page | 47
Service Area 3: Community Service
Importance Mean Scores by Key Demographics
Overall Male Female 18-34 35-49 50-64 65+ Ratepayer Non-
ratepayer
Support for volunteer programs 4.25 4.09 4.40 4.00 4.18 4.44 4.64 4.24 4.28
Supporting business and industry
development 4.45 4.39 4.51 4.32 4.44 4.59 4.56 4.45 4.46
Planning and building advice &
assessment 4.01 3.98 4.03 3.80 4.05 4.12 4.21 4.04 3.94
Access to community venues 4.14 4.00 4.28 4.09 4.07 4.07 4.47 4.06 4.30
Council events 3.84 3.68 4.00 3.78 3.79 3.83 4.09 3.73 4.07
Library service 4.11 3.90 4.31 4.08 4.11 4.03 4.27 4.07 4.21
Providing support & facilities for
sporting clubs 4.05 4.03 4.08 3.90 4.12 4.11 4.18 4.12 3.92
Availability of community
services 4.28 4.15 4.41 4.08 4.31 4.35 4.55 4.28 4.29
Supporting local community
development 4.26 4.14 4.37 4.06 4.42 4.28 4.34 4.25 4.29
Health initiatives 4.44 4.27 4.60 4.39 4.41 4.47 4.53 4.38 4.56
Ward 1 Ward 2 Ward 3 Ward 4 Ward 5 Ward 6
Support for volunteer programs 4.04 4.31 4.52 4.22 4.43 4.40
Supporting business and industry
development 4.36 4.44 4.55 4.39 4.60 4.64
Planning and building advice &
assessment 3.87 4.03 4.33 3.84 4.26 4.05
Access to community venues 4.01 4.33 4.07 4.09 4.37 4.12
Council events 3.74 3.97 3.99 3.87 3.81 3.81
Library service 4.06 3.99 4.27 4.03 4.31 4.20
Providing support & facilities for
sporting clubs 4.01 4.02 4.27 3.91 4.26 4.01
Availability of community services 4.14 4.34 4.36 4.27 4.40 4.44
Supporting local community
development 4.14 4.38 4.40 4.15 4.35 4.39
Health initiatives 4.32 4.48 4.44 4.43 4.63 4.53
Scale: 1 = not at all important, 5 = very important
Significantly higher/lower level of importance (by group)

City of Playford
2016 Resident Satisfaction Survey
August 2016 Page | 48
Service Area 3: Community Service
Detailed Overall Response for Importance
Not at all
important
Not very
important
Somewhat
important Important
Very
important Total % Base
Support for volunteer programs 1% 4% 15% 28% 52% 100% 605
Supporting business and industry
development 1% 3% 9% 24% 63% 100% 605
Planning and building advice &
assessment 4% 5% 20% 29% 42% 100% 605
Access to community venues 2% 4% 21% 26% 48% 100% 605
Council events 5% 6% 27% 22% 40% 100% 605
Library service 5% 4% 17% 21% 53% 100% 605
Providing support & facilities for
sporting clubs 4% 6% 20% 25% 47% 100% 605
Availability of community services 2% 2% 13% 29% 53% 100% 605
Supporting local community
development 3% 1% 16% 28% 52% 100% 605
Health initiatives 1% 3% 10% 21% 64% 100% 605

City of Playford
2016 Resident Satisfaction Survey
August 2016 Page | 49
Service Area 3: Community Service
Overview of Satisfaction Rating Scores by Key Demographics
Residents were asked to rate their satisfaction with each criteria.
Satisfaction – overall
High Library service
Council events
Access to community venues
Providing support & facilities for sporting clubs
Moderately high Support for volunteer programs
Health initiatives
Availability of community services
Supporting local community development
Moderate Supporting business and industry development
Planning and building advice & assessment
Satisfaction – by age
18-34 year olds were significantly more satisfied with ‘supporting local community development’, whilst
residents aged 65 years and over were significantly more satisfied with ‘support for volunteer programs’,
‘supporting business and industry development’, ‘access to community venues’, ‘availability of
community services’ and ‘health initiatives’.
Residents aged 35-49 were significantly less satisfied with ‘supporting business and industry development’,
‘planning and building advice & assessment’ and ‘supporting local community development’. Residents
aged 50-64 were significantly less satisfied with ‘availability of community services’ and ‘health initiatives’.
Satisfaction – by gender
There were no significant differences between males and females.
Satisfaction – by area
Residents of Ward 1 were significantly less satisfied with ‘planning and building advice & assessment’,
whilst residents of Ward 2 were significantly less satisfied with ‘library service’ and residents of Ward 6 were
significantly less satisfied with ‘supporting business and industry development’ and ‘’health initiatives’.
Residents of Ward 5 were significantly more satisfied with:
Support for volunteer programs Library service
Supporting business and industry development Supporting local community development
Planning and building advice & assessment Health initiatives
Council events
Satisfaction – by ratepayer status
Non-ratepayers were significantly less satisfied with ‘supporting business and industry development’,
‘planning and building advice & assessment’ and ‘supporting local community development’.
Satisfaction – compared to 2015
Residents were significantly more satisfied with ‘providing support & facilities for sporting clubs’ than in
2015.

City of Playford
2016 Resident Satisfaction Survey
August 2016 Page | 50
Service Area 3: Community Service
Satisfaction Mean Scores by Key Demographics
Overall Male Female 18-34 35-49 50-64 65+ Ratepayer Non-
ratepayer
Support for volunteer programs 3.87 3.76 3.96 3.87 3.75 3.81 4.14 3.82 3.98
Supporting business and industry
development 3.54 3.42 3.65 3.69 3.34 3.38 3.76 3.41 3.80
Planning and building advice &
assessment 3.54 3.55 3.53 3.75 3.34 3.40 3.67 3.42 3.82
Access to community venues 3.98 4.03 3.94 4.03 3.81 3.96 4.16 4.01 3.93
Council events 4.14 4.20 4.09 4.21 4.12 4.10 4.10 4.10 4.22
Library service 4.14 4.01 4.26 4.14 4.10 4.07 4.31 4.14 4.15
Providing support & facilities for
sporting clubs 3.96 3.93 3.99 3.97 3.92 3.93 4.08 4.00 3.89
Availability of community
services 3.82 3.83 3.82 3.95 3.75 3.59 4.01 3.79 3.89
Supporting local community
development 3.76 3.66 3.84 4.02 3.54 3.64 3.86 3.67 3.95
Health initiatives 3.86 3.82 3.89 3.96 3.74 3.68 4.09 3.77 4.02
Ward 1 Ward 2 Ward 3 Ward 4 Ward 5 Ward 6
Support for volunteer programs 3.87 3.64 3.73 4.01 4.19 3.80
Supporting business and industry
development 3.46 3.70 3.38 3.49 3.94 3.21
Planning and building advice &
assessment 3.30 3.76 3.29 3.71 3.96 3.36
Access to community venues 4.02 3.80 3.83 3.95 4.21 4.08
Council events 4.13 4.01 4.05 4.19 4.43 4.05
Library service 4.22 3.59 4.05 4.05 4.69 4.35
Providing support & facilities for
sporting clubs 4.03 3.89 3.80 3.92 4.19 3.84
Availability of community services 3.71 3.78 3.67 4.12 4.03 3.64
Supporting local community
development 3.61 3.89 3.60 3.82 4.05 3.67
Health initiatives 3.83 3.88 3.81 3.87 4.12 3.50
Scale: 1 = not at all satisfied, 5 = very satisfied
Significantly higher/lower level of satisfaction (by group)

City of Playford
2016 Resident Satisfaction Survey
August 2016 Page | 51
Service Area 3: Community Service
Detailed Overall Response for Satisfaction
Not at all
satisfied
Not very
satisfied
Somewhat
satisfied Satisfied
Very
satisfied Total % Base
Support for volunteer programs 1% 4% 30% 36% 29% 100% 477
Supporting business and industry
development 3% 10% 36% 31% 19% 100% 525
Planning and building advice &
assessment 4% 10% 32% 37% 17% 100% 426
Access to community venues 1% 5% 21% 41% 32% 100% 443
Council events 1% 2% 20% 39% 39% 100% 371
Library service 4% 6% 14% 24% 52% 100% 443
Providing support & facilities for
sporting clubs 1% 6% 21% 40% 32% 100% 429
Availability of community services 2% 5% 28% 40% 25% 100% 493
Supporting local community
development 1% 5% 32% 39% 23% 100% 481
Health initiatives 1% 8% 26% 35% 30% 100% 515

City of Playford
2016 Resident Satisfaction Survey
August 2016 Page | 52
Service Area 4: Accountability, Advocacy &
Management
Shapley Regression
Contributes to Over 25% of Overall Satisfaction with Council
1.3%
2.3%
3.7%
4.1%
4.2%
4.5%
5.2%
25.3%
0% 5% 10% 15% 20% 25% 30% 35% 40%
Representation by Elected Members
Being open & accountable to the community
Planning for the future
Council provide value for money for the rates paid
Communication on Councils visions & goals
Managing growth and major urban developments
Community input to Council decision-making
Nett - Community Services

City of Playford
2016 Resident Satisfaction Survey
August 2016 Page | 53
Service Area 4: Accountability, Advocacy &
Management
Overview of Importance Rating Scores by Key Demographics
Residents were asked to rate the importance of each criteria.
Importance – overall
Extremely high Being open & accountable to the community
Planning for the future
Council provides value for money for the rates paid
Very high Community input to Council decision-making
Managing growth and major urban developments
Communication on Council’s visions & goals
High Representation by Elected Members
Importance – by age
Residents aged 18-34 rated ‘representation by Elected Members’ as significantly less important, whilst
residents aged 50 over rated this significantly more important.
Those aged 35-49 considered ‘being open & accountable to the community’ and ‘communication on
Council’s visions and goals’ as significantly more important.
Importance – by gender
There were no significant differences by gender.
Importance – by ward
Residents of Ward 2 rated ‘planning for the future’ as significantly more important, whilst residents of Ward
3 rated ‘being open & accountable to the community’ ‘communication on Council’s visions and goals’
and ‘community input to Council decision-making’ as significantly more important.
Residents of Ward 4 considered ‘managing growth and major urban development’ and ‘Council provide
value for money for the rates paid’ as significantly less important.
Importance – by ratepayer status
Ratepayers viewed ‘Council provides value for money for the rates paid’ as significantly more important.
Importance – compared to 2015
There were no significant differences between 2015 and 2016.

City of Playford
2016 Resident Satisfaction Survey
August 2016 Page | 54
Service Area 4: Accountability, Advocacy &
Management
Importance Mean Scores by Key Demographics
Overall Male Female 18-34 35-49 50-64 65+ Ratepayer Non-
ratepayer
Planning for the future 4.61 4.56 4.66 4.53 4.69 4.63 4.62 4.65 4.53
Managing growth and major
urban developments 4.42 4.47 4.37 4.29 4.53 4.45 4.45 4.47 4.31
Being open & accountable to the
community 4.72 4.71 4.73 4.61 4.83 4.76 4.71 4.76 4.64
Community input to Council
decision-making 4.45 4.48 4.43 4.30 4.59 4.53 4.43 4.49 4.38
Council provides value for money
for the rates paid 4.58 4.60 4.57 4.51 4.61 4.64 4.60 4.67 4.41
Communication on Council’s
visions & goals 4.27 4.27 4.27 4.12 4.42 4.25 4.34 4.29 4.22
Representation by Elected
Members 4.17 4.10 4.24 3.96 4.12 4.36 4.47 4.16 4.20
Ward 1 Ward 2 Ward 3 Ward 4 Ward 5 Ward 6
Planning for the future 4.64 4.76 4.74 4.43 4.54 4.57
Managing growth and major urban
developments 4.48 4.45 4.54 4.18 4.42 4.49
Being open & accountable to the
community 4.69 4.68 4.88 4.63 4.78 4.80
Community input to Council decision-
making 4.48 4.45 4.65 4.28 4.47 4.45
Council provides value for money for
the rates paid 4.65 4.59 4.67 4.31 4.69 4.61
Communication on Council’s visions
& goals 4.20 4.21 4.53 4.14 4.47 4.30
Representation by Elected Members 4.05 4.16 4.25 4.18 4.40 4.20
Scale: 1 = not at all important, 5 = very important
Significantly higher/lower level of importance (by group)
Not at all
important
Not very
important
Somewhat
important Important
Very
important Total % Base
Planning for the future 2% 1% 4% 19% 74% 100% 605
Managing growth and major urban
developments 1% 2% 12% 25% 61% 100% 605
Being open & accountable to the
community 0% 1% 5% 14% 79% 100% 605
Community input to Council decision-
making 2% 1% 11% 23% 64% 100% 605
Council provide value for money for
the rates paid 2% 2% 7% 14% 75% 100% 605
Communication on Councils visions &
goals 2% 2% 14% 31% 51% 100% 605
Representation by Elected Members 2% 4% 20% 24% 50% 100% 605

City of Playford
2016 Resident Satisfaction Survey
August 2016 Page | 55
Service Area 4: Accountability, Advocacy &
Management
Overview of Satisfaction Rating Scores by Key Demographics
Residents were asked to rate their satisfaction with each criteria.
Satisfaction – overall
Moderate Planning for the future
Managing growth and major urban developments
Communication on Council’s visions & goals
Being open & accountable to the community
Community input to Council decision-making
Representation by Elected Members
Moderately low Council provide value for money for the rates paid
Satisfaction – by age
With the exception of ‘communication on Council’s visions & goals’, 18-34 year olds were significantly
more satisfied with all criteria. Residents aged 65 years and over were significantly more satisfied with
‘planning for the future’ and ‘being open & accountable to the community’.
35-49 year olds were significantly less satisfied with ‘planning for the future’ and ‘managing growth and
major urban developments’, whilst 50-64 year olds were significantly less satisfied with ‘being open &
accountable to the community’, ‘community input to Council decision-making’, ‘Council provide value
for money for the rates paid’, ‘communication on Council’s visions & goals’ and ‘representation by
Elected Members’.
Satisfaction – by gender
Females were significantly more satisfied with ‘being open & accountable to the community’,
‘community input to Council decision-making’ and ‘representation by Elected Members’.
Satisfaction – by area
Residents of Ward 2 were significantly more satisfied with ‘being open & accountable to the community’,
whilst residents of Ward 5 were significantly more satisfied with all criteria.
Residents of Ward 1 were significantly less satisfied with ‘planning for the future’, ‘managing growth and
major urban developments’, ‘being open & accountable to the community’ and ‘representation by
Elected Members’.
Satisfaction – by ratepayer status
Non-ratepayers were significantly more satisfied for all criteria.
Satisfaction – compared to 2015
There were no significant differences in satisfaction between 2015 and 2016.

City of Playford
2016 Resident Satisfaction Survey
August 2016 Page | 56
Service Area 4: Accountability, Advocacy &
Management
Satisfaction Mean Scores by Key Demographics
Overall Male Female 18-34 35-49 50-64 65+ Ratepayer Non-
ratepayer
Planning for the future 3.56 3.47 3.65 3.78 3.27 3.44 3.82 3.43 3.86
Managing growth and major
urban developments 3.44 3.34 3.55 3.69 3.15 3.37 3.60 3.35 3.66
Being open & accountable to the
community 3.25 3.09 3.40 3.50 3.06 2.97 3.45 3.12 3.51
Community input to Council
decision-making 3.16 3.02 3.30 3.43 2.99 2.91 3.31 3.04 3.42
Council provides value for money
for the rates paid 2.94 2.83 3.05 3.19 2.77 2.68 3.08 2.78 3.31
Communication on Council’s
visions & goals 3.31 3.23 3.38 3.51 3.23 3.06 3.38 3.14 3.68
Representation by Elected
Members 3.14 2.87 3.38 3.46 3.00 2.86 3.22 2.97 3.49
Ward 1 Ward 2 Ward 3 Ward 4 Ward 5 Ward 6
Planning for the future 3.26 3.68 3.34 3.82 4.23 3.39
Managing growth and major urban
developments 3.19 3.62 3.27 3.42 4.09 3.42
Being open & accountable to the
community 3.00 3.56 3.17 3.12 3.69 3.23
Community input to Council decision-
making 2.98 3.32 3.01 3.07 3.76 3.04
Council provides value for money for
the rates paid 2.82 3.02 2.84 2.90 3.41 2.73
Communication on Council’s visions
& goals 3.14 3.53 3.36 3.00 3.76 3.32
Representation by Elected Members 2.89 3.34 3.17 2.98 3.63 3.11
Scale: 1 = not at all satisfied, 5 = very satisfied
Significantly higher/lower level of satisfaction (by group)
Not at all
satisfied
Not very
satisfied
Somewhat
satisfied Satisfied
Very
satisfied Total % Base
Planning for the future 5% 8% 34% 32% 21% 100% 560
Managing growth and major urban
developments 6% 10% 34% 33% 17% 100% 516
Being open & accountable to the
community 10% 15% 31% 27% 16% 100% 565
Community input to Council decision-
making 10% 18% 31% 30% 12% 100% 518
Council provides value for money for
the rates paid 14% 18% 36% 22% 10% 100% 535
Communication on Council’s visions &
goals 6% 17% 29% 33% 14% 100% 499
Representation by Elected Members 14% 16% 28% 27% 16% 100% 446

City of Playford
2016 Resident Satisfaction Survey
August 2016 Page | 57
Comparison to Previous Research
Service/ Facility Importance Satisfaction
2016 2015 2016 2015
Condition of footpaths 4.25 4.32 2.97 2.93
Condition of bicycle paths 3.18 3.33 3.26 3.31
Presentation of street verges 3.94 3.81 3.15 3.17
Condition of street kerbs 3.93 3.93 3.36 3.42
Presentation of street trees 3.90 3.82 3.49 3.36
Condition of local streets 4.44 4.47 3.27 3.06
Adequate stormwater drainage 4.61 4.51 3.37 3.66
Condition of rural roads 4.19 4.13 3.16 3.07
Removal of illegally dumped rubbish 4.65 4.67 3.20 3.29
Removal of graffiti 4.25 4.26 3.66 3.66
Presentation of parks and reserves 4.47 4.43 3.88 3.92
Safety of playgrounds 4.56 4.61 3.93 3.94
Presentation of ovals and sports grounds 4.17 4.26 4.12 4.01
Rapid response service 4.56 4.54 3.78 3.66
Public health & safety 4.74 4.57 3.84 3.80
Immunisation service 4.49 4.49 4.28 4.30
Enforcement of local laws 4.52 4.46 3.77 3.74
Kerbside waste collection 4.71 4.78 4.32 4.28
Hard waste collection 4.45 4.44 4.01 3.79
Protecting & improving native vegetation and biodiversity 4.35 4.34 3.79 3.66
Support for volunteer programs 4.25 4.31 3.87 3.75
Supporting business and industry development 4.45 4.50 3.54 3.39
Planning and building advice & assessment 4.01 4.10 3.54 3.64
Access to community venues 4.14 3.96 3.98 3.92
Council events 3.84 3.97 4.14 4.20
Library service 4.11 3.99 4.14 4.07
Providing support & facilities for sporting clubs 4.05 4.07 3.96 3.78
Availability of community services 4.28 4.34 3.82 3.64
Supporting local community development 4.26 4.30 3.76 3.65
Health initiatives 4.44 4.43 3.86 3.82
Planning for the future 4.61 4.61 3.56 3.55
Managing growth and major urban developments 4.42 4.38 3.44 3.51
Being open & accountable to the community 4.72 4.68 3.25 3.32
Community input to Council decision-making 4.45 4.44 3.16 3.23
Council provide value for money for the rates paid 4.58 4.44 2.94 3.00
Communication on Councils visions & goals 4.27 4.23 3.31 3.36
Representation by Elected Members 4.17 4.14 3.14 3.26
Significantly higher/lower level of importance/satisfaction by year

City of Playford
Community Research
August 2016 Page | 58
Section A –
Customer Service

City of Playford
2016 Resident Satisfaction Survey
August 2016 Page | 59
Contact with Council Summary
39% of residents had made contact with Council within the last 12 months, with females contacting
Council significantly more.
Q1a. Have you contacted Council in the last 12 months?
Overall
2016
Overall
2015 Male Female 18-34 35-49 50-64 65+ Ratepayer
Non-
ratepayer
Yes 39% 33% 30% 47%▲ 36% 40% 38% 45% 42% 33%
No 61% 67% 70%▲ 53% 64% 60% 62% 55% 58% 67%
Ward 1 Ward 2 Ward 3 Ward 4 Ward 5 Ward 6
Yes 39% 38% 43% 32% 43% 43%
No 61% 62% 57% 68% 57% 57%
▲▼= significantly higher/lower level of contact (by group)
Yes
39%
No
61%
Base: n=605

City of Playford
2016 Resident Satisfaction Survey
August 2016 Page | 60
Method of Contact with Council Summary
In 2016, the ‘telephone’ continued to be the primary method that the majority of residents used to
contact council staff (63%), followed by ‘in person at the Customer Service Centre’ (19%). There was a
significant increase in the number of residents who contacted Council ‘in person at a different Council
location’ from 2015 to 2016
35-49 year olds and ratepayers were significantly more likely to contact Council by ‘email’, whilst 18-34
years surprisingly were significantly less likely to contact Council via this method.
Non-ratepayers were significantly more likely to contact Council ‘in person at a different Council
location’.
Q1b. When you last made contact with City of Playford staff was it by:
▲▼= significantly higher/lower level of use (by year)
0%
1%
2%
1%
2%
11%
22%
61%
<1%
2%
2%
6%▲
8%
19%
63%
0% 10% 20% 30% 40% 50% 60% 70%
Social media
Council Website
Elected Member
In person at a different Council location
In person at the Customer Service Centre
Telephone
2016: N = 236 2015: N = 198

City of Playford
2016 Resident Satisfaction Survey
August 2016 Page | 61
8%
3%
3%
2%
1%
2%
3%
2%
2%
3%
7%
12%
24%
29%
13%
<1%▼
1%▼
2%
2%
4%
4%
5%▲
5%
6%
11%
12%
14%▼
22%
0% 10% 20% 30%
Other
Recreation and leisure
City appearance
Health and safety
Libraries
Community events and services
Illegally dumped rubbish
Kerbside waste
Hard rubbish
Environmental issues
Planning and development
Rates/fees and charges
Roads/footpaths/drains/trees
Animal management
2016: N = 236 2015: N = 198
Nature of Resident Enquiries Summary
‘Animal management’ and ‘roads/footpaths/drains/trees’ continued to be the most common reasons
for residents contacting Council staff in 2016. ‘Roads/footpaths/drains/trees’, ‘city appearance’ and
‘recreation and leisure’ all decreased significantly from 2015 t0 2016, whilst ‘kerbside waste’ significantly
increased.
Females contacted Council regarding ‘hard rubbish’ significantly more than did males.
18-34 year olds were significantly less likely to have contacted Council regarding ‘community events and
services’. 35-49 year olds contacted Council regarding ‘kerbside waste’ significantly more and 50-64 year
old residents contacted Council regarding ‘health and safety’ significantly more.
Residents aged 65 years and over were significantly more likely to have contacted Council about ‘city
appearance’, ‘roads/footpaths/drains/trees’, ‘community events and services’ and ‘recreation and
leisure’, but significantly less likely for ‘animal management’ and ‘planning and development’.
Ratepayers were significantly more likely to have contacted Council about ’rates/fees and charges’,
whilst non-ratepayers were significantly more likely to have contacted Council regarding ‘animal
management’ and ‘hard rubbish’.
Q1c. How would you describe the nature of your enquiry?
▲▼= significantly higher/lower percentage (by year)
Other specified Count
Aged care/disability
services 3
Complaint 3
General information 3
Illegal/unsafe parking 3
Street/business
signage 3
Neighbours 2
Accident of a
Council vehicle 1
Change of details 1
Customer service
feedback 1
Deed to a house 1
Dog park 1
Home business
inspection 1
Commercial vehicle
licensing 1
Voting information 1

City of Playford
2016 Resident Satisfaction Survey
August 2016 Page | 62
Customer Service Summary
Agreement with statements across different areas of customer service was high, with at least 70% of
residents who had made contact with Council in the past 12 months choosing to either ‘agree’ or
‘completely agree’ with each of the statements.
With the exception of ‘staff follow through on my requests’, non-ratepayers had significantly higher levels
of agreement with these statements.
Residents of Ward 5 had significantly higher levels of agreement with all statements.
Q1d. Taking into account your enquiry, to what extent do you agree or disagree with the following statements?
Scale: 1 = completely disagree, 5 = completely agree
Mean ratings
2016 2015
4.36 4.11
4.14 N/A
4.09 N/A
4.02 3.69
4.00 3.70
Staff are helpful and
pleasant
N=235
It was easy to access the information I
needed
N=233
Staff are
knowledgeable
N=235
Staff follow through
on my requests
N=227
Staff always provide
a prompt service
N=235
Strongly disagree Disagree Agree Strongly agree
3%
6%
7%
7%
5%
11%
11%
6%
8%
4%
25%
11%
18%
23%
21%
50%
59%
56%
56%
64%
-20% 0% 20% 40% 60% 80% 100%

City of Playford
2016 Resident Satisfaction Survey
August 2016 Page | 63
Issues Regarding Customer Service Summary
Resident issues focused around staff being unfamiliar with the issues that they were enquiring about,
causing delays in resolving problems/obtaining information and residents feeling that they were being
passed from person-to-person. Lack of follow-up to enquiries was also a concern highlighted.
Q1d. (For residents that answered ‘completely disagree or disagree’ in Q1d), why did you give this response?
It was easy to access the information I needed
Staff are helpful and pleasant
Comments Count
Comments Count
Staff lacked knowledge 7
Rude staff/poor customer service 10
Staff unhelpful 6 Kept being passed to different people 4
Did not receive required information 4
Staff are not concerned with helping 3
Information took a long time to obtain 4
Unhelpful/incorrect information provided 3
Website difficult to navigate/missing
information 4
Long waiting period 1
Incorrect information provided 2
Not willing to follow-up 1
Could not get details of/access the correct
person 1
Long distance to the library 1
Staff follow through on my requests
Long waiting time 1
Comments Count
Yellow Pages information was incorrect 1
Issue was not resolved 15
No follow-up 9
Staff always provide a prompt service
No response to call/email 8
Comments Count
Staff lack training/knowledge 4
Took a long time to resolve issue/obtain
information 14
Poor customer service 3
Issue was not resolved 6
Took a long time to resolve issue 2
No follow-up on issue 6 Long waiting period for calls/emails to
be returned 1
Could not access the correct person 3
Poor customer service 3
Staff are knowledgeable
Staff lacked knowledge on issue 3
Comments Count
Kept being passed to different people 1
Lacked training and knowledge 19
Long queue at Customer Service Centre 1
Unhelpful/not able to assist 6
Didn't know who to contact/which
department 3
Incomplete information provided 2
Kept being passed to different people 2
Language used was confusing 1

City of Playford
2016 Resident Satisfaction Survey
August 2016 Page | 64
Overall Satisfaction with Customer Service Summary
Overall satisfaction with Council’s level of customer service increased slightly compared to 2015, with 87%
of residents stating that they are at least ‘somewhat satisfied’.
Non-ratepayers and residents of Ward 5 both have significantly higher levels of satisfaction.
Q1e. How would you rate your overall satisfaction with Council’s level of customer service?
Overall
2016
Overall
2015 Male Female 18-34 35-49 50-64 65+ Ratepayer
Non-
ratepayer
Mean
ratings 3.95 3.76 3.70 4.10 4.27 3.67 3.81 3.99 3.83 4.25▲
Ward 1 Ward 2 Ward 3 Ward 4 Ward 5 Ward 6
Mean
ratings 3.82 4.04 3.97 3.71 4.45▲ 3.82
Scale: 1 = not at all satisfied, 5 = very satisfied
▲▼= significantly higher/lower level of satisfaction (by group)
6%
10%
20%
31%
33%
6%
7%
14%
34%
39%
0% 10% 20% 30% 40%
Not at all satisfied
Not very satisfied
Somewhat satisfied
Satisfied
Very satisfied
2016: N = 236 2015: N = 198

City of Playford
2016 Resident Satisfaction Survey
August 2016 Page | 65
Preferred Method of Contacting Council Summary
The ‘telephone’ is the preferred method of contacting Council by residents (83%), followed by in person
‘at the counter’ (55%).
Females preferred to contact Council ‘in writing’ significantly more.
18-34 year olds preferred contacting Council via ‘online – self-service’, ‘online chat with a customer
service representative’ or ‘by Facebook or other social media platform’ significantly more, whilst residents
aged 50 years and over preferred these methods significantly less. Additionally, residents aged 65 years
and over had a significantly higher preference for contacting Council ‘at the counter’, but significantly
lower preference for ‘by email’, and 18-34 year olds additionally preferred contact ‘at the counter’
significantly more.
Q1f. Which of the following ways have been/would be your preferred method of contacting Council?
Base: n=605
1%
12%
24%
27%
29%
34%
39%
55%
83%
0% 20% 40% 60% 80% 100%
Other
By Facebook or other social media platform
Online chat with a customer service representative
Via an Elected Member
In writing
Online - self-service
By email
At the counter
Telephone
Other specified Count
SMS 2
Library 1
Outdoor staff 1

City of Playford
2016 Resident Satisfaction Survey
August 2016 Page | 66
Online Tasks Summary
The most common task residents needed/wanted to do online was to ‘search for something/just browse’
(67%), though all tasks were stated to be something that was needed or wanted by nearly 50% of
residents.
Residents wanted to be able to ‘give feedback/my opinion on Council initiatives and plans’ and ‘make
a complaint’ online significantly more in 2016 compared to 2015.
18-34 year olds wanted to be able to do all online tasks significantly more, whilst those aged 65 and over
were significantly less likely to use these services. With the exception of ‘make a payment’ and ‘report a
problem/issue, 50-64 year olds were also less likely to use these services. Those aged 35-49 were
significantly more likely to want to ‘search for something/just browse’.
Non-ratepayers were significantly more likely to want to ‘search for something/just browse’, ‘give
feedback/my opinion on Council initiatives and plans’ ‘submit an application’ and ‘make a booking’
online than ratepayers.
Q1g. Which tasks do you need or/want to do online?
▲▼= significantly higher/lower percentage (by year
1%
18%
36%
47%
44%
45%
49%
48%
45%
57%
72%
1%
8%
46%▲
46%
47%
48%
48%
54%
59%▲
59%
61%
67%
0% 25% 50% 75%
Other
I dont have access/know how to use the
internet
I dont want to do any tasks online
Make a complaint
Make a booking
Report a problem/issue
Make a general enquiry
Submit an application
Request a service
Give feedback/my opinion on Council
initiatives and plans
Make a payment
Search for something/just browse
2016: N = 605 2015: N = 601
Other specified Count
Animal registration 2
Minutes of Council meetings 2
Council staff directory 1
Download documents 1

City of Playford
Community Research
August 2016 Page | 67
Section B –
Communication with
Council

City of Playford
2016 Resident Satisfaction Survey
August 2016 Page | 68
How Residents Hear About Programs, Events and
Initiatives
Summary
Though ‘brochures/flyers’ significantly decreased in 2016 compared to 2015, it still remained the most
common method for residents to hear about Council’s activities, along with ‘word of mouth’. Use of
‘local press’ significantly increased’ in 2016, but use of the ‘Council website’ significantly decreased in
2016.
Females were significantly more likely to use ‘Council newsletter ‘North is Up’’ and ‘brochures/flyers’.
Residents aged18-34 used ‘Council website’ and ‘social media’ significantly more, but ‘Council
newsletter ‘North Is Up’’, ‘local press’ and ‘letters’ significantly less. 35-49 year olds used ‘word of mouth’
significantly more.
Residents aged over 50 both used ‘Council newsletter ‘North Is Up’’ significantly more, but ‘Council
website’, ‘social media’ and ‘word of mouth’ significantly less. Additionally 50-64 year olds used ‘Council
staff’ and ‘Elected Members’ significantly less, whilst residents aged 65 years and over used ‘local press’
significantly more.
Ratepayers were significantly more likely to receive information from ‘letters’, but significantly less likely
from ‘social media’ and ‘brochures/flyers’.
Q2a. How do you hear about City of Playford’s work, programs, events and initiatives?
▲▼= significantly higher/lower percentage (by year)
4%
46%
31%
64%
64%
44%
62%
78%
6%
18%
18%
30%▼
36%
58%
62%
63%▲
66%
66%▼
0% 20% 40% 60% 80%
Other
Council Staff
Elected Members
Council website
Social media
Council newsletter 'North Is Up'
Letters
Local press
Word of mouth
Brochures/flyers
2016: N = 605 2015: N = 601
Other Specified Count
I do not hear about them 13
Signs in the
streets/community 9
Community meetings 4
Radio 3
Resident newsletter 2
Television 2
Council calendar 1
Grenville Hub 1
Library 1

City of Playford
2016 Resident Satisfaction Survey
August 2016 Page | 69
Overall Satisfaction with Level of Communication
Summary
Satisfaction with the level of communication from Council remained steady since 2015, with 86% of
residents being at least ‘somewhat satisfied’.
Residents of Ward 5 were significantly more satisfied, whilst Ward 1 residents were significantly less
satisfied.
Q2b. How satisfied are you with the level of communication City of Playford currently has with the community?
Overall
2016
Overall
2015 Male Female 18-34 35-49 50-64 65+ Ratepayer
Non-
ratepayer
Mean
ratings 3.52 3.52 3.45 3.58 3.56 3.54 3.36 3.58 3.46 3.63
Ward 1 Ward 2 Ward 3 Ward 4 Ward 5 Ward 6
Mean ratings 3.28▼ 3.70 3.54 3.46 3.83▲ 3.68
Scale: 1 = not at all satisfied, 5 = very satisfied
▲▼= significantly higher/lower level of satisfaction (by group)
4%
6%
31%
49%
9%
5%
9%
26%
49%
11%
0% 10% 20% 30% 40% 50%
Not at all satisfied
Not very satisfied
Somewhat satisfied
Satisfied
Very satisfied
2016: N = 605 2015: N = 601

City of Playford
2016 Resident Satisfaction Survey
August 2016 Page | 70
Information for Residents Summary
Residents were keen to receive information from Council, with 56% of residents stating that they would
like to receive information on all topics. The most popular topic to receive information on though was
‘community services available to you’ (89%).
Females stated that they would like to receive information on ‘community events’, ‘event information’,
‘lifestyle information’, ‘road works updates’, ‘community services available to you’ and ‘how to get
things done with Council’ significantly more.
35-49 year olds wanted to know about ‘new initiatives of Council’ significantly more, and 50-64 year olds
wished to know about ‘how rates are being spent’ significantly more.
Residents aged 65 years and over wanted to receive information significantly less on ‘how rates are
being spent’, ‘community events’, ‘event information’, ‘local sporting updates and initiatives’ and
‘planning and development news’.
Ratepayers stated that they would like to receive information on ‘how rates are being spent’, ‘new
initiatives of Council’ and ‘planning and development news’ significantly more.
Q2c. What type of information would you like to receive from City of Playford?
Base: n=605
3%
56%
58%
67%
75%
82%
84%
84%
85%
86%
86%
89%
0% 20% 40% 60% 80% 100%
Other
Local sporting updates
and initiatives
Local achievers
Lifestyle information
Planning and
development news
New initiatives of
Council
Road works updates
How to get things
done with Council
Event information
Community events
How rates are being
spent
Community services
available to you
Other specified Count
Nothing/no communication 8
Elected Members and
methods of contact 2
Changes to public transport 1
Community gardens 1
Demographics of residents 1
Employment opportunities 1
Environmental issues 1
How the community can
consult on decisions 1
Internet services 1
The hospital and its services 1
When rates are changing 1

Section C –
Services

City of Playford
2016 Resident Satisfaction Survey
August 2016 Page | 72
Overall Satisfaction with Presentation Summary
91% of residents were at least somewhat satisfied with the presentation of the City of Playford, a similar
result to 2015.
Residents aged 65 years and over, and residents of Ward 5 were significantly more satisfied.
Q4. Overall, how would you rate your satisfaction with the presentation of the City of Playford?
Overall
2016
Overall
2015 Male Female 18-34 35-49 50-64 65+ Ratepayer
Non-
ratepayer
Mean ratings 3.64 3.57 3.55 3.73 3.70 3.55 3.54 3.80▲ 3.58 3.76
Ward 1 Ward 2 Ward 3 Ward 4 Ward 5 Ward 6
Mean ratings 3.51 3.75 3.46 3.67 3.95▲ 3.64
Scale: 1 = not at all satisfied, 5 = very satisfied
▲▼= significantly higher/lower level of satisfaction (by group)
2%
8%
32%
47%
11%
3%
6%
30%
46%
15%
0% 10% 20% 30% 40% 50%
Not at all satisfied
Not very satisfied
Somewhat satisfied
Satisfied
Very satisfied
2016: N = 605 2015: N = 601

City of Playford
2016 Resident Satisfaction Survey
August 2016 Page | 73
10%
11%
15%
22%
14%
13%
34%
43%
54%
68%
82%
5%
6%
5%
14%
14%
18%
18%
19%▲
26%
39%
49%
60%
61%
82%
0% 10% 20% 30% 40% 50% 60% 70% 80% 90%
None
Other
Elizabeth Rise Community Centre
Northern Sound System
Grenville Community Hub
Skate parks
Playford Food Co-Operative
John McVeity Centre
Stretton Centre
Elizabeth Aquadome
Playford Civic Centre/Shedley Theatre
Playford Libraries
Sportsgrounds and ovals
Parks, reserves & playgrounds
2016: N = 605 2015: N = 601
Facilities Visited Summary
‘Parks, reserves & playgrounds’ continued to be the most visited Council facilities (82%) in 2016, with visits
to the ‘John McVeity Centre’ significantly increasing.
Females visited ‘Playford libraries’, ‘Elizabeth Rise Community Centre’ and ‘Grenville Community Hub’
significantly more.
Younger residents visited more facilities, with significantly more visits by 18-34 year olds to ‘sportsgrounds
and ovals’, ‘parks, reserves & playgrounds’, ‘skate parks’, ‘Stretton Centre’, ‘Elizabeth Aquadome’,
‘Northern Sound System’ and ‘Playford Food Co-Operative’. 35-49 year olds visited ‘Elizabeth
Aquadome’ significantly more, but the ‘Grenville Community Hub’ significantly less.
Residents over the age of 50 years visited ‘sportsgrounds and ovals’, ‘parks, reserves & playgrounds’,
‘skate parks’, ‘Stretton Centre’ and ‘Elizabeth Aquadome’ significantly less. In addition visitation was
significantly lower amongst 50-64 year olds for ‘Playford libraries’ and the ‘John McVeity Centre’.
Residents aged 65 years and over also visited the ‘Northern Sound System’ and ‘Playford Food Co-
Operative significantly less, but the ‘Grenville Community Hub’ significantly more.
Q5. In the last 12 months, which of the following City of Playford facilities have you visited?
▲▼= significantly higher/lower percentage (by year)
Other specified Count
Men's Shed 2
Northern Carers at
Elizabeth West 1
One Tree Hill Institute 1

Section D –
Strategic Priorities

City of Playford
2016 Resident Satisfaction Survey
August 2016 Page | 75
5%
4%
4%
1%
1%
3%
1%
2%
10%
6%
2%
3%
1%
1%
1%
20%
26%
15%
10%
10%
7%
9%
4%
25%
28%
30%
30%
28%
19%
23%
19%
39%
36%
49%
55%
60%
70%
66%
75%
0% 20% 40% 60% 80% 100%
Reducing council rates for
businesses
Development of Playford Sports
Precinct
Development of Elizabeth CBD
City presentation and
appearance
Delivering value for money via
efficiency & effectiveness…
Sustaining & establishing an
advanced manufacturing…
Collection & reuse of rainwater
Development of the Lyell McEwin
Health Precinct
Not at all supportive Not very supportive Somewhat supportive Supportive Completely supportive
Strategic Priorities Summary
Support for ‘development of the Lyell McEwin Health Precinct’ remained the most supported strategic
priority in 2016, with 94% of residents being ‘supportive’ or ‘completely supportive’.
Support for ‘reducing council rates for businesses’ significantly decreased in 2016 compared to 2015.
Females were significantly more supportive of ‘development of the Lyell McEwin Health Precinct’ and
‘collection & reuse of rainwater’.
18-34 year olds were significantly less supportive of ‘development of the Lyell McEwin Health Precinct’,
‘sustaining & establishing an advanced manufacturing industry’, ‘reducing Council rates for businesses’,
‘collection & reuse of rainwater’ and ‘delivering value for money via efficiency & effectiveness’.
Residents aged 50-64 and 65 and over were significantly more supportive of ‘reducing Council rates for
businesses’, ‘collection & reuse of rainwater’, ‘delivering value for money via efficiency and effectiveness
programs’. Residents aged over 65 were additionally more satisfied with ‘development of the Lyell
McEwin Health Precinct’, ‘sustaining & establishing an advanced manufacturing industry’, ‘development
of Elizabeth CBD’, and ‘development of Playford Sports Precinct’.
Ratepayers were significantly more supportive of ‘development of Playford Sports Precinct’.
Q6. City of Playford has identified 8 strategic priorities, as outlined in City of Playford’s 5 Year Strategic Plan.
Council would like to know your level of support for these priorities to make sure they align with community
need. Please indicate how supportive you are of each priority.
Note: The wording of these statements has changed since 2015, although the intent of the measures remains the same. Please see
Appendix B for the complete list of statements for both years.
Scale: 1 = not at all supportive, 5 = completely supportive
▲▼= significantly higher/lower level of support (by year)
Mean ratings
2016 2015
4.66 4.68
4.52 4.61
4.52 4.61
4.43 4.47
4.36 4.27
4.20 4.15
3.87 3.94
3.83▼ 4.31

Section E –
Living in Playford

City of Playford
2016 Resident Satisfaction Survey
August 2016 Page | 77
Image and Reputation Summary
72% of residents ‘agree’ or ‘completely agree’ that ‘I am proud to live in the City of Playford’. However,
one quarter of residents (26%) ‘disagree’ or ‘completely disagree’ that the ‘City of Playford has a positive
reputation’.
Females and non-ratepayers had significantly higher levels of agreement with the ‘City of Playford
displays a positive image of the City’ and the ‘City of Playford is innovative’.
Residents over the age of 65 had significantly higher levels of agreement with all statements, whilst 35-49
year olds had significantly lower levels of agreement with the ‘City of Playford has a positive reputation’
and 50-64 year olds had significantly lower levels of agreement with the ‘City of Playford is innovative’.
Ward 5 residents had significantly higher levels of agreement with the ‘City of Playford has a positive
reputation’ and the ‘City of Playford is innovative’.
Q7a. When thinking about City of Playford’s image and reputation, to what extent do you agree or disagree with
the following?
Base: n=605
Scale: 1 = completely disagree, 5 = completely agree
Mean
rating
4.05
3.86
3.67
3.27
I am proud to live in
the City of Playford
City of Playford
displays a positive
image of the City
City of Playford is
innovative
City of Playford has a
positive reputation
Strongly disagree Disagree Agree Strongly agree
16%
8%
7%
7%
10%
3%
2%
4%
27%
38%
38%
25%
17%
22%
29%
47%
-30% -10% 10% 30% 50% 70% 90%

City of Playford
2016 Resident Satisfaction Survey
August 2016 Page | 78
Continued Residence in the City of Playford
Summary
86% of residents plan to continue living in the City of Playford for the next 5 years.
Residents aged 35-49 and 65 years and over were significantly more likely to state that they plan to
continue living in Playford, whilst 18-34 year olds were significantly less likely.
Residents of Ward 6 were significantly more likely to plan on remaining residents of the City of Playford,
whilst Ward 1 residents were significantly less likely.
Q7b. Do you intend to continue to live in the City of Playford for the next 5 years?
Overall
2016
Overall
2015 Male Female 18-34 35-49 50-64 65+ Ratepayer
Non-
ratepayer
Yes 86% 84% 88% 84% 77%▼ 92%▲ 85% 94%▲ 88% 82%
No 7% 11% 7% 7% 14% 1% 6% 3% 6% 9%
Don’t know 7% 5% 6% 9% 9% 7% 9% 3%▼ 7% 9%
Ward 1 Ward 2 Ward 3 Ward 4 Ward 5 Ward 6
Yes 84% 85% 81% 90% 83% 96%▲
No 12%▲ 7% 9% 3% 0% 2%
Don’t know 4%▼ 8% 11% 7% 17%▲ 2%
▲▼= significantly higher/lower percentage (by group)
Base: n=605
Yes
86%
No
7%
Don't know
7%
Specify reason for ‘no’ Count
Relocating for work 7
Closer to City 4
Poor service from Council 4
Downsizing home 2
Moving overseas 2
Retirement 2
Area not visually appealing 1
Change of lifestyle 1
family and friends 1
Health reasons 1
Unsafe area 1

City of Playford
2016 Resident Satisfaction Survey
August 2016 Page | 79
Overall Satisfaction with the Performance of Council Summary
93% of residents are at least ‘somewhat satisfied’ with the performance of City of Playford Council.
Satisfaction significantly increased in 2016 compared to 2015, continuing the upward trend that has been
occurring since 2014. A mean rating for overall satisfaction of 3.76 is significantly higher than the mean
satisfaction scores for both ‘metro councils’ and ‘all councils’.
Females were significantly more satisfied than males, along with those aged 65 years and over and
residents of ward 5.
Q8. Overall for the last 12 months, how satisfied are you with the performance of City of Playford, not just on one
or two issues but across all responsibility areas?
Overall
2016
Overall
2015 Male Female 18-34 35-49 50-64 65+ Ratepayer
Non-
ratepayer
Mean rating 3.76▲ 3.57 3.66 3.87▲ 3.86 3.68 3.63 3.90▲ 3.70 3.90
Ward 1 Ward 2 Ward 3 Ward 4 Ward 5 Ward 6
Mean rating 3.64 3.83 3.63 3.67 4.14▲ 3.92
LGA Brand
Scores Metro
All
Councils
City of
Playford
2016
Mean ratings 3.45▼ 3.31▼ 3.76▲
2016 2015 2014 2013 2012 2011 2010 2009 2007 2005 2004 2003 2002 2001
Satisfaction mean
ratings 3.76 3.57 3.35 3.50 3.50 3.60 3.65 3.80 3.80 3.75 3.70 3.85 3.70 3.55
Scale: 1 = not at all satisfied, 5 = very satisfied
▲▼= significantly higher/lower level of satisfaction (by group)
1%
6%
36%
50%
7%
3%
4%
26%
47%
20%
0% 10% 20% 30% 40% 50%
Not at all satisfied
Not very satisfied
Somewhat satisfied
Satisfied
Very satisfied
2016: N = 605 2015: N = 601

Section F – Demographics

City of Playford
2016 Resident Satisfaction Survey
August 2016 Page | 81
Demographics Q9. Please stop me when I read out your age group.
%
18-34 34%
35-49 28%
50-64 22%
65+ 16%
Base: n=605
Q10. Which country were you born in?
%
Australia 76%
Other 24%
Base: n=605
Q11. Which of the following best describes the house where you are currently living?
%
I/We own/are currently buying this property 68%
I/We currently rent this property 32%
Base: n=604
Q12. Which of the following best describes your status?
%
Living at home with parents 10%
Single with no children 15%
Single parent with children 9%
Married/de facto with no children 23%
Married/de facto with children 38%
Group household 2%
Extended family household (multiple generations) 4%
Base: n=604
Q13. How long have you lived in the local area?
%
Less than 2 years 5%
2 – 5 years 14%
6 – 10 years 18%
11 – 20 years 22%
More than 20 years 41%
Base: n=605
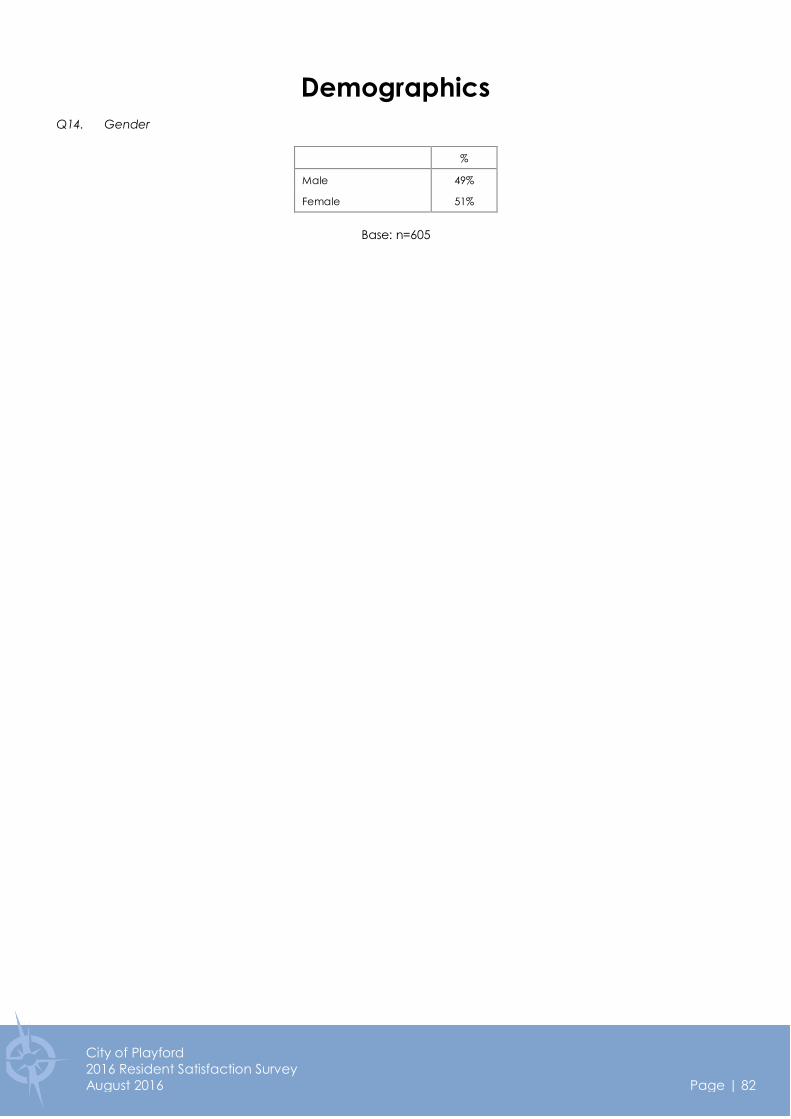
City of Playford
2016 Resident Satisfaction Survey
August 2016 Page | 82
Demographics
Q14. Gender
%
Male 49%
Female 51%
Base: n=605

Appendix A – Questionnaire

City of Playford
2016 Resident Satisfaction Survey
August 2016 Page | 84
City of Playford
Community Survey
July 2016
Good morning/afternoon/evening, my name is ____________________ and I’m calling on behalf of City of
Playford Council from a company called Micromex Research. We are conducting research with residents
regarding services, facilities and priorities in the area to help Council better understand the diverse needs
of its residents.
QA1. Before we start I would like to check whether you or an immediate family member work for City of
Playford?
O Yes
O No (If yes, terminate survey)
QA2. In which suburb do you live?
Ward 1
O Andrews Farm
O Angle Vale
O Buckland Park
O Edinburgh North (west of Stebonheath Rd)
O Hillier
O Macdonald Park
O Munno Para (west of Coventry Rd)
O Munno Para Downs (west of Coventry Rd)
O Penfield
O Penfield Gardens
O Smithfield Plains
O Virginia
O Waterloo Corner
Ward 2
O Blakeview
O Craigmore (west of Adams Rd)
O Elizabeth Downs (north of Midway Rd)
O Munno Para (east of Coventry Rd)
O Munno Para Downs (east of Coventry Rd)
O Smithfield
Ward 3
O Bibaringa
O Craigmore (east of Adams Rd and north
of Yorktown Rd)
O Evanston Park
O Gould Creek
O Humbug Scrub
O One Tree Hill
O Sampson Flat
O Uleybury
O Yattalunga
Ward 4
O Davoren Park (all suburbs)
O Edinburgh North (east of Stebonheath
Rd)
O Elizabeth Downs (south of Midway Rd)
O Elizabeth East (north and northwest of
Midway Rd)
O Elizabeth North
O Elizabeth Park
Ward 5
O Elizabeth
O Elizabeth Grove
O Elizabeth South
O Elizabeth Vale
Ward 6
O Craigmore (south of Yorktown Rd)
O Elizabeth East (south and southeast of
Midway Rd)
O Hillbank

City of Playford
2016 Resident Satisfaction Survey
August 2016 Page | 85
Section A – City of Playford Customer Service
I’d like you now to please think about your experiences with City of Playford.
Q1a. Have you contacted Council in the last 12 months?
O Yes
O No (If no, go to Q1f)
Q1b. When you last made contact with City of Playford staff was it by: Prompt
O By phone
O Mail
O Email
O Council Website
O Social media
O Elected Member
O In person at the Customer Service Centre
O In person at a different Council location
Q1c. How would you describe the nature of your enquiry? Do not prompt
O City appearance (e.g. litter/graffiti)
O Roads/footpaths/drains/trees
O Animal management (e.g. dog registrations)
O Planning and development
O Rates/fees and charges (including parking)
O Kerbside waste (e.g. general, recycling, green organics)
O Hard rubbish (e.g. fridges, dryers, mattresses, bikes)
O Illegally dumped rubbish
O Community events and services
O Environmental issues
O Health and safety
O Libraries
O Recreation and leisure (e.g. pools, parks, sportsgrounds)
O Other (please specify)………….………………………...…..
Q1d. Taking into account your enquiry, to what extent do you agree or disagree with the following
statements? Please answer on a scale of 1 to 5, where 1 means completely disagree and 5 means completely agree. Prompt
*If response below 3, please ask why.
Completely disagree Completely agree
1 2 3 4 5
It was easy to access the information I needed O O O O O
Staff are helpful and pleasant O O O O O
Staff always provide a prompt service O O O O O
Staff follow through on my requests O O O O O
Staff are knowledgeable O O O O O
Q1e. How would you rate your overall satisfaction with Council’s level of customer service?
O Very satisfied
O Satisfied
O Somewhat satisfied
O Not very satisfied
O Not at all satisfied

City of Playford
2016 Resident Satisfaction Survey
August 2016 Page | 86
Q1f. Which of the following ways have been/would be your preferred method of contacting Council? Prompt
O By phone
O By email
O At the counter
O Online - self-service (i.e. paying rates, submitting applications)
O Online – online chat with a customer service representative
O By Facebook (or any other social media platform)
O In writing
O Via an Elected Member
O Other (please specify)…………………………………..
Q1g. Which tasks do you need or/want to do online? Please answer yes or no as I read each one. Prompt
O Make a payment (e.g. rates, fine, permit, application fees)
O Make a booking (e.g. community facility, sports grounds, workshop)
O Request a service (e.g. new bin, library item, change details)
O Report a problem/issue (e.g. animal problem, graffiti, hazard)
O Submit an application (e.g. job, permit, licence, grant, development)
O Make a general enquiry
O Make a complaint
O Give feedback/my opinion on Council initiatives and plans
O Search for something/just browse
O I don’t want to do any tasks online
O I don’t have access/know how to use the internet
O Other (please specify)………………………………
Section B – City of Playford Communication
Q2a. How do you hear about City of Playford’s work, programs, events and initiatives? Prompt
O Council newsletter ‘North Is Up’
O Council website
O Social media (Facebook, YouTube, Twitter)
O Local Press (Messenger & Bunyip)
O Letters (including rates notice)
O Council staff
O Elected Members
O Brochures/Flyers
O Word of mouth
O Other (please specify)…………………………………..
Q2b. How satisfied are you with the level of communication City of Playford currently has with the
community? Prompt
O Very satisfied
O Satisfied
O Somewhat satisfied
O Not very satisfied
O Not at all satisfied

City of Playford
2016 Resident Satisfaction Survey
August 2016 Page | 87
Q2c. What type of information would you like to receive from City of Playford? Prompt
O How rates are being spent
O Community events
O New initiatives of Council
O Local achievers
O Event information
O Local sporting updates and initiatives
O Lifestyle information
O Road works updates
O Community services available to you
O Planning and development news
O How to get things done with Council – i.e. hard waste collection, noisy dogs etc.
O Other (please specify)…………………………………..
Section C - Importance & Satisfaction with City of Playford Services
Still thinking specifically about City of Playford
Q3. In this section I will read out different City of Playford services or facilities. For each of these could
you please indicate your opinion of the importance of the following service/facility to you, and in
the second part, your level of satisfaction with the performance of that service? The scale is from 1
to 5, where 1 is low importance and low satisfaction, and 5 is high importance and high
satisfaction.
Q3a. City Maintenance & Presentation
Importance Satisfaction
Low High Low High
1 2 3 4 5 1 2 3 4 5 N/A
Condition of footpaths O O O O O O O O O O O
Condition of bicycle paths O O O O O O O O O O O
Presentation of street verges* (e.g.
mowed regularly, free from weeds,
tidy appearance) O O O O O O O O O O O
Condition of street kerbs O O O O O O O O O O O
Presentation of street trees
(e.g. Pruning and care) O O O O O O O O O O O
Condition of local streets (e.g. road
surface, signage, and line marking) O O O O O O O O O O O
Adequate stormwater drainage (e.g.
To reduce flooding in streets) O O O O O O O O O O O
Condition of rural roads (e.g. road
surface, signage, line marking, grading) O O O O O O O O O O O
Removal of illegally dumped rubbish O O O O O O O O O O O
Removal of graffiti O O O O O O O O O O O
Presentation of parks and reserves O O O O O O O O O O O
Safety of playgrounds O O O O O O O O O O O
Presentation of ovals and sports grounds O O O O O O O O O O O
Rapid response service (e.g. responding
to high risk situations - fallen
trees, immediate footpath repair) O O O O O O O O O O O
*Verge: the portion of land between the street and a property. Not including the footpath.

City of Playford
2016 Resident Satisfaction Survey
August 2016 Page | 88
Q3b. Health, Environment & Regulatory Services
Importance Satisfaction
Low High Low High
1 2 3 4 5 1 2 3 4 5 N/A
Public health & safety (inspections
of local businesses for food safety) O O O O O O O O O O O
Immunisation service O O O O O O O O O O O
Enforcement of local laws (animal
management, parking compliance,
other by laws) O O O O O O O O O O O
Kerbside waste collection (e.g. your
wheelie bin collection) O O O O O O O O O O O
Hard waste collection O O O O O O O O O O O
Protecting & improving native
vegetation and biodiversity O O O O O O O O O O O
Q3c. Community Services
Importance Satisfaction
Low High Low High
1 2 3 4 5 1 2 3 4 5 N/A
Support for volunteer programs O O O O O O O O O O O
Supporting business and industry
development O O O O O O O O O O O
Planning and building advice &
assessment O O O O O O O O O O O
Access to community venues (Civic
Centre, Shedley Theatre, Northern
Sound System) O O O O O O O O O O O
Council events (e.g. Anzac Day,
Australia Day celebrations) O O O O O O O O O O O
Library service O O O O O O O O O O O
Providing support & facilities for
sporting clubs O O O O O O O O O O O
Availability of community services
(e.g. through aged, youth, family,
disability, mental health programs) O O O O O O O O O O O
Supporting local community
development (e.g. through grants and
programs like Youth Advisory Committee) O O O O O O O O O O O
Health initiatives (e.g. Playford Food Co
Operatives & OPAL - Obesity Prevention
and Active Lifestyle) O O O O O O O O O O O

City of Playford
2016 Resident Satisfaction Survey
August 2016 Page | 89
Q3d. Accountability, Advocacy & Management
Importance Satisfaction
Low High Low High
1 2 3 4 5 1 2 3 4 5 N/A
Planning for the future O O O O O O O O O O O
Managing growth and major urban
developments (i.e. new areas and
redevelopment of older areas) O O O O O O O O O O O
Being open & accountable to the
community O O O O O O O O O O O
Community input to Council
decision-making O O O O O O O O O O O
Council provide value for money for
the rates paid O O O O O O O O O O O
Communication on Council’s visions
& goals O O O O O O O O O O O
Representation by Elected Members O O O O O O O O O O O
Q4. Overall, how would you rate your satisfaction with the presentation of the City of Playford? Prompt
O Very satisfied
O Satisfied
O Somewhat satisfied
O Not very satisfied
O Not at all satisfied
City of Playford Facilities
Q5. In the last 12 months, which of the following City of Playford facilities have you visited? Please answer yes or no as I read each one. Prompt
O Sportsgrounds and ovals
O Parks, reserves & playgrounds
O Skate parks
O Playford Libraries (Civic Centre/Stretton Centre)
O Playford Civic Centre/Shedley Theatre
O Stretton Centre
O Elizabeth Aquadome
O Elizabeth Rise Community Centre
O Grenville Community Hub
O John McVeity Centre
O Northern Sound System
O Playford Food Co-Operative (Elizabeth Downs/Smithfield)
O Other (Please specify)............................

City of Playford
2016 Resident Satisfaction Survey
August 2016 Page | 90
Section D - City of Playford Strategic Priorities
Q6a. City of Playford has identified 8 strategic priorities, as outlined in City of Playford’s 5 Year Strategic
Plan. Council would like to know your level of support on these priorities to make sure they align
with community need. Please indicate how supportive you are on each priority on a scale of 1 to 5, where 1 is not at all supportive and 5 is completely supportive. Prompt
Not at all Completely
supportive supportive
1 2 3 4 5 N/A
Development of the Lyell McEwin Health Precinct O O O O O O
Development of Elizabeth CBD O O O O O O
Development of Playford Sports Precinct O O O O O O
City presentation and appearance O O O O O O
Sustaining & establishing an advanced manufacturing industry O O O O O O
Reducing council rates for businesses O O O O O O
Collection & reuse of rainwater O O O O O O
Delivering value for money via efficiency & effectiveness programs O O O O O O
Section E - Living in Playford
Q7a. When thinking about City of Playford’s image and reputation, to what extent do you agree or
disagree with the following? Please answer on a scale of 1 to 5, where 1 means completely disagree and 5 means completely agree. Prompt
Completely disagree Completely agree
1 2 3 4 5
City of Playford displays a positive image of the City O O O O O
City of Playford has a positive reputation O O O O O
City of Playford is innovative O O O O O
I am proud to live in the City of Playford O O O O O
Q7b. Do you intend to continue to live in the City of Playford for the next 5 years?
O Yes
O No (If no, please specify why)
O Don’t know/Unsure
Overall Satisfaction with City of Playford
Q8. Overall for the last 12 months, how satisfied are you with the performance of City of Playford, not just on one or two issues but across all responsibility areas? Prompt
O Very satisfied
O Satisfied
O Somewhat satisfied
O Not very satisfied
O Not at all satisfied

City of Playford
2016 Resident Satisfaction Survey
August 2016 Page | 91
Section F – Demographic & Profiling questions
Q9. Please stop me when I read out your age group.
O 18 – 34
O 35 – 49
O 50 – 64
O 65 years and over
Q10. Which country were you born in?
O Australia
O Other (please specify)..................................
Q11. Which of the following best describes the house where you are currently living?
O I/We own/are currently buying this property
O I/We currently rent this property
Q12. Which of the following best describes your status? Prompt
O Living at home with parents
O Single with no children
O Single parent with children
O Married/de facto with no children
O Married/de facto with children
O Group household
O Extended family household (multiple generations)
Q13. How long have you lived in the local area? Prompt
O Less than 2 years
O 2 – 5 years
O 6 – 10 years
O 11 – 20 years
O More than 20 years
Q14. Gender (determine by voice):
O Male
O Female
R1. Would you be interested in participating in future research?
O Yes
O No (If no, go to end)
R2. (If yes), what are your contact details?
Name ……………………………………………….
Telephone …………………………………………
Email …………………………………………….….
Thank you very much for your time, enjoy the rest of your evening.

Appendix B – City of Playford Strategic Priorities

City of Playford
2016 Resident Satisfaction Survey
August 2016 Page | 93
City of Playford Strategic Priorities wording in 2016 and 2015 surveys:
2016 2015
Development of the Lyell McEwin Health Precinct
Development of the Lyell McEwin Health Precinct to
feature tertiary training, research, allied health
facilities, and residential accommodation
Development of Elizabeth CBD
Development of Elizabeth’s Regional Centre to
become the CBD of the north of Adelaide
Development of Playford Sports Precinct Development of a fifty-hectare Playford Sports Precinct adjacent to Elizabeth Regional Centre
City presentation and appearance The enhancement of City presentation and
appearance
Sustaining & establishing an advanced
manufacturing industry
To expand and establish a sustainable advanced
manufacturing industry and employment base
Reducing council rates for businesses Reducing Council rates for businesses to ensure that
investment in Playford is competitive
Collection & reuse of rainwater The collection and reuse of rainwater to ensure
Playford is environmentally sustainable
Delivering value for money via efficiency &
effectiveness programs
Improving value for money of Council’s services
through efficiency and effectiveness programs

Appendix C – City of Playford Wards

City of Playford
2016 Resident Satisfaction Survey
August 2016 Page | 95
Ward 1
Andrews Farm Munno Para Downs (west of Coventry Road)
Angle Vale Penfield
Buckland Park Penfield Gardens
Edinburgh North (west of Stebonheath Road) Smithfield Plains
Hillier Virginia
MacDonald Park Waterloo Corner
Munno Para (west of Coventry Road)
Ward 2
Blakeview Munno Para (east of Coventry Road)
Craigmore (west of Adams Road) Munno Para Downs (east of Coventry Road)
Elizabeth Downs (north of Midway Road) Smithfield
Ward 3
Bibaringa Humbug Scrub
Craigmore (east of Adams Road and north One Tree Hill
of Yorktown Road Sampson Flat
Evanston Park Uleybury
Gould Creek Yattalunga
Ward 4
Davoren Park (all suburbs) Elizabeth North
Edinburgh North (east of Stebonheath Road) Elizabeth Park
Elizabeth Downs (south of Midway Road)
Elizabeth East (north and northwest of
Midway Road)
Ward 5
Elizabeth Elizabeth South
Elizabeth Grove Elizabeth Vale
Ward 6
Craigmore (south of Yorktown Road) Hillbank
Elizabeth East (south and southeast of
Midway Road

City of Playford
2016 Resident Satisfaction Survey
August 2016 Page | 96
Map of City of Playford Wards