city of miami, floridaarchive.miamigov.com/finance/docs/fy 19 bond holder report final... ·...
TRANSCRIPT
FISCAL YEAR ENDEDSeptember 30, 2019
CITY OF MIAMI,FLORIDA SUPPLEMENTAL REPORTTO BONDHOLDERS


Prepared By:The Finance Department
Munirah Daniel, CPAAssistant Director
Erica T. Paschal, CPADirector
Armando J. BlancoTreasurer/Assistant Director
Noel G. Ramos Controller/Assistant Director
FISCAL YEAR ENDED SEPTEMBER 30, 2019
SUPPLEMENTAL REPORTTO BONDHOLDERS

Page left intentionally blank

Page left intentionally blank
CITY OF MIAMI, FLORIDA
FRANCIS X. SUAREZMayor
KEN RUSSELLVice-Chairman
JOE CAROLLOCommissioner
ARTHUR NORIEGA, VCity Manager
ALEX DÍAZ DE LA
PORTILLACommissioner
MANOLOREYES
Commissioner
VICTORIAMÉNDEZ
City Attorney
KEON HARDEMON
Chairman
September 30, 2019

Page left intentionally blank
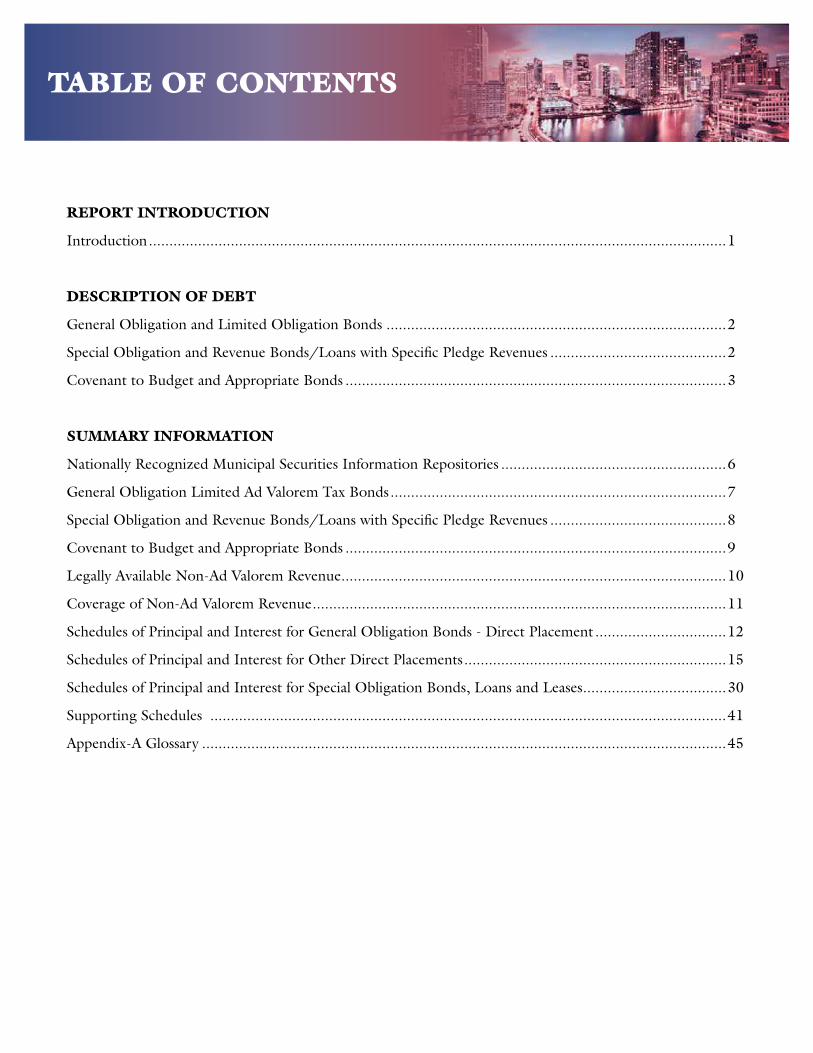
REPORT INTRODUCTION
Introduction .............................................................................................................................................1
DESCRIPTION OF DEBT
General Obligation and Limited Obligation Bonds ...................................................................................2
Special Obligation and Revenue Bonds/Loans with Specific Pledge Revenues ...........................................2
Covenant to Budget and Appropriate Bonds .............................................................................................3
SUMMARY INFORMATION
Nationally Recognized Municipal Securities Information Repositories .......................................................6
General Obligation Limited Ad Valorem Tax Bonds ..................................................................................7
Special Obligation and Revenue Bonds/Loans with Specific Pledge Revenues ...........................................8
Covenant to Budget and Appropriate Bonds .............................................................................................9
Legally Available Non-Ad Valorem Revenue..............................................................................................10
Coverage of Non-Ad Valorem Revenue .....................................................................................................11
Schedules of Principal and Interest for General Obligation Bonds - Direct Placement ................................12
Schedules of Principal and Interest for Other Direct Placements ................................................................15
Schedules of Principal and Interest for Special Obligation Bonds, Loans and Leases ...................................30
Supporting Schedules ..............................................................................................................................41
Appendix-A Glossary ................................................................................................................................45
TABLE OF CONTENTS

INTRODUCTION
Presented herewith is the City of Miami, Supplemental Report to Bondholders (Report). The purpose of this report is to provide useful information concerning the city, its financial operations and its indebtedness to current and potential investors, rating agencies, bond insurers, municipal analysts and other interested parties. It is also the mechanism used to fulfill the obligation the City has undertaken to annually make available to the secondary market updated information consistent with that provided in official statements.
The Report includes details about each outstanding bond issue for which the City has a legal obligation to report. All of the information presented is as of the close of our most recent fiscal year, September 30, 2019, unless the information is specifically noted as of a different date.
The City has contracted with Digital Assurance Certification, LLC (DAC Bond) to provide compliance reporting for the municipal securities industry. The Report and Comprehensive Annual Financial Report (CAFR) is submitted annually through DAC Bond to the Electronic Municipal Market Access (EMMA) System as required by the Municipal Securities Rulemaking Board (MSRB) and approved by the Securities and Exchange Commission (SEC). This provides a central location where investors can obtain free municipal bond information.
In addition to this Report, each fiscal year the City of Miami, Florida prepares a Comprehensive Annual Financial Report (the “CAFR”), which includes audited financial statements in accordance with generally accepted accounting principals (GAAP). The CAFR provides detailed financial information as well as summary and detailed information about the City, which is not included in this Report. Both the Report and the CAFR are available, upon request, in bound copies. Both documents are also viewable in the Finance Department’s section of the City’ s web site at http://www.miamigov.com/finance
The City encourage readers of the Report to provide suggestions that will improve the readability or usefulness of the report. Questions concerning the information contains herein or suggestions should be directed to:
CITY OF MIAMI’SFINANCE DEPARTMENT
444 S.W. 2nd Avenue, Suite 618
Miami, Florida 33130
Phone: 305.416.1330
Fax: 305.416.1390
E-Mail: [email protected]
1

DESCRIPTION OF DEBT
GENERAL OBLIGATION BONDS
A summary of major provisions and significant debt services requirements follows:
Debt service for general obligation bonds is provided for by a tax levy on non-exempt property value. The total general obligation debt outstanding is limited by the City Charter to 15% of the assessed non-exempt property value. At September 30, 2019, the statutory limitation for the City amounted to $8,539,422,902 providing a debt margin of approximately $8,413,757,492 after consideration of the $135,315,000 of general obligation bonds outstanding at September 30, 2019 and adjusted for the fund balance of $9,649,590 in the related Debt Service Fund.
SPECIAL OBLIGATION AND REVENUE BONDS /LOANS WITH SPECIFIC PLEDGE REVENUES
The City has a redevelopment loan in the amount of $ 1,708,865 for the Gran Central Corporation Loan Project. The pledge for this loan is Tax Incremental revenue from the Southeast Overtown/Park West district.
The City deposits with its Paying Agent funds received from CDT Tax, Parking Surcharge, and Parking Revenue directly into a Bond Service account 5 business days before the interest and principal payments are due for the Tax-Exempt Special Obligation Parking Revenue Bonds, Series 2010-A and Taxable Special Obligation Parking Revenue Bonds, Series 2010-B. If the pledged revenues are insufficient to cover the debt payments, there is a back-up covenant to budget and appropriate.
Currently the outstanding principal amount is $84,540,000 for the Tax-Exempt Special Obligation Parking Revenue Bonds, Series 2010-A and $475,000 the Taxable Special Obligation Parking Revenue Bonds, Series 2010-B, $16,240,000 for the Special Obligation Parking Revenue Taxable Refunding Note Series 2018.
2

DESCRIPTION OF DEBT
COVENANT TO BUDGET AND APPROPRIATE BONDS/LOANS
The Special Obligation Non-Ad Valorem Revenue Bonds, Series 1995 (Pension); Non-Ad Valorem Fixed Taxable Rate Refunding Revenue Bonds, Series 2009 (Pension); Special Obligation Non-Ad Valorem Revenue Refunding Bonds, Series 2011-A; Special Obligation Non-Ad Valorem Refunding Bonds, Series 2012 (Port of Miami Tunnel Project); Special Obligation Refunding Bonds, Series 2014; Special Obligation Non-Ad Valorem Bond, Series 2017(Park Remediation); Special Obligation Non-Ad Valorem Refunding Notes Series 2017; Special Obligation Non-Ad Valorem Revenue Refunding Notes Taxable Pension Series 2017; Vehicle Replacement Program 2016, Vehicle Replacement Program 2017; Vehicle Replacement Program 2018; and P25 Citywide Radio Equipment Lease; Dell Financial Services Equipment Lease; and State Revolving Loan Wagner Creek shall be payable from the Covenant Revenues and other legally available revenues of the City actually budgeted and appropriated and deposited into the funds and accounts created and established pursuant to and in the manner provided in the Covenant Ordinance and/or Resolution. Deposited into the funds and accounts created under the Covenant Ordinance and/or Resolution, Covenant Revenues are not pledged for the payment of the Covenant Debt, and Bondholders will not have a lien thereon. The City has covenanted to the extent permitted by and in accordance with applicable law and budgetary processes, to prepare, approve and appropriate in its annual budget for each fiscal year, by amendment if necessary, and deposit to the credit of the Revenue Account established pursuant to the Covenant Ordinance and/or Resolution, Covenant Revenues in an amount which together with other legally available revenues budgeted and appropriated for such purpose equal to the Debt Service Requirement with respect to the Covenant Debt, plus an amount sufficient to satisfy all other payment obligations of the City under the Covenant Ordinance and/or Resolution for the applicable fiscal year, including, without limitations, the obligations of the City to fund and cure deficiencies in any sub-accounts in the Reserve Account created under the Covenant Ordinance and/or Resolution. Such covenant and agreement on the part of the City to budget and appropriate sufficient amounts of Covenant Revenues shall be cumulative, and shall continue until such Covenant Revenues in amounts, together with any other legally available revenues budgeted and appropriated for such purposes, sufficient to make all required payments under the Covenant Ordinance and/or Resolution as and when due, including any delinquent payments, shall have been budgeted, appropriated and actually paid into the appropriate funds and accounts under the Covenant Ordinance and/or Resolution.
Such covenant shall not constitute a lien, either legal or equitable, on any of the City’s Covenant Revenues or other revenues, nor shall it preclude the city from pledging in the future any of its Covenant Revenues or other revenues to other obligations, nor shall it give the Bondholders a prior claim on the Covenant Revenues. Anything herein to the contrary notwithstanding, all obligations of the City under the Covenant Ordinance and/or Resolution shall be secured only by the Covenant Revenues and other legally available revenues actually budgeted and appropriated and deposited into the funds and accounts created under the Covenant Ordinance and/or Resolution, as provided for therein. The
3

DESCRIPTION OF DEBT
City may not expend moneys not appropriated or moneys in excess of its current budgeted revenues. The obligation of the City to budget, appropriate and make payments under the Covenant Ordinance and/or Resolution from its Covenant Revenues is subject to the availability of the Covenant Revenues in the General Fund of the City after satisfying funding requirements for obligations having an express lien on or pledge of such revenues and after satisfying funding requirements for essential governmental services of the City.
The City has not covenanted to maintain any programs or other activities, which generate Covenant Revenues.
All obligations of the City under the Covenant Ordinance and/or Resolution with respect to the Covenant Debt and any Additional Bonds issued hereunder shall be secured only by the Covenant Revenues and other legally available revenues actually budgeted and appropriated and deposited into the funds and accounts created under the Covenant Ordinance and/or Resolution. Nothing in the Covenant Ordinance and/or Resolution shall be deemed to create a pledge of or lien on the Covenant Revenues, the ad valorem tax revenues, or any other revenues of the City, or to permit or constitute a mortgage or lien upon any assets owned by the City. No Bondholder shall ever have the right to compel any exercise of the ad valorem taxing power of the City for any purpose, including without limitation, to pay the principal of or interest or premium, if any, on the Bonds or to make any other payment required under the Covenant Ordinance and/or Resolution or to maintain or continue any of the activities of the City which generate user charges, regulatory fees or any other Covenant Revenues, nor shall the Bonds constitute a charge, lien or encumbrance, either legal or equitable, on any property, assets or funds of the City.
Since holders of the Covenant Debt are not entitled to a lien on the Covenant Revenues until such revenues are deposited into the funds and accounts created under the Covenant Ordinance and/or Resolution in favor of the holders of the Covenant Debt, the City is free to grant liens on the Covenant Revenues to secure other obligations. The exercise of remedies by the holders of other debt payable from the Covenant Revenues (whether or not so secured by a lien), including Non-Self Sufficient Debt which is not issued as Bonds under the Covenant Ordinance and/or Resolution or the holders of the other obligations of the City, including judgment creditors, may result in the payment of debt service on some obligations so secured prior to the payment of debt service on other Non-Self Sufficient Debt, including the Covenant Debt.
The City has covenanted and agreed in the Covenant Ordinance and/or Resolution that for so long as any Bonds are outstanding under the Covenant Ordinance and/or Resolution, the City shall continue to deposit to the credit of the City’s General Fund those revenue sources that are deposited to the credit of the General Fund and Communication Services Tax Fund as provided in the City’s Annual Budget.
4

DESCRIPTION OF DEBT
LIMITATIONS OF COVENANT TO BUDGET AND APPROPRIATE FROM NON-AD VALOREM REVENUES
The City’s covenant to budget and appropriate funds from legally available non-ad valorem revenues in any given year is limited to 10% of the Maximum Annual Debt service on the Series 2009, 2015 and 2017 Bonds. Such amounts therefore would not be sufficient to ensure payment of all debt service on the Series 2009, 2015 and 2017 Bonds if the amount of debt service due and not covered by the revenues available from the Limited Ad Valorem Tax exceeded such 10% amount.
As described above, The City’s covenant to budget and appropriate such funds does not constitute a lien, either legal or equitable, on any of the City’s revenues. The amount of such revenues available to make payments on the Series 2009, 2015 and 2017 Bonds may be effectively limited by the requirement for a balanced budget, funding requirements for essential governmental services of the City, and the inability of the City to expend revenues not appropriated or in excess of funds actually available after the use of such funds to satisfy obligations having an express lien or pledge on such funds. All of these factors may limit the availability of non-ad valorem revenues available to pay a portion of the debt service on the Series 2009, 2015 and 2017 Bonds. In addition, there can be no certainty as to the outcome of any judicial proceedings to enforce the City’s obligation to appropriate such funds. Furthermore, the City is not restricted in its ability (1) to pledge such revenues for other purposes or to issue additional debt specifically secured by such revenues or by a covenant similar to that securing the Series 2009, 2015 and 2017 Bonds or (2) to reduce or discontinue services that generate non-ad valorem revenues. All of these factors may limit the availability of non-ad valorem revenues available to pay a portion of the debt service on the Series 2009, 2015 and 2017 Bonds. In addition, there can be no certainty as to the outcome of any judicial proceedings to enforce the City’s obligation to appropriate such funds.
LIMITATIONS OF LIMITED AD VALOREM TAX PLEDGE
The pledge of Limited Ad Valorem Tax revenues securing the Series 2009, 2015 and 2017 Bonds is not identical to the unlimited pledge of such revenues securing the City’s full faith and credit general obligations bonds. While the City is obligated to increase the millage rate if required to collect tax revenues is sufficient to pay debt service on full faith and credit general obligation bonds, such is not the case with the Series 2009, 2015 and 2017 bonds. The Limited Ad Valorem Tax which secures the 2009, 2015 and 2017 bonds may not be levied in excess of a millage rate that, when added to the millage rate needed to meet the debt service on the City’s outstanding full faith and credit general obligation bonds, exceeds 1.218 mills. In the contract with Issuer, the City has restricted its ability to incur additional full faith and credit general obligation indebtedness or voter approved bonds by covenanting to not issue such additional debt without having revenues generated by the Limited Ad Valorem Tax which will provide at least 1.0x coverage of outstanding Voter Approved Bonds, General Obligation Bonds and the proposed bonds to be issued.
Based on currently available information, the City believes that the revenues derived from ad valorem taxes collected at a millage rate of up to 1.218 mills will be sufficient to pay debt service on the Series 2009, 2015 and 2017 Bonds as well as the currently outstanding full faith and credit general
5

DESCRIPTION OF DEBT
obligation debt of the City. A decline, however, in property values within the City or a decline in tax collections could create a situation where ad valorem revenues would not be sufficient to pay all such debt service. In such circumstances, (1) ad valorem tax revenues would be utilized first to pay full faith and credit general obligation debt of the City, (2) increases in revenue reflecting an increase in the millage rate would be required only to produce revenue for the payment of full faith and credit general obligation debt, and (3) ad valorem tax revenues might not be available for the payment of any debt service on the Series 2009, 2015 and 2017 Bonds. Factors leading to such circumstances might include local, regional or national economic downturns; natural disasters such as hurricanes or floods; judicial challenges to tax rates and collections; and the inability of the Miami-Dade County Property Appraiser to properly assess such taxes and the Miami-Dade County Tax Collector to collect such taxes efficiently.
ELECTRONIC MUNICIPAL MARKET ACCESS (EMMA)
Since July 1, 2009, municipal security continuing disclosure information is required to be sent to the Municipal Securities Rulemaking Board (MSRB), through its EMMA website. For information about issuances of municipal securities that took place before 1990, or for continuing disclosure information published before July 1, 2009, you may be able to obtain information about particular municipal securities by accessing, or requesting such information from a former Nationally Recognized Municipal Securities Information Repositories (NRMSIR).
BLOOMBERG MUNICIPAL REPOSITORIES DPC DATA INC. P.O. Box 840 One Executive DrivePrinceton, NJ 08542-0840 Fort Lee, New Jersey 07024PH: (609) 279-3225 PH: (201) 346-0701FAX: (609) 279-5962 FAX: (201) 947-0107Email: Munis@ Bloomberg.com Email: [email protected]
INTERACTIVE DATA STANDARD & POOR’S J J KENNY REPOSITORYATTN: Repository 55 Water Street100 Williams Street 45th FloorNew York, NY 10038 New York, NY 10041PH: (212) 771-6999 PH: (212) 438-4595FAX: (212) 771-7390 (Secondary Mkt Info) FAX: (212) 438-3975FAX: (212) 771-7391 (Primary Mkt Info) Email: [email protected]: [email protected]
The EMMA website is funded and operated by the MSRB, the self-regulatory organization charged by Congress with promoting a fair and efficient municipal securities market. EMMA is designated by the U. S. Securities and Exchange Commission as the official source for municipal securities data and disclosure documents. The website provides free public access to objective municipal market information and interactive tools for investors, municipal entities and others. EMMA supports municipal market transparency but is not a platform for buying or selling bonds.
6

Credit Paying FinalOutstanding Facility Agent Maturity
Limited Ad Valorem Tax Bonds Series 2009 - Moody's Aa2 N/A US Bank 01/01/19S&P AA-Fitch A-
Limited Ad Valorem Tax Bonds Series 2015 51,670,000 N/A N/A N/A BOA 01/01/28
Limited Ad Valorem Tax Bonds Series 2017 83,645,000 N/A N/A N/A JP Morgan 01/01/29
Total Limited Ad Valorem Tax Bonds 135,315,000$
Rating on the Debt
General Obligation City of Miami, Florida
Limited Ad Valorem Tax Bonds Summary Information
As of September 30, 2019
Underlying Credit
7

Credit Paying FinalOutstanding Facility Agent Maturity
Limited Ad Valorem Tax Bonds Series 2009 - Moody's Aa2 N/A US Bank 01/01/19S&P AA-Fitch A-
Limited Ad Valorem Tax Bonds Series 2015 51,670,000 N/A N/A N/A BOA 01/01/28
Limited Ad Valorem Tax Bonds Series 2017 83,645,000 N/A N/A N/A JP Morgan 01/01/29
Total Limited Ad Valorem Tax Bonds 135,315,000$
Rating on the Debt
General Obligation City of Miami, Florida
Limited Ad Valorem Tax Bonds Summary Information
As of September 30, 2019
Underlying Credit
Credit Paying FinalOutstanding Facility Agent Maturity
Special Obligation Refunding Bonds, Series 2018A 57,405,000 Moody's A2 National US Bank 01/01/37(Street and Sidewalk) S&P APledged Revenues(PTT Tax 80%, Parking Surcharge 20%) Fitch AA-
(Local Optional Gas Tax 100%)
Special Obligation Refunding Bonds, Series 2018B 42,620,000 Moody's A2 National US Bank 01/01/39(Street and Sidewalk) S&P APledged Revenues(PTT Tax 80%, Parking Surcharge 20%) Fitch AA-
Special Obligation Bonds, Series 2018C 7,455,000 Moody's A2 National US Bank 01/01/39(Street and Sidewalk) S&P APledged Revenues(PTT Tax 80%, Parking Surcharge 20%) Fitch AA-
Tax-Exempt Special Obligation 84,540,000 Moody's A3 Assured TD Bank 07/01/39 Parking Revenue Bonds, Series 2010-A S&P A+ Guaranty(Marlins Parking Garage) Fitch AA-
Taxable Special Obligation 475,000 Moody's A3 Assured TD Bank 07/01/27 Parking Revenue Bonds, Series 2010-B S&P A+ Guaranty(Marlins Parking Garage Retail) Fitch AA-
Taxable Special Obligation 16,240,000 Moody's N/A BB&T 07/01/27 Parking Revenue Refunding(2010B)Notes, Series 2018 S&P N/A(Marlins Parking Garage Retail) Fitch N/A
Gran Central Corporation Loan 1,708,864 N/A N/A N/A N/A N/A
Total Loans, Special and Revenue Bonds. 210,443,864$
Rating on the Debt
City of Miami, FloridaSpecial Obligation and Revenue Bonds/Loans
with Specific Pledge Revenues and (Covenant to Budget)Summary Information
As of September 30, 2019
Underlying Credit
8

Credit Paying FinalDescription Outstanding Facility Agent Maturity
Non-Ad Valorem Revenue Bonds 7,550,000$ Moody's Aa3 AMBAC U. S. Bank 12/01/20Taxable Pension Series 1995 S&P AA-
Fitch A+
Non-Ad Valorem Refunding Revenue Bonds 6,095,000 Moody's Aa3 AMBAC U. S. Bank 12/01/25Taxable Pension Series 2009 S&P AA-
Fitch A+
Special Obligation Non-Ad Valorem Revenue 7,595,000 Moody's Aa3 Assured Guaranty Regions Bank 02/01/31Refunding Bonds Series 2011-A (1) S&P AA-
Fitch A+
Special Obligation Non-Ad Valorem Revenue 35,675,000 Moody's Aa3 NA U. S. Bank 03/01/30Refunding Bonds Series 2012 S&P AA-Port of Miami Tunnel Project Fitch A+
Special Obligation Refunding Bonds 7,138,449 NA NA NA PNC Bank 07/01/26 Series 2014
Special Obligation Non-Ad Valorem Revenue 24,120,000 NA NA NA Raymond James 01/01/32Park Remediation Series 2017
Special Obligation Refunding(2011A)Notes 57,235,000 NA NA NA JP Morgan 02/01/31Series 2017
Special Obligation Refunding(2009)Notes 7,055,000 NA NA NA PNC Bank 12/01/25Series 2017
Vehicle Replacement Program 2016 4,295,626 NA NA NA Santander 01/01/21
Vehicle Replacement Program 2017 6,132,362 NA NA NA Santander 01/01/22
Vehicle Replacement Program 2018 9,067,913 NA NA NA Santander 01/01/23
P25 Citywide Radio Eqip Lease 8,801,557 NA NA NA Signature Bank 07/15/24
Dell Financial Services Lease 2018 224,024 NA NA NA Dell Fincial Services 06/01/22
Wagner Creek Loan 13,745,199 NA NA NA State of Florida
Total 194,730,127$
Covenants
(1) The City may incur additional debt that is payable from all or a portion of the non-ad valorem revenues only if the total amount of "legally available"non-ad valorem revenues for the prior Fiscal Year are:
(a) at least 2.00 times the aggregate maximum annual debt service of all debt (including all long-term financial obligations appearing on the City's most recent audited financial statements and the debt proposed to be incurred) to be paid from non-ad valorem revenues and not other funds of the City (collectively, "Debt"), including any Debt payable from one or several specific non-ad valorem revenue sources but only to the extent such non-ad valorem revenues are "legally available" to pay debt service on the Bonds, currently at 2.40 times, see attached.
(b) so long as the Bonds are outstanding and if a Reserve Account Insurance Policy is in effect, at least 1.00 times the obligation of the city to repay any costs then due and owing to the Provider of a Reserve Account insurance Policy. Surety bond is in effect for 1.0x
Rating on the Debt
City of Miami. Florida
Special and Revenue Non-Ad Valorem BondsCovenant to Budget and Appropriate
Summary InformationAs of September 30, 2019
Underlying Credit
9
Credit Paying FinalDescription Outstanding Facility Agent Maturity
Non-Ad Valorem Revenue Bonds 7,550,000$ Moody's Aa3 AMBAC U. S. Bank 12/01/20Taxable Pension Series 1995 S&P AA-
Fitch A+
Non-Ad Valorem Refunding Revenue Bonds 6,095,000 Moody's Aa3 AMBAC U. S. Bank 12/01/25Taxable Pension Series 2009 S&P AA-
Fitch A+
Special Obligation Non-Ad Valorem Revenue 7,595,000 Moody's Aa3 Assured Guaranty Regions Bank 02/01/31Refunding Bonds Series 2011-A (1) S&P AA-
Fitch A+
Special Obligation Non-Ad Valorem Revenue 35,675,000 Moody's Aa3 NA U. S. Bank 03/01/30Refunding Bonds Series 2012 S&P AA-Port of Miami Tunnel Project Fitch A+
Special Obligation Refunding Bonds 7,138,449 NA NA NA PNC Bank 07/01/26 Series 2014
Special Obligation Non-Ad Valorem Revenue 24,120,000 NA NA NA Raymond James 01/01/32Park Remediation Series 2017
Special Obligation Refunding(2011A)Notes 57,235,000 NA NA NA JP Morgan 02/01/31Series 2017
Special Obligation Refunding(2009)Notes 7,055,000 NA NA NA PNC Bank 12/01/25Series 2017
Vehicle Replacement Program 2016 4,295,626 NA NA NA Santander 01/01/21
Vehicle Replacement Program 2017 6,132,362 NA NA NA Santander 01/01/22
Vehicle Replacement Program 2018 9,067,913 NA NA NA Santander 01/01/23
P25 Citywide Radio Eqip Lease 8,801,557 NA NA NA Signature Bank 07/15/24
Dell Financial Services Lease 2018 224,024 NA NA NA Dell Fincial Services 06/01/22
Wagner Creek Loan 13,745,199 NA NA NA State of Florida
Total 194,730,127$
Covenants
(1) The City may incur additional debt that is payable from all or a portion of the non-ad valorem revenues only if the total amount of "legally available"non-ad valorem revenues for the prior Fiscal Year are:
(a) at least 2.00 times the aggregate maximum annual debt service of all debt (including all long-term financial obligations appearing on the City's most recent audited financial statements and the debt proposed to be incurred) to be paid from non-ad valorem revenues and not other funds of the City (collectively, "Debt"), including any Debt payable from one or several specific non-ad valorem revenue sources but only to the extent such non-ad valorem revenues are "legally available" to pay debt service on the Bonds, currently at 2.40 times, see attached.
(b) so long as the Bonds are outstanding and if a Reserve Account Insurance Policy is in effect, at least 1.00 times the obligation of the city to repay any costs then due and owing to the Provider of a Reserve Account insurance Policy. Surety bond is in effect for 1.0x
Rating on the Debt
City of Miami. Florida
Special and Revenue Non-Ad Valorem BondsCovenant to Budget and Appropriate
Summary InformationAs of September 30, 2019
Underlying Credit
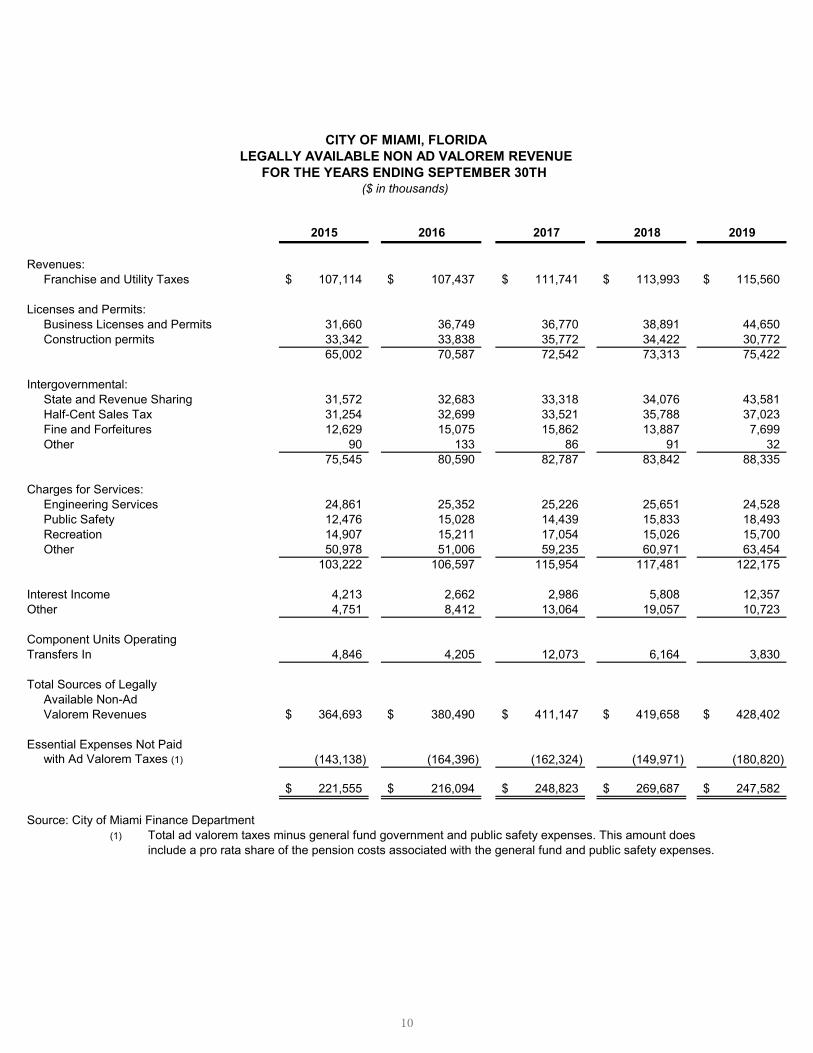
2015 2016 2017 2018 2019
Revenues: Franchise and Utility Taxes 107,114$ 107,437$ 111,741$ 113,993$ 115,560$
Licenses and Permits: Business Licenses and Permits 31,660 36,749 36,770 38,891 44,650 Construction permits 33,342 33,838 35,772 34,422 30,772
65,002 70,587 72,542 73,313 75,422
Intergovernmental: State and Revenue Sharing 31,572 32,683 33,318 34,076 43,581 Half-Cent Sales Tax 31,254 32,699 33,521 35,788 37,023 Fine and Forfeitures 12,629 15,075 15,862 13,887 7,699 Other 90 133 86 91 32
75,545 80,590 82,787 83,842 88,335
Charges for Services: Engineering Services 24,861 25,352 25,226 25,651 24,528 Public Safety 12,476 15,028 14,439 15,833 18,493 Recreation 14,907 15,211 17,054 15,026 15,700 Other 50,978 51,006 59,235 60,971 63,454
103,222 106,597 115,954 117,481 122,175
Interest Income 4,213 2,662 2,986 5,808 12,357 Other 4,751 8,412 13,064 19,057 10,723
Component Units OperatingTransfers In 4,846 4,205 12,073 6,164 3,830
Total Sources of Legally Available Non-Ad Valorem Revenues 364,693$ 380,490$ 411,147$ 419,658$ 428,402$
Essential Expenses Not Paid with Ad Valorem Taxes (1) (143,138) (164,396) (162,324) (149,971) (180,820)
221,555$ 216,094$ 248,823$ 269,687$ 247,582$
Source: City of Miami Finance Department(1) Total ad valorem taxes minus general fund government and public safety expenses. This amount does
include a pro rata share of the pension costs associated with the general fund and public safety expenses.
CITY OF MIAMI, FLORIDALEGALLY AVAILABLE NON AD VALOREM REVENUE
FOR THE YEARS ENDING SEPTEMBER 30TH ($ in thousands)
10

2015 2016 2017 2018 2019Net Non-Ad ValoremFunds Available toPay Debt Service (1) 221,555$ 216,094$ 248,823$ 269,687$ 247,582$ Debt Service (2) 85,656$ 90,148$ 101,562$ 101,558$ 96,336$ Coverage 2.59 2.40 2.45 2.66 2.57
(1) Total sources of Non Ad Valorem Revenues minus essential expenses (General Fund Governmentand Public Safety) in excess of ad valorem revenue (does include a pro rata share of the pensioncosts associated with the general Fund Government and Public Safety expenses).
(2) Maximum annual debt service times 2 on bonds or other debt obligations payable from Non Ad Valorem Revenues outstanding as of September 30, 2019.
CITY OF MIAMI, FLORIDACOVERAGE OF NET NON-AD VALOREM REVENUES
YEAR ENDED SEPTEMBER 30TH($ in thousands)
11

2015 2016 2017 2018 2019Net Non-Ad ValoremFunds Available toPay Debt Service (1) 221,555$ 216,094$ 248,823$ 269,687$ 247,582$ Debt Service (2) 85,656$ 90,148$ 101,562$ 101,558$ 96,336$ Coverage 2.59 2.40 2.45 2.66 2.57
(1) Total sources of Non Ad Valorem Revenues minus essential expenses (General Fund Governmentand Public Safety) in excess of ad valorem revenue (does include a pro rata share of the pensioncosts associated with the general Fund Government and Public Safety expenses).
(2) Maximum annual debt service times 2 on bonds or other debt obligations payable from Non Ad Valorem Revenues outstanding as of September 30, 2019.
CITY OF MIAMI, FLORIDACOVERAGE OF NET NON-AD VALOREM REVENUES
YEAR ENDED SEPTEMBER 30TH($ in thousands)
City of Miami, Florida Schedule of Principal and Interest for G.O.B - Direct PlacementFor Period Ended September 30, 2019
FiscalYear
Ending 57,240,000 57,240,000 57,240,000September GOBR-2015 GOBR-2015 GOBR-2015
30th Principal Interest Total2020 1,590,000.00 1,343,100.00 2,933,100.00 2021 1,115,000.00 1,307,394.00 2,422,394.00 2022 240,000.00 1,289,508.00 1,529,508.00 2023 7,575,000.00 1,186,350.00 8,761,350.00 2024 7,790,000.00 983,532.00 8,773,532.00 2025 8,000,000.00 775,104.00 8,775,104.00 2026 8,225,000.00 560,934.00 8,785,934.00 2027 8,450,000.00 340,824.00 8,790,824.00 2028 8,685,000.00 114,642.00 8,799,642.00 2029 -
Total 51,670,000.00 7,901,388.00 59,571,388.00
12

City of Miami, Florida Schedule of Principal and Interest for G.O.B - Direct PlacementFor Period Ended September 30, 2019
FiscalYear
Ending 114,380,000 114,380,000 114,380,000September GOBR-2017 GOBR-2017 GOBR-2017
30th Principal Interest Total2020 18,485,000.00 1,614,534.25 20,099,534.25 2021 19,780,000.00 1,199,359.00 20,979,359.00 2022 22,825,000.00 737,094.75 23,562,094.75 2023 680,000.00 482,065.50 1,162,065.50 2024 3,435,000.00 437,417.75 3,872,417.75 2025 3,520,000.00 361,956.00 3,881,956.00 2026 3,600,000.00 284,704.00 3,884,704.00 2027 3,685,000.00 205,661.75 3,890,661.75 2028 3,775,000.00 124,720.75 3,899,720.75 2029 3,860,000.00 41,881.00 3,901,881.00
Total 83,645,000.00 5,489,394.75 89,134,394.75
13
City of Miami, Florida Schedule of Principal and Interest for G.O.B - Direct PlacementFor Period Ended September 30, 2019
FiscalYear
Ending 114,380,000 114,380,000 114,380,000September GOBR-2017 GOBR-2017 GOBR-2017
30th Principal Interest Total2020 18,485,000.00 1,614,534.25 20,099,534.25 2021 19,780,000.00 1,199,359.00 20,979,359.00 2022 22,825,000.00 737,094.75 23,562,094.75 2023 680,000.00 482,065.50 1,162,065.50 2024 3,435,000.00 437,417.75 3,872,417.75 2025 3,520,000.00 361,956.00 3,881,956.00 2026 3,600,000.00 284,704.00 3,884,704.00 2027 3,685,000.00 205,661.75 3,890,661.75 2028 3,775,000.00 124,720.75 3,899,720.75 2029 3,860,000.00 41,881.00 3,901,881.00
Total 83,645,000.00 5,489,394.75 89,134,394.75
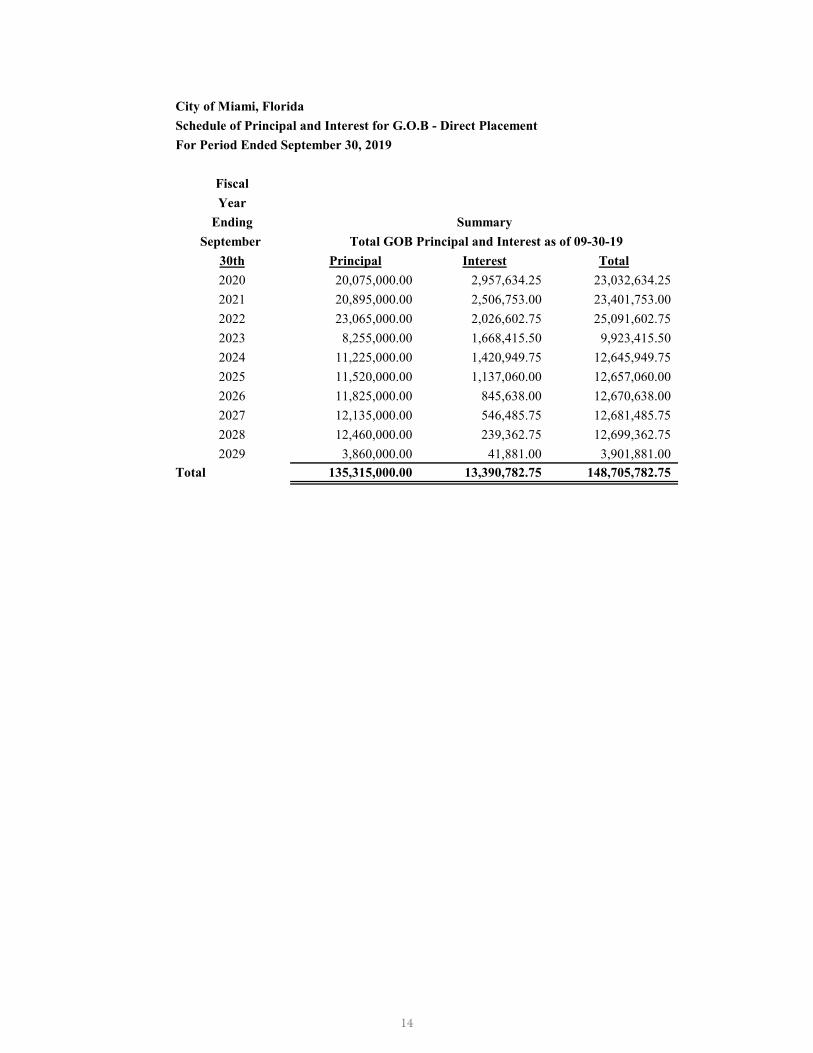
City of Miami, Florida Schedule of Principal and Interest for G.O.B - Direct PlacementFor Period Ended September 30, 2019
FiscalYear
EndingSeptember
30th Principal Interest Total2020 20,075,000.00 2,957,634.25 23,032,634.25 2021 20,895,000.00 2,506,753.00 23,401,753.00 2022 23,065,000.00 2,026,602.75 25,091,602.75 2023 8,255,000.00 1,668,415.50 9,923,415.50 2024 11,225,000.00 1,420,949.75 12,645,949.75 2025 11,520,000.00 1,137,060.00 12,657,060.00 2026 11,825,000.00 845,638.00 12,670,638.00 2027 12,135,000.00 546,485.75 12,681,485.75 2028 12,460,000.00 239,362.75 12,699,362.75 2029 3,860,000.00 41,881.00 3,901,881.00
Total 135,315,000.00 13,390,782.75 148,705,782.75
Total GOB Principal and Interest as of 09-30-19Summary
14

City of Miami, FloridaSchedule of Principal and Interest for Other Direct PlacementsFor Fiscal Year Ended September 30, 2019
Special
$18,049,380 $18,049,380 ObligationSpecial Special Non Ad-Valorem
Obligation Obligation RevenueFiscal Non Ad-Valorem Non Ad-Valorem RefundingYear Revenue Revenue 2014
Ending Refunding Refunding TotalSeptember 2014 2014 Principal&
30th Principal Interest Interest2020 933,501.50 234,141.12 1,167,642.62 2021 963,604.10 203,522.26 1,167,126.36 2022 991,303.40 171,916.06 1,163,219.46 2023 1,015,971.30 139,401.30 1,155,372.60 2024 1,047,670.10 106,077.44 1,153,747.54 2025 1,077,158.70 71,713.86 1,148,872.56 2026 1,109,239.50 36,383.06 1,145,622.56 2027 - - - 2028 - - - 2029 - - - 2030 - - - 2031 - 2032 - 2033 - 2034 - 2035 - 2036 - 2037 - 2038 - 2039
Total 7,138,448.60$ 963,155.10$ 8,101,603.70$
15

City of Miami, FloridaSchedule of Principal and Interest for Other Direct PlacementsFor Fiscal Year Ended September 30, 2019
Special
$18,049,380 $18,049,380 ObligationSpecial Special Non Ad-Valorem
Obligation Obligation RevenueFiscal Non Ad-Valorem Non Ad-Valorem RefundingYear Revenue Revenue 2014
Ending Refunding Refunding TotalSeptember 2014 2014 Principal&
30th Principal Interest Interest2020 933,501.50 234,141.12 1,167,642.62 2021 963,604.10 203,522.26 1,167,126.36 2022 991,303.40 171,916.06 1,163,219.46 2023 1,015,971.30 139,401.30 1,155,372.60 2024 1,047,670.10 106,077.44 1,153,747.54 2025 1,077,158.70 71,713.86 1,148,872.56 2026 1,109,239.50 36,383.06 1,145,622.56 2027 - - - 2028 - - - 2029 - - - 2030 - - - 2031 - 2032 - 2033 - 2034 - 2035 - 2036 - 2037 - 2038 - 2039
Total 7,138,448.60$ 963,155.10$ 8,101,603.70$
City of Miami, FloridaSchedule of Principal and Interest for Other Direct PlacementsFor Fiscal Year Ended September 30, 2019
FiscalYear $10,644,628 $10,644,628 $10,644,628
Ending Santander Santander Santander September 2016 2016 Principal&
30th Principal Interest Interest2020 2,138,848 54,087 2,192,936 2021 2,156,777 18,079 2,174,856 2022 - - - 2023 - - - 2024 - - - 2025 - - - 2026 - - - 2027 - - - 2028 - - - 2029 - - - 2030 - - - 2031 - - - 2032 - - - 2033 - - - 2034 - - - 2035 - - - 2036 - - - 2037 - - - 2038 - - - 2039 - - -
Total 4,295,626$ 72,166$ 4,367,792$
16
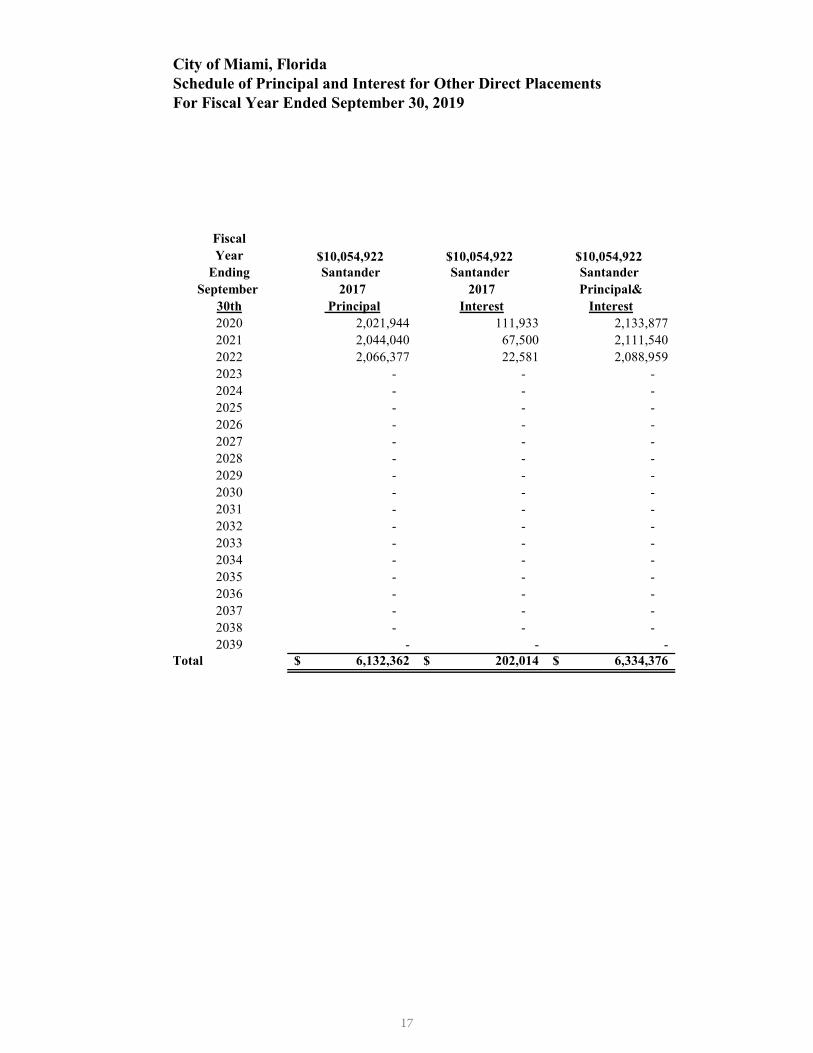
City of Miami, FloridaSchedule of Principal and Interest for Other Direct PlacementsFor Fiscal Year Ended September 30, 2019
FiscalYear $10,054,922 $10,054,922 $10,054,922
Ending Santander Santander Santander September 2017 2017 Principal&
30th Principal Interest Interest2020 2,021,944 111,933 2,133,877 2021 2,044,040 67,500 2,111,540 2022 2,066,377 22,581 2,088,959 2023 - - - 2024 - - - 2025 - - - 2026 - - - 2027 - - - 2028 - - - 2029 - - - 2030 - - - 2031 - - - 2032 - - - 2033 - - - 2034 - - - 2035 - - - 2036 - - - 2037 - - - 2038 - - - 2039 - - -
Total 6,132,362$ 202,014$ 6,334,376$
17

City of Miami, FloridaSchedule of Principal and Interest for Other Direct PlacementsFor Fiscal Year Ended September 30, 2019
FiscalYear $10,054,922 $10,054,922 $10,054,922
Ending Santander Santander Santander September 2017 2017 Principal&
30th Principal Interest Interest2020 2,021,944 111,933 2,133,877 2021 2,044,040 67,500 2,111,540 2022 2,066,377 22,581 2,088,959 2023 - - - 2024 - - - 2025 - - - 2026 - - - 2027 - - - 2028 - - - 2029 - - - 2030 - - - 2031 - - - 2032 - - - 2033 - - - 2034 - - - 2035 - - - 2036 - - - 2037 - - - 2038 - - - 2039 - - -
Total 6,132,362$ 202,014$ 6,334,376$
City of Miami, FloridaSchedule of Principal and Interest for Other Direct PlacementsFor Fiscal Year Ended September 30, 2019
Fiscal $11,270,011Year $11,270,011 $11,270,011 Santander
Ending Santander Santander 2018September 2018 2018 Principal&
30th Principal Interest Interest2020 2,214,893 247,029 2,461,923 2021 2,249,260 177,763 2,427,023 2022 2,284,159 107,423 2,391,582 2023 2,319,600 35,991 2,355,591 2024202520262027202820292030203120322033203420352036203720382039
Total 9,067,913$ 568,206$ 9,636,119$
18

City of Miami, FloridaSchedule of Principal and Interest for Other Direct PlacementsFor Fiscal Year Ended September 30, 2019
$12,100,000Fiscal $12,100,000 $12,100,000 P25Year P25 P25 Equipment
Ending Equipment Equipment LeaseSeptember Lease Lease Principal&
30th Principal Interest Interest2020 1,688,941 172,576 1,861,516 2021 1,723,895 137,621 1,861,516 2022 1,759,573 101,943 1,861,516 2023 1,795,989 65,527 1,861,516 2024 1,833,159 28,357 1,861,516 2025 - - - 2026 - - - 2027 - - - 2028 - - - 2029 - - - 2030 - - - 2031 - - - 2032 - - - 2033 - - - 2034 - - - 2035 - - - 2036 - - - 2037 - - - 2038 - - - 2039 - - -
Total 8,801,557$ 506,024$ 9,307,581$
19
City of Miami, FloridaSchedule of Principal and Interest for Other Direct PlacementsFor Fiscal Year Ended September 30, 2019
$12,100,000Fiscal $12,100,000 $12,100,000 P25Year P25 P25 Equipment
Ending Equipment Equipment LeaseSeptember Lease Lease Principal&
30th Principal Interest Interest2020 1,688,941 172,576 1,861,516 2021 1,723,895 137,621 1,861,516 2022 1,759,573 101,943 1,861,516 2023 1,795,989 65,527 1,861,516 2024 1,833,159 28,357 1,861,516 2025 - - - 2026 - - - 2027 - - - 2028 - - - 2029 - - - 2030 - - - 2031 - - - 2032 - - - 2033 - - - 2034 - - - 2035 - - - 2036 - - - 2037 - - - 2038 - - - 2039 - - -
Total 8,801,557$ 506,024$ 9,307,581$
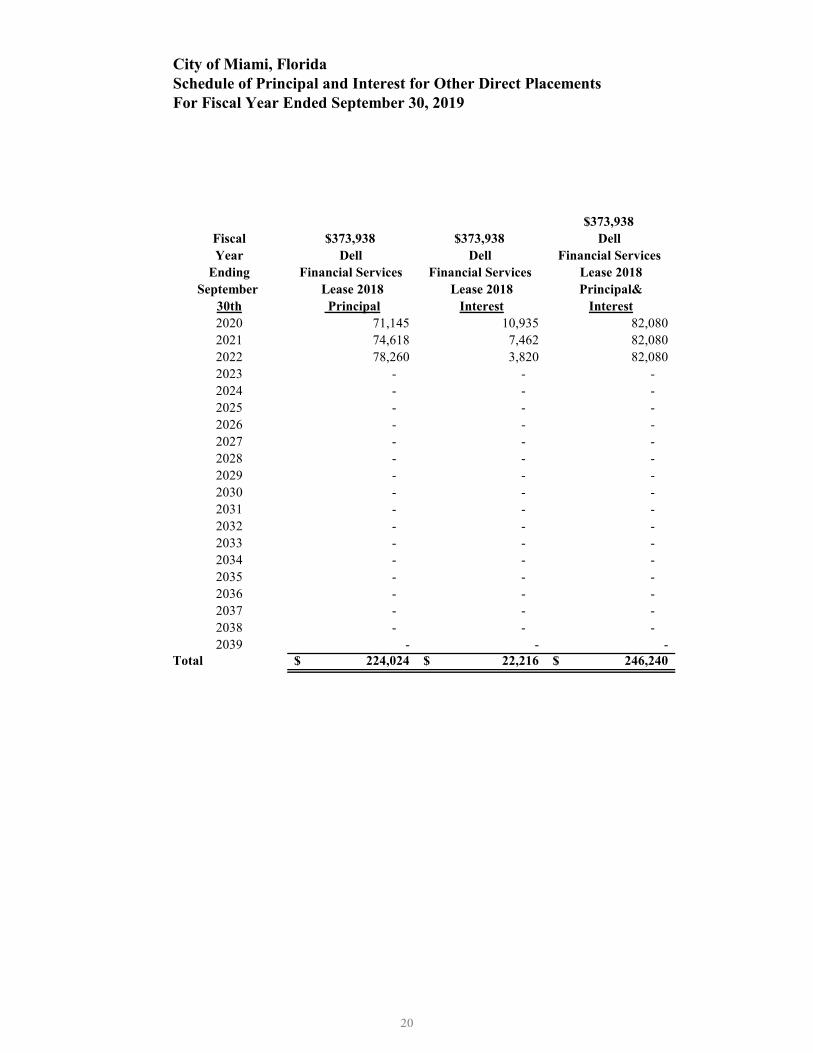
City of Miami, FloridaSchedule of Principal and Interest for Other Direct PlacementsFor Fiscal Year Ended September 30, 2019
$373,938Fiscal $373,938 $373,938 Dell Year Dell Dell Financial Services
Ending Financial Services Financial Services Lease 2018September Lease 2018 Lease 2018 Principal&
30th Principal Interest Interest2020 71,145 10,935 82,080 2021 74,618 7,462 82,080 2022 78,260 3,820 82,080 2023 - - - 2024 - - - 2025 - - - 2026 - - - 2027 - - - 2028 - - - 2029 - - - 2030 - - - 2031 - - - 2032 - - - 2033 - - - 2034 - - - 2035 - - - 2036 - - - 2037 - - - 2038 - - - 2039 - - -
Total 224,024$ 22,216$ 246,240$
20
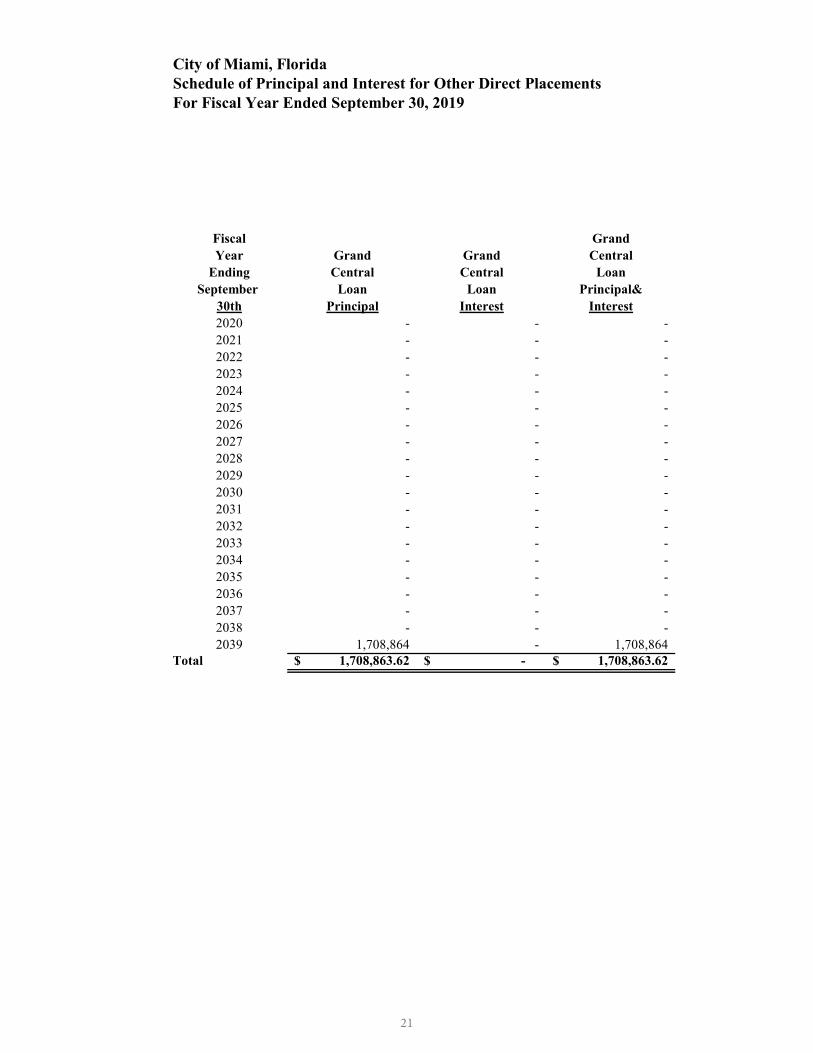
City of Miami, FloridaSchedule of Principal and Interest for Other Direct PlacementsFor Fiscal Year Ended September 30, 2019
Fiscal GrandYear Grand Grand Central
Ending Central Central LoanSeptember Loan Loan Principal&
30th Principal Interest Interest2020 - - - 2021 - - - 2022 - - - 2023 - - - 2024 - - - 2025 - - - 2026 - - - 2027 - - - 2028 - - - 2029 - - - 2030 - - - 2031 - - - 2032 - - - 2033 - - - 2034 - - - 2035 - - - 2036 - - - 2037 - - - 2038 - - - 2039 1,708,864 - 1,708,864
Total 1,708,863.62$ -$ 1,708,863.62$
21

City of Miami, FloridaSchedule of Principal and Interest for Other Direct PlacementsFor Fiscal Year Ended September 30, 2019
Fiscal GrandYear Grand Grand Central
Ending Central Central LoanSeptember Loan Loan Principal&
30th Principal Interest Interest2020 - - - 2021 - - - 2022 - - - 2023 - - - 2024 - - - 2025 - - - 2026 - - - 2027 - - - 2028 - - - 2029 - - - 2030 - - - 2031 - - - 2032 - - - 2033 - - - 2034 - - - 2035 - - - 2036 - - - 2037 - - - 2038 - - - 2039 1,708,864 - 1,708,864
Total 1,708,863.62$ -$ 1,708,863.62$
City of Miami, FloridaSchedule of Principal and Interest for Other Direct PlacementsFor Fiscal Year Ended September 30, 2019
$27,160,000$27,160,000 $27,160,000 Special
Fiscal Special Special ObligationYear Obligation Obligation Park Remediation
Ending Park Remediation Park Remediation Series 2017September Series 2017 Series 2017 Principal&
30th Principal Interest Interest2020 1,585,000 597,184 2,182,184 2021 1,625,000 556,096 2,181,096 2022 1,665,000 513,984 2,178,984 2023 1,710,000 470,784 2,180,784 2024 1,755,000 426,432 2,181,432 2025 1,800,000 380,928 2,180,928 2026 1,845,000 334,272 2,179,272 2027 1,895,000 286,400 2,181,400 2028 1,945,000 237,248 2,182,248 2029 1,995,000 186,816 2,181,816 2030 2,045,000 135,104 2,180,104 2031 2,100,000 82,048 2,182,048 2032 2,155,000 27,584 2,182,584 2033 - - - 2034 - - - 2035 - - - 2036 - - - 2037 - - - 2038 - - - 2039 - - -
Total 24,120,000$ 4,234,880$ 28,354,880$
22

City of Miami, FloridaSchedule of Principal and Interest for Other Direct PlacementsFor Fiscal Year Ended September 30, 2019
$13,745,199Fiscal $13,745,199 $13,745,199 Wagner CreekYear Wagner Creek Wagner Creek Seybold Canal Const.
Ending Seybold Canal Const. Seybold Canal Const. Loan 2018September Loan 2018 Loan 2018 Principal&
30th Principal Interest Interest2020 571,552 - 571,552 2021 1,143,104 - 1,143,104 2022 1,143,104 - 1,143,104 2023 1,143,104 - 1,143,104 2024 1,143,104 - 1,143,104 2025 1,143,104 - 1,143,104 2026 1,143,104 - 1,143,104 2027 1,143,104 - 1,143,104 2028 1,143,104 - 1,143,104 2029 1,143,104 - 1,143,104 2030 1,143,104 - 1,143,104 2031 1,143,104 - 1,143,104 2032 599,503 - 599,503 2033 - - 2034 - - - 2035 - - - 2036 - - - 2037 - - - 2038 - - - 2039 - - -
Total 13,745,199$ -$ 13,745,199$
23

City of Miami, FloridaSchedule of Principal and Interest for Other Direct PlacementsFor Fiscal Year Ended September 30, 2019
$13,745,199Fiscal $13,745,199 $13,745,199 Wagner CreekYear Wagner Creek Wagner Creek Seybold Canal Const.
Ending Seybold Canal Const. Seybold Canal Const. Loan 2018September Loan 2018 Loan 2018 Principal&
30th Principal Interest Interest2020 571,552 - 571,552 2021 1,143,104 - 1,143,104 2022 1,143,104 - 1,143,104 2023 1,143,104 - 1,143,104 2024 1,143,104 - 1,143,104 2025 1,143,104 - 1,143,104 2026 1,143,104 - 1,143,104 2027 1,143,104 - 1,143,104 2028 1,143,104 - 1,143,104 2029 1,143,104 - 1,143,104 2030 1,143,104 - 1,143,104 2031 1,143,104 - 1,143,104 2032 599,503 - 599,503 2033 - - 2034 - - - 2035 - - - 2036 - - - 2037 - - - 2038 - - - 2039 - - -
Total 13,745,199$ -$ 13,745,199$
City of Miami, FloridaSchedule of Principal and Interest for Other Direct PlacementsFor Fiscal Year Ended September 30, 2019
$59,310,000Special
$59,310,000 $59,310,000 ObligationSpecial Special Non Ad-Valorem
Obligation Obligation RevenueFiscal Non Ad-Valorem Non Ad-Valorem Refunding(2011-A)Year Revenue Revenue Series 2017
Ending Refunding(2011-A) Refunding(2011-A) TotalSeptember Series 2017 Series 2017 Principal&
30th Principal Interest Interest2020 805,000.00 1,579,943.50 2,384,943.50 2021 830,000.00 1,557,217.00 2,387,217.00 2022 4,890,000.00 1,477,709.00 6,367,709.00 2023 5,025,000.00 1,339,890.50 6,364,890.50 2024 5,170,000.00 1,198,180.00 6,368,180.00 2025 5,315,000.00 1,052,438.50 6,367,438.50 2026 5,465,000.00 902,596.50 6,367,596.50 2027 5,620,000.00 748,515.00 6,368,515.00 2028 5,780,000.00 590,055.00 6,370,055.00 2029 5,945,000.00 427,077.50 6,372,077.50 2030 6,110,000.00 259,513.00 6,369,513.00 2031 6,280,000.00 87,292.00 6,367,292.00 2032 - - - 2033 - - - 2034 - - - 2035 - - - 2036 - - - 2037 - - - 2038 - - - 2039 - - -
Total 57,235,000$ 11,220,428$ 68,455,428$
24

City of Miami, FloridaSchedule of Principal and Interest for Other Direct PlacementsFor Fiscal Year Ended September 30, 2019
$7,180,000Special
$7,180,000 $7,180,000 ObligationSpecial Special Taxable Pension
Fiscal Obligation Obligation Ref (2009)Year Taxable Pension Taxable Pension Series 2017
Ending Ref (2009) Ref (2009) TotalSeptember Series 2017 Series 2017 Principal&
30th Principal Interest Interest2020 130,000 220,185 350,185 2021 625,000 208,215 833,215 2022 630,000 188,449 818,449 2023 630,000 168,683 798,683 2024 635,000 148,759 783,759 2025 635,000 128,756 763,756 2026 3,770,000 59,378 3,829,378 2027 - - - 2028 - - - 2029 - - - 2030 - - - 2031 - - - 2032 - - - 2033 - - - 2034 - - - 2035 - - - 2036 - - - 2037 - - - 2038 - - - 2039 - - -
Total 7,055,000$ 1,122,424$ 8,177,424$
25

City of Miami, FloridaSchedule of Principal and Interest for Other Direct PlacementsFor Fiscal Year Ended September 30, 2019
$7,180,000Special
$7,180,000 $7,180,000 ObligationSpecial Special Taxable Pension
Fiscal Obligation Obligation Ref (2009)Year Taxable Pension Taxable Pension Series 2017
Ending Ref (2009) Ref (2009) TotalSeptember Series 2017 Series 2017 Principal&
30th Principal Interest Interest2020 130,000 220,185 350,185 2021 625,000 208,215 833,215 2022 630,000 188,449 818,449 2023 630,000 168,683 798,683 2024 635,000 148,759 783,759 2025 635,000 128,756 763,756 2026 3,770,000 59,378 3,829,378 2027 - - - 2028 - - - 2029 - - - 2030 - - - 2031 - - - 2032 - - - 2033 - - - 2034 - - - 2035 - - - 2036 - - - 2037 - - - 2038 - - - 2039 - - -
Total 7,055,000$ 1,122,424$ 8,177,424$
City of Miami, FloridaSchedule of Principal and Interest for Other Direct PlacementsFor Fiscal Year Ended September 30, 2019
$16,555,000
Special$16,555,000 $16,555,000 Obligation
Special Special Bonds MarlinsFiscal Obligation Obligation (2010B)Year Bonds Marlins Bonds Marlins Series 2018
Ending (2010B) (2010B)September Series 2018 Series 2018 Principal&
30th Principal Interest Interest2020 325,000 609,000 934,000 2021 1,845,000 596,813 2,441,813 2022 1,975,000 527,625 2,502,625 2023 2,045,000 453,563 2,498,563 2024 2,120,000 376,875 2,496,875 2025 2,200,000 297,375 2,497,375 2026 2,445,000 214,875 2,659,875 2027 3,285,000.00 91,687.50 3,376,687.50 2028 - - - 2029 - - - 2030 - - - 2031 - - - 2032 - - - 2033 - - - 2034 - - - 2035 - - - 2036 - - - 2037 - - - 2038 - - - 2039 - - -
Total 16,240,000$ 3,167,813$ 19,407,813$
26

City of Miami, FloridaSchedule of Principal and Interest for Other Direct PlacementsFor Fiscal Year Ended September 30, 2019
$10,000,000 $10,000,000 $10,000,000CRA CRA CRA
OMNI OMNI OMNIFiscal Tax Tax TaxYear Incremental Incremental Incremental
Ending Revenue Revenue RevenueSeptember 2018-A 2018-A 2018-A
30th Principal Interest Prin & Int2020 760,000.00 286,650.00 1,046,650.00 2021 785,000.00 261,950.00 1,046,950.00 2022 810,000.00 236,437.50 1,046,437.50 2023 835,000.00 210,112.50 1,045,112.50 2024 865,000.00 182,975.00 1,047,975.00 2025 895,000.00 154,862.50 1,049,862.50 2026 920,000.00 125,775.00 1,045,775.00 2027 950,000.00 95,875.00 1,045,875.00 2028 985,000.00 65,000.00 1,050,000.00 2029 1,015,000.00 32,987.50 1,047,987.50 2030 - 2031 - 2032 - 2033 - 2034 - 2035 - 2036 - 2037 - 2038 - 2039
Total 8,820,000$ 1,652,625$ 10,472,625$
27

City of Miami, FloridaSchedule of Principal and Interest for Other Direct PlacementsFor Fiscal Year Ended September 30, 2019
$10,000,000 $10,000,000 $10,000,000CRA CRA CRA
OMNI OMNI OMNIFiscal Tax Tax TaxYear Incremental Incremental Incremental
Ending Revenue Revenue RevenueSeptember 2018-A 2018-A 2018-A
30th Principal Interest Prin & Int2020 760,000.00 286,650.00 1,046,650.00 2021 785,000.00 261,950.00 1,046,950.00 2022 810,000.00 236,437.50 1,046,437.50 2023 835,000.00 210,112.50 1,045,112.50 2024 865,000.00 182,975.00 1,047,975.00 2025 895,000.00 154,862.50 1,049,862.50 2026 920,000.00 125,775.00 1,045,775.00 2027 950,000.00 95,875.00 1,045,875.00 2028 985,000.00 65,000.00 1,050,000.00 2029 1,015,000.00 32,987.50 1,047,987.50 2030 - 2031 - 2032 - 2033 - 2034 - 2035 - 2036 - 2037 - 2038 - 2039
Total 8,820,000$ 1,652,625$ 10,472,625$
City of Miami, FloridaSchedule of Principal and Interest for Other Direct PlacementsFor Fiscal Year Ended September 30, 2019
$15,000,000 $15,000,000 $15,000,000CRA CRA CRA
OMNI OMNI OMNIFiscal Tax Tax TaxYear Incremental Incremental Incremental
Ending Revenue Revenue RevenueSeptember 2018-B 2018-B 2018-B
30th Principal Interest Prin & Int2020 1,140,000.00 628,375.50 1,768,375.50 2021 1,190,000.00 577,189.50 1,767,189.50 2022 1,245,000.00 523,758.50 1,768,758.50 2023 1,305,000.00 467,858.00 1,772,858.00 2024 1,360,000.00 409,263.50 1,769,263.50 2025 1,415,000.00 348,199.50 1,763,199.50 2026 1,485,000.00 284,666.00 1,769,666.00 2027 1,550,000.00 217,989.50 1,767,989.50 2028 1,615,000.00 148,394.50 1,763,394.50 2029 1,690,000.00 75,881.00 1,765,881.00 2030 - 2031 - 2032 - 2033 - 2034 - 2035 - 2036 - 2037 - 2038 - 2039
Total 13,995,000$ 3,681,576$ 17,676,576$
28

City of Miami, FloridaSchedule of Principal and Interest for Other Direct PlacementsFor Fiscal Year Ended September 30, 2019
FiscalYear Grand
Ending Grand Grand TotalSeptember Total Total Principal
30th Principal Interest & Interest2020 14,385,825.40 4,752,038.85 19,137,864.25 2021 17,255,298.07 4,369,427.96 21,624,726.03 2022 19,537,776.95 3,875,646.16 23,413,423.11 2023 17,824,664.72 3,351,809.19 21,176,473.91 2024 15,928,933.21 2,876,918.72 18,805,851.93 2025 14,480,262.70 2,434,273.61 16,914,536.31 2026 18,182,343.50 1,957,945.06 20,140,288.56 2027 14,443,104.00 1,440,467.00 15,883,571.00 2028 11,468,104.00 1,040,697.50 12,508,801.50 2029 11,788,104.00 722,762.00 12,510,866.00 2030 9,298,104.00 394,617.00 9,692,721.00 2031 9,523,104.00 169,340.00 9,692,444.00 2032 2,754,502.81 27,584.00 2,782,086.81 2033 - - - 2034 - - - 2035 - - - 2036 - - - 2037 - - - 2038 - - - 2039 1,708,863.62 - 1,708,863.62
Total 178,578,990.98$ 27,413,527.05 205,992,518.03
Total Other Direct Placement Principal and Interest as of 09-30-19
29

City of Miami, FloridaSchedule of Principal and Interest for Other Direct PlacementsFor Fiscal Year Ended September 30, 2019
FiscalYear Grand
Ending Grand Grand TotalSeptember Total Total Principal
30th Principal Interest & Interest2020 14,385,825.40 4,752,038.85 19,137,864.25 2021 17,255,298.07 4,369,427.96 21,624,726.03 2022 19,537,776.95 3,875,646.16 23,413,423.11 2023 17,824,664.72 3,351,809.19 21,176,473.91 2024 15,928,933.21 2,876,918.72 18,805,851.93 2025 14,480,262.70 2,434,273.61 16,914,536.31 2026 18,182,343.50 1,957,945.06 20,140,288.56 2027 14,443,104.00 1,440,467.00 15,883,571.00 2028 11,468,104.00 1,040,697.50 12,508,801.50 2029 11,788,104.00 722,762.00 12,510,866.00 2030 9,298,104.00 394,617.00 9,692,721.00 2031 9,523,104.00 169,340.00 9,692,444.00 2032 2,754,502.81 27,584.00 2,782,086.81 2033 - - - 2034 - - - 2035 - - - 2036 - - - 2037 - - - 2038 - - - 2039 1,708,863.62 - 1,708,863.62
Total 178,578,990.98$ 27,413,527.05 205,992,518.03
Total Other Direct Placement Principal and Interest as of 09-30-19
City of Miami, FloridaSchedule of Principal and Interest for Special Obligation, Revenue BondsFor Fiscal Year Ended September 30, 2019
$72,000,000
Special $72,000,000 $72,000,000 Obligation
Special Special Non-Ad ValoremObligation Obligation Taxable Revenue
Fiscal Non-Ad Valorem Non-Ad Valorem Pension BondsYear Taxable Revenue Taxable Revenue Series 1995
Ending Pension Bonds Pension Bonds TotalSeptember Series 1995 Series 1995 Principal&
30th Principal Interest Interest2020 3,640,000 412,560 4,052,560 2021 3,910,000 140,760 4,050,760 2022 - - - 2023 - - - 2024 - - - 2025 - - - 2026 - - - 2027202820292030203120322033203420352036203720382039
Total 7,550,000.00$ 553,320.00$ 8,103,320.00$
30

City of Miami, FloridaSchedule of Principal and Interest for Special Obligation, Revenue BondsFor Fiscal Year Ended September 30, 2019
$37,435,000 $37,435,000 $37,435,000Fiscal Non Ad Valorem Non Ad Valorem Non Ad ValoremYear Revenue Revenue Revenue
Ending Bonds Bonds BondsSeptember Series 2009 Series 2009 Series 2009
30th Principal Interest Principal & Interest2020 6,095,000 213,325 6,308,325 2021202220232024202520262027202820292030203120322033203420352036203720382039
Total 6,095,000.00$ 213,325.00$ 6,308,325.00$
31

City of Miami, FloridaSchedule of Principal and Interest for Special Obligation, Revenue BondsFor Fiscal Year Ended September 30, 2019
$37,435,000 $37,435,000 $37,435,000Fiscal Non Ad Valorem Non Ad Valorem Non Ad ValoremYear Revenue Revenue Revenue
Ending Bonds Bonds BondsSeptember Series 2009 Series 2009 Series 2009
30th Principal Interest Principal & Interest2020 6,095,000 213,325 6,308,325 2021202220232024202520262027202820292030203120322033203420352036203720382039
Total 6,095,000.00$ 213,325.00$ 6,308,325.00$
City of Miami, FloridaSchedule of Principal and Interest for Special Obligation, Revenue BondsFor Fiscal Year Ended September 30, 2019
$57,405,000Special
$57,405,000 $57,405,000 Obligation RefFiscal Special Special 2018AYear Obligation Ref Obligation Ref Streets & Sidewalks
Ending 2018A 2018A TotalSeptember Streets & Sidewalks Streets & Sidewalks Principal&
30th Principal Interest Interest2020 2,020,000 2,819,750 4,839,750 2021 2,120,000 2,716,250 4,836,250 2022 2,230,000 2,607,500 4,837,500 2023 2,340,000 2,493,250 4,833,250 2024 2,460,000 2,373,250 4,833,250 2025 2,590,000 2,247,000 4,837,000 2026 2,725,000 2,114,125 4,839,125 2027 2,860,000 1,974,500 4,834,500 2028 3,010,000 1,827,750 4,837,750 2029 3,160,000 1,673,500 4,833,500 2030 3,325,000 1,511,375 4,836,375 2031 3,495,000 1,340,875 4,835,875 2032 3,675,000 1,161,625 4,836,625 2033 3,865,000 973,125 4,838,125 2034 4,060,000 775,000 4,835,000 2035 4,265,000 566,875 4,831,875 2036 4,490,000 348,000 4,838,000 2037 4,715,000 117,875 4,832,875 20382039
Total 57,405,000.00$ 29,641,625.00$ 87,046,625.00$
32
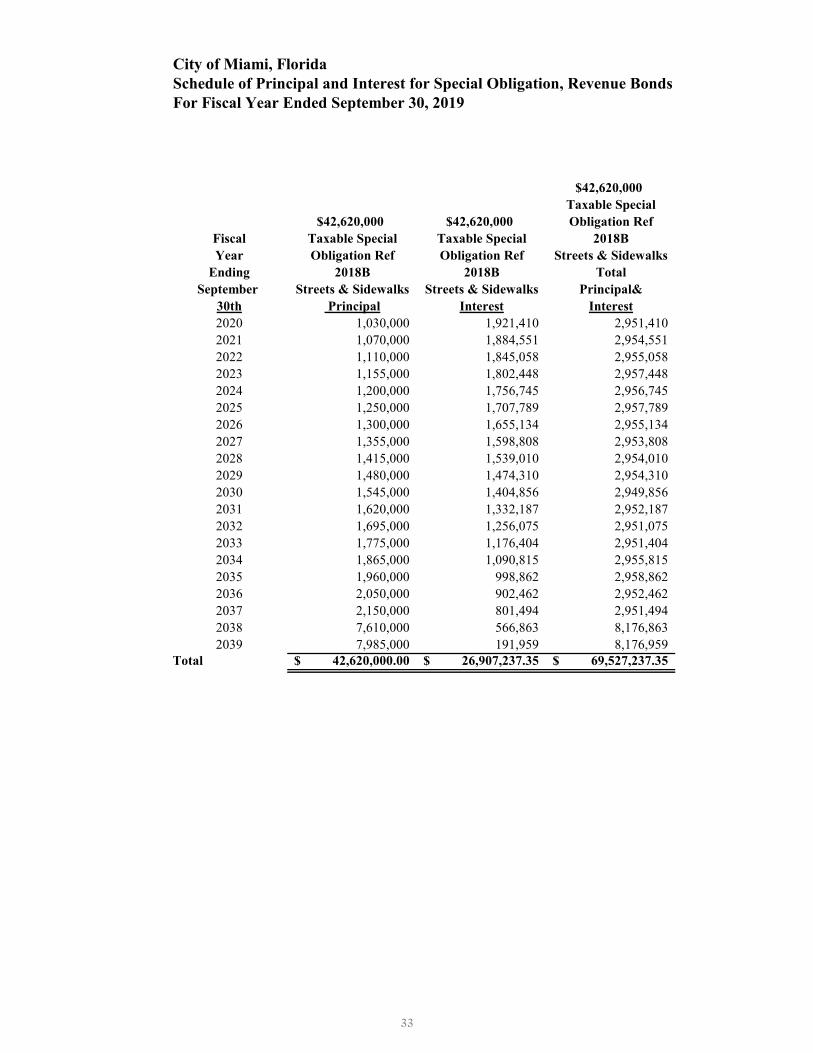
City of Miami, FloridaSchedule of Principal and Interest for Special Obligation, Revenue BondsFor Fiscal Year Ended September 30, 2019
$42,620,000Taxable Special
$42,620,000 $42,620,000 Obligation RefFiscal Taxable Special Taxable Special 2018BYear Obligation Ref Obligation Ref Streets & Sidewalks
Ending 2018B 2018B TotalSeptember Streets & Sidewalks Streets & Sidewalks Principal&
30th Principal Interest Interest2020 1,030,000 1,921,410 2,951,410 2021 1,070,000 1,884,551 2,954,551 2022 1,110,000 1,845,058 2,955,058 2023 1,155,000 1,802,448 2,957,448 2024 1,200,000 1,756,745 2,956,745 2025 1,250,000 1,707,789 2,957,789 2026 1,300,000 1,655,134 2,955,134 2027 1,355,000 1,598,808 2,953,808 2028 1,415,000 1,539,010 2,954,010 2029 1,480,000 1,474,310 2,954,310 2030 1,545,000 1,404,856 2,949,856 2031 1,620,000 1,332,187 2,952,187 2032 1,695,000 1,256,075 2,951,075 2033 1,775,000 1,176,404 2,951,404 2034 1,865,000 1,090,815 2,955,815 2035 1,960,000 998,862 2,958,862 2036 2,050,000 902,462 2,952,462 2037 2,150,000 801,494 2,951,494 2038 7,610,000 566,863 8,176,863 2039 7,985,000 191,959 8,176,959
Total 42,620,000.00$ 26,907,237.35$ 69,527,237.35$
33

City of Miami, FloridaSchedule of Principal and Interest for Special Obligation, Revenue BondsFor Fiscal Year Ended September 30, 2019
$42,620,000Taxable Special
$42,620,000 $42,620,000 Obligation RefFiscal Taxable Special Taxable Special 2018BYear Obligation Ref Obligation Ref Streets & Sidewalks
Ending 2018B 2018B TotalSeptember Streets & Sidewalks Streets & Sidewalks Principal&
30th Principal Interest Interest2020 1,030,000 1,921,410 2,951,410 2021 1,070,000 1,884,551 2,954,551 2022 1,110,000 1,845,058 2,955,058 2023 1,155,000 1,802,448 2,957,448 2024 1,200,000 1,756,745 2,956,745 2025 1,250,000 1,707,789 2,957,789 2026 1,300,000 1,655,134 2,955,134 2027 1,355,000 1,598,808 2,953,808 2028 1,415,000 1,539,010 2,954,010 2029 1,480,000 1,474,310 2,954,310 2030 1,545,000 1,404,856 2,949,856 2031 1,620,000 1,332,187 2,952,187 2032 1,695,000 1,256,075 2,951,075 2033 1,775,000 1,176,404 2,951,404 2034 1,865,000 1,090,815 2,955,815 2035 1,960,000 998,862 2,958,862 2036 2,050,000 902,462 2,952,462 2037 2,150,000 801,494 2,951,494 2038 7,610,000 566,863 8,176,863 2039 7,985,000 191,959 8,176,959
Total 42,620,000.00$ 26,907,237.35$ 69,527,237.35$
City of Miami, FloridaSchedule of Principal and Interest for Special Obligation, Revenue BondsFor Fiscal Year Ended September 30, 2019
$7,455,000Taxable Special
$7,455,000 $7,455,000 Obligation Fiscal Taxable Special Taxable Special 2018CYear Obligation Obligation Streets & Sidewalks
Ending 2018C 2018C TotalSeptember Streets & Sidewalks Streets & Sidewalks Principal&
30th Principal Interest Interest2020 240,000 332,842 572,842 2021 250,000 323,444 573,444 2022 260,000 313,662 573,662 2023 270,000 303,496 573,496 2024 280,000 292,239 572,239 2025 295,000 279,756 574,756 2026 305,000 266,730 571,730 2027 320,000 253,161 573,161 2028 335,000 238,835 573,835 2029 350,000 223,420 573,420 2030 365,000 207,003 572,003 2031 380,000 189,898 569,898 2032 400,000 171,989 571,989 2033 420,000 153,162 573,162 2034 440,000 132,941 572,941 2035 460,000 111,305 571,305 2036 485,000 88,587 573,587 2037 510,000 64,668 574,668 2038 530,000 39,666 569,666 2039 560,000 13,462 573,462
Total 7,455,000.00$ 4,000,265.60$ 11,455,265.60$
34

City of Miami, FloridaSchedule of Principal and Interest for Special Obligation, Revenue BondsFor Fiscal Year Ended September 30, 2019
$84,540,000Special
$84,540,000 $84,540,000 ObligationSpecial Special Marlins
Obligation Obligation ParkingFiscal Marlins Marlins GarageYear Parking Parking 2010A
Ending Garage Garage TotalSeptember 2010A 2010A Principal&
30th Principal Interest Interest2020 - 4,403,362.50 4,403,362.50 2021 - 4,403,362.50 4,403,362.50 2022 - 4,403,362.50 4,403,362.50 2023 - 4,403,362.50 4,403,362.50 2024 - 4,403,362.50 4,403,362.50 2025 - 4,403,362.50 4,403,362.50 2026 - 4,403,362.50 4,403,362.50 2027 1,275,000.00 4,403,362.50 5,678,362.50 2028 4,035,000.00 4,339,612.50 8,374,612.50 2029 4,235,000.00 4,137,862.50 8,372,862.50 2030 4,450,000.00 3,926,112.50 8,376,112.50 2031 6,670,000.00 3,703,612.50 10,373,612.50 2032 7,350,000.00 3,353,437.50 10,703,437.50 2033 7,735,000.00 2,967,562.50 10,702,562.50 2034 8,140,000.00 2,561,475.00 10,701,475.00 2035 8,565,000.00 2,134,125.00 10,699,125.00 2036 9,015,000.00 1,684,462.50 10,699,462.50 2037 9,830,000.00 1,211,175.00 11,041,175.00 2038 10,350,000.00 695,100.00 11,045,100.00 2039 2,890,000.00 151,725.00 3,041,725.00
Total 84,540,000.00$ 66,093,162.50$ 150,633,162.50$
35
City of Miami, FloridaSchedule of Principal and Interest for Special Obligation, Revenue BondsFor Fiscal Year Ended September 30, 2019
$84,540,000Special
$84,540,000 $84,540,000 ObligationSpecial Special Marlins
Obligation Obligation ParkingFiscal Marlins Marlins GarageYear Parking Parking 2010A
Ending Garage Garage TotalSeptember 2010A 2010A Principal&
30th Principal Interest Interest2020 - 4,403,362.50 4,403,362.50 2021 - 4,403,362.50 4,403,362.50 2022 - 4,403,362.50 4,403,362.50 2023 - 4,403,362.50 4,403,362.50 2024 - 4,403,362.50 4,403,362.50 2025 - 4,403,362.50 4,403,362.50 2026 - 4,403,362.50 4,403,362.50 2027 1,275,000.00 4,403,362.50 5,678,362.50 2028 4,035,000.00 4,339,612.50 8,374,612.50 2029 4,235,000.00 4,137,862.50 8,372,862.50 2030 4,450,000.00 3,926,112.50 8,376,112.50 2031 6,670,000.00 3,703,612.50 10,373,612.50 2032 7,350,000.00 3,353,437.50 10,703,437.50 2033 7,735,000.00 2,967,562.50 10,702,562.50 2034 8,140,000.00 2,561,475.00 10,701,475.00 2035 8,565,000.00 2,134,125.00 10,699,125.00 2036 9,015,000.00 1,684,462.50 10,699,462.50 2037 9,830,000.00 1,211,175.00 11,041,175.00 2038 10,350,000.00 695,100.00 11,045,100.00 2039 2,890,000.00 151,725.00 3,041,725.00
Total 84,540,000.00$ 66,093,162.50$ 150,633,162.50$
City of Miami, FloridaSchedule of Principal and Interest for Special Obligation, Revenue BondsFor Fiscal Year Ended September 30, 2019
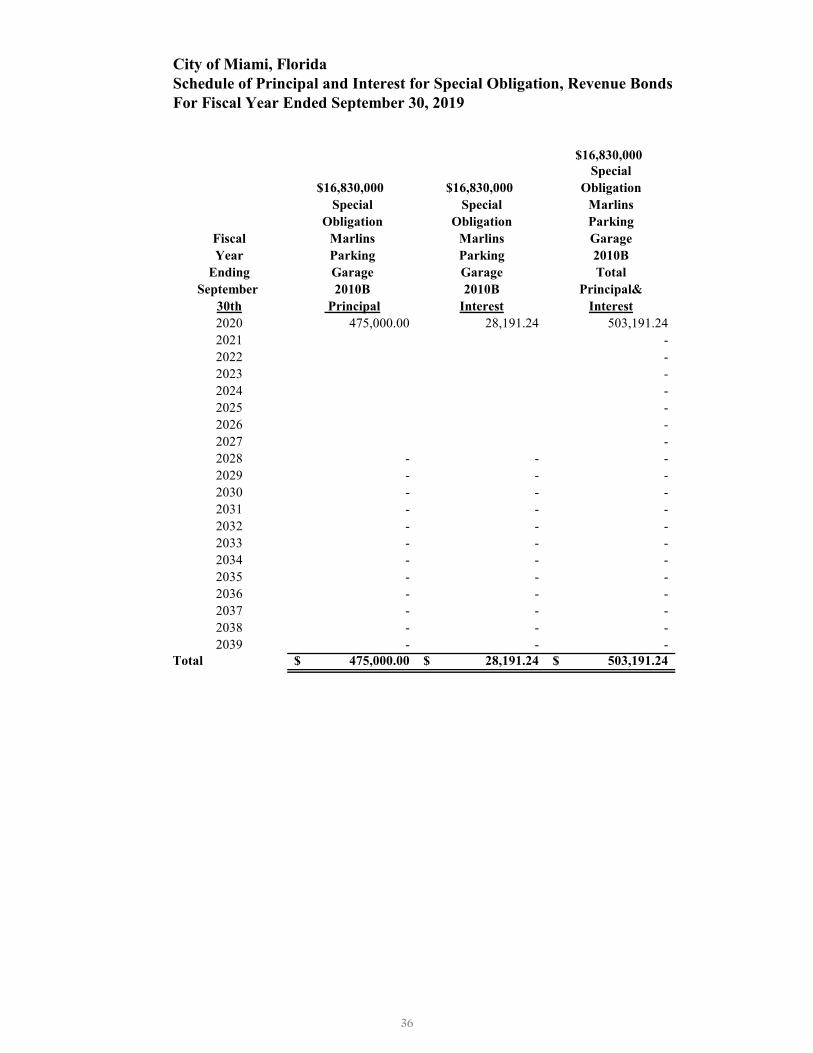
$16,830,000Special
$16,830,000 $16,830,000 ObligationSpecial Special Marlins
Obligation Obligation ParkingFiscal Marlins Marlins GarageYear Parking Parking 2010B
Ending Garage Garage TotalSeptember 2010B 2010B Principal&
30th Principal Interest Interest2020 475,000.00 28,191.24 503,191.24 2021 - 2022 - 2023 - 2024 - 2025 - 2026 - 2027 - 2028 - - - 2029 - - - 2030 - - - 2031 - - - 2032 - - - 2033 - - - 2034 - - - 2035 - - - 2036 - - - 2037 - - - 2038 - - - 2039 - - -
Total 475,000.00$ 28,191.24$ 503,191.24$
36

City of Miami, FloridaSchedule of Principal and Interest for Special Obligation, Revenue BondsFor Fiscal Year Ended September 30, 2019
$70,645,000Special
$70,645,000 $70,645,000 ObligationSpecial Special Non Ad-Valorem
Obligation Obligation RevenueFiscal Non Ad-Valorem Non Ad-Valorem RefundingYear Revenue Revenue 2011-A
Ending Refunding Refunding TotalSeptember 2011-A 2011-A Principal&
30th Principal Interest Interest2020 3,705,000.00 278,493.76 3,983,493.76 2021 3,890,000.00 93,246.88 3,983,246.88 2022 - 2023 - 2024 - 2025 - 2026 - 2027 - 2028 - 2029 - 2030 - 2031 - 2032 - - - 2033 - - - 2034 - - - 2035 - - - 2036 - - - 2037 - - - 2038 - - - 2039 - - -
Total 7,595,000.00$ 371,740.64$ 7,966,740.64$
37

City of Miami, FloridaSchedule of Principal and Interest for Special Obligation, Revenue BondsFor Fiscal Year Ended September 30, 2019
$70,645,000Special
$70,645,000 $70,645,000 ObligationSpecial Special Non Ad-Valorem
Obligation Obligation RevenueFiscal Non Ad-Valorem Non Ad-Valorem RefundingYear Revenue Revenue 2011-A
Ending Refunding Refunding TotalSeptember 2011-A 2011-A Principal&
30th Principal Interest Interest2020 3,705,000.00 278,493.76 3,983,493.76 2021 3,890,000.00 93,246.88 3,983,246.88 2022 - 2023 - 2024 - 2025 - 2026 - 2027 - 2028 - 2029 - 2030 - 2031 - 2032 - - - 2033 - - - 2034 - - - 2035 - - - 2036 - - - 2037 - - - 2038 - - - 2039 - - -
Total 7,595,000.00$ 371,740.64$ 7,966,740.64$
City of Miami, FloridaSchedule of Principal and Interest for Special Obligation, Revenue BondsFor Fiscal Year Ended September 30, 2019
Fiscal $44,725,000.00Year $44,725,000.00 $44,725,000.00 Port of Miami
Ending Port of Miami Port of Miami Tunnel LoanSeptember Tunnel Loan Tunnel Loan Principal&
30th Principal Interest Interest2020 2,510,000.00 1,721,000.00 4,231,000.00 2021 2,635,000.00 1,592,375.00 4,227,375.00 2022 2,770,000.00 1,457,250.00 4,227,250.00 2023 2,905,000.00 1,315,375.00 4,220,375.00 2024 3,055,000.00 1,166,375.00 4,221,375.00 2025 3,205,000.00 1,009,875.00 4,214,875.00 2026 3,365,000.00 845,625.00 4,210,625.00 2027 3,535,000.00 673,125.00 4,208,125.00 2028 3,710,000.00 492,000.00 4,202,000.00 2029 3,895,000.00 301,875.00 4,196,875.00 2030 4,090,000.00 102,250.00 4,192,250.00 2031 - 2032 - 2033 - 2034 - 2035 - 2036 - 2037 - 2038 - 2039
Total 35,675,000.00$ 10,677,125.00$ 46,352,125.00$
38

City of Miami, FloridaSchedule of Principal and Interest for Special Obligation, Revenue BondsFor Fiscal Year Ended September 30, 2019
$50,000,000 $50,000,000 $50,000,000CRA CRA CRA
SEOPW SEOPW SEOPWFiscal Tax Tax TaxYear Incremental Incremental Incremental
Ending Revenue Revenue RevenueSeptember 2014A-1 2014A-1 2014A-1
30th Principal Interest Prin & Int2020 2,650,000.00 1,864,250.00 4,514,250.00 2021 2,785,000.00 1,728,375.00 4,513,375.00 2022 2,925,000.00 1,585,625.00 4,510,625.00 2023 3,075,000.00 1,435,625.00 4,510,625.00 2024 3,230,000.00 1,278,000.00 4,508,000.00 2025 3,390,000.00 1,112,500.00 4,502,500.00 2026 3,560,000.00 938,750.00 4,498,750.00 2027 3,735,000.00 756,375.00 4,491,375.00 2028 3,920,000.00 565,000.00 4,485,000.00 2029 4,120,000.00 364,000.00 4,484,000.00 2030 5,220,000.00 130,500.00 5,350,500.00 2031 - 2032 - 2033 - 2034 - 2035 - 2036 - 2037 - 2038 - 2039
Total 38,610,000.00$ 11,759,000.00$ 50,369,000.00$
39
City of Miami, FloridaSchedule of Principal and Interest for Special Obligation, Revenue BondsFor Fiscal Year Ended September 30, 2019
$50,000,000 $50,000,000 $50,000,000CRA CRA CRA
SEOPW SEOPW SEOPWFiscal Tax Tax TaxYear Incremental Incremental Incremental
Ending Revenue Revenue RevenueSeptember 2014A-1 2014A-1 2014A-1
30th Principal Interest Prin & Int2020 2,650,000.00 1,864,250.00 4,514,250.00 2021 2,785,000.00 1,728,375.00 4,513,375.00 2022 2,925,000.00 1,585,625.00 4,510,625.00 2023 3,075,000.00 1,435,625.00 4,510,625.00 2024 3,230,000.00 1,278,000.00 4,508,000.00 2025 3,390,000.00 1,112,500.00 4,502,500.00 2026 3,560,000.00 938,750.00 4,498,750.00 2027 3,735,000.00 756,375.00 4,491,375.00 2028 3,920,000.00 565,000.00 4,485,000.00 2029 4,120,000.00 364,000.00 4,484,000.00 2030 5,220,000.00 130,500.00 5,350,500.00 2031 - 2032 - 2033 - 2034 - 2035 - 2036 - 2037 - 2038 - 2039
Total 38,610,000.00$ 11,759,000.00$ 50,369,000.00$
City of Miami, FloridaSchedule of Principal and Interest for Special Obligation, Revenue BondsFor Fiscal Year Ended September 30, 2019
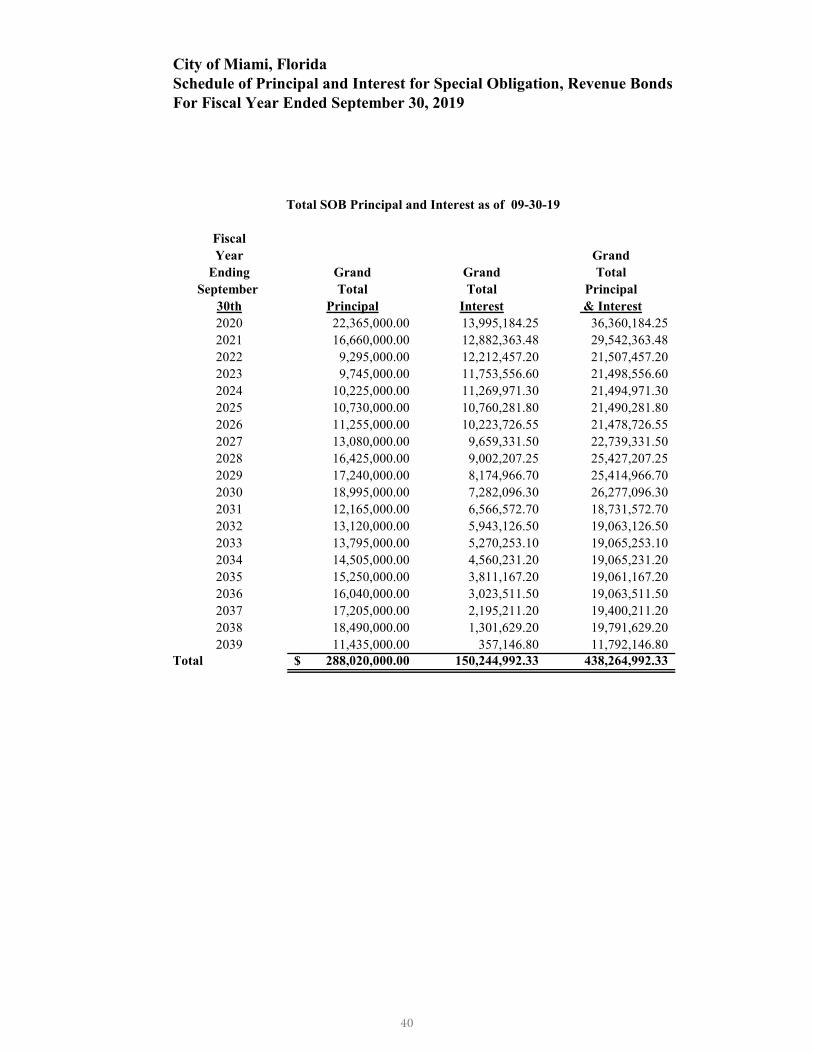
FiscalYear Grand
Ending Grand Grand TotalSeptember Total Total Principal
30th Principal Interest & Interest2020 22,365,000.00 13,995,184.25 36,360,184.25 2021 16,660,000.00 12,882,363.48 29,542,363.48 2022 9,295,000.00 12,212,457.20 21,507,457.20 2023 9,745,000.00 11,753,556.60 21,498,556.60 2024 10,225,000.00 11,269,971.30 21,494,971.30 2025 10,730,000.00 10,760,281.80 21,490,281.80 2026 11,255,000.00 10,223,726.55 21,478,726.55 2027 13,080,000.00 9,659,331.50 22,739,331.50 2028 16,425,000.00 9,002,207.25 25,427,207.25 2029 17,240,000.00 8,174,966.70 25,414,966.70 2030 18,995,000.00 7,282,096.30 26,277,096.30 2031 12,165,000.00 6,566,572.70 18,731,572.70 2032 13,120,000.00 5,943,126.50 19,063,126.50 2033 13,795,000.00 5,270,253.10 19,065,253.10 2034 14,505,000.00 4,560,231.20 19,065,231.20 2035 15,250,000.00 3,811,167.20 19,061,167.20 2036 16,040,000.00 3,023,511.50 19,063,511.50 2037 17,205,000.00 2,195,211.20 19,400,211.20 2038 18,490,000.00 1,301,629.20 19,791,629.20 2039 11,435,000.00 357,146.80 11,792,146.80
Total 288,020,000.00$ 150,244,992.33 438,264,992.33
Total SOB Principal and Interest as of 09-30-19
40
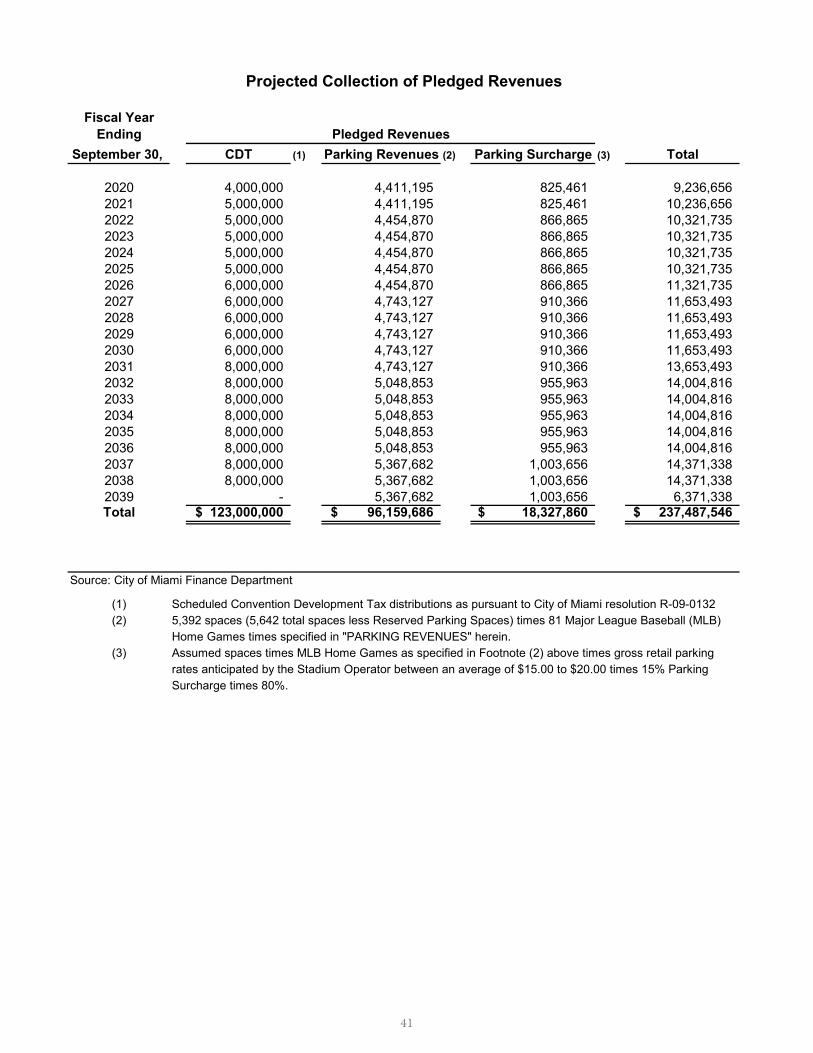
Fiscal YearEnding
September 30, CDT (1) Parking Revenues (2) Parking Surcharge (3) Total
2020 4,000,000 4,411,195 825,461 9,236,656 2021 5,000,000 4,411,195 825,461 10,236,656 2022 5,000,000 4,454,870 866,865 10,321,735 2023 5,000,000 4,454,870 866,865 10,321,735 2024 5,000,000 4,454,870 866,865 10,321,735 2025 5,000,000 4,454,870 866,865 10,321,735 2026 6,000,000 4,454,870 866,865 11,321,735 2027 6,000,000 4,743,127 910,366 11,653,493 2028 6,000,000 4,743,127 910,366 11,653,493 2029 6,000,000 4,743,127 910,366 11,653,493 2030 6,000,000 4,743,127 910,366 11,653,493 2031 8,000,000 4,743,127 910,366 13,653,493 2032 8,000,000 5,048,853 955,963 14,004,816 2033 8,000,000 5,048,853 955,963 14,004,816 2034 8,000,000 5,048,853 955,963 14,004,816 2035 8,000,000 5,048,853 955,963 14,004,816 2036 8,000,000 5,048,853 955,963 14,004,816 2037 8,000,000 5,367,682 1,003,656 14,371,338 2038 8,000,000 5,367,682 1,003,656 14,371,338 2039 - 5,367,682 1,003,656 6,371,338 Total 123,000,000$ 96,159,686$ 18,327,860$ 237,487,546$
Source: City of Miami Finance Department
(1) Scheduled Convention Development Tax distributions as pursuant to City of Miami resolution R-09-0132(2) 5,392 spaces (5,642 total spaces less Reserved Parking Spaces) times 81 Major League Baseball (MLB)
Home Games times specified in "PARKING REVENUES" herein.(3) Assumed spaces times MLB Home Games as specified in Footnote (2) above times gross retail parking
rates anticipated by the Stadium Operator between an average of $15.00 to $20.00 times 15% Parking Surcharge times 80%.
Pledged Revenues
Projected Collection of Pledged Revenues
41

Fiscal YearEnding
September 30, CDT (1) Parking Revenues (2) Parking Surcharge (3) Total
2020 4,000,000 4,411,195 825,461 9,236,656 2021 5,000,000 4,411,195 825,461 10,236,656 2022 5,000,000 4,454,870 866,865 10,321,735 2023 5,000,000 4,454,870 866,865 10,321,735 2024 5,000,000 4,454,870 866,865 10,321,735 2025 5,000,000 4,454,870 866,865 10,321,735 2026 6,000,000 4,454,870 866,865 11,321,735 2027 6,000,000 4,743,127 910,366 11,653,493 2028 6,000,000 4,743,127 910,366 11,653,493 2029 6,000,000 4,743,127 910,366 11,653,493 2030 6,000,000 4,743,127 910,366 11,653,493 2031 8,000,000 4,743,127 910,366 13,653,493 2032 8,000,000 5,048,853 955,963 14,004,816 2033 8,000,000 5,048,853 955,963 14,004,816 2034 8,000,000 5,048,853 955,963 14,004,816 2035 8,000,000 5,048,853 955,963 14,004,816 2036 8,000,000 5,048,853 955,963 14,004,816 2037 8,000,000 5,367,682 1,003,656 14,371,338 2038 8,000,000 5,367,682 1,003,656 14,371,338 2039 - 5,367,682 1,003,656 6,371,338 Total 123,000,000$ 96,159,686$ 18,327,860$ 237,487,546$
Source: City of Miami Finance Department
(1) Scheduled Convention Development Tax distributions as pursuant to City of Miami resolution R-09-0132(2) 5,392 spaces (5,642 total spaces less Reserved Parking Spaces) times 81 Major League Baseball (MLB)
Home Games times specified in "PARKING REVENUES" herein.(3) Assumed spaces times MLB Home Games as specified in Footnote (2) above times gross retail parking
rates anticipated by the Stadium Operator between an average of $15.00 to $20.00 times 15% Parking Surcharge times 80%.
Pledged Revenues
Projected Collection of Pledged Revenues
Fiscal YearEnding Total Total Total Principal
September 30, Principal Interest and Interest
2020 28,110,825 5,853,392 33,964,218 2021 23,870,298 4,759,858 28,630,156 2022 18,277,777 4,045,075 22,322,852 2023 16,544,665 3,535,651 20,080,316 2024 14,638,934 3,074,180 17,713,114 2025 13,175,263 2,643,712 15,818,974 2026 16,697,344 2,178,254 18,875,598 2027 12,193,104 1,708,040 13,901,144 2028 12,578,104 1,319,303 13,897,407 2029 12,978,104 915,769 13,893,873 2030 13,388,104 496,867 13,884,971 2031 9,523,104 169,340 9,692,444 2032 2,754,503 27,584 2,782,087 2033 - - - 2034 - - - 2035 - - - 2036 - - - 2037 - - - 2038 - - - 2039 1,708,865 - 1,708,865 Total 196,438,993$ 30,727,025$ 227,166,017$
Schedule of Principal and InterestFor Non-Ad Valorem Revenue Bonds
Budget and Appropriate
42

Fiscal YearEnding Taxable Gross Administration Net
September 30, Revenue Growth Rate Tax Rate Collections Fees Collections
2003 944,280,333 8.20% 3% 28,328,410 566,568 27,761,842 2004 1,102,877,633 16.80% 3% 33,086,329 661,727 32,424,602 2005 1,278,074,492 15.90% 3% 38,342,235 766,845 37,575,390 2006 1,410,500,066 10.30% 3% 42,315,002 846,300 41,468,702 2007 1,519,773,047 7.80% 3% 45,593,191 911,864 44,681,327 2008 1,597,469,115 5.10% 3% 47,924,073 958,481 46,965,592 2009 1,356,749,922 -13.40% 3% 41,533,161 830,663 40,702,498 2010 1,523,416,677 14.20% 3% 45,702,500 914,050 44,788,451 2011 1,756,668,584 23.10% 3% 52,700,058 1,054,001 51,646,056 2012 1,978,198,355 12.61% 3% 59,345,951 1,186,919 58,159,032 2013 2,174,117,214 9.90% 3% 65,223,516 1,304,470 63,919,046 2014 2,353,464,037 8.25% 3% 70,603,921 1,412,078 69,191,843 2015 2,568,459,592 9.14% 3% 77,053,788 1,541,076 75,512,712 2016 2,674,308,267 4.12% 3% 80,229,248 1,604,585 78,624,763 2017 2,659,465,396 -0.56% 3% 79,783,962 1,595,679 78,188,283 2018 3,010,666,391 13.21% 3% 90,319,992 1,806,400 88,513,592 2019 3,094,235,738 2.78% 3% 92,827,072 1,856,541 90,970,531
Source: Miami-Dade County Finance Department
Miami-Dade County, Florida3% Convention Development Tax
Historical- Unaudited Receipts
(1) (2) (3) (4) (5)Pension Unfunded PBO as
Net Assets Benefit Percentage ofAvailable for (1) Obligation (2) Unfunded PBO Annual Covered Covered Payroll
Benefits (PBO) Percent Funded (2)-(1) Payroll (4)/(5)Fiscal Year ($) ($) (%) ($) ($) (%)
2003 194.8 165.1 118% (29.7) 98.9 -30%2004 210.3 185.7 113% (24.7) 89.2 -28%2005 231.6 195.0 119% (36.6) 91.5 -40%2006 249.0 216.8 115% (32.2) 90.4 -36%2007 300.2 242.9 124% (57.3) 103.6 -55%2008 305.8 279.4 109% (26.4) 129.4 -20%2009 296.3 290.0 102% (6.3) 122.2 -5%2010 311.8 315.6 99% 3.8 80.2 5%2011 310.0 303.6 102% (6.4) 82.2 -8%2012 350.3 312.6 112% (37.7) 82.2 -46%2013 378.7 320.0 118% (58.7) 85.2 -69%2014 394.6 370.1 107% (24.5) 93.7 -26%2015 381.4 393.5 97% 12.1 106.3 11%2016 392.9 420.5 93% 27.6 133.1 21%2017 405.7 431.8 94% 26.1 141.5 18%2018 426.2 440.2 97% 14.0 148.9 9%
Source: City of Miami Fire Fighters' and Police Officers' Retirement Trust October 1, 2018 Actuarial Report prepared by the Nyhart Company, Inc.
(1) Excluding future City minimum contributions.(2) Excluding new increment, contingency reserves for future activities.
Benefits payable from the COLA accounts are computed in accordance with actuarially basedformula as defined in Section 40.204 of the City Code. Benefits are subject to reviews and modificationin accordance with such Code section, which provides that all other matters regarding the COLAaccounts shall be determined by negotiations between the City, FIPO Board of Trustees and the bargainingrepresentatives of the International Association of Fire Fighters (the "IAFF") and the Fraternal Orderof Police (the "FOP").
Historical Funding ProgressCola Fund
(in $ millions)
City of Miami Fire Fighter's and Police Officers' Retirement Trust
43

Fiscal YearEnding Taxable Gross Administration Net
September 30, Revenue Growth Rate Tax Rate Collections Fees Collections
2003 944,280,333 8.20% 3% 28,328,410 566,568 27,761,842 2004 1,102,877,633 16.80% 3% 33,086,329 661,727 32,424,602 2005 1,278,074,492 15.90% 3% 38,342,235 766,845 37,575,390 2006 1,410,500,066 10.30% 3% 42,315,002 846,300 41,468,702 2007 1,519,773,047 7.80% 3% 45,593,191 911,864 44,681,327 2008 1,597,469,115 5.10% 3% 47,924,073 958,481 46,965,592 2009 1,356,749,922 -13.40% 3% 41,533,161 830,663 40,702,498 2010 1,523,416,677 14.20% 3% 45,702,500 914,050 44,788,451 2011 1,756,668,584 23.10% 3% 52,700,058 1,054,001 51,646,056 2012 1,978,198,355 12.61% 3% 59,345,951 1,186,919 58,159,032 2013 2,174,117,214 9.90% 3% 65,223,516 1,304,470 63,919,046 2014 2,353,464,037 8.25% 3% 70,603,921 1,412,078 69,191,843 2015 2,568,459,592 9.14% 3% 77,053,788 1,541,076 75,512,712 2016 2,674,308,267 4.12% 3% 80,229,248 1,604,585 78,624,763 2017 2,659,465,396 -0.56% 3% 79,783,962 1,595,679 78,188,283 2018 3,010,666,391 13.21% 3% 90,319,992 1,806,400 88,513,592 2019 3,094,235,738 2.78% 3% 92,827,072 1,856,541 90,970,531
Source: Miami-Dade County Finance Department
Miami-Dade County, Florida3% Convention Development Tax
Historical- Unaudited Receipts
(1) (2) (3) (4) (5)Pension Unfunded PBO as
Net Assets Benefit Percentage ofAvailable for (1) Obligation (2) Unfunded PBO Annual Covered Covered Payroll
Benefits (PBO) Percent Funded (2)-(1) Payroll (4)/(5)Fiscal Year ($) ($) (%) ($) ($) (%)
2003 194.8 165.1 118% (29.7) 98.9 -30%2004 210.3 185.7 113% (24.7) 89.2 -28%2005 231.6 195.0 119% (36.6) 91.5 -40%2006 249.0 216.8 115% (32.2) 90.4 -36%2007 300.2 242.9 124% (57.3) 103.6 -55%2008 305.8 279.4 109% (26.4) 129.4 -20%2009 296.3 290.0 102% (6.3) 122.2 -5%2010 311.8 315.6 99% 3.8 80.2 5%2011 310.0 303.6 102% (6.4) 82.2 -8%2012 350.3 312.6 112% (37.7) 82.2 -46%2013 378.7 320.0 118% (58.7) 85.2 -69%2014 394.6 370.1 107% (24.5) 93.7 -26%2015 381.4 393.5 97% 12.1 106.3 11%2016 392.9 420.5 93% 27.6 133.1 21%2017 405.7 431.8 94% 26.1 141.5 18%2018 426.2 440.2 97% 14.0 148.9 9%
Source: City of Miami Fire Fighters' and Police Officers' Retirement Trust October 1, 2018 Actuarial Report prepared by the Nyhart Company, Inc.
(1) Excluding future City minimum contributions.(2) Excluding new increment, contingency reserves for future activities.
Benefits payable from the COLA accounts are computed in accordance with actuarially basedformula as defined in Section 40.204 of the City Code. Benefits are subject to reviews and modificationin accordance with such Code section, which provides that all other matters regarding the COLAaccounts shall be determined by negotiations between the City, FIPO Board of Trustees and the bargainingrepresentatives of the International Association of Fire Fighters (the "IAFF") and the Fraternal Orderof Police (the "FOP").
Historical Funding ProgressCola Fund
(in $ millions)
City of Miami Fire Fighter's and Police Officers' Retirement Trust
44

APPENDIX A GLOSSARY
Ad Valorem Tax: A tax calculated “according to the value “of property. Such a tax is levied on the assessed valuation of real and tangible personal property.
Appropriation: A legal authorization approved by the City Commission to make expenditures and incur obligation for specific purposes.
Bond: A written promise to pay a specific sum of money at a specified date or dates in the future, together with the periodic interest at a specific rate.
Bondholder: The registered owners, or their authorized representatives, of a Bond.
City: Shall mean the City of Miami, Florida. City
Commission: Shall mean The City Commission of the City or any successor commission, council, board or body in which the general legislative power of the City shall be vested.
City Manager: Shall mean the City Manager of the City or his or her designee or the officer succeeding to his or her principal functions.
Covenants: Pledges made by an issuer in regards to the operation of a project, system, or enterprise of the issuer. Such pledges are of interest to the bondholder as they assure that certain practices will be followed or avoided by the issuer.
Coverage: The margin of safety or payment of debt service, reflecting the number of times by which the annual revenues, either gross or net, exceed the annual debt service.
Debt Service Requirement: The amount of money required to pay the principal and interest of all bonds and other debt instrument according to a pre-determined payment schedule. Final maturity: The date upon which all principal and interest must be repaid.
Final maturity: The date upon which all principal and interest must be repaid.
45
APPENDIX A GLOSSARY
Fitch: Shall mean Fitch Ratings, Inc., a corporation organized and existing under the laws of the State of New York, that provide a rating service for corporate bonds, municipal bonds, commercial paper, and other debt obligations.
General Obligation Bond: Voter approve bonds used to finance a variety of capital improvement projects such as streets, buildings, and improvements. These bonds are backed by the full faith and credit of the issuing government. The repayment of these bonds is usually made from ad valorem taxes based on an approved debt millage rate.
Issuer: A legal entity that develops, registers and sells securities for the purpose of financing its operations. Issuers are legally responsible for the obligations of the issue and for reporting financial conditions, material developments and any other operational activities as required by the regulations of their jurisdictions. The most common types of securities issued are common and preferred stocks, bonds, notes, debentures, bills and derivatives.
Moody’s Investor Service: hall mean Moody’s Investor Service, Inc., a corporation organized and existing under the laws of the State of Delaware that provide a rating service for corporate bonds, municipal bonds, commercial paper, and other debt obligations.
Paying agent: An agent of the issuer with responsibility for timely payment of principal and interest to bond holders. Pledged revenues: Those revenues of an entity which are designated for the repayment of debt obligations.
Rating agencies: A nationally recognized agency that rate securities for safety of payment of principal, interest, or dividends at the request of the issuer.
Rating category: One of the generic rating categories of any nationally recognize security rating agency without regard to any refinement or graduation of such rating by a numerical modifier or otherwise.
Refunding: The retiring of a bond issue at the earliest call date or at maturity with fund from a new issue.
Reserve account: Established by the terms of a bond issue into which money is deposited for payment of debt service in case of a shortfall in current revenues. May take the form of a surety policy.
46

APPENDIX A GLOSSARY
Resolution:
A formal expression of opinion or intention made, usually after voting, by a formal organization, a legislature,
or other group.
Revenue Bond:
A bond secured by pledge source of revenue. Special Obligation Bonds: A bond secured by a limited revenue source
or promise to pay.
Standard & Poor’s:
Shall mean Standard & Poor’s Rating Service, a Division of Mcgraw-Hill Corporation Investor Service a corporation
organized and existing under the laws of the State of New York, that provide as an independent company rating service
for corporate bonds, municipal bonds, commercial paper, and other debt obligations according to risk profiles and
produces and tracks the S&P indexes.
Taxable bond:
Bonds on which the interest at the time of issuance is not intended to be excluded from the gross income of the
holders for federal tax purposes.
Tax exempt bond:
A municipal bond, the interest on which is exempt from Federal Income Tax.
Trustee:
A person or organization legally appointed to act on behalf of a beneficiary.
Underlying credit:
A rating for a debt issue on a stand-alone basis without credit enhancements.
47


www.miamigov.com twitter.com/miamifinance305
FISCAL YEAR ENDEDSeptember 30, 2019
CITY OF MIAMI,FLORIDASUPPLEMENTAL REPORTTO BONDHOLDERS