city of burnabycity+hall/financial+reports/2015+-+2019... · city of burnaby, british columbia, ......
TRANSCRIPT

City of BurnabyBritish Columbia, Canada2015–2019 Provisional Financial Plan


2015–2019
City of Burnaby, British Columbia, Canada
This document is produced by the Finance Department in collaboration with civic departments, offices and agencies.
The picture on the cover of the Financial Plan reflects the City’s three sustainability strategies (from left to right): Environmental Sustainability, Economic Sustainability and Social Sustainability.
MESSAGE FROM THE MAYOR 6
BURNABY AT A GLANCE 10
ORGANIZATION & STRUCTURE 20
FINANCIAL PLAN OVERVIEW 30CONTENTS

OPERATING PLAN 40Summary of Expenditures & Revenue 43
Provisions from General Revenue 44
City Council 46
General Government Services 48
Safety & Security Services 68
Engineering 72
Parks, Recreation & Cultural Services 78
Planning & Building 80
CAPITAL PLAN 82Capital Program Summary 90
City Manager 92
Engineering 94
Finance 96
Planning & Building 96
Parks, Recreation & Cultural Services 98
Pedestrian Bridge at Metrotown

6 Message from the Mayor
Message from the Mayor
On behalf of Burnaby City Council, I am pleased to present the 2015 Provisional Financial Plan.
Within our established sustainability framework and guided by our Official Community Plan, 2015 will be a year of exciting achievements for the City of Burnaby. The Provisional Financial Plan details many of those achievements and lays out Burnaby’s plans for ongoing municipal leadership that will ensure our City continues to offer exceptional services to its citizens and businesses.
With our award-winning Economic Development and Social Sustainability strategies in place and a robust Environmental Sustainability Strategy—developed in collaboration with hundreds of citizens, not-for-profit organizations, and business leaders—almost complete, Burnaby is poised to become an even more livable and welcoming community.
As the City grows, both the demands for services and the opportunities to provide them increase. As new programs and facilities are introduced, Burnaby City Council remains sharply focused on ensuring value to taxpayers. A new partnership between the School District and the City will triple the number of child care spaces in the City. Innovative policies often help us realize that goal. Costs for new assets are, for example, often completely eliminated by initiatives such as our Community Benefit Density Bonus Policy that sees private developers pay for City facilities in exchange for increased density in buildings they are constructing. This policy enables taxpayers to receive valuable community services—such as daycares and community centres—for no capital cost.
Priority projects include:
• A new performance and event centre in Metrotown Town Centre;• A new Brentwood Community Centre;• A new linear public park along Willingdon Avenue, linking Brentwood Town Centre to
Confederation Park;• A new arena in the Edmonds community; and• The replacement of the Cameron Recreation Centre, including the addition of a new
swimming pool, and the replacement of the Cameron Library in Lougheed Town Centre.

His Worship Mayor Derek Corrigan

UniverCity at Burnaby Mountain
Four quadrants of our City—Metrotown, Brentwood, Edmonds and Lougheed—will see significant transit-oriented development and rejuvenation, all of which continues to position Burnaby as a regional leader in creating sustainable transit-oriented development. Much more is planned for, as businesses and citizens continue to choose Burnaby as their preferred location. In 2014, building permit values are on track to meet 2013’s total, which reached an impressive $675 million. Focusing density in our town centres also allows us to keep 25% of our City as parkland and open space and to preserve our valued single-family neighbourhoods.
Metrotown, our Regional City Centre, has many innovative new developments being constructed, including those along the ‘Art Walk’ on Beresford Street between Dow and McKay Avenues. Once complete, the ‘Art Walk’ will be one of the largest concentrations of public art in the region and will provide a unique destination within our City.
Metrotown is also the location of two new amenities obtained through the Community Benefit Bonus Policy—the newly opened Metrotown Community Resource Centre, which provides 16,000 square feet of subsidized office and program space for Burnaby non-profit associations, and the 6,000 square feet Kingsway-Willingdon Community Resource Centre which we expect to open by the summer of 2015. The City, by negotiating and operating these amenities, helps local non-profits to provide needed services and programs to Burnaby residents.
Brentwood Town Centre Phase 1 redevelopment is well under way, including the new central civic plaza, which will be adjacent to the Brentwood SkyTrain station. This will be a vibrant community gathering place.
Lougheed Town Centre is also poised for change, with construction of the Evergreen rapid transit line now well under way. This line, which will connect Lougheed Town Centre to the Port Moody and Coquitlam town centres, will enable this area to become yet another vibrant, pedestrian-friendly, mixed-use, rapid-transit-centred community. Planning is now under way.

In the Edmonds Town Centre, where the community has embraced the new Edmonds Community Centre, the Southgate Neighbourhood Master Plan is poised to incorporate the City’s principles of sustainability directly into the creation of a new neighbourhood. Encompassing 48 acres in the heart of the town centre, the site is centred on a five-acre park that will be developed to ensure it is pedestrian and cyclist friendly. It will be another new Edmonds community focal point and community gathering place.
Our focus on efficiency, partnerships and innovation continues to ensure that the City’s fiscal position remains strong. Our investment portfolio is projected to return an annual yield of 4.2% in 2015. Sound investment practices have provided the City with steady income over the last decade, ensuring liquidity when needed and growth to help offset increases in our operating budget and providing funding for various capital projects. This work is a foundational pillar for reserves growth that support Burnaby projects and initiatives. As our City grows and new services are added, we never lose sight of the need to maximize efficiencies in all areas, guided by our community-driven sustainability framework. The City’s exemplary staff continue to be key to our ongoing success, as they work with citizens to ensure that local priorities are emphasized, community goals are achieved and nothing is wasted.
Burnaby’s planning framework is community-driven. We move forward as a City confident that we are focused on the goals that our citizens and businesses see as priorities. Along with all members of City Council, I look forward to continuing to partner with all who work to make Burnaby the world’s best City, to work toward the goals we have developed—and will achieve—together.
Mayor Derek Corrigan

10 Burnaby at a Glance
FROM 1892 TO 2015
Burnaby was incorporated in 1892 and achieved City status in 1992, one hundred years after incorporation. In the first 30 to 40 years after its incorporation, the growth of Burnaby was influenced by its location between expanding urban centres of Vancouver and New Westminster. It first served as a rural agricultural area supplying nearby markets. As Burnaby and the surrounding communities continued to grow, the character of Burnaby shifted from rural to suburban to urban. Today Burnaby is a dynamic urban community with four vibrant town centres, a civic centre, and many unique neighbourhoods with distinct characters.
98.6 SQUARE KILOMETRES
Burnaby occupies 98.6 square kilometres and is located at the geographic centre of Metro Vancouver. Situated between the City of Vancouver to the West and Port Moody, Coquitlam, and New Westminster to the East, the City is further bounded by Burrard Inlet to the North and the Fraser River to the South. The elevation of Burnaby ranges from sea level to a maximum of 1,200 feet (370 meters) atop Burnaby Mountain. Overall, the physical landscape of Burnaby is one of hills, ridges, valleys, and an alluvial plain. The land features and their relative locations have had an influence on the location, type, and form of development in the City.
POPULATION 233,700
While Burnaby occupies about 3% of the land area of Metro Vancouver, it accounted for about 9.6% of the Region’s population in 2011. It is the third most populated urban centre in British Columbia with a total population of 233,700 (BC Stats Estimate, January 2015).
Burnaby at a Glance

Burnaby skyline as seen from Deer Lake Park

12 Burnaby at a Glance
URBAN LANDSCAPE
Burnaby is a mature, increasingly integrated community. Burnaby captures significant shares of new high quality commercial, residential, and industrial development that generates employment and other economic benefits. Guided by the Official Community Plan and Regional Context Statement, the City now features high density residential areas, four major commercial town centre developments, rapid transit, high technology research and business parks, comprehensive industrial estates and major post-secondary institutions. Burnaby is an outstanding place to live, learn, work, invest and play. Burnaby offers a rapidly growing knowledge-based economy, culturally diverse and welcoming urban centres, all surrounded by some of the most beautiful natural settings and parks in Canada.
INDUSTRY & EMPLOYMENT
As per the Statistics Canada Census, Burnaby had an experienced labour force of 120,290 in 2011.
Burnaby has a strong and diversified local economy with clusters of companies in a range of signature industries. These include information technology, wireless, biotechnology, life science, film, news media, education, environmental technology/services, tourism, and professional services. Burnaby is home to companies such as Electronic Arts, PMC Sierra, Ballard Power Systems, Spectrum Signal Processing, and IBM.
Burnaby also has companies in stable industrial sectors such as light industry, warehousing/distribution, heavy industry, agriculture, and not-for-profits. Burnaby is also emerging as a major film industry centre and has more than 52% of the sound stages in the Lower Mainland.
A number of major employers are located in Burnaby including TELUS, Metro Vancouver, Simon Fraser University, and the British Columbia Institute of Technology.
HOUSING MIX
Burnaby has a full range of housing forms, including single family, duplex, townhouse, low-rise, and high-rise multi-family developments. Nearly 40% of the occupied housing stock is single and two-family dwellings, while low-rise and high-rise account for 27% and 22%, respectively. The number of residential units increased by 8,433 units from 2006 to 2011. The City recognizes housing as a key element in a sustainable complete community and the Official Community Plan identifies four goals specific to residential housing; to provide a varied range and choice of living opportunities within the City, to establish increased opportunities for ground-oriented housing, to maintain and improve neighbourhood livability and stability and to help meet the needs of people with special and affordable housing requirements. High density development is concentrated near transit hubs to provide easy access to transportation alternatives in four town centres.
COMMERCIAL AND RETAIL
Burnaby’s Metrotown is BC’s largest shopping destination with over 400 stores and services. Lougheed and Brentwood Town Centres, located in North Burnaby along the Millennium SkyTrain line, also provide a wide range of shops and services to serve the larger community. The Heights neighbourhood in North Burnaby offers more of a traditional street-front shopping atmosphere with a colourful mix of individually owned and operated shops, restaurants, cafés and services catering to residents and visitors. Edmonds Town centre continues its transformation and commercial rejuvenation. Big Bend in South Burnaby is emerging as a commercial and retail destination.

Metrotown Town Centre
Burnaby’s four town centres, one within each quadrant, offer a full range of housing and services. The town centres help to provide complete communities within each quadrant, providing residents with an option to walk, bike, take transit or drive to a local destination where they can access the mix of goods and services to meet their daily needs.

View from Burnaby Mountain Park

Burnaby at a Glance 15
EDUCATION AND HEALTH SERVICESThe City has two post-secondary institutions, Simon Fraser University and British Columbia Institute of Technology. Burnaby also has 41 elementary schools and 8 secondary schools with a total enrolment of 24,000 students. Burnaby Hospital is one of the region’s major health centres with 309 acute care beds and a variety of other patient care services.
PARKS AND OPEN SPACESParks and open spaces serve essential roles in the preservation of our natural environment and ecosystems, meeting community needs for recreation and leisure activities, and supporting the quality of life in Burnaby. As Burnaby’s population and urban areas continue to grow, parks and open spaces are increasingly valuable community assets. Currently, 25% of the City’s land area is devoted to green space. Parks and open spaces include neighbourhood and district parks, school playing fields, urban plazas and botanical gardens.
A past recipient of the Communities in Bloom Award for Canadian Communities, the City of Burnaby has received numerous awards for Metro Skate Park, including the International Olympic Committee (IOC)/International Association for Sports and Leisure Facilities (IAKS) Bronze Award in 2011. The City has also received the BC Recreation & Parks Association Excellence Award for the Mountain Air Bike Skills Park, as well as the BC Landscape Association Award of Excellence and the Canadian Parks Recreation Association Award of Excellence for Innovation for the City’s Eco-sculptures.
The City’s parks and open spaces offer kilometres of walking, hiking and cycling trails including:
• BC Parkway• Barnet Marine Park• Burnaby Fraser Foreshore Park• Burnaby Lake Regional Nature Park• Burnaby Mountain Conservation Area• Central Park• Central Valley Greenway• Deer Lake Park• Trans Canada Trail
GOLF COURSES
The City has two public golf courses—Burnaby Mountain Golf Course and Riverway Golf Course—along with two pitch and putt courses at Central Park and Kensington.
Golfers can enjoy Burnaby’s natural beauty and excellent public golf facilities in a park-like setting. The City’s golf infrastructure also includes driving ranges, golf learning centres, pro shops and clubhouses at both Burnaby Mountain and Riverway.
RECREATION FACILITIES
The City has a 28 recreation and leisure centres and many swimming pools, ice rinks and playing fields—including several artificial turf fields—throughout the City that offer a wide range of programs. Edmonds Community Centre, completed in June 2013, is the City’s newest addition with two pools, two full–sized gyms and complete fitness facilities featuring a 7,000 square foot weight room.
To build community and promote good health, Burnaby is home to four 55+ Centres and five Youth Centres. These centres are social, educational, and recreational hubs and great spots to meet new friends, take classes, and stay active.
In 2014, various recreational facilities were opened throughout the community including an outdoor fitness circuit in Central Park, and outdoor field and track at Burnaby Central Secondary, a playground and water play area at Confederation Park, and a plaza at Edmonds Community Centre.
The City’s Swangard Stadium is home to outdoor giant screen movie nights, Kabbadi tournaments, and celebrations such as the Fiji Festival, bringing people to the Stadium, along with traditional events like the 24-Hour Relay and the Harry Jerome Track Classic.
ARTS, HERITAGE AND CULTURE Burnaby has a number of arts, heritage and cultural facilities. The Burnaby Village Museum and Carousel is an open air museum depicting life in the early 20th Century that features a town street with shops, homes and costumed interpreters, a farmhouse, a blacksmith, and the CW Parker Carousel. Admission to the Burnaby Village Museum is free to the public.

16 Burnaby at a Glance
The Shadbolt Centre for the Arts is the City’s 47,000 square foot multi-purpose community arts facility, which houses studios for dance, visual arts, ceramics, music, media arts, and theatre classes. The Shadbolt Centre also hosts performances, recitals, and exhibitions throughout the year and is the support centre for Deer Lake Park.
Deer Lake Park is home to Burnaby’s signature music event, the Burnaby Blues and Roots Festival, and many free festivals such as the Rhododendron Festival and Symphony in the Park. Deer Lake Park’s spectacular setting and technical infrastructure support a regular concert series that has included Jack Johnson, The Lumineers, The White Stripes, and local superstar Michael Bublé.
The Burnaby Art Gallery is dedicated to presenting contemporary and historical art exhibits and events by local, regional, national and international artists in the galleries of Ceperley Mansion. The gallery facilitates the development of emerging artists and provides diverse art educational programming for children, adults and seniors as well as community projects and exhibitions in schools, libraries and recreation centres. Gallery staff manages the City of Burnaby Permanent Art Collection and a rapidly expanding Public Art Program.
The Community Arts Development Program began in 2000 and has supported over two hundred unique arts engagement projects. The program partners with Burnaby-based community groups, organizations, and local schools to create creative projects through community development around a shared concern, success or dream. Additional arts opportunities are available in the City’s Community Centres.
The City of Burnaby Archives opened in 2001 and is located in the McGill Branch Library. It operates as the official repository for civic records of permanent administrative, legal, fiscal, historical, evidential, and informational value to the City of Burnaby. The Burnaby Archives houses records dating back to Burnaby’s incorporation in 1892 including documents, photographs, and maps. Public outreach programs bring history to life.
LIBRARIES Burnaby Public Library was established by municipal bylaw on December 20, 1954 and opened its doors to the public on September 24, 1956. Today, the library serves the community from four branches and offers a mobile service for residents who are homebound or have a visual impairment. The Bob Prittie Metrotown Branch, opened in 1991, is considered the central branch. The Home Library Service operates out of this branch. The Cameron Branch, opened in 1980, serves the Lougheed Town Centre and is located in the Cameron Recreation Complex. The McGill Branch, redeveloped in 2001, serves the Brentwood Town Centre and houses the City of Burnaby Archives. Burnaby’s newest branch, the Tommy Douglas Library, opened in 2009 and serves the Edmonds Town Centre.
Patrons consistently give the library high marks for its rich and diverse collections. The library’s electronic services and collections demonstrate its ability to respond to the rapid changes in technology and this community’s growing demand for electronic resources. Librarians offer high quality programs that reflect this library’s commitment to promoting the love of reading and the joy of lifelong learning to children and their families, teens and adults. Library patrons have also been clear about how much they value the caring, expert help they receive from Library staff. They appreciate that a live person answers the library’s phones and that they have access to a clerk or librarian when they need one, whether it’s help with borrowing or returning an item, finding information, using computer workstations, or offering suggestions for the next “good read”.
Guided by a board of citizen volunteers appointed by City Council, the library is an integral part of the services offered to Burnaby residents. These dedicated volunteers work to ensure that the library supports the City’s goals for Burnaby and contributes to making Burnaby a great place to live, work, learn and play.

Edmonds Community Centre
In Burnaby, there are leisure-time activities for all ages, interests and skill levels. A wide array of opportunities to learn something new, socialize with other like-minded individuals, or get fit and stay fit. Take advantage of the many opportunities offered at the wonderful, well-equipped facilities and parks located throughout the city.

120,290
41 8
M E T R O T O W NB R E N T W O O DL O U G H E E DE D M O N D S
NATURAL FEATURE PARKSCONSERVATION AREASRAVINE PARKSNEIGHBOURHOOD PARKSDISTRICT PARKSLINEAR PARKS
COMMUNITY CENTRESSENIOR CENTRESYOUTH CENTRESINDOOR & OUTDOOR POOLSSPORTS & FITNESS FACILITIESRESOURCE CENTRESCOMMUNITY HALLS
68
15921320
Bob Prittie Metrotown, Cameron, McGill and Tommy Douglas
EXPERIENCED WORKERS
ELEMENTARYSCHOOLS
SECONDARYSCHOOLS
AND WE ARE DEBT FREE
TRANSIT-ORIENTED, HIGH DENSITY AND MIXED USE TOWN CENTRES IN EVERY QUADRANT OF THE CITY
ECONOMY
RECREATION & FEATURES
BURNABY AT A GLANCE
Burnaby incorporated
Burnaby Hospital opens
Burnaby achives City status
100th anniversary
1892 2015
Telus, Metro Vancouver, Simon Fraser University, Electronic Arts, PMC, IBM, British Columbia Institute of Technology and more
HOME TO MAJOR EMPLOYERS
1992
27RECREATION &COMMUNITY CENTRES
}
}
}
4 TOWN CENTRES
DIVERSE LOCALECONOMY
} }
158PARKS
*
4 LIBRARIES + MOBILE SERVICES
4 CULTURAL FACILITIES
2
2 GOLFCOURSES2 PITCH & PUTTS
AND
POST-SECONDARYINSTITUTIONS
1952
Population reaches 100,000
Population reaches 234,600
1961 2011
*158 includes the number of parks, golf courses and pitch and putts.

N
BURNABY AT A GLANCE
LIBRARY
TOWN CENTRE
PARK
BURNABY CITY HALL
CULTURAL FACILITY
RECREATION & COMMUNITY CENTRE
POST-SECONDARY INSTITUTION
BRENTWOOD TOWN CENTRE
SUMMIT YOUTH CENTREEILEEN DAILLY LEISURE
& FITNESS CENTRECONFEDERATION
COMMUNITY CENTRE
MCGILL LIBRARY& CITY ARCHIVES CAPITOL
HILL HALLLOCHDALE HALL
KENSINGTON OUTDOOR POOL
KENSINGTON COMPLEX
SIMON FRASERUNIVERSITY
BURNABY MOUNTAINBIKE SKILLS FACILITYBURNABY MOUNTAIN
CONSERVATION AREA
BARNET MARINE PARK
BURNABY MOUNTAIN
GOLF COURSE
WILLINGDONCOMMUNITYCENTRE
BRITISH COLUMBIAINSTITUTE OF TECHNOLOGY
BURNABY CITY HALL BURNABY LAKE
REGIONAL PARK
DEERLAKE PARK
BURNABY VILLAGE MUSEUMBURNABY ART GALLERYBURNABY ARTS COUNCILSHADBOLT CENTRE FOR THE ARTS
RIVERWAY GOLF COURSE
BURNABY FRASERFORESHORE PARK
METROTOWNTOWN CENTRE
KRIB YOUTHCENTRE
EDMONDS TOWN CENTRE
BONSORRECREATION
COMPLEX
SOUTH CENTRALYOUTH CENTRE
LOUGHEEDTOWN CENTRE
BOB PRITTIEMETROTOWNLIBRARY
WESBURN COMMUNITYCENTRE
SWANGARD STADIUM
CENTRAL PARK OUTDOOR POOL
CAMERON RECREATIONCOMPLEX & LIBRARY
CREEKSIDE YOUTH CENTRE
BILL COPELAND SPORTS CENTRE CHARLES
RUMMEL CENTRE
FOREST GROVE RECREATION OFFICE
CG BROWN MEMORIAL POOL
BURNABY LAKEPAVILION
EDMONDS COMMUNITYCENTRE
EDMONDS RESOURCE CENTRE
ROBERT BURNABY PARK OUTDOOR POOL
ALAN EMMOTTCENTRE
McPHERSONOUTDOOR POOL
CENTRALPARK
PITCH & PUTT
PITCH & PUTT
TOMMY DOUGLASLIBRARY
98.6 km2
1,200' maximum elevation
233,700citizens
RICHM
ON
D
NEW WESTMINSTER

20 Organization & Structure
CITY COUNCILMayor Derek CorriganCouncillor Sav DhaliwalCouncillor Dan JohnstonCouncillor Paul McDonellCouncillor Pietro CalendinoCouncillor Colleen JordanCouncillor Anne KangCouncillor Nick VolkowCouncillor James Wang
EXECUTIVE BODIES
Board of VarianceParks, Recreation & Culture CommissionPublic Library Board
DEPARTMENTS
City ManagerEngineering FinancePlanning & BuildingParks, Recreation & Cultural Services
Organization & Structure

Burnaby City Hall

COUNCIL MEMBERSMayor D. Corrigan
COUNCILLORSP. Calendino | S. Dhaliwal | D. Johnston | C. Jordan
A. Kang | P. McDonell | N. Volkow | J. Wang
ADVISORY BODIESAPPOINTED BY COUNCIL
MANAGER’S OFFICE
CITY MANAGER* R. Moncur
EXECUTIVE BODIES APPOINTED BY COUNCIL
Audit Committee
Community Heritage
Commission
Environment Committee
Executive Committee of
Council
Financial Management Committee
International Relations & Friendship
Cities Committee
Planning and Development
Committee
Public Safety Committee
Simon Fraser Liaison
Committee
Social Planning Committee
Traffic Safety Committee
Transportation Committee
Board of Variance
Parks, Recreation & Culture Commission
Public Library Board
DIRECTORENGINEERING
* L. Gous
DIRECTOR PARKS,
RECREATION & CULTURAL
SERVICES
* D. Ellenwood
Assistant Director Engineering Asset
ManagementJ. Helmus
Assistant Director Development
Services & Infrastructure
PlanningL. Bjorseth
Assistant Director Engineering
Environmental Services
D. Dattani
Assistant Director Engineering Facilities
ManagementT. Ng
Assistant Director Traffic & Parking
ManagementD. Louie
Deputy DirectorB. Klimek
Assistant Director Revenue Services
R. Rowley
Assistant Director Financial Planning &
Capital EquityN. Kassam
Chief Licence InspectorD. Layng
Purchasing ManagerG. Caron
Manager – Risk, Insurance & Claims
M. Fitz-Gerald
Senior Internal AuditorF. Lee
Assistant Director Long Range Planning
L. Garnett
Assistant Director Current Planning
E. Kozak
Chief Building Inspector
P. Shek
City Clerk (Acting)D. Back
City SolicitorB. Rose
Administrator Citizen Support ServicesA. Waller
Mayor’s Administration
Chief Information Officer
S. Wallace
Human Resources Director
P. Tennant
Assistant Director Human Resources
S. Smith
Assistant Director Recreation
C. Collis
Assistant Director Cultural Services
D. Nokony
Assistant Director Golf Operations
D. O’Connor
Assistant Director Parks
D. Hunter
Manager Business OperationsD. Pelletier
Manager Community Marketing & Sponsorship
M. Ishikawa
Manager Cultural Services, Development
& PromotionK. Basi
* Members of the Management Committee
This organization chart shows reporting relationships only and does not necessarily reflect levels of responsibility
DEPUTY CITY MANAGER
* L. Chu
DIRECTORFINANCE
* D. Jorgenson
DIRECTORPLANNING &
BUILDING
* L. Pelletier
OIC RCMP
* D. Critchley
CHIEF LIBRARIAN
* E. Toner-Rogala
FIRE CHIEF
* D. McDonald
CITIZENS OF BURNABY
Deputy Chief Librarian &
Bob Prittie Metrotown Branch Manager
D. Thomas
Deputy DirectorIT Program Delivery
J. Kaim
Deputy DirectorIT Business Solutions &
SupportG. Aubuchon
Deputy DirectorIT Infrastructure
D. Broder
DEPUTY CITY MANAGER
* C. Turpin
Burnaby City Hall building

Organization & Structure 23
CITY COUNCIL
Standing (left to right): Councillor Nick Volkow, Councillor Paul McDonell, Mayor Derek Corrigan, Councillor Dan Johnston and Councillor James Wang; Seated (left to right): Councillor Pietro Calendino, Councillor Colleen Jordan, Councillor Anne Kang and Councillor Sav Dhaliwal
The Mayor and Council are elected by the residents of Burnaby and are responsible for providing municipal government services. The Mayor is the head and chief executive officer of the City. The Council is the governing body of the City, and is responsible for seeing that City resources are used for the benefit and protection of its citizens.
City Council receives advice and recommendations from its various appointed Boards, Committees, and Commissions and these advisory bodies are identified in the City’s Organizational Chart.
Executive bodies, also appointed by Council, make decisions within guidelines provided by Council and include:
Board of Variance: Legislated under the Local Government Act of British Columbia, is accountable for approving requests for minor variances to the Burnaby Zoning Bylaw regarding the site, size and dimensions of buildings, but not those involving land use or density. Appeals to the decisions of the Board must be directed through the Provincial Court.
Parks, Recreation & Culture Commission: Accountable for development, maintenance and operation of all parks, golf courses and recreation programs for the City of Burnaby.
Public Library Board: Accountable for the operations of Burnaby libraries.

24 Organization & Structure
GENERAL GOVERNMENT SERVICES
City Manager’s Office The City Manager is the Chief Administrative Officer for the City and makes recommendations to Council on a broad range of policy and administrative issues. The City Manager’s Office directs and provides leadership to the operations of the City and is responsible for implementing City policies.
City Clerk The City Clerk’s Division is the keeper and manager of the official City records. The division provides administrative support to Council and its various Boards, Committees and Commissions as well as assisting the general public with information relating to City Hall and City Council.
Legal Services The Legal Services Division is responsible for coordinating and drafting bylaws, contracts, and providing legal advice on City matters. The division also manages legal proceedings involving the City, and is responsible for City land acquisitions and sales.
Citizen Support Services The Citizen Support Services Division is responsible for recruiting and managing volunteers who volunteer in programs, such as the Better At Home program, that help improve the quality of life for seniors and persons with disabilities by keeping them socially connected and maintaining their independence to live at home.
Human Resources The Human Resources Department supports all levels of City staff to work towards positive outcomes in the interest of the City of Burnaby. This may include creating new strategic and innovative programs based on the needs or recommendations of City employees. The services offered are employee and labour relations, recruitment, compensation and benefits, training and organizational development, wellness, disability management, occupational health and safety and human resource information services.
Information Technology The Information Technology Department manages the City’s core technology infrastructure including servers and storage, communication devices and networks, data centre facilities, desktop workstations, and printers, Helpdesk services and technical support, and also ensures that this technology constantly evolves to meet changing business needs. In addition, the department provides business application support and services, manages website content and services, conducts quality assurance and testing, delivers user training and support and is responsible for IT security policies and compliance.

Organization & Structure 25
Finance The Finance Department provides financial leadership to the City through financial management policies and practices that form a control framework for the City’s overall fiscal planning, investment and management of City assets. Financial accountability is achieved through budgeting, accounting, reporting, monitoring, controlling and auditing programs and systems managed by the department.
Annual Five-Year Financial Plans and Annual Reports that include the Year-End Financial Statements provide key financial information to taxpayers, residents, business leaders and other interested parties. This information helps to inform citizens of the financial performance of City programs and services authorized by Council.
The strength of the City’s financial position is reinforced by financial practices that have produced a debt free City with strong reserves. These reserves support the replacement of the City’s capital infrastructure and the
maintenance of stable, conservative property taxes that help ensure the continued financial sustainability of the City’s services and programs while encouraging continued economic development. Financial services support the business operations of all City departments in delivering City programs and financial guidance and advice is provided corporately to help ensure fiscal management.
The Finance Department also includes Emergency and Risk Management Programs. The Emergency Management Program is responsible for coordinating the City’s systems and processes for mitigating against, preparing for, responding to and recovering from emergencies and disasters through strategic emergency planning, training and exercises, and community outreach for a disaster resilient community.
Library Services With four branches conveniently located throughout the City, Burnaby Public Library (BPL) provides access to a rich array of the world’s stories, ideas and information. BPL provides resources in a variety of formats as well as electronic access to a number of sources. Through public programming, collections, public computing and Wi-Fi network, and staff, BPL continues to support lifelong learning and literacy. BPL’s branches are important public spaces, meeting places and centres for discovery and dialogue.
Burnaby City Hall

26 Organization & Structure Burnaby’s Fire Department hard at work
SAFETY AND SECURITY SERVICES
Fire The Burnaby Fire Department is responsible for ensuring the protection of life and property and the safety and well-being of the citizens of Burnaby.
This includes comprehensive fire prevention, enforcement and education, fire suppression, hazardous materials and technical rescue services both on land and water, as well as providing a high level of first response emergency medical care.
The Burnaby Fire Department takes great pride in serving the citizens of Burnaby and is proud to carry on this tradition.
Police The Police Department is responsible for working with citizens, preventing crime and maintaining order in accordance with Federal and Provincial laws. The City also funds Integrated Regional Units for Homicide, Emergency Response, Forensic Identification, Dog Services, and Traffic Reconstructionists.

Organization & Structure 27
ENGINEERINGThe Engineering Department is responsible for the operation and delivery of City’s engineering services. These services include: construction and maintenance of the road, waterworks, sanitary sewer, and storm drainage systems, snow removal on streets, maintenance of City buildings including fire halls, libraries, community centres, and City Hall, provision of garbage and recycling collection programs, operation and maintenance of traffic signals and street lights, parking management, enforcement of the City’s environmental regulations, and administration of the City’s local area service programs.
Burnaby’s Recyling Eco-Centre

28 Organization & Structure
PARKS, RECREATION & CULTURAL SERVICES
The Parks, Recreation and Cultural Services Department is responsible for three major areas: the provision and maintenance of park space; the provision, maintenance and programming of recreation facilities; and the provision, maintenance and programming of fine arts and cultural facilities.
The department is also responsible for maintenance and programming of golf courses, as well as food service operations found in recreation, golf, and cultural facilities.
As the City evolves and needs change, the Parks, Recreation and Cultural Services Department remains dedicated to ensuring that Burnaby’s parks, facilities, programs and services continue to be a benchmark for the rest of the country. The goal is to create a community that provides its citizens with opportunities for an active and healthy lifestyle.
Barnet Marine Park Shoreline

Organization & Structure 29
PLANNING & BUILDING
The Planning and Building Department is responsible for the City’s planning and development process through three divisions.
The Long Range Planning Division is responsible for the development and administration of Burnaby’s Official Community Plan (OCP), which outlines the City’s planning goals and objectives. This division also provides professional and technical advice through the Director to Council and Committees on City lands, land use, housing, environmental, transportation, heritage, social and economic policies, and regional planning matters; and maintains the City’s mapping systems and data related to land use planning.
The Current Planning Division provides for professional and technical advice through processing and approval of development applications including subdivision, road closure, preliminary plan approval, siting approval and rezoning.
The Building Division ensures that all new development and building construction in the City is in compliance with the zoning bylaw, safety codes and municipal bylaws, in addition to coordination of major civic building projects.
Artist’s rendering of Metrotown towers

30 Financial Plan Overview
OVERVIEWThe City’s planning process for preparation of the Annual Financial Plan begins each year with the determination of non-discretionary expenditures and revenue adjustments, and the submission of departmental estimates of anticipated changes in programs and services for the next five years.
This process results in a Provisional Financial Plan which is received by Council at an open meeting in December, or in an election year, in the first month of the new year. This interim discussion document is used by Council and offered to the public for comment. Once input is received and considered, City departments provide revised revenue and expenditure forecasts and complete the five-year Financial Plan.
The 2015 estimates are based on available information at the time this Financial Plan was prepared. The projections for 2016 to 2019 indicate future expenditure and revenue requirements for the City and are provided at a summary level. As future years’ estimates are based on current assumptions, these estimates may be increasingly less accurate, but are an indication of priorities and will be updated annually.
In compliance with Section 165 of the Community Charter, the City’s five-year Financial Plan must be balanced. The total of proposed expenditures and transfers to other funds for each year must not exceed the total of proposed revenue and transfers from other funds for the year. The budget of a private-sector business is essentially a managerial tool. However, the budget of a City has the force of law and is a key component of compliance in the public sector. Budget comparisons are required to be presented in conjunction with the City’s financial statements, and authority to spend is provided exclusively through the budget adopted by Council. The budget aligns spending with Council and community priorities to provide valued services and programs.
Financial Plan Overview

Burnaby View of Lougheed Station and Area
The focus of City fiscal management is effective delivery of services and stewardship of City assets. The City’s budget identifies the source and use of operating funds and capital funds in their respective programs. Five-year estimates are presented and taken into consideration program and service delivery enhancements to meet increased demands for City services. The Library Board and the Parks, Recreation and Culture Commission have approved their respective budgets as they appear in this document.
The 2015 Provisional Financial Plan includes projected expenditures and revenues and capital investment. The City’s Operating Plan and Capital Plan constitute the Provisional Financial Plan. The Operating Plan presents the annual cost of providing services and programs to Burnaby citizens. It includes contributions to the capital fund that recognize the use of assets in the provision of City services and the requirement to set aside funds for their replacement. The Capital Plan presents the City’s costs of purchasing, constructing, improving, and replacing City infrastructure including buildings, roads, sewer and water lines, equipment, and vehicles.

32 Financial Plan Overview
1A MORE COMPLETE COMMUNITY
The City strives to strike a balance between its residents by providing support for affordable housing and a range of housing types, providing community services and facilities, providing transportation services to commercial, educational and other activity centres as well as by supporting increased opportunities to work closer to home. All characteristics of what makes a great and complete community.
2AN ENVIRONMENTALLY AWARE COMMUNITY
Recognizing the links between the long-term health of our natural environment, the economy, and community livability, the City incorporates environmental considerations in land use plans, transportation plans, and development proposals. The City preserves and enhances ecological systems and provides, maintains and protects parks and green space.
3A COMMUNITY OF ECONOMIC OPPORTUNITY
To help the economy to continue to grow and diversify, the City is adapting to changing business needs, ensuring industrial and commercial development opportunities to attract high quality, employment-intensive industries, and encouraging the continued operation and enhancement of existing businesses.
ORGANIZATIONAL OBJECTIVESBurnaby Council establishes priorities, allocates resources, and delivers programs that meet the needs and aspirations of the citizens of Burnaby and Burnaby’s role in an integrated region. The 2015–2019 Financial Plan identifies the financial resources required to provide the leadership, support, and delivery of programs and services to achieve the goals and priorities identified in the Official Community Plan (OCP) and further expanded upon in the City’s sustainability documents.
The OCP is a comprehensive document that provides direction for the management of growth in the City. The OCP contains six major goals for the City, provides direction and serves as a policy framework which defines the land use and growth management approach to be followed.

Financial Plan Overview 33
4A COMMUNITY WITH INCREASED TRANSPORTATION CHOICE
Burnaby and its regional partners are reducing the dependency on the automobile and increasing the use of transit and high occupancy vehicles. The City ensures land use and development support increased transit use and promote cycling and walking.
5AN INVOLVED COMMUNITY
An involved community leads to a better understanding of local issues and shared values. The City builds participation through active community consultation, an extensive committee system, and its use of citizen based advisory committees.
6A COMMUNITY WITHIN A LIVABLE REGION
The City plays an active role in regional governance to facilitate orderly growth and the increased integration of the Metro Vancouver Region consistent with shared goals. Through cooperative and coordinated growth management, the Region as a whole will continue to prosper.
As a complement to the OCP, the City of Burnaby has also produced social and economic sustainability strategies and will complete the environmental sustainability strategy in 2015. Together, the three sustainability strategies, developed through extensive public consultation, reflect the values and aspirations of the citizens of Burnaby and set goals and objectives for the City of Burnaby, establish priorities, and identify strategies to address challenges. The objectives as set out in the OCP and sustainability documents guide the generation of the Financial Plan. These documents are available on the City website at www.burnaby.ca.

2015$
2016$
2017$
2018$
2019$
EXPENDITURES
City Council 2,781,600 2,479,800 2,498,400 2,517,400 2,536,700 City Manager 130,224,500 132,758,500 135,988,200 138,688,000 141,381,100
Administrative Services 7,872,900 7,832,800 8,155,900 8,481,500 8,809,600 Fire 36,304,600 37,127,200 38,057,300 39,010,300 40,001,800 Police 55,699,600 56,433,100 57,124,100 57,834,300 58,564,100 Library 12,958,500 13,034,400 13,268,300 13,469,400 13,725,600 Information Technology 17,388,900 18,331,000 19,382,600 19,892,500 20,280,000
Engineering 163,574,200 167,137,600 172,354,500 176,020,500 180,006,600Engineering 75,057,800 77,120,600 79,472,100 80,450,300 81,202,400 Utilities 88,516,400 90,017,000 92,882,400 95,570,200 98,804,200
Finance 20,908,100 20,436,300 20,697,300 20,962,500 21,232,900 Planning & Building 13,387,500 13,801,800 14,215,900 14,544,900 14,798,900 Parks, Recreation & Cultural Services 76,878,700 77,434,600 78,974,900 80,362,000 81,811,700 Fiscal Items 16,374,900 19,838,300 23,651,700 27,565,400 31,579,300
TOTAL EXPENDITURES 424,129,500 433,886,900 448,380,900 460,660,700 473,347,200
REVENUECity Council (332,500) (12,500) (12,500) (12,500) (12,500) City Manager (6,453,900) (5,947,500) (5,938,300) (5,979,000) (5,929,000)
Administrative Services (795,900) (410,200) (410,200) (410,200) (410,200) Fire (242,600) (157,600) (157,600) (157,600) (157,600) Police (3,891,000) (3,972,500) (4,013,300) (4,054,000) (4,054,000) Library (1,524,400) (1,407,200) (1,357,200) (1,357,200) (1,307,200) Information Technology - - - - -
Engineering (106,771,900) (107,857,500) (111,202,900) (114,140,700) (117,374,700)Engineering (18,255,500) (17,840,500) (18,320,500) (18,570,500) (18,570,500) Utilities (88,516,400) (90,017,000) (92,882,400) (95,570,200) (98,804,200)
Finance (13,661,100) (12,850,600) (12,854,600) (12,858,600) (12,862,600) Planning & Building (8,746,000) (9,011,000) (9,311,000) (9,611,000) (9,761,000) Parks, Recreation & Cultural Services (28,955,900) (28,013,900) (28,053,900) (28,093,900) (28,133,900) Fiscal Items (27,305,900) (27,017,700) (27,017,700) (27,017,700) (27,017,700)
TOTAL DEPARTMENTAL & FISCAL REVENUE (192,227,100) (190,710,700) (194,390,900) (197,713,400) (201,091,400)
Tax Levies For City Services (231,902,400) (243,176,200) (253,990,000) (262,947,300) (272,255,800)
TOTAL REVENUE (424,129,500) (433,886,900) (448,380,900) (460,660,700) (473,347,200)
34 Financial Plan Overview
FIVE YEAR OPERATING SUMMARY
The five-year Operating Plan provides the City with the expenditure authority and funding required to maintain a high level of service to its citizens while factoring in non-discretionary inflationary increases to costs. Funding for the operating budget comes from numerous sources including program and service revenues such as patron charges for the use of swimming pools, golf courses and recreation centres, revenue from property taxes, levies for water and sewer, and building permit and development fees. Details of the Operating Plan can be found on page 40.

(7,179,400)
Tab "ERS Report"
FIVE YEAR OPERATING TAX DRAW PROVISION FROM GENERAL REVENUE TO DEPARTMENTS
2015$
2016$
2017$
2018$
2019$
001,944,2licnuoC ytiC 2,467,300 2,485,900 2,504,900 2,524,200 006,077,321reganaM ytiC 126,811,000 130,049,900 132,709,000 135,452,100000,770,7secivreS evitartsinimdA 7,422,600 7,745,700 8,071,300 8,399,400 000,260,63tnemtrapeD eriF 36,969,600 37,899,700 38,852,700 39,844,200 006,808,15eciloP 52,460,600 53,110,800 53,780,300 54,510,100 001,434,11yrarbiL 11,627,200 11,911,100 12,112,200 12,418,400 009,883,71ygolonhceT noitamrofnI 18,331,000 19,382,600 19,892,500 20,280,000 003,208,65gnireenignE 59,280,100 61,151,600 61,879,800 62,631,900 000,742,7ecnaniF 7,585,700 7,842,700 8,103,900 8,370,300 005,146,4gnidliuB dna gninnalP 4,790,800 4,904,900 4,933,900 5,037,900
Parks, Recreation and Cultural Services 47,922,800 49,420,700 50,921,000 52,268,100 53,677,800 )009,039,01( smetI lacsiF (3,366,000) 547,700 4,561,600
TAX LEVIES FOR CITY SERVICES 231,902,400 243,176,200 253,990,000 262,947,300 272,255,800
Financial Plan Overview 35
FIVE YEAR PROVISION FROM GENERAL REVENUE
The following table provides a five-year summary of the projected tax levy revenue required to fund City services. The Waterworks and Sewer utilities are self-supporting programs funded separately from property taxes, therefore they have no impact on the tax levy.

(2,247,000)
(8,035,700)
(243,138,200)
(433,886,900)
1,478,300 (190,748,700)
(11,235,700)
2015 - 2019 FIVE YEAR TAX LEVY ESTIMATES
GENERAL REVENUE FUND 2015
$ 2016
$ 2017
$ 2018
$ 2019
$
005,307,414serutidnepxE raeY roirP 424,129,500 433,886,900 448,380,900 460,660,700Additional Costs - - - - -
Transfer to Reserves & Capital Funds (4,043,800) - - - -Depreciation Expense 3,100,000 3,200,000 3,300,000 3,400,000 3,500,000Personnel Costs 4,347,500 3,988,300 4,062,500 4,138,300 4,215,800RCMP Contract & Integrated Teams 500,000 515,000 530,400 546,400 562,800Programs, Services & Utilities 5,522,300 2,054,100 6,601,100 4,195,100 4,407,900
000,624,9stsoC lanoitiddA latoT 9,757,400 14,494,000 12,279,800 12,686,500005,921,424SERUTIDNEPXE LATOT 433,886,900 448,380,900 460,660,700 473,347,200
)002,225,291(euneveR raeY roirP (192,227,000) (190,748,700) (194,428,900) (197,751,500)Additional Revenue
003,374,4sdnuF rehtO & noitazilibatS 3,725,300 - - -Programs, Services & Utilities (4,178,200) (3,680,200) (3,322,600) (3,377,700)
002,592euneveR lanoitiddA latoT (3,680,200) (3,322,600) (3,377,700))000,722,291(EUNEVER REHTO LATOT (194,428,900) (197,751,500) (201,129,200)
)007,715,312(yveL xaT raeY roirP (231,902,500) (243,138,200) (253,952,000) (262,909,200)New Levy
)000,001,3(htworG weN morF sexaT (3,200,000) (3,300,000) (3,400,000) (3,500,000))009,482,51(esaercnI etaR sexaT (7,513,800) (5,557,200) (5,808,800))008,483,81(yveL xaT weN latoT (10,813,800) (8,957,200) (9,308,800))004,209,132(YVEL XAT LATOT (253,952,000) (262,909,200) (272,218,000)
)005,921,424(EUNEVER LATOT (448,380,900) (460,660,700) (473,347,200)
36 Financial Plan Overview
2015–2019 FIVE YEAR FORECAST
The five-year Financial Plan reflects projected increases in expenditures and increased revenue projections in the General Revenue Fund. The following table provides a five-year summary of the major cost and revenue changes and their impact on the tax levy.

2015Budget ($)
2016 Budget ($)
2017Budget ($)
2018Budget ($)
2019Budget ($)
City Manager 24,453,800 29,355,400 31,107,400 25,727,300 15,389,300Administration Services 69,500 - 1,800,000 - - Fire 1,910,000 2,810,000 5,675,000 5,650,000 4,930,000 Police 2,030,000 - - 200,000 - Library 1,833,800 1,638,400 1,617,400 1,698,300 1,698,300 Information Technology 18,110,500 24,407,000 21,515,000 17,679,000 8,261,000 Contingency 500,000 500,000 500,000 500,000 500,000
Engineering 80,981,500 80,987,000 79,722,500 74,459,500 57,947,000Finance 827,300 670,000 2,185,000 2,175,000 125,000 Planning & Building 12,980,300 43,575,000 41,375,000 42,375,000 42,625,000Parks, Recreation & Cultural Services 29,522,500 48,428,000 52,144,000 34,954,000 26,231,000
TOTAL CAPITAL EXPENDITURES 148,765,400 203,015,400 206,533,900 179,690,800 142,317,300
FUNDING SOURCES
Capital Reserves 37,901,450 35,903,000 35,445,000 29,260,000 33,140,000Vehicle and General Replacement Reserves 67,759,050 81,847,400 87,723,900 73,765,800 50,262,300Utilities Reserve 24,125,000 23,575,000 23,075,000 23,175,000 23,175,000Gaming 7,693,400 23,043,750 23,800,000 17,000,000 2,250,000 Development Cost Charges and Community Benefit Bonus 6,500,000 34,000,000 33,000,000 33,000,000 30,000,000
Other 4,786,500 4,646,250 3,490,000 3,490,000 3,490,000
TOTAL CAPITAL FUNDING SOURCES 148,765,400 203,015,400 206,533,900 179,690,800 142,317,300
Financial Plan Overview 37
5 YEAR CAPITAL PLAN SUMMARY
The five-year Capital Plan provides for the City’s planned capital works. Capital expenditures are defined as expenditures that are of significant value and the resulting assets have a useful economic life of more than one year. Capital projects add value to the City’s physical assets or significantly increase their useful life. The operating impact of these works has been incorporated where appropriate into the five-year Operating Plan.

38 Financial Plan Overview
CAPITAL & OPERATING RESERVES
The level of reserves is an indicator of the long term sustainability and financial strength of the City. The reserves afford Council the ongoing ability to maintain taxation stability and to provide capital funding for City projects without incurring debt on the external markets.
The majority of reserves used for capital program financing are statutory in nature. Their purpose and the authority for collecting and spending money is established by a City bylaw governed by the statutes or laws contained within the Community Charter of the Province of British Columbia.
A smaller proportion of the reserves, such as stabilization, Insurance, and Snow Removal, are dedicated to operating needs. These operating reserves were created from appropriations of operating surpluses and are used to fund current or one-time operating expenditures, reducing the property tax burden.
The 2015 Provisional Financial Plan includes funding from City reserves to offset operating and capital budget expenditures in accordance with City business practices. The City adopts the Public Sector Accounting Board (PSAB) standards for the presentation of financial statements and tangible capital assets.
The growth in the reserves arises mainly from General Revenue Fund contributions, investment income, and land sales. Reserve funds are primarily used for equipment replacement, capital construction, working capital, park land acquisitions and the purchase of land for assembly and development. Land purchased for assembly and development will be sold in the future to facilitate the implementation of Burnaby’s long range community plan.
Financial reports serve as an opportunity to communicate with citizens, business leaders, and other interested parties regarding the City’s financial performance, priorities and direction for the future.

2012Actual
$
2013Actual
$
2014Budget
$
2015Budget
$
2016Budget
$
2017Budget
$
2018Budget
$
2019Budget
$Opening Reserves Balance
Discretionary Capital Reserves 231,577 222,509 203,602 160,971 137,614 115,638 94,174 78,970 Other Capital Reserves & Funds (including depreciation) 263,127 319,046 368,036 409,801 420,450 405,733 386,672 389,772
Development Cost Charges 70,082 115,179 148,118 187,436 241,600 271,005 302,678 335,714 Operating Reserves & Surplus 32,787 36,029 43,140 40,657 36,085 35,739 35,393 35,047
TOTAL OPENING RESERVES BALANCE 597,573 692,763 762,896 798,865 835,749 828,116 818,917 839,503
Increases to Reserves & Funds
Investment Income 29,852 30,428 31,100 31,000 34,442 34,128 33,746 34,648 General Revenue Fund Contributions 47,711 58,235 54,776 56,349 59,549 62,849 66,249 69,749 Utility Funds Contributions 24,636 26,777 26,070 27,622 26,591 25,714 24,637 24,211 Development Cost Charges 41,379 33,814 38,000 53,000 53,000 53,000 53,000 53,000 Private Funds, Grants and Other 22,380 16,362 14,822 14,287 14,146 12,990 12,990 12,990 Sale of Land & Other Assets 21,405 7,255 7,929 7,963 8,000 9,000 10,000 10,000 Others 2,315 4,723 1,000 1,000 1,000 1,000 1,000 1,000
TOTAL INCREASES TORESERVES & FUNDS 189,678 177,594 173,697 191,221 196,728 198,681 201,623 205,599
Decreases to Reserves & Funds
Capital Expenditures from CAWME (47,786) (36,471) (59,358) (37,901) (35,903) (35,445) (29,260) (33,140)Capital Expenditures from Other Capital Reserves & Funds (45,877) (67,166) (69,806) (104,364) (133,112) (138,089) (117,431) (79,177)
Capital Expenditures from Development Cost Charges (1,099) (6,212) (5,082) (6,500) (34,000) (33,000) (33,000) (30,000)
Transfer to Operating - - - (771) (771) (771) (771) (771)Operating Reserves & Surplus Expenditures 274 2,388 (3,483) (4,800) (575) (575) (575) (828)
TOTAL DECREASES TO RESERVES & FUNDS (94,488) (107,462) (137,728) (154,337) (204,361) (207,880) (181,037) (143,916)
Net Increase (Decrease) in Reserves & Funds 95,190 70,132 35,969 36,884 (7,633) (9,199) 20,586 61,683
ENDING RESERVES BALANCE 692,763 762,896 798,865 835,749 828,116 818,917 839,503 901,185
Developers' Contribution to DCC & Density Reclassified as Deferred Revenue
(107,495) (142,039) (181,588) (236,645) (291,829) (347,013) (402,197) (457,385)
Accumulated Surplus in Net Financial Assets Per Financial Statements 585,268 620,857 617,277 599,104 536,287 471,904 437,306 443,801
Financial Plan Overview 39
RESERVES (THOUSANDS)

40 Operating Plan
Operating Plan
GENERAL REVENUE
The 2015 Provisional Financial Plan provides for General Revenue of $424.1 million that incorporates a proposed 2.98% residential property tax increase for 2015 after allowing for new growth of $3.1 million.
The City is facing cost increases that surpass the projected annual rate of inflation of 1.7% for 2014 (Reference: Headline CPI Forecast Econoscope; October 2014 issue). Expenditure increases include collective bargaining agreements, operational and inflationary increases and provisions for new services. Budget reductions and inflationary revenue fee increases have been made across programs to help fund expenditures increases. If a surplus is realized at 2014 year end, the operating surplus will be made available as a funding source for one time expenditures in 2015, to help keep property taxes as low as possible.
The 2015 Provisional Financial Plan focuses on community safety and security, maintaining and improving existing infrastructure for roads and community facilities, and new services.
The City has successfully negotiated collective agreements covering approximately 3,800 people represented by Canadian Union of Public Employees (CUPE) Local 23. The term of this agreement extends to 2015 December 31. The agreement provides a modest wage increase of 2.0% in 2015. The agreement also provides for contractual changes that support operational flexibility. A comparable 2014 agreement has been concluded with the Burnaby Public Library and exempt staff. The Burnaby Firefighters Union, Local 323 wage agreement is still outstanding for 2012—2015. Provisions for City staff contracts, including Fire services and increases in Police services, represent approximately $4.8 million in cost increases.

Hawk Ecosculpture
WATERWORKS UTILITY AND SANITARY SEWER UTILITY
Projections for Waterworks Utility and Sanitary Sewer Utility include a provision for rate increases of 3.0%. The Waterworks Utility rate increase is required to offset the increase in the cost of water billed by the Greater Vancouver Water District for water supplied to the City. The increased costs will provide funding for the regional Drinking Water Quality Improvement Plan. The City, through an annual replacement program, is also replacing all asbestos cement watermains in the City which are at the end of their useful life. This is a long term program.
The Sanitary Sewer increase is based on the long range estimates provided by the Greater Vancouver Sewerage and Drainage District and is due to levy increases and higher costs for aging infrastructure replacement and maintenance.
Both the Waterworks Utility and Sanitary Sewer Utility are self-supporting programs billed separately from property taxes. The due date for these utility charges in 2015 is March 15.

OPERATING BUDGET REVENUESTOTAL | $424.1 million
18.1% Parks, Recreation & Cultural Services ($76.9 million)
15.3% General Government Services ($65.3 million)
13.8% Public Works ($58.6 million)
8.6% Fire ($36.3 million)
13.1% Police ($55.7 million)
11.7% Waterworks ($49.5 million)
9.2% Sanitary Sewer ($39.0 million)
3.9% Solid Waste ($16.4 million)
3.2% Planning & Building ($13.4 million)
3.1% Library ($13.0 million)
54.7% Tax Levies ($231.9 million)
12.7% User Fees & Other Revenues ($53.8 million)
11.7% Waterworks Fund ($49.5 million)
8.5% Miscellaneous Revenue ($36.4 million)
9.2% Sanitary Sewer Fund ($39.0 million)
3.2% Inspection & Licence Fees ($13.5 million)
42 Operating Plan
OPERATING BUDGET EXPENDITURES OPERATING BUDGET REVENUES
The City of Burnaby’s expenditure profile is relatively stable and predictable year over year. Public safety (police and fire) accounts for 21.7% of expenses. Engineering works and utilities, that include transportation planning, sewer and water operations, and sanitation services, account for 38.6%. Parks, recreation, and cultural services, citizen support services, planning and building and library services account for 24.3% of operating expenses. General government services (human resources, finance, legal, risk management, information technology, city clerks) accounts for 15.4%.
Growth of the organization has been modest reflecting increased services (the Edmonds Community Centre and Still Creek Eco-Centre, for example) and increased information technology to meet our community’s desire for on-line services and information. Utility expenditures (water and sewer) account for 20.9% of total expenditures, but over 51% of the costs for water and sewer services represent Metro Vancouver costs that are set at the regional level. Generally, utility expenses have grown at a higher rate than other areas due to the need for heavy capital investments to replace aging infrastructure across the region.
The City has a stable and predictable revenue base. Funds for the operating budget come from several sources, with property taxes (including utility fees) as the primary source of revenue providing 75.6% of total City revenue. User fees, such as recreation program fees, parking meters, and business licenses and permits provide additional 12.7% of funds. Property development related fees and permits are variable in nature and account for 3.2% of our revenue base. Miscellaneous revenue (rental and lease revenue, interest income, grants, etc.) makes up the remaining revenue base.
Utility fees are influenced to a large extent by regional priorities managed by Metro Vancouver. Much of the planning and delivery for public works and utilities is integrated with the regional district. The City of Burnaby’s water and sewer services are operated on a self-funding basis. Council sets the rates and budgets every fall, incorporating input from Metro Vancouver.
OPERATING BUDGET EXPENDITURES TOTAL | $424.1 million

tmsst Center2011
Actuals2012
Actuals2013
Actuals2014*
Annual2015*
Provisional
L01 Cost CenterLCity Council 2,318,972 2,273,909 2,270,568 2,563,800 2,781,600LCity Manager 117,137,751 122,688,354 119,119,089 127,769,000 130,224,500L Administrative Services 6,508,905 6,496,491 7,868,810 7,922,500 7,872,900L Fire 34,450,551 38,066,817 36,197,856 36,154,700 36,304,600L Police 49,868,095 50,351,913 47,392,216 54,818,000 55,699,600L Library 11,659,965 11,784,896 12,032,642 12,711,300 12,958,500L Information Technology 14,650,236 15,988,237 15,627,566 16,162,500 17,388,900LEngineering 139,082,599 145,208,825 152,963,745 158,137,400 163,574,200L Engineering 65,703,623 68,016,527 70,563,848 70,952,200 75,057,800L Utilities 73,378,975 77,192,298 82,399,897 87,185,200 88,516,400LFinance 15,242,146 16,845,259 18,299,728 19,827,900 20,908,100LPlanning & Building 10,115,221 10,529,347 11,414,118 12,628,600 13,387,500LParks, Recreation & Cultural Services 59,779,981 62,233,575 69,313,985 73,969,000 76,878,700LFiscal Items 12,888,759 12,205,050 17,448,532 19,807,500 16,374,900
TOTAL EXPENDITURE 356,565,428 371,984,318 390,829,765 414,703,200 424,129,500
L01 Cost CenterLCity Council (43,508) (16,346) (27,516) (12,500) (12,500)LCity Manager (6,145,001) (6,516,438) (4,411,726) (5,412,600) (5,516,100)L Administrative Services (116,832) (297,926) (543,056) (351,800) (410,300)L Fire (182,431) (156,408) (173,738) (216,600) (157,600)L Police (4,602,451) (4,660,356) (2,584,552) (3,730,900) (3,891,000)L Library (1,243,287) (1,401,748) (1,110,380) (1,113,300) (1,057,200)LEngineering (86,245,159) (87,735,554) (96,074,647) (101,102,900) (105,886,900)L Engineering (12,866,183) (10,543,256) (13,674,750) (13,917,700) (17,370,500)L Utilities (73,378,975) (77,192,298) (82,399,897) (87,185,200) (88,516,400)LFinance (11,470,705) (12,506,043) (12,924,090) (12,671,500) (12,845,600)LPlanning & Building (10,220,794) (10,218,255) (12,008,063) (7,727,300) (8,711,000)LParks, Recreation & Cultural Services (22,118,644) (23,889,468) (26,759,839) (27,497,500) (27,973,900)LFiscal Items (19,862,240) (19,691,490) (21,214,779) (29,399,400) (27,056,000)LStabilization & Surplus (4,100,026) (5,621,553) (3,891,453) (8,698,400) (4,225,100)
TOTAL DEPARTMENTAL & FISCAL REVENUE (160,206,077) (166,195,147) (177,312,113) (192,522,100) (192,227,100)
LTax Levy for City Services (196,359,351) (205,789,171) (213,517,652) (222,181,100) (231,902,400)TOTAL REVENUE (356,565,428) (371,984,318) (390,829,765) (414,703,200) (424,129,500)
* rounded to the nearest hundredth
(0) (0)
EXPENDITURES
REVENUE
Operating Plan 43
SUMMARY OF EXPENDITURES & REVENUE

2011Actuals
2012Actuals
2013Actuals
2014*Annual
2015*Provisional
City Council 2,275,464 2,176,635 2,154,591 2,301,300 2,449,100City Manager 109,963,019 115,661,062 114,130,687 120,755,400 123,770,600 Administrative Services 5,795,076 6,096,023 7,325,754 6,629,800 7,077,000 Fire 34,268,120 37,910,409 35,991,460 35,783,100 36,062,000 Police 45,265,644 45,691,557 44,788,399 51,087,100 51,808,600 Library 9,983,943 9,974,836 10,397,509 11,122,900 11,434,100 Information Technology 14,650,236 15,988,237 15,627,566 16,132,500 17,388,900Engineering 52,641,189 57,462,054 56,640,128 56,414,500 56,802,300Finance 3,771,441 4,339,216 5,232,225 6,696,400 7,247,000Planning & Building (105,623) 311,092 (617,805) 4,866,300 4,641,500Parks, Recreation & Cultural Services 37,385,442 38,099,252 41,939,557 45,026,500 47,922,800Fiscal Items (9,571,581) (12,260,140) (5,961,731) (13,879,300) (10,930,900)
TAX LEVY FOR CITY SERVICES 196,359,351 205,789,171 213,517,652 222,181,100 231,902,400
* rounded to the nearest hundredth
(213,517,652)
0
2011Actuals
2012Actuals
2013Actuals
2014*Annual
2015*Provisional
E EXPENDITURESL04 Cost Center Utilities Sanitary Sewer 32,598,863 34,207,343 36,408,021 38,548,600 39,014,300 Waterworks 40,780,112 42,984,955 45,991,876 48,636,600 49,502,100
E TOTAL EXPENDITURES 73,378,975 77,192,298 82,399,897 87,185,200 88,516,400
R REVENUEL04 Cost Center Utilities Sanitary Sewer (32,598,863) (34,207,343) (36,408,021) (38,548,600) (39,014,300) Waterworks (40,780,112) (42,984,955) (45,991,876) (48,636,600) (49,502,100)
R TOTAL REVENUE (73,378,975) (77,192,298) (82,399,897) (87,185,200) (88,516,400)
FUNDING REQUIREDPROVISION FROM GENERAL REVENUE - - - - -
* rounded to the nearest hundredth
44 Operating Plan
PROVISION FROM GENERAL REVENUE
UTILITIES | SUMMARY

Simon Fraser University Convocation Mall
“I am confident that our many successes in Burnaby and the ongoing exceptional contributions of our citizens, business leaders, and non profits—all supported by our dedicated City staff—will ensure that our City's future is even more promising than its proud and remarkable past.”
Mayor Corrigan
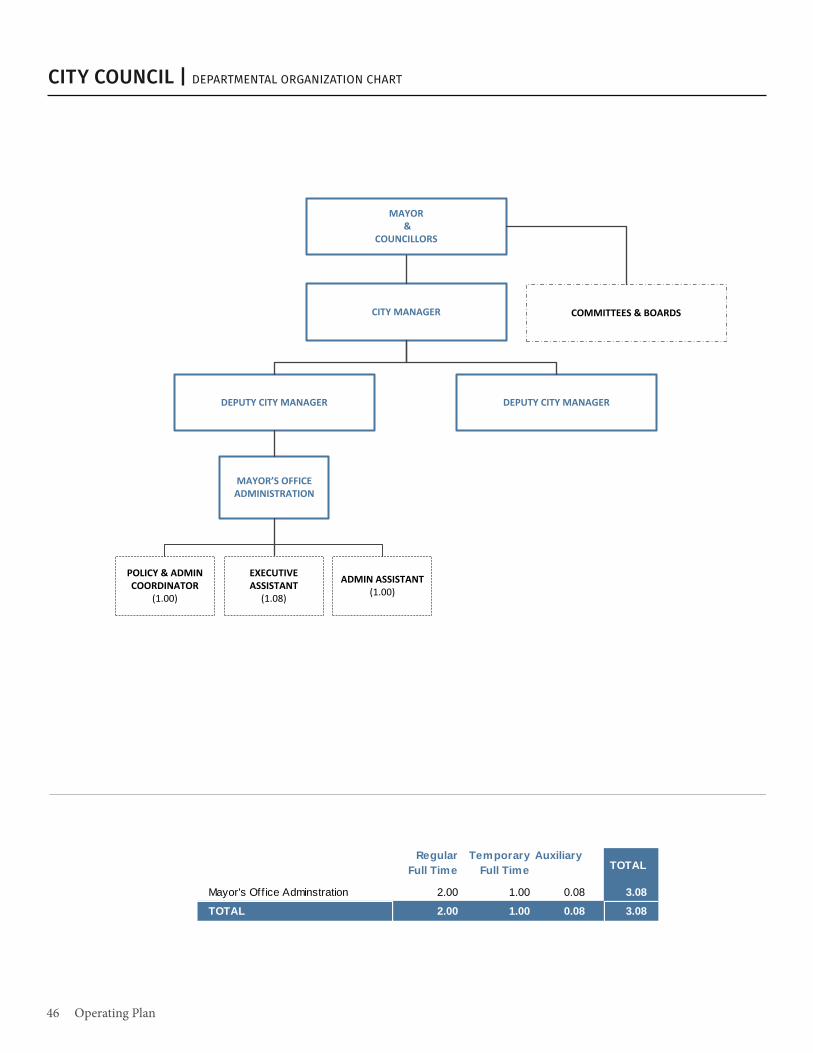
MAYOR &
COUNCILLORS
CITY MANAGER
DEPUTY CITY MANAGER
POLICY & ADMIN COORDINATOR
(1.00)
ADMIN ASSISTANT(1.00)
EXECUTIVE ASSISTANT
(1.08)
Regular Full Time
Temporary Full Time
AuxiliaryTOTAL
Mayor's Off ice Adminstration 2.00 1.00 0.08 3.08TOTAL 2.00 1.00 0.08 3.08
MAYOR’S OFFICE ADMINISTRATION
DEPUTY CITY MANAGER
COMMITTEES & BOARDSMAYOR
& COUNCILLORS
CITY MANAGER
DEPUTY CITY MANAGER
POLICY & ADMIN COORDINATOR
(1.00)
ADMIN ASSISTANT(1.00)
EXECUTIVE ASSISTANT
(1.08)
Regular Full Time
Temporary Full Time
AuxiliaryTOTAL
Mayor's Off ice Adminstration 2.00 1.00 0.08 3.08TOTAL 2.00 1.00 0.08 3.08
MAYOR’S OFFICE ADMINISTRATION
DEPUTY CITY MANAGER
COMMITTEES & BOARDS
46 Operating Plan
CITY COUNCIL | DEPARTMENTAL ORGANIZATION CHART

2011Actuals
2012Actuals
2013Actuals
2014*Annual
2015*Provisional
E EXPENDITURESL04 Cost CenterMayor & Council 917,546 894,408 953,190 975,800 1,045,800Committees & Boards 433,400 372,139 454,775 526,700 526,700Administration 285,625 214,077 100,494 252,800 293,900Grants 598,033 643,768 608,586 608,100 714,800Bus Pass Program 24,340 26,287 26,909 38,000 38,000Communications 60,029 81,973 120,804 62,400 62,400Inter Governmental Relations - 41,256 5,811 100,000 100,000
E TOTAL EXPENDITURES 2,318,972 2,273,909 2,270,568 2,563,800 2,781,600
R REVENUEL04 Cost CenterMayor & Council (21,115) (5,293) (8,250) (2,500) (2,500)Committees & Boards (22,393) (11,053) (19,266) (10,000) (10,000)Stabilization & Surplus - (80,928) (88,461) (250,000) (320,000)
R TOTAL REVENUE (43,508) (97,274) (115,977) (262,500) (332,500)
FUNDING REQUIREDPROVISION FROM GENERAL REVENUE 2,275,464 2,176,635 2,154,591 2,301,300 2,449,100
* rounded to the nearest hundredth
Operating Plan 47
CITY COUNCIL | SUMMARY
The Mayor and Council are elected by the residents of Burnaby and are responsible for providing municipal government services. The Mayor is the head and Chief Executive Officer of the City. The Council is the governing body of the City, and is responsible for seeing that City resources are used for the benefit and protection of its citizens.

* CITY MANAGER(1.00)
* DEPUTY CITY MANAGER
(27.58)
EXECUTIVE ASSISTANT
(1.08)
* DIRECTOR ENGINEERING
Regular Full Time
Temporary Full Time
Regular Part Time Auxiliary Contract
Integrated Teams TOTAL
Manager's Office 5.00 0.08 5.08City Clerk 13.00 1.00 1.56 15.56Citizen Support Services 4.00 2.00 0.02 6.02Human Resources 18.00 5.00 0.51 23.51Legal Services 4.00 1.00 5.00Information Technology 52.00 21.00 4.86 77.86Fire Department 286.00 286.00Library 70.00 65.26 0.48 135.74Police - City Employees 90.00 2.00 0.80 10.42 277.00 24.50 404.72TOTAL 542.00 31.00 67.06 17.93 277.00 24.50 959.49
RCMP REGULAR MEMBERS
* DEPUTY CITY MANAGER
(1.00)
EXECUTIVE ASSISTANT
(1.00)
* DIRECTOR FINANCE
* DIRECTOR PLANNING &
BUILDING
* DIRECTOR PARKS,
RECREATION & CULTURAL
SERVICES
* CHIEF LIBRARIAN
(135.74)
* FIRE CHIEF(286.00)
* OIC RCMP(404.72)
CHIEF INFORMATION
OFFICER(77.86)
DIRECTOR HUMAN
RESOURCES(23.51)
* Members of Management Committee
48 Operating Plan
CITY MANAGER | DEPARTMENTAL ORGANIZATION CHART

2011Actuals
2012Actuals
2013Actuals
2014*Annual
2015*Provisional
EXP EXPENDITURESL04 Cost Center L04 Administrative Services 6,508,905 6,496,491 7,868,810 7,922,400 7,872,900L04 Manager's Office 996,831 963,060 1,087,398 1,079,500 1,105,800L04 City Clerk 1,921,911 1,446,418 1,546,440 2,418,500 1,715,500L04 Human Resources 2,259,969 2,809,184 2,758,379 2,692,000 2,971,100L04 Legal Services 975,847 901,586 1,962,632 1,113,800 1,325,200L04 Citizen Support Services 354,347 376,243 513,961 618,600 755,300L04 Fire 34,450,551 38,066,817 36,197,856 36,154,700 36,304,600L04 Police 49,868,095 50,351,913 47,392,216 54,818,000 55,699,600L04 Library 11,659,965 11,784,896 12,032,642 12,711,300 12,958,500L04 Information Technology 14,650,236 15,988,237 15,627,566 16,162,500 17,388,900
Expen TOTAL EXPENDITURES 117,137,751 122,688,354 119,119,089 127,768,900 130,224,500
REV REVENUEL04 Cost Center L04 Administrative Services (116,832) (297,926) (543,056) (351,800) (410,300)L04 Manager's Office - - - - - L04 City Clerk (430) - - (500) (500)L04 Human Resources (25,391) (172,572) (30,515) (38,500) (38,600)L04 Legal Services (54,944) (87,126) (459,978) (70,200) (70,200)L04 Citizen Support Services (36,066) (38,228) (52,563) (242,600) (301,000)L04 Fire (182,431) (156,408) (173,738) (216,600) (157,600)L04 Police (4,602,451) (4,660,356) (2,584,552) (3,730,900) (3,891,000)L04 Library (1,243,287) (1,401,748) (1,110,380) (1,113,300) (1,057,200)L04 Stabilization & Surplus (1,029,731) (510,854) (576,676) (1,600,900) (937,800)
Reve TOTAL REVENUE (7,174,732) (7,027,292) (4,988,402) (7,013,500) (6,453,900)
FUNDING REQUIREDPROVISION FROM GENERAL REVENUE 109,963,019 115,661,062 114,130,688 120,755,400 123,770,600
* rounded to the nearest hundredth
Operating Plan 49
CITY MANAGER | SUMMARY
The City Manager is the Chief Administrative Officer for the City and makes recommendations to Council.

CITY MANAGER(1.00)
DEPUTY CITY MANAGER
(1.00)
EXECUTIVE ASSISTANT
(1.08)
Regular Full Time Auxiliary TOTAL
City Manager's Off ice 2.00 0.08 2.08Deputy City Manager 2.00 2.00Deputy City Manager - 2 1.00 1.00TOTAL 5.00 0.08 5.08
DEPUTY CITY MANAGER
(1.00)
EXECUTIVE ASSISTANT
(1.00)
50 Operating Plan
CITY MANAGER’S OFFICE | DEPARTMENTAL ORGANIZATION CHART

2011Actuals
2012Actuals
2013Actuals
2014*Annual
2015*Provisional
EXPENDITURES
City Manager's Office 996,831 963,060 1,087,398 1,079,500 1,105,800
E TOTAL EXPENDITURES 996,831 963,060 1,087,398 1,079,500 1,105,800
REVENUE
City Manager's Office - - - - -
R TOTAL REVENUE - - - - -
FUNDING REQUIREDPROVISION FROM GENERAL REVENUE 996,831 963,060 1,087,398 1,079,500 1,105,800
* rounded to the nearest hundredth
Operating Plan 51
CITY MANAGER’S OFFICE | SUMMARY
The City Manager’s Office directs and provides leadership to the operations of the City and is responsible for implementing City policies.

DEPUTY CITY MANAGER
ADMINISTRATIVE OFFICER 1
(3.00)
RECORDS & INFORMATION
ADMINISTRATOR(2.00)
CITY CLERK(1.00)
DEPUTY CITY CLERK(1.00)
MUNICIPAL ARCHIVIST(1.00)
COUNCIL SUPPORT ASSISTANT
(4.69)
ARCHIVAL ASSISTANT
(1.00)
Regular Full Time
Temporary Full Time Auxiliary TOTAL
City Clerk 2.00 1.00 0.18 3.18Clerk's Administration 8.00 0.51 8.51City Archive Operation 2.00 0.87 2.87Deputy City Clerk 1.00 1.00TOTAL 13.00 1.00 1.56 15.56
CLERK TYPIST 2(0.87)
ELECTIONS SUPERVISOR(1.00)
52 Operating Plan
CITY CLERK | DEPARTMENTAL ORGANIZATION CHART

2011Actuals
2012Actuals
2013Actuals
2014*Annual
2015*Provisional
EXPENDITURES
Clerk's Office 1,034,200 1,187,322 1,247,379 1,196,400 1,371,200Elections 663,957 23,725 39,299 968,900 57,600City Archives Operations 223,754 235,371 259,763 253,200 286,700
E TOTAL EXPENDITURES 1,921,911 1,446,418 1,546,440 2,418,500 1,715,500
REVENUE
Clerk's Office (430) - - (500) (500)Stabilization & Surplus (596,997) (79,707) - (940,800) (261,300)
R TOTAL REVENUE (597,427) (79,707) - (941,300) (261,800)
FUNDING REQUIREDPROVISION FROM GENERAL REVENUE 1,324,484 1,366,711 1,546,440 1,477,200 1,453,700
* rounded to the nearest hundredth
Operating Plan 53
CITY CLERK | SUMMARY
The Office of the City Clerk’s Division guides and facilitates the efficient and effective delivery of administrative, legislative and support services for Council, Council Committees, the City and Public.

DEPUTY CITY MANAGER
Regular Full Time
Temporary Full Time Auxiliary TOTAL
Citizen Support Services 4.00 2.00 0.02 6.02TOTAL 4.00 2.00 0.02 6.02
ADMINISTRATOR COMMUNITY VOLUNTEER RESOURCES
(1.00)
COORDINATOR COMMUNITY VOLUNTEER RESOURCES
(3.00)
CLERICAL STAFF(2.02)
54 Operating Plan
CITIZEN SUPPORT SERVICES | DEPARTMENTAL ORGANIZATION CHART

2011Actuals
2012Actuals
2013Actuals
2014*Annual
2015*Provisional
EXPENDITURES Citizen's Support 328,507 340,777 470,887 479,700 382,700Citizen's Support Programs 25,840 35,467 43,074 138,900 372,600
E TOTAL EXPENDITURES 354,347 376,243 513,961 618,600 755,300
REVENUE Citizen's Support - (900) - (85,300) - Citizen's Support Programs (36,066) (37,328) (52,563) (157,300) (301,000)
R TOTAL REVENUE (36,066) (38,228) (52,563) (242,600) (301,000)
FUNDING REQUIREDPROVISION FROM GENERAL REVENUE 318,281 338,015 461,398 376,000 454,300
* rounded to the nearest hundredth
Operating Plan 55
CITIZEN SUPPORT SERVICES | SUMMARY
Citizen Support Services Division manages volunteers in programs, such as the Better At Home program, designed to help seniors remain at home, assists public health nurses at clinics throughout Burnaby and provides gentle support to new mothers.

DEPUTY CITY MANAGER
PROPERTY NEGOTIATORS
(2.00)
Regular Full Time
Regular Part Time TOTAL
Legal Services 4.00 1.00 5.00TOTAL 4.00 1.00 5.00
CLERICALSTAFF(0.40)
LEGALASSISTANTS
(1.60)
CITY SOLICITOR(1.00)
56 Operating Plan
LEGAL SERVICES | DEPARTMENTAL ORGANIZATION CHART

2011Actuals
2012Actuals
2013Actuals
2014*Annual
2015*Provisional
EXPENDITURES Legal 975,847 901,586 1,962,632 1,113,800 1,325,200
E TOTAL EXPENDITURES 975,847 901,586 1,962,632 1,113,800 1,325,200
REVENUE Legal (54,944) (87,126) (459,978) (70,200) (70,200)
R TOTAL REVENUE (54,944) (87,126) (459,978) (70,200) (70,200)
FUNDING REQUIRED
PROVISION FROM GENERAL REVENUE 920,903 814,460 1,502,654 1,043,600 1,255,000
* rounded to the nearest hundredth
Operating Plan 57
LEGAL SERVICES | SUMMARY
The Legal Services Division is responsible for providing legal services to City Council and other City Departments on matters affecting the City.

MANAGER COMPENSATION
(1.00)
HUMAN RESOURCES DIRECTOR
(1.00)
MANAGER EMPLOYMENT
SERVICES(1.00)
SENIOR HR ADVISOR
(1.00)
HR SYSTEMS SPECIALIST
(1.00)
HR ADVISORS(2.00)
MANAGER OCCUPATIONAL
HEALTH & RETURN TO
WORK(1.00)
MANAGER TRAINING &
ORGANIZATIONAL DEVELOPMENT
(1.00)
ADMINISTRATOR BMBS(1.00)
BMBS ASSISTANT(1.22)
BURNABY MUNICIPAL BENEFIT SOCIETY
DIRECTORS
Regular Full Time
Temporary Full Time Auxiliary TOTAL
Human Resources 10.00 2.00 0.29 12.29Labour Relations, Occupational Health & Safety
4.00 3.00 7.00
Training & Organizational Development 2.00 2.00
Benefits (BMBS) 2.00 0.22 2.22
TOTAL 18.00 5.00 0.51 23.51
HR ASSISTANT RETURN TO
WORK(1.00)
HR SYSTEMS ANALYST
(2.00)
HR ADVISOR TRAINING
(1.00)
HR ASSISTANT LABOUR
RELATIONS(1.00)
ASSISTANT HUMAN RESOURCES DIRECTOR
(1.00)
HR ADVISOR RECRUITMENT
(4.00)
HR ASSISTANT(1.00)
HR CLERK(0.29)
SAFETY COORDINATOR
(1.00)
58 Operating Plan
HUMAN RESOURCES | DEPARTMENTAL ORGANIZATION CHART

2011Actuals
2012Actuals
2013Actuals
2014*Annual
2015*Provisional
EXPENDITURES
Human Resource Services 1,348,415 1,868,533 1,819,193 1,525,600 1,493,600Occupational Health & Safety 401,067 434,381 464,417 565,800 809,800Benefits Administration 125,759 126,701 140,505 133,800 195,500Training & Organizational Development 384,727 379,569 334,264 466,800 472,200
E TOTAL EXPENDITURES 2,259,969 2,809,184 2,758,379 2,692,000 2,971,100
REVENUE
Human Resource Services (21,936) (172,572) (30,515) (18,500) (25,000)Training & Organizational Development (3,455) - - (20,000) (13,600)Stabilization & Surplus - (22,836) - - (124,300)
R TOTAL REVENUE (25,391) (195,408) (30,515) (38,500) (162,900)
FUNDING REQUIREDPROVISION FROM GENERAL REVENUE 2,234,578 2,613,776 2,727,864 2,653,500 2,808,200
* rounded to the nearest hundredth
Operating Plan 59
HUMAN RESOURCES | SUMMARY
The Human Resources Department strives to maintain success for the City, and its managers and employees alike by supporting staff to work towards positive outcomes and in the interest of the City.

CHIEF INFORMATION OFFICER(1.00)
Regular Full Time
TemporaryFull Time Auxiliary TOTAL
IT Administration 1.00 1.00IT Program Delivery 10.00 14.00 3.47 27.47IT Business Solutions & Support 20.00 4.00 0.39 24.39IT Infrastructure 21.00 3.00 1.00 25.00TOTAL 52.00 21.00 4.86 77.86
DEPUTY DIRECTOR INFORMATION TECHNOLOGY –
PROGRAM DELIVERY(1.00)
PROJECT SUPPORT(8.56)
DEPUTY DIRECTOR INFORMATION TECHNOLOGY –
BUSINESS SOLUTIONS & SUPPORT(1.00)
DEPUTY DIRECTOR INFORMATION TECHNOLOGY –
INFRASTRUCTURE(1.00)
TRAINING & BUSINESS PROCESS CHANGE
(7.00)
QUALITY ASSURANCE(7.00)
HELP DESK(3.00)
WEB/PORTAL(3.91)
DEVELOPMENT & CUSTOMER INTERACTION
(1.50)
REVENUE & EXPENDITURE(5.00)
PROPERTY APPLICATIONS(4.08)
REPORTING & DEPARTMENTAL APPLICATIONS
(7.81)
TECHNICAL APPLICATIONS(5.00)
DATABASE ADMINISTRATION(2.00)
TECHNICAL INFRASTRUCTURE(10.00)
DESKTOP & COMMUNICATIONS SUPPORT
(9.00)
60 Operating Plan
INFORMATION TECHNOLOGY | DEPARTMENTAL ORGANIZATION CHART

2011Actuals
2012Actuals
2013Actuals
2014*Annual
2015*Provisional
EXPENDITURES
IT Administration 689,087 691,903 270,082 226,800 245,200IT Program Delivery 6,096,127 3,687,252 1,291,923 1,834,700 1,670,900IT Business Solutions & Support 1,536,342 4,796,682 7,448,356 6,923,500 7,481,500IT Infrastructure 6,328,679 6,812,399 6,617,206 7,177,500 7,991,300
E TOTAL EXPENDITURES 14,650,236 15,988,237 15,627,566 16,162,500 17,388,900
REVENUE
Stabilization & Surplus - - - (30,000) -
R TOTAL REVENUE - - - (30,000) -
FUNDING REQUIREDPROVISION FROM GENERAL REVENUE 14,650,236 15,988,237 15,627,566 16,132,500 17,388,900
* rounded to the nearest hundredth
Operating Plan 61
INFORMATION TECHNOLOGY | SUMMARY
The Information Technology Department provides city-wide support and services for technology and telecommunications that enables citizens, businesses and staff to access City services and information electronically.

DIRECTOR FINANCE(1.00)
MANAGER RISK, INSURANCE & CLAIMS
(1.00)
Regular Full Time
Temporary Full Time
Regular Part Time Auxiliary TOTAL
Administration & Internal Control 17.00 5.00 0.80 3.43 26.23Financial Services 19.00 6.00 0.69 6.87 32.56Materials Management 32.00 1.60 0.79 3.81 38.20Licence & Property Management 15.00 1.59 1.63 18.22Revenue Services 19.00 9.00 4.94 32.94
TOTAL 102.00 23.19 2.28 20.68 148.15
ASSISTANT DIRECTOR FINANCIAL PLANNING
& CAPITAL EQUITY(1.00)
PURCHASING MANAGER
(1.00)
CHIEF LICENCE INSPECTOR
(1.00)
ASSISTANT DIRECTOR REVENUE SERVICES
(1.00)
INTERNAL AUDIT(5.00)
RISKMANAGEMENT
(1.00)
RISK MANAGEMENT & EMERGENCY
PLANNING
FINANCIAL PLANNING & CAPITAL EQUITY
FINANCIAL SERVICES
MATERIALS MANAGEMENT
BUSINESS LICENCE & PROPERTY
MANAGEMENT
REVENUE SERVICES
DEPUTY DIRECTOR FINANCE
(1.00)
EMERGENCY PREPAREDNESS
(2.85)
ASSET MANAGEMENT
(5.00)
REPORTING & ANALYSIS
(5.38)
ACCOUNTING(13.64)
PAYROLL(10.91)
BUSINESS PROCESS & APPLICATION
SUPPORT(8.00)
PURCHASING(1.00)
BUYING GROUP(13.39)
STORES(15.81)
PRINTSHOP(7.00)
REAL PROPERTY ADMINISTRATION
(2.00)
PROPERTY COORDINATION
(6.00)
ANIMAL CONTROL
(0.22)
REVENUESERVICES
(4.00)
TREASURY OPERATIONS
(5.36)
MASTER DATA MANAGEMENT
(2.00)
PROPERTY TAX & UTILITIES
(20.58)
ADMINISTRATIVE STAFF (3.00)
FINANCIAL SERVICES
ADMINISTRATION & INTERNAL CONTROL
ADMINISTRATION(9.00)
62 Operating Plan
FINANCE | DEPARTMENTAL ORGANIZATION CHART

2011Actuals
2012Actuals
2013Actuals
2014*Annual
2015*Provisional
E EXPENDITURESL04 Cost Center Administration & Internal Control 2,606,035 2,958,475 3,825,515 3,669,100 3,992,700Financial Services 1,711,386 1,723,438 1,709,794 2,391,500 2,404,300Materials Management 2,446,169 2,517,999 2,556,797 2,940,500 3,185,300Licence & Property Management 6,464,509 7,581,317 7,868,031 7,841,000 8,055,400Revenue Services 2,014,048 2,064,031 2,339,591 2,985,800 3,270,400
E TOTAL EXPENDITURES 15,242,146 16,845,259 18,299,728 19,827,900 20,908,100
R REVENUEL04 Cost Center Administration & Internal Control (153,930) (180,583) (185,481) (153,800) (153,800)Materials Management (230,180) (240,619) (244,518) (247,500) (253,500)Licence & Property Management (10,835,220) (11,819,628) (12,168,119) (11,944,600) (12,112,700)Revenue Services (251,374) (265,213) (325,972) (325,600) (325,600)Stabilization & Surplus - - (143,413) (460,000) (815,500)
R TOTAL REVENUE (11,470,705) (12,506,043) (13,067,503) (13,131,500) (13,661,100)
FUNDING REQUIREDPROVISION FROM GENERAL REVENUE 3,771,441 4,339,216 5,232,225 6,696,400 7,247,000
* rounded to the nearest hundredth
Operating Plan 63
FINANCE | SUMMARY
The Finance Department provides financial leadership and support to encourage sustainable fiscal practices for planning, investment and the stewardship of City assets and resources.

2011Actuals
2012Actuals
2013Actuals
2014*Annual
2015*Provisional
E EXPENDITURESL04 Cost CenterContribution to Capital Funds & Reserves 1,253,149 1,054,800 1,120,528 1,130,000 1,130,000Contribution to Operating Reserves 3,890,075 3,118,299 5,746,858 3,537,800 - Contingencies 3,668,331 2,815,465 2,509,600 3,390,000 5,236,100Insurance 614,436 592,085 447,350 658,500 738,500Interest on Tax Prepayments & Borrowings 58,504 61,501 66,035 84,500 84,500Cafeteria 21,147 15,056 36,158 33,000 33,000Local Improvement Levies - - 15,518 - 15,000Community School Grant 397,790 399,142 399,597 460,200 460,200Bank Charges 105,021 106,733 113,308 124,000 124,000Miscellaneous 2,173,277 3,230,677 6,098,221 5,361,300 1,998,700Asset Related Transactions - 40,497 - 4,127,100 5,699,900Assessment Appeals 609,155 639,570 783,100 651,500 605,000Investment Income 570 - - - - Events Grant 97,304 131,224 112,259 250,000 250,000
E TOTAL EXPENDITURES 12,888,759 12,205,049 17,448,532 19,807,900 16,375,000
R REVENUEL04 Cost CenterContribution to Capital Funds & Reserves (1,056,545) (1,015,154) (1,151,381) (1,130,000) (1,130,000)Contingencies - - - (2,322,000) (2,879,900)Insurance (361,145) (201,486) (160,651) (300,000) (300,000)Cafeteria (3,710) (3,920) (2,625) - - Grants in Lieu (4,401,106) (4,835,147) (5,451,711) (5,391,300) (5,407,100)Local Improvement Levies (793,803) (837,417) (852,261) (780,000) (800,000)Miscellaneous (1,123,495) (1,162,793) (1,622,260) (3,919,000) (941,900)Other Tax Levies (3,072,384) (3,050,726) (3,013,848) (2,990,000) (2,980,000)Penalties and Interest on Overdue Taxes (1,156,415) (1,244,139) (1,498,176) (1,180,000) (1,230,000)Tax Adjustment - Land Sales - - - (10,000) (10,000)Asset Related Transactions (216,043) (154,256) (130,452) (4,127,100) (4,127,100)Investment Income (7,580,291) (7,055,227) (7,219,156) (7,000,000) (7,000,000)Events Grant (97,304) (131,224) (112,259) (250,000) (250,000)Stabilization & Surplus (2,598,100) (4,773,700) (2,195,484) (4,287,800) (249,800)
R TOTAL REVENUE (22,460,340) (24,465,189) (23,410,263) (33,687,200) (27,305,800)
FUNDING REQUIRED
PROVISION FROM GENERAL REVENUE (9,571,581) (12,260,141) (5,961,731) (13,879,300) (10,930,800)
* rounded to the nearest hundredth
64 Operating Plan
FISCAL ITEMS

Walkway at Bob Prittie Library
The City of Burnaby is debt-free and is on the road to be financially sustainable into the future.

LIBRARY BOARD
CHIEF LIBRARIAN(1.00)
Regular Full Tim e
Regular Part Tim e Auxiliary TOTAL
Metrotow n 22.00 26.92 0.14 49.06McGill 10.00 12.85 22.85Tommy Douglas 8.00 11.09 0.15 19.24Cameron 5.00 6.52 11.52Home Library Service 2.00 1.60 0.11 3.71Cataloguing 7.00 2.07 9.07Acquisitions 5.00 0.60 5.60Finance & Administration 7.00 1.40 0.08 8.48Systems 3.00 3.00Children's & Teen Services 1.00 2.21 3.21TOTAL 70.00 65.26 0.48 135.74
DEPUTY CHIEF LIBRARIAN
(1.00)
BOB PRITTIE METROTOWN
(48.06)
MCGILL LIBRARIAN
(22.85)
TOMMY DOUGLAS LIBRARIAN
(19.24)
CAMERON LIBRARIAN
(11.52)
REFERENCE LIBRARIAN
FICTION / AVLIBRARIAN
HOMELIBRARYSERVICES
LIBRARIAN(3.71)
LIBRARIAN-TECHNICAL(CATALOGUING)
(9.07)
LIBRARIAN-TECHNICAL(ACQUISITIONS)
(5.60)
FINANCE & ADMINISTRATION SERVICES MANAGER
(7.48)
SYSTEMSLIBRARIAN
(3.00)
CHILDREN’S & TEEN SERVICES LIBRARIAN
(3.21)
66 Operating Plan
LIBRARY | DEPARTMENTAL ORGANIZATION CHART
Metrotown

2011Actuals
2012Actuals
2013Actuals
2014*Annual
2015*Provisional
EXPENDITURES
Branch Services 8,578,657 8,659,826 8,824,312 9,465,100 9,604,100System Services 2,304,588 2,335,313 2,427,508 2,416,700 2,501,400Technical Services 776,719 789,757 780,821 829,400 853,000
E TOTAL EXPENDITURES 11,659,965 11,784,896 12,032,642 12,711,200 12,958,500
REVENUE
Branch Services (372,764) (322,331) (305,698) (307,000) (307,000)System Services (850,665) (1,059,558) (804,682) (806,300) (750,200)Technical Services (19,859) (19,859) - - - Stabilization & Surplus (432,734) (408,312) (524,753) (475,000) (467,200)
R TOTAL REVENUE (1,676,022) (1,810,060) (1,635,133) (1,588,300) (1,524,400)
FUNDING REQUIREDPROVISION FROM GENERAL REVENUE 9,983,943 9,974,836 10,397,509 11,122,900 11,434,100
* rounded to the nearest hundredth
Operating Plan 67
LIBRARY | SUMMARY
The Burnaby Public Library provides access to a rich array of the world’s stories, ideas and information.

FIRE CHIEF(1.00)
FIRE INSPECTORS(4.00)
DEPUTY FIRE CHIEF(ADMINISTRATION)
(1.00)
Regular Full Time TOTAL
Fire 1.00 1.00Staff Off icer 1.00 1.00Fire Administration 5.00 5.00Fire Prevention 9.00 9.00Firefighting 264.00 264.00Mechanical Services 3.00 3.00Fire Training 3.00 3.00TOTAL 286.00 286.00
DEPUTY FIRE CHIEF(PLANNING & LOGISTICS)
(1.00)
DEPUTY FIRE CHIEF(OPERATIONS)
(1.00)
CHIEF FIRE PREVENTION OFFICER
(1.00)
CAPTAIN FIRE PREVENTION
(3.00)
ADMINISTRATIVEASSISTANT
(1.00)
ASSISTANT FIRE CHIEFS
(4.00)
FIRE CAPTAINS(42.00)
CHIEF MECHANIC(1.00)
CHIEF TRAININGOFFICER
(1.00)
ASSISTANT CHIEF TRAINING OFFICER
(1.00)
CAPTAIN TRAINING
(1.00)
ADMINISTRATIVE CLERKS(3.00)
DATA ENTRY CLERK(1.00)
MECHANICS(2.00)
FIRE LIEUTENANTS(29.00)
FIREFIGHTERS(188.00)
68 Operating Plan
FIRE | DEPARTMENTAL ORGANIZATION CHART

2011Actuals
2012Actuals
2013Actuals
2014*Annual
2015*Provisional
EXPENDITURES
Administration 924,933 1,007,187 991,001 1,023,500 1,042,600Prevention 1,067,029 1,198,196 1,232,616 1,208,900 1,214,300Training 608,856 534,987 535,327 654,200 601,000Fire Fighting 28,961,830 32,406,950 30,523,947 30,484,600 30,606,200Firehalls Station Operations 774,990 863,025 833,916 777,600 767,600Mechanical Services 2,112,913 2,056,472 2,081,049 2,005,900 2,072,900
E TOTAL EXPENDITURES 34,450,551 38,066,817 36,197,856 36,154,700 36,304,600
REVENUE
Administration (23,254) (7,879) (15,328) (57,500) (26,500)Prevention (108,226) (109,808) (140,328) (130,600) (130,600)Training (45,481) (31,395) (18,082) (28,000) - Fire Fighting (5,470) - - (500) (500)Mechanical Services - (7,325) - - - Stabilization & Surplus - - (32,658) (155,000) (85,000)
R TOTAL REVENUE (182,431) (156,408) (206,396) (371,600) (242,600)
FUNDING REQUIREDPROVISION FROM GENERAL REVENUE 34,268,120 37,910,409 35,991,460 35,783,100 36,062,000
* rounded to the nearest hundredth
Operating Plan 69
FIRE | SUMMARY
The Burnaby Fire Department is committed to providing the highest level of fire related emergency services to protect life and property in the City.

OFFICER IN CHARGEBURNABY DETACHMENT
(1.00 R/M)
EXECUTIVE NCO(1.00 R/M)
Strategic Planning (1.00 R/M)Professional Standards (2.00 R/M)Media Relations Officer (1.00 R/M)Communications Strategist (1.00 C/E)Crime Analyst (1.00 C/E)
EXECUTIVE ASSISTANT(1.00 C/E)
OPERATIONS OFFICER /ASSISTANT OIC
(1.00 R/M)
ADMIN SERVICES OFFICER(1.00 R/M)
ICARS (Integrated Collision Analyst/Reconstruction)
(2.10 R/M)
POLICE DOG SERVICE(4.60 R/M)
FORENSIC IDENTIFICATION(7.10 R/M, 1.00 C/E)
ERT (Emergency Response Team)
(4.10 R/M)
IHIT (Integrated Homicide Investigation Team)
(6.60 R/M)
COMMUNITY PROGRAMS OFFICER
(1.00 R/M)
INVESTIGATIVE SERVICES OFFICER
(1.00 R/M)
COMMUNITY PROGRAMS ADVISORY NCO
(1.00 R/M)
INVESTIGATIVE SERVICES TEAM LEADERS
(2.00 R/M)
ASSISTANT OPERATIONS OFFICER / DUTY OFFICER
(1.00 R/M)
OPERATIONS ADVISORY NCO
(1.00 R/M)
Client Services (3.00 R/M, 46.07 C/E)
Training (4.00 R/M)Member Services (1.00 R/M)Financial Services (6.60 C/E)IT Support (5.00 C/E)
A Watch (27.00 R/M, 1.36 C/E)B Watch (27.00 R/M, 1.37 C/E)C Watch (27.00 R/M, 1.37 C/E)D Watch (27.00 R/M, 1.36 C/E)Traffic Services (26.00 R/M, 1.00 C/E)Detention (5.14 C/E)Exhibits (1.00 R/M, 3.50 C/E)
District CPO Ops NCO (21.00 R/M, 4.96 C/E)Youth/SLO (10.00 R/M)P.O.S.T (13.00 R/M)Emergency & Major (1.00 R/M)Event ManagementCP/VS (2.00 R/M, 14.49 C/E)Crime Analyst (1.00 C/E)
Serious Crime (11.00 R/M)Investigative Services Team (19.00 R/M)General GIS (13.00 R/M, 2.00 C/E)Strike Force (13.00 R/M)Drugs (13.00 R/M, 1.00 C/E)Criminal Intelligence (2.00 R/M)Major Case Management (2.00 C/E)Crime Analyst (1.00 C/E)
ADMIN SERVICES ADVISORY NCO
(1.00 R/M)
Regular Full Time
Temporary Full Time
Regular Part Time Auxiliary
Regular Members TOTAL
Officer in Charge 1.00 1.00Executive 3.00 5.00 8.00Operations Officer 2.00 2.00Assistant Operations Officer 11.00 2.00 0.40 1.70 136.00 151.10Community Programs Officer 17.00 3.45 49.00 69.45Investigative Services Officer 6.00 74.00 80.00Administrative Services Officer 52.00 0.40 5.27 10.00 67.67Integrated teams 1.00 24.50 25.50TOTAL 90.00 2.00 0.80 10.42 301.50 404.72
City Employees RCMP Contract
LEGEND
OIC Officer in ChargeNCO Non-Commissioned OfficerR/M Contract Regular MemberC/E City Employee
70 Operating Plan
POLICE | DEPARTMENTAL ORGANIZATION CHART

2011Actuals
2012Actuals
2013Actuals
2014*Annual
2015*Provisional
EXPENDITURES
RCMP Contract 39,014,802 39,589,807 37,252,734 43,284,400 43,784,400Business Services 973,317 1,921,856 1,608,304 3,739,800 3,752,700Information Technology 491,458 503,639 556,756 588,400 600,100Block Watch Program 92,761 49,255 1,007 - - Police Community Programs & City Svcs 4,208,432 3,228,285 3,553,092 4,078,300 4,299,900Police Records Management 1,960,714 1,959,540 1,962,857 3,127,100 3,262,500Police Support Services 3,126,611 3,099,531 2,457,466 - -
E TOTAL EXPENDITURES 49,868,095 50,351,913 47,392,216 54,818,000 55,699,600
REVENUE
Business Services (170,708) (4,008,520) (2,021,153) (3,152,700) (3,315,700)Information Technology (45,013) (45,309) (4,795) - - Block Watch Program (330) (590) - - - Police Community Programs & City Svcs (4,253,825) (467,970) (469,991) (513,200) (510,300)Police Records Management (63,757) (68,378) (71,160) (65,000) (65,000)Police Support Services (68,818) (69,589) (17,452) - - Stabilization & Surplus - - (19,265) - -
R TOTAL REVENUE (4,602,451) (4,660,356) (2,603,817) (3,730,900) (3,891,000)
FUNDING REQUIREDPROVISION FROM GENERAL REVENUE 45,265,644 45,691,557 44,788,399 51,087,100 51,808,600
* rounded to the nearest hundredth
Operating Plan 71
POLICE | SUMMARY
The Burnaby Royal Canadian Mounted Police consults with communities about their unique public safety concerns. They are the second largest detachment in Canada.

72 Operating Plan
The Engineering Department is responsible for ensuring the adequacy and continuity of City infrastructure. The department is dynamic, and adapts to manage changes within the City by using effective and current technologies to ensure top quality service.

2011Actuals
2012Actuals
2013Actuals
2014*Annual
2015*Provisional
E EXPENDITURESL04 Cost Center Engineering 65,703,623 68,016,527 70,563,848 70,952,200 75,057,800Utilities 73,378,975 77,192,298 82,399,897 87,185,200 88,516,400 Sanitary Sewer 32,598,863 34,207,343 36,408,021 38,548,600 39,014,300 Waterworks 40,780,112 42,984,955 45,991,876 48,636,600 49,502,100
E TOTAL EXPENDITURES 139,082,599 145,208,825 152,963,745 158,137,400 163,574,200
R REVENUEL04 Cost Center Engineering (12,866,183) (10,543,256) (13,674,750) (13,917,700) (17,370,500)Utilities (73,378,975) (77,192,298) (82,399,897) (87,185,200) (88,516,400) Sanitary Sewer (32,598,863) (34,207,343) (36,408,021) (38,548,600) (39,014,300) Waterworks (40,780,112) (42,984,955) (45,991,876) (48,636,600) (49,502,100)Stabilization & Surplus (196,250) (11,217) (248,970) (620,000) (885,000)
R TOTAL REVENUE (86,441,409) (87,746,771) (96,323,617) (101,722,900) (106,771,900)
FUNDING REQUIREDPROVISION FROM GENERAL REVENUE 52,641,189 57,462,054 56,640,128 56,414,500 56,802,300
* rounded to the nearest hundredth
Operating Plan 73
ENGINEERING | SUMMARY

DIRECTOR ENGINEERING(1.00)
ASSISTANT DIRECTOR ASSET MANAGEMENT
(1.00)
Regular Full Time
Temporary Full Time
Regular Part Time Auxiliary TOTAL
Engineering Administration 6.00 1.00 7.00Asset Management 19.00 2.00 0.22 21.22Traff ic & Parking Management 20.00 0.86 2.00 22.86Environmental Services 78.00 15.02 93.02Development Services 31.00 1.58 1.65 34.23Facilities Management 37.00 1.00 4.18 42.18Public Works 98.00 14.90 2.35 115.25Sew ers 36.00 4.00 40.00Waterw orks 41.00 9.66 50.66TOTAL 366.00 34.14 0.86 25.42 426.42
ENGINEERING ADMINISTRATION/
BUDGETS(2.00)
ASSISTANT DIRECTOR TRAFFIC & PARKING
MANAGEMENT(1.00)
ASSISTANT DIRECTOR
ENVIRONMENTAL PROTECTION
(1.00)
MANAGER PUBLIC WORKS
OPERATIONS(1.00)
ASSISTANT DIRECTOR FACILITIES
MANAGEMENT(1.00)
ASSISTANT DIRECTOR
DEVELOPMENT SERVICES &
INFRASTRUCTURE PLANNING
(1.00)
DEPUTY DIRECTOR ENGINEERING
(1.00)
BUSINESS MANAGER -
ENGINEERING(1.00)
SAFETY & SECURITY
(2.00)
INFRASTRUCTURE PLANNING ENGINEER
(1.00)
ROADS & DRAINAGE ENGINEER
(1.00)
WATER & SEWER ENGINEER
(1.00)
ASSET MANAGEMENT
(5.22)
ENGINEERING SYSTEMS
(12.00)
PUBLIC WORKS ADMINISTRATION
(7.77)
TRAFFIC MANAGEMENT
(6.00)
PARKING MANAGEMENT & TRAFFIC BYLAW
(14.86)
ANTI-GRAFFITI COORDINATOR
(1.00)
ENVIRONMENTAL SERVICES
(6.00)
SOLID WASTE & RECYCLING
(74.42)
SIGN & MARKING SHOP
(11.60)
FACILITIES MANAGEMENT
(41.18)
DESIGN(7.00)
SURVEY(10.55)
CONTRACTS(15.68)
ROADS & DRAINAGE
(60.90)
WATER(50.66)
SEWERS(40.00)
PUMPS & CONTROLS
(10.00)
SHOPS & EQUIPMENT
(35.58)
Sewers
74 Operating Plan
ENGINEERING | DEPARTMENTAL ORGANIZATION CHART

2011Actuals
2012Actuals
2013Actuals
2014*Annual
2015*Provisional
EXPENDITURES
Administration (414,349) (656,447) (580,065) (790,100) (640,500)Public Works 36,657,246 38,106,572 39,329,148 39,606,100 41,159,700Developmt Srvc & Infrastructure Planning 3,086,914 3,060,622 3,177,593 3,334,200 3,094,000Traffic & Engineering Systems 11,450,886 11,759,290 12,226,250 12,403,600 12,877,200Environmental Services 929,401 912,313 952,975 770,000 825,500Solid Waste & Sign Shop 13,296,418 14,224,772 14,837,256 14,707,600 16,444,100Engineering Administration 697,107 609,405 620,691 920,800 1,297,800
E TOTAL EXPENDITURES 65,703,623 68,016,527 70,563,848 70,952,200 75,057,800
REVENUE
Administration (107,980) (108,154) (93,986) (94,100) (94,100)Public Works (6,128,849) (4,224,628) (4,451,354) (5,298,700) (5,598,700)Developmt Srvc & Infrastructure Planning (535,483) (405,736) (327,906) (325,400) (325,400)Traffic & Engineering Systems (2,304,282) (2,503,327) (3,232,658) (2,780,000) (3,067,000)Environmental Services (64,596) (11,204) (59,723) (2,300) (2,400)Solid Waste & Sign Shop (3,724,993) (3,290,208) (5,509,123) (5,417,200) (8,282,900)Stabilization & Surplus (196,250) (11,217) (248,970) (620,000) (885,000)
R TOTAL REVENUE (13,062,434) (10,554,473) (13,923,720) (14,537,700) (18,255,500)
FUNDING REQUIREDPROVISION FROM GENERAL REVENUE 52,641,189 57,462,054 56,640,128 56,414,500 56,802,300
* rounded to the nearest hundredth
Operating Plan 75
ENGINEERING | DETAILS SUMMARY
Amongst other responsibilities, the Engineering Public Works section provides high quality drinking water and water for fire suppression, as well as the maintenance and construction of the City’s sanitary sewers. Waterworks and Sanitary Sewer information on the following pages

2011Actuals
2012Actuals
2013Actuals
2014*Provisional**
2015Provisional
EXPENDITURES
Waterworks Administration 50,837 118,199 20,821 212,900 49,300Water 32,349,011 35,121,667 38,070,342 38,307,800 39,576,500Water - Meter & Valves 336,881 391,875 392,685 347,100 367,700Water - Operations, Mtce, & Construction 7,299,158 6,642,042 6,729,551 7,870,200 8,087,000Water - Pumpstations & PVR's 620,186 711,172 778,477 714,600 921,600Contingency - - - 1,184,000 500,000Contribution to Reserves 124,037 - - - -
E TOTAL EXPENDITURES 40,780,112 42,984,955 45,991,876 48,636,600 49,502,100
REVENUE
Water Levy & User Charges (40,780,112) (42,984,955) (45,611,771) (48,035,824) (49,502,100)Contribution from Reserves - - (380,105) (600,776) -
R TOTAL REVENUE (40,780,112) (42,984,955) (45,991,876) (48,636,600) (49,502,100)
* rounded to the nearest hundredth**2014 Provisional Budget as per Utility Bylaw
76 Operating Plan
UTILITIES | WATERWORKS

2011Actuals
2012Actuals
2013Actuals
2014*Provisional**
2015Provisional
EXPENDITURES
Sewer Administration 270,615 279,602 193,097 268,800 222,900Damage Claims 3,417 4,177 5,521 15,000 15,000Operations, Mtce, & Construction 4,486,641 4,470,748 4,768,446 5,850,600 6,261,400Pumpstations 740,799 851,328 941,066 699,600 917,700Pump Controls 244,208 234,754 176,656 333,000 281,200Sanitary Sewer 26,853,183 28,366,734 29,105,719 30,881,600 30,816,100Contingency - - - 500,000 500,000Contribution to Reserves - - 1,217,516 - -
E TOTAL EXPENDITURES 32,598,863 34,207,343 36,408,021 38,548,600 39,014,300
REVENUE
Sewer Levy & User Charges (32,189,503) (33,939,624) (36,408,021) (37,868,400) (39,014,300)Contribution from Reserves (409,360) (267,719) - (680,200) -
R TOTAL REVENUE (32,598,863) (34,207,343) (36,408,021) (38,548,600) (39,014,300)
* rounded to the nearest hundredth**2014 Provisional Budget as per Utility Bylaw
Operating Plan 77
UTILITIES | SANITARY SEWER

Regular Full Time
Temporary Full Time
Regular Part Time Auxiliary TOTAL
Administration Services 24.00 3.00 2.69 42.22 71.91Cultural Services 43.00 2.83 33.30 79.13Parks Planning 11.00 4.67 15.67Parks Services 142.00 36.81 24.03 202.84Recreation Services 130.00 2.91 34.73 145.72 313.36Golf Services 20.00 2.84 1.87 23.11 47.82TOTAL 370.00 45.56 42.12 273.05 730.73
DIRECTORPARKS, RECREATION
& CULTURAL SERVICES(1.00)
ASSISTANT DIRECTORRECREATION SERVICES
(1.00)
MANAGER DEVELOPMENT & PROMOTION
ASSISTANT DIRECTORCULTURAL SERVICES
(1.00)
ASSISTANT DIRECTORGOLF OPERATIONS
(1.00)
ASSISTANT DIRECTORPARKS SERVICES
(1.00)
Recreation ComplexesYouth Services
Sports & OutdoorRecreation
AquaticsArenas
Senior CentresCommunity Services
(312.36)
Burnaby Art GalleryBurnaby Village Museum
Shadbolt Centre for the ArtsEvents & Festivals
Filming Coordination
(78.13)
Riverway Golf CourseBurnaby Mountain Golf Course
Central Park Pitch & PuttKensington Park Pitch
& Putt
(46.82)
Parks DevelopmentParks Maintenance
JanitorialHorticulture
ForestryPark Patrol & Security
(201.84)
SponsorshipOpportunitiesSpecial Event
Promotion & PartnershipDevelopment
(1.00)
MANAGERBUSINESS OPERATIONS
MANAGERMARKETING &
COMMUNICATIONS
Operating BudgetOffice Administration
Food ServicesInformation Systems
Support
(64.06)
CommunicationsLeisure Guide
Promotions & MarketingBanner Program
(5.85)
MANAGERPARKS PLANNING, DESIGN &
DEVELOPMENT
Parks PlanningParks DesignEco Sculpture
Environmental Stewardship
(15.67)
78 Operating Plan
PARKS, RECREATION & CULTURAL SERVICES | DEPARTMENTAL ORGANIZATION CHART

2011**Actuals
2012**Actuals
2013**Actuals
2014*Annual
2015*Provisional
E EXPENDITURESL04 Cost CenterCultural Services** 8,236,982 8,636,135 8,859,625 9,227,900 9,601,300Golf Services 5,679,476 5,937,054 6,170,695 6,449,700 6,609,100Recreation Services 20,296,265 20,892,534 23,680,004 26,610,700 27,910,700Parks Services 19,505,243 19,839,134 21,738,090 22,722,500 23,609,700Administration - Business Operations 6,062,014 6,928,718 8,865,571 8,958,200 9,147,900
E TOTAL EXPENDITURES 59,779,981 62,233,575 69,313,985 73,969,000 76,878,700
R REVENUEL04 Cost CenterCultural Services** (2,731,855) (2,866,245) (2,924,735) (3,222,700) (3,273,400)Golf Services (6,200,262) (6,551,051) (6,756,961) (6,370,500) (6,385,500)Recreation Services (10,455,546) (10,851,206) (11,832,383) (13,245,300) (13,558,000)Parks Services (148,347) (243,841) (237,843) (94,000) (94,000)Administration - Business Operations (2,582,635) (3,377,126) (5,007,918) (4,565,000) (4,663,000)Stabilization & Surplus (275,895) (244,854) (614,589) (1,445,000) (982,000)
R TOTAL REVENUE (22,394,539) (24,134,322) (27,374,428) (28,942,500) (28,955,900)
FUNDING REQUIREDPROVISION FROM GENERAL REVENUE 37,385,442 38,099,252 41,939,557 45,026,500 47,922,800
* rounded to the nearest hundredth** includes Filming Coordination that were previously reported in City Manager's Office
Operating Plan 79
PARKS, RECREATION & CULTURAL SERVICES | SUMMARY
Parks, Recreation and Cultural Services Department ensures that the community has opportunities for personal growth through leisure-time activities.

Regular Full Time
Temporary Full Time
Regular Part Time Auxiliary TOTAL
Planning 50.00 1.00 1.41 52.41Building 64.00 3.00 0.60 1.30 68.90TOTAL 114.00 4.00 0.60 2.71 121.31
DIRECTOR PLANNING & BUILDING
(1.00)
ASSISTANT DIRECTORLONG RANGE PLANNING
(1.00)
BUILDING(2.00)
ASSISTANT DIRECTORCURRENT PLANNING
(1.00)
CHIEF BUILDING INSPECTOR
(1.00)
SECRETARY / CLERKS(9.00)
TECHNICAL SUPPORT(8.00)
BUILDING ADMINISTRATION(12.00)
INSPECTIONS, BUILDING, PLUMBING & ELECTRICAL
(25.30)
PLAN CHECKING(13.00)
CIVIC PROJECTS(5.00)
BYLAW / BYLAWSERVICES
(10.60)
COMMUNITY PLANNING, URBAN DESIGN & TOURISM STRATEGY
(10.41)
SUBDIVISION, ZONING & DEVELOPMENT APPROVALS
(6.00)
POLICY, HERITAGE, ENVIRONMENT,
ECONOMIC & HOUSING(10.00)
TRANSPORTATIONPLANNING
(3.00)
SOCIALPLANNING
(3.00)
80 Operating Plan
PLANNING & BUILDING | DEPARTMENTAL ORGANIZATION CHART

2011Actuals
2012Actuals
2013Actuals
2014*Annual
2015*Provisional
E EXPENDITURESL04 Cost Center Planning 4,575,069 4,760,969 5,345,632 5,792,900 6,267,100Building 5,540,152 5,768,378 6,068,486 6,835,700 7,120,400
E TOTAL EXPENDITURES 10,115,221 10,529,347 11,414,118 12,628,600 13,387,500
R REVENUEL04 Cost Center Planning (1,056,561) (1,759,757) (1,652,766) (811,500) (843,500)Building (9,164,234) (8,458,498) (10,355,297) (6,915,800) (7,867,500)Stabilization & Surplus (49) - (23,860) (35,000) (35,000)
R TOTAL REVENUE (10,220,844) (10,218,255) (12,031,923) (7,762,300) (8,746,000)
FUNDING REQUIREDPROVISION FROM GENERAL REVENUE (105,623) 311,092 (617,805) 4,866,300 4,641,500
* rounded to the nearest hundredth
Operating Plan 81
PLANNING & BUILDING | SUMMARY
The Planning and Building Department oversees development in the City and is responsible for various aspects of the planning and development process.

47.1% Land ($1.6 billion)
20.6% Roads ($0.7 billion)
8.8% Municipal & Buildings ($0.3 billion)
5.9% Waterworks ($0.2 billion)
5.9% Drainage ($0.2 billion)
5.9% Vehicles, Technology & Other ($0.2 billion)
2.9% Land Improvements ($0.1 billion)
2.9% Sanitary Sewer ($0.1 billion)
82 Capital Plan
Capital PlanCAPITAL ASSET OVERVIEWThe City’s assets at historic cost are valued at $3.4 billion. The City’s Capital Plan provides information about the City’s planned capital investment in assets to provide new and replacement facilities and infrastructure in the City and outlines how these investments will be funded.
The following chart provides a summary of City assets.
2014 JANUARY
2014 CAPITAL ASSET SUMMARY TOTAL | $3.4 billion
The largest asset investment is in City land valued at $1.6 billion. More than 25% of Burnaby’s land is preserved for park, conservation and green space. Land does not depreciate.

Artist’s rendering of the Plaza at Brentwood Town Centre

84 Capital Plan
The remaining assets which cost $1.9 billion historically are depreciated over their useful life. Each year a proportion of these assets are reaching the stage where they will require renewing, replacing or upgrading. The Capital Plan includes the 2015–2019 asset replacement programs and the City’s plan for new capital investment.
The City advances capital projects to serve a growing population, provide new amenities and to promote social and environmental sustainability. As the City grows, both the demand for services and the opportunities to provide them increase. New commercial and residential development remains strong in Burnaby and has enabled the City to develop innovative policies and community partnerships to help the City achieve its goals and provide increased value to its citizens.
Under the City’s Community Benefit Bonus Policy developers contribute funds to the City for provision of densification within one of the four quadrants of our City—Metrotown, Brentwood, Edmonds and Lougheed. These funds provide for community benefits that meets social, cultural, recreational and environmental needs of the community.
Planned Community Benefit Bonus funds for the development of major amenities have been allocated within the 2015–2019 Capital Plan for the following projects:
• A new performance and event centre in Metrotown Town Centre;
• A new Brentwood Community Centre;• A new linear public park along Willingdon Avenue,
linking Brentwood Town Centre to Confederation Park;• A new arena in the Edmonds community; and• The replacement of the Cameron Recreation Centre,
including the addition of a new swimming pool, and the replacement of the Cameron Library in Lougheed Town Centre.
In 2015 the City in partnership with the School District will begin the development of the first of a series of daycare centres on School sites helping to provide support to families in our community.
DEVELOPING THE PLANThe development of the five year capital plan requires extensive coordination with all City departments to review all projects to forecast that will carry over year end as well as new budget requirements. The process to develop the 2015 provisional five year capital plan started at the beginning of the third quarter of 2014. When all 2014 project costs are known and work in process has been determined, the 2015 Capital Plan will be updated.
Burnaby is a regional leader in financial sustainability. Council’s long term support of prudent financial policies has developed City revenues sufficient to fund needed services to the public without unplanned increases in rates or disruptive cuts to services.
Burnaby City Council has recognized the need to provide funding for the replacement of long-term assets. Council’s pay as you go financing strategy for capital investment has ensured Burnaby continues to remain debt free, and has produced capital reserve balances sufficient to fund 80% of the City’s five year capital program. Capital reserve balances also earn investment income annually, and receive proceeds for all City land sales.
Contributions are made annually from general revenue to Capital Reserves for the replacement of assets at the end of their useful lives an amount equivalent to depreciation. Depreciation represents the annual cost of using a City asset. This funding strategy helps to create long term financial sustainability for the City while also helping to addressing intergenerational equity where today’s rate payers meet the fair cost of their consumption of a capital asset’s service rather than future rate payers being required to fund the full cost of replacement of an asset when depleted. Major capital work can only proceed with final approval of Council by acceptance of tenders, passage of funding bylaws, passage of construction bylaws, authorization of work orders, etc. Exceptions are budgeted expenditures which are less than $250,000 funded from vehicle and equipment replacement reserves which are approved by the appropriate level of authority.

40.0% Infrastructure ($59.4 million)
21.0% Vehicles & Equipment ($30.9 million)
20.0% Land & Land Improvements ($30.1 million)
19.0% Buildings ($28.4 million)
Roads ($35.3 million)
Waterworks ($13.6 million)
Sanitary Sewer ($10.5 million)
6.0% Vehicle & Equipment Replacement Reserves ($8.1 million)
66.0% Capital Reserves ($97.6 million)
16.0% Utilities Reserve ($24.1 million)
5.0% Gaming ($7.7 million)
4.0% Development Cost Charges ($6.0 million)
3.0% Other ($4.8 million)
Capital Plan 85
Did you know that 25% of City land is preserved for park, conservation and greenspace? That’s over 5,500 acres for you to enjoy!
2015 CAPITAL PROGRAM INVESTMENT
(BY ASSET TYPE)
2015 CAPITAL INVESTMENT by Asset TypeTOTAL | $148.8 million
The Capital Plan presents the costs of purchasing, constructing, improving and replacing City infrastructure. The City is planning to invest $149 million in 2015. Of this, $30 million (20%) will be spent on acquiring land (including parkland) and land improvements, $59 million (40%) will be spent on infrastructure including roads, water and sewer, $28 million (19%) on municipal buildings, $31 million (21%) on vehicles and equipment.
The operational impact of these works has been incorporated where appropriate within the five year operating plan.
2015 CAPITAL INVESTMENT
(BY FUNDING SOURCE)
There are numerous sources of funding used to finance the capital projects identified in the City’s five year Capital Plan.
2015 CAPITAL INVESTMENT by Funding SourceTOTAL | $148.3 million
The Capital Plan is funded by six main sources of funding. In 2015, the City is planning to fund $149 million of capital expenditures as follows: $38 million (26%) will be funded by Capital Reserves: Corporate & Tax Sale Land and Capital Works Financing Reserves, $68 million (46%) will be funded by the Vehicle and General Replacement Reserves, $24 million (16%) will be funded by the Utilities Reserves, $8 million (5%) will be funded by the Gaming Fund, $6 million (4%) will be funded by Development Cost Charges Reserves and Community Benefit Bonus Fund, and $5 million (3%) will be funded from other sources.

86 Capital Plan
CAPITAL RESERVES & FUNDS
Capital reserves and funds comprise the major funding source for capital projects.
CAPITAL RESERVES
Corporate & Tax Sale Land and Capital Works Financing Reserves
These two main sources of internal financing for capital works are designated for the purchase and replacement of capital assets. The Corporate & Tax Sale Land Reserve and Capital Works Financing Reserve together make up the Capital Works Machinery & Equipment Reserve. The sources of funding for these reserves is interest earned on the fund, depreciation contributions from the Annual Operating Budget and the proceeds from land sales. As these are statutory reserves, funding from these reserves require Council approval through a bylaw.
DEVELOPMENT COST CHARGES RESERVES & COMMUNITY BENEFIT BONUS FUND
Development Cost Charges Reserves
Development cost charges reserves are used to finance specific capital works from levies on development in the surrounding area.
The City has five Development Cost Charge Reserves:• Parkland Acquisition Levy• Metrotown Public Open Space Levy• Canada Way Pedestrian Bridge Levy• Metrotown Grade – Separated Pedestrian Linkages Levy• Edmonds Town Centre South Grade-Separated Crossings Levy These are statutory reserves. Funding from these reserves requires Council approval through a bylaw.
Community Benefit Bonus Fund
This reserve was established for cash-in-lieu deposits allocated for the provision of amenities that benefit the community.
The community benefit bonus is a system of exchange where the developer is allowed to increase density in return for provision of an amenity. Cash-in-lieu for the development of an amenity is collected when it is impractical to provide the amenity at the time of development.
Since adoption, the Community Benefit Bonus Program has proven very successful. In 2010, Council advanced an amendment to the Burnaby Zoning Bylaw to provide for a Supplementary Community Benefit Bonus Policy. The overall objective is to allow for the accommodation of increased residential density in the four town centres consistent with the goals of the City’s official Community Plan and other strategies such as the Economic Development Strategy.

Capital Plan 87
VEHICLE & EQUIPMENT REPLACEMENT RESERVES
Vehicle & Special Equipment Replacement Reserves
These reserves are designated for the replacement of vehicles and equipment. The main source of funding for these reserves is interest earned on the fund and depreciation contributions from the Annual Operating Budget. This reserve is not statutory. Each asset to be replaced is specifically identified during the budget process and itemized for replacement. Budgeted expenditures are approved by the passing of the 2015 Annual Plan Bylaw and authorization approval by the appropriate level of authority.
GAMING FUND
This reserve is designated for environmental, heritage, arts and cultural, safety and security projects. Funding for the reserve is provided by the Provincial government based on a 10% share of the net proceeds of gaming from the casino facility located within the municipality.
OTHER RESERVES & FUNDS
Local Improvement Levy
The Local Improvement reserve is maintained through the provision of Local Area Service Taxes imposed on property owners who have benefitted from local improvements works undertaken by the City. The levy imposed for each property is based on the taxable frontage of land that abuts each development. The fund earns investment income interest. Levy repayment terms and interest rates are based on the type of improvement works undertaken. Property owners have the option of paying off their entire commitment in the first year of billing, and if done so by the due date for taxes, will incur no interest.
This is a statutory reserve. Replenishment of the fund is undertaken through a Burnaby Local Service Tax Bylaw, set for newly completed projects.
Gaming Interest Fund
In 2013, Council adopted a policy to allocate the interest earnings on the Gaming Fund to be used for one-time operating projects. Authority to approve these projects has been delegated by Council to the Financial Management Committee.
Gas Tax Fund
Federal government grant funding is provided annually based on specified criteria for infrastructure type projects. Council approves the utilization of these funds based on recommendations by the Financial Management Committee of Council.
UTILITY FUND
The Waterworks Utility and the Sanitary Sewer Capital funds are self-sustaining. These funds are designated for the purchase and replacement of water and sewer infrastructure respectively. The main sources of funding for these funds are depreciation contributions from their respective Utility Operating budgets and interest earned on each of the respective capital funds. Appropriations to and expenditures from these funds are controlled by the budget process and Council approval is required for capital expenditures from these funds.

2014 2015 2016 2017 2018 2019Budget Budget Budget Budget Budget Budget
Capital Revenue
General Revenue Fund Contributions 54,776 56,349 59,549 62,849 66,249 69,749 Utility Funds Contribution 26,070 27,622 26,591 25,714 24,637 24,211 Investment Income 31,100 31,000 34,442 34,128 33,746 34,648 Development Cost Charges 3,000 3,000 3,000 3,000 3,000 3,000 Density Bonus 35,000 50,000 50,000 50,000 50,000 50,000 Gaming Fund Proceeds 9,500 9,500 9,500 9,500 9,500 9,500 Private Funds, Grants & Others 5,322 4,787 4,646 3,490 3,490 3,490 Proceeds from the Sale of Assets 7,929 7,963 8,000 9,000 10,000 10,000
TOTAL CAPITAL REVENUE 172,697 190,221 195,728 197,681 200,623 204,599
TOTAL CAPITAL EXPENDITURES (134,245) (148,765) (203,015) (206,534) (179,691) (142,317)
Increase in Capital Reserves 38,452 41,456 (7,287) (8,853) 20,932 62,281
88 Capital Plan
CAPITAL RESERVES
Funding for capital programs are provided from the following sources (in thousands):

The City advances capital projects to serve a growing population, provide new amenities, support new development, promote social and environmental sustainability, and continue infrastructure renewal.

2016Budget ($)
2017Budget ($)
2018Budget ($)
2019Budget ($)
CAPITAL EXPENDITURES
City ManagerFire 1,910,000 2,810,000 5,675,000 5,650,000 4,930,000 Police 2,030,000 - - 200,000 - Library 1,833,800 1,638,400 1,617,400 1,698,300 1,698,300 Clerks 69,500 - 1,800,000 - - Information Technology 18,110,500 24,407,000 21,515,000 17,679,000 8,261,000 Contingency 500,000 500,000 500,000 500,000 500,000
Subtotal City Manager 24,453,800 29,355,400 31,107,400 25,727,300 15,389,300
EngineeringRoads (Various) 11,084,000 10,210,000 9,660,000 9,660,000 9,710,000 Traffic Management 3,382,500 2,700,000 2,650,000 2,650,000 2,650,000 Major Roads 8,905,000 8,480,000 8,000,000 8,000,000 8,100,000 Storm Sewer 4,825,000 5,300,000 5,350,000 5,350,000 5,850,000 Vehicles & Equipment 7,528,000 2,927,000 4,760,000 4,277,000 2,449,500 Local Area Services 6,560,000 2,630,000 2,630,000 2,630,000 2,630,000 City Buildings 14,347,000 24,915,000 23,347,500 18,467,500 3,132,500 Energy Performance Programs 300,000 250,000 250,000 250,000 250,000 Utilities - Sanitary Sewer 10,480,000 10,775,000 10,275,000 10,375,000 10,375,000 Utilities - Waterworks 13,570,000 12,800,000 12,800,000 12,800,000 12,800,000
Subtotal Engineering 80,981,500 80,987,000 79,722,500 74,459,500 57,947,000
FinanceFacility Replacement & Improvement 627,300 500,000 2,000,000 2,050,000 - Equipment Acquisition 200,000 170,000 185,000 125,000 125,000
Subtotal Finance 827,300 670,000 2,185,000 2,175,000 125,000
Planning & BuildingCommunity Plan Implementation 1,550,000 1,825,000 375,000 375,000 375,000 Community Amenity Program Priorities 500,000 31,000,000 30,000,000 30,000,000 30,000,000 Urban Trails 1,092,500 2,000,000 1,000,000 1,000,000 1,000,000 Bicycle Program 75,000 750,000 1,000,000 1,000,000 1,250,000 Land Assembly & Development 7,963,400 8,000,000 9,000,000 10,000,000 10,000,000 City Hall/Buildings 1,799,400 - - - -
Subtotal Planning & Building 12,980,300 43,575,000 41,375,000 42,375,000 42,625,000
2015Budget ($)
90 Capital Plan
2015–2019 CAPITAL PLAN

2016Budget ($)
2017Budget ($)
2018Budget ($)
2019Budget ($)
2015Budget ($)
Parks, Recreation & Cultural ServicesVehicles 866,000 2,593,000 2,324,000 959,000 1,571,000 Property Acquisitions 6,000,000 3,000,000 3,000,000 3,000,000 3,000,000 Park Facilities 11,569,400 7,195,000 7,645,000 6,260,000 6,410,000 Recreation Facilities 5,057,100 29,140,000 34,365,000 23,000,000 13,415,000 Cultural Facilities 3,355,000 3,875,000 3,160,000 660,000 555,000 Golf Facilities 2,675,000 2,625,000 1,650,000 1,075,000 1,280,000
Subtotal Parks 29,522,500 48,428,000 52,144,000 34,954,000 26,231,000
TOTAL CAPITAL EXPENDITURES 148,765,400 203,015,400 206,533,900 179,690,800 142,317,300
FUNDING SOURCES
Capital Reserves 97,546,500 111,205,400 114,744,900 96,364,800 78,076,800 Vehicle & Equipment Replacement Reserves 8,114,000 6,545,000 8,424,000 6,661,000 5,325,500 Utilities Reserve 24,125,000 23,575,000 23,075,000 23,175,000 23,175,000 Gaming 7,693,400 23,043,750 23,800,000 17,000,000 2,250,000 Development Cost Charges & Community Benefit Bonus 6,500,000 34,000,000 33,000,000 33,000,000 30,000,000
Other 4,786,500 4,646,250 3,490,000 3,490,000 3,490,000
TOTAL CAPITAL FUNDING SOURCES 148,765,400 203,015,400 206,533,900 179,690,800 142,317,300
Capital Plan 91
2015–2019 CAPITAL PLAN

2015Budget ($)
2016Budget ($)
2017Budget ($)
2018 Budget ($)
2019Budget ($)
CAPITAL EXPENDITURES
City ManagerFire Fire Station #1 - New Training Facility & Tarmac Resurfacing 300,000 600,000 600,000 - -
Fire Station #4 Replacement - Design & Construction 80,000 500,000 3,000,000 3,100,000 - Fire Station #8 Replacement - Design & Construction - - 80,000 500,000 3,000,000Boat House Structures - 30,000 - - -Command Unit Replacements 660,000 - - - -Engine Replacements - 1,000,000 1,000,000 - 1,000,000Ladder Replacements - - - 1,400,000 -Special Unit Replacements - - 250,000 - 250,000Fire Vehicle Replacements 130,000 - 65,000 - 30,000
1 Turn Out Gear Replacement 320,000 320,000 320,000 320,000 320,000Ongoing General Equipment Replacement 420,000 360,000 360,000 330,000 330,000
Subtotal Fire 1,910,000 2,810,000 5,675,000 5,650,000 4,930,000Police
2 Locker Room Upgrades & Secondary Emergency Exit 1,728,600 - - - -Renovations & Upgrades 301,400 - - 200,000 -
Subtotal Police 2,030,000 - - 200,000 -LibraryShelving & Equipment 200,000 21,000 - - -
3 Library Vehicle Replacements 140,000 - - - -Library Materials 1,493,800 1,617,400 1,617,400 1,698,300 1,698,300
Subtotal Library 1,833,800 1,638,400 1,617,400 1,698,300 1,698,300Clerks Heritage Scanning, Archives Digitization & Archives Expansion 69,500 - 1,800,000 - -
Subtotal Clerks 69,500 - 1,800,000 - -Information TechnologyWorkstation Replacement 931,900 1,110,000 995,000 880,000 905,000Servers & Storage 750,500 932,000 1,355,000 1,220,000 325,000Networking, Communications & Security 2,808,500 5,565,000 5,360,000 3,614,000 3,743,000Budgets & Reporting Restructuring - 200,000 485,000 615,000 -Tax & Revenue Management 550,000 1,850,000 2,205,000 2,000,000 225,000Decentralized Time Entry 300,000 400,000 250,000 850,000 -Electronic Recruitment & Position Management - 150,000 390,000 150,000 150,000Capital Asset Lifecycle Management 1,915,000 2,500,000 - - -Electronic Data Records Management System 175,000 20,000 1,090,000 1,315,000 555,000
4 Licences, Permits & Inspections System 6,175,000 5,620,000 2,900,000 - -Hansen Conversion - 250,000 1,800,000 2,000,000 300,000Enterprise Application Enhancements 3,080,000 4,380,000 4,375,000 4,485,000 1,913,000Business System Enhancements 1,424,600 1,430,000 310,000 550,000 145,000
Subtotal Information Technology 18,110,500 24,407,000 21,515,000 17,679,000 8,261,000Contingency 500,000 500,000 500,000 500,000 500,000
TOTAL CAPITAL EXPENDITURES 24,453,800 29,355,400 31,107,400 25,727,300 15,389,300
2015–2019 CAPITAL PLAN SUMMARY | CITY MANAGER

2015Budget ($)
2016Budget ($)
2017Budget ($)
2018 Budget ($)
2019Budget ($)
FUNDING SOURCES
Capital Reserves 23,494,300 28,355,400 27,992,400 24,327,300 14,109,300Vehicle & Equipment Replacement Reserves 890,000 1,000,000 1,315,000 1,400,000 1,280,000Gaming 69,500 - 1,800,000 - -
TOTAL CAPITAL FUNDING SOURCES 24,453,800 29,355,400 31,107,400 25,727,300 15,389,300
Capital Plan 93
2015–2019 CAPITAL PLAN SUMMARY | CITY MANAGER
HIGHLIGHTS | CITY MANAGER
THERMAL IMAGING CAMERA REPLACEMENTFIRE
In 2015, the Burnaby Fire Department will replace a portion of their Thermal Imaging Cameras (TICs), which is estimated to cost $30,000. The TIC display translates the heat signatures and movement of heat to interior fire attack team. The images given to firefighters allows for the identification of hazardous environment conditions and changes in conditions when visibility is zero and personnel senses are reduced by firefighting Personal Protective Equipment (PPE) encapsulation. The TIC is critical in identifying differences in the heat retention of furnishings and human occupants, providing a valuable tool for rapid search and rescue operations to save lives within fire areas. This project is funded by the Capital Replacement Reserve.
LOCKER ROOM UPGRADESPOLICE
This project entails upgrades to both the men’s and the women’s locker rooms at the Burnaby RCMP Detachment. The men’s locker room requires upgrades to the life safety systems, including construction of a new exit stairwell for secondary emergency egress. The men’s locker room will also undergo replacement of the plumbing fixtures, lockers, and lighting. The current women’s locker room is divided into two separate rooms and this project will allow for the two rooms to be connected as well as the replacement of lockers, flooring, and plumbing facilities. Total project cost in 2015 is estimated at $1,728,000 and is funded by the Capital Replacement Reserve.
LICENCE, INSPECTION AND PERMIT SYSTEMINFORMATION TECHNOLOGY
Starting spring 2015, the City will begin the design and implementation of a new system capable of delivering greater online access to services and information to citizens. The new system will also support improved internal business processes, including mobile access to applications for City staff and electronic plan checking. This will be a multi-phase project with new services and functionality being delivered over a two year period. Total project cost is estimated at $6,175,000 and is funded by the Capital Works Machinery and Equipment Reserve.
POP-UP LIBRARIESLIBRARY
Pop-Up Libraries enable BPL to make a connection with our community, in our community, in a new and exciting way. A Pop-Up Library is a “micro-library” brought to events around Burnaby, where visitors can borrow material, sign up for a library card, meet staff, and learn more about library membership and services.
The addition of a community outreach vehicle, which is estimated to cost $40,000, equips our staff to be a more active part of our community; it enables us to plan more outreach visits and pop-up branches without logistical impediments, and supports our direction in creating opportunities for people to engage with the library in new ways. This vehicle is funded by the Capital Works Machinery and Equipment Reserve.
1
3
2 4

2015Budget ($)
2016Budget ($)
2017Budget ($)
2018 Budget ($)
2019Budget ($)
CAPITAL EXPENDITURES
EngineeringCity Roads Rehabilitation Programs 9,845,000 9,210,000 8,660,000 8,660,000 8,710,000Bridge Rehabilitation 1,239,000 1,000,000 1,000,000 1,000,000 1,000,000
Roads (Various) 11,084,000 10,210,000 9,660,000 9,660,000 9,710,000Traffic Signals & Street Lighting Replacement Program 1,492,500 950,000 900,000 900,000 900,000 Streetlight Pole Replacement Program 1,450,000 1,300,000 1,300,000 1,300,000 1,300,000Bus Shelter Program 440,000 450,000 450,000 450,000 450,000
Traffic Management 3,382,500 2,700,000 2,650,000 2,650,000 2,650,000Major Intersection Improvements 8,905,000 8,480,000 8,000,000 8,000,000 8,100,000Storm Sewer Rehabilitation & Replacement Program 4,825,000 5,300,000 5,350,000 5,350,000 5,850,000Vehicle & Equipment Replacement 7,528,000 2,927,000 4,760,000 4,277,000 2,449,500Local Area Services 6,560,000 2,630,000 2,630,000 2,630,000 2,630,000Still Creek Works Yard Developments 4,666,000 - - - - Laurel Street Service Centre Improvement 5,000,000 20,000,000 20,000,000 15,000,000 - Minor Building Renovations 4,681,000 4,915,000 3,347,500 3,467,500 3,132,500
City Buildings 14,347,000 24,915,000 23,347,500 18,467,500 3,132,500Energy Performance Programs 300,000 250,000 250,000 250,000 250,000 Utilities - Waterworks 13,570,000 12,800,000 12,800,000 12,800,000 12,800,000Utilities - Sanitary Sewer 10,480,000 10,775,000 10,275,000 10,375,000 10,375,000
TOTAL CAPITAL EXPENDITURES 80,981,500 80,987,000 79,722,500 74,459,500 57,947,000
FUNDING SOURCES
Capital Reserves 40,988,900 31,195,000 28,597,500 28,717,500 29,032,500Vehicle & Equipment Replacement Reserves 6,278,000 2,827,000 4,660,000 4,177,000 2,349,500Utilities Reserve 24,125,000 23,575,000 23,075,000 23,175,000 23,175,000Gaming 5,899,600 20,000,000 20,000,000 15,000,000 - Other 3,690,000 3,390,000 3,390,000 3,390,000 3,390,000
TOTAL CAPITAL FUNDING SOURCES 80,981,500 80,987,000 79,722,500 74,459,500 57,947,000
94 Capital Plan
2015 CAPITAL PLAN SUMMARY | ENGINEERING
1
2
3
4
5

Capital Plan 95
RESTORATION OF GRAY CREEKAs part of our commitment to the Metro Vancouver’s Integrated Liquid Waste and Resource Management Plan and the Byrne Creek Integrated Stormwater Management Plan, the City is planning to remediate erosion sites in Gray Creek that are impacting watershed health and increasing maintenance requirements downstream. Gray Creek ravine exhibits extensive localized erosion typical urban stream bank erosion resulting from urban stream hydraulics (i.e. increased peak flows and flashiness owing to urbanized catchments with impervious surfaces and limited source controls). The approach will combine hard engineering solutions with alternative softer treatment (bioengineering, etc.) for a hybrid solution that will restore watershed health. Total project cost in 2015 is estimated at $600,000 and is funded by the Capital Replacement Reserves.
HASTINGS STREET IMPROVEMENTHastings Street upgrades continue from Madison to Gilmore with pavement rehabilitation, storm main replacement, and watermain upgrades. Construction estimated at $1.28M is coordinated to ensure a successful Giro de Burnaby and Hats Off Day Parade.
RE-ROOFING PROGRAMAs the City facilities age over time, the roofs are planned for replacement as they approach the end of their useful service life. An annual re-roofing program is in place to proactively replace the roofs on a prioritized basis to maximize the building assets while avoiding interior damage and disruption to the public and programming activities. In 2015, the re-roofing program will replace approximately 8 to 9 roofs. Total project cost is estimated at $1.2M and is funded by the Capital Replacement Reserves.
SINGLE FAMILY & MULTI-FAMILY GLASS RECYCLING PROGRAMIn 2013, Multi-Material BC (MMBC), an industry-led and funded non-profit organization, took over responsibility for managing recycling on behalf of producers. The City now acts as a contractor for MMBC, collecting materials on its behalf. One of the requirements stipulated by MMBC is that glass at curbside and at multi-family complexes must be collected separately. In order to continue the collection of glass material from curbside and multi-family residents serviced by the City, the City is implementing the grey box/toter program. These changes, along with the new expanded list of accepted materials, will help Burnaby meet our regional goal of 70% waste diversion by 2015. Total cost for purchase and distribution is estimated at $550,000 and is funded by the Capital Replacement Reserves.
HIGHLIGHTS | ENGINEERING
STREETLIGHT REPLACEMENT PROGRAMAn annual program to replace all City-owned High Pressure Sodium (HPS) streetlights with energy saving Light Emitting Diode (LED) streetlights will be initiated in 2015 at an estimated cost of $1,150,000. Trial installations of new LED streetlights along Lougheed Highway have been successful. The replacement of HPS luminaires with LED luminaires is anticipated to reduce costs over the life of the fixture because they are more energy efficient, and have a longer life which reduces maintenance requirements. LED lights also produce a whiter light that allows for better colour distinction compared to the yellow HPS lights. The program will take advantage of BC Hydro Power Smart funding opportunities and is also funded by the City’s Capital Replacement Reserves.
1
2 3
4
5

2015Budget ($)
2016Budget ($)
2017Budget ($)
2018 Budget ($)
2019Budget ($)
CAPITAL EXPENDITURES
FinanceDeer Lake Centre Renovations 116,300 500,000 2,000,000 2,050,000 - Tenant Property Improvements 511,000 - - - -
Facility Replacement & Improvement 627,300 500,000 2,000,000 2,050,000 - Print Shop Equipment 120,000 45,000 60,000 - - Fleet Vehicle Replacement 80,000 125,000 125,000 125,000 125,000
Equipment Acquisition 200,000 170,000 185,000 125,000 125,000
TOTAL CAPITAL EXPENDITURES 827,300 670,000 2,185,000 2,175,000 125,000
FUNDING SOURCES
Capital Reserves 747,300 545,000 2,060,000 2,050,000 - Vehicle & Equipment Replacement Reserves 80,000 125,000 125,000 125,000 125,000
TOTAL CAPITAL FUNDING SOURCES 827,300 670,000 2,185,000 2,175,000 125,000
2015Budget ($)
2016Budget ($)
2017Budget ($)
2018 Budget ($)
2019Budget ($)
CAPITAL EXPENDITURES
PlanningCommunity Plan Implementation 1,550,000 1,825,000 375,000 375,000 375,000 Community Amenity Program Priorities 500,000 31,000,000 30,000,000 30,000,000 30,000,000Urban Trail Program 1,167,500 2,750,000 2,000,000 2,000,000 2,250,000 Land Assembly & Development 7,963,400 8,000,000 9,000,000 10,000,000 10,000,000City Hall Renovations & Upgrades 1,799,400 - - - -
TOTAL CAPITAL EXPENDITURES 12,980,300 43,575,000 41,375,000 42,375,000 42,625,000
FUNDING SOURCES
Capital Reserves 9,809,500 8,275,000 9,275,000 10,275,000 10,275,000Community Benefit Bonus Reserve 500,000 31,000,000 30,000,000 30,000,000 30,000,000Gaming 1,724,300 3,043,750 2,000,000 2,000,000 2,250,000 Other 946,500 1,256,250 100,000 100,000 100,000
TOTAL CAPITAL FUNDING SOURCES 12,980,300 43,575,000 41,375,000 42,375,000 42,625,000
1
2
96 Capital Plan
2015 CAPITAL PLAN SUMMARY | FINANCE
2015 CAPITAL PLAN SUMMARY | PLANNING & BUILDING

Capital Plan 97
HIGHLIGHTS | PLANNING & BUILDING
GILMORE URBAN TRAILThe City plans to complete the popular Gilmore Urban Trail in 2016. This project will construct a missing section of the trail on the west side of Gilmore Avenue/Diversion from Still Creek Drive to Canada Way. Part of the larger 3.3km Gilmore Urban Trail from Williams Street by Willingdon Heights Park to Sanderson Way at Electronic Arts, the trail will provide an accessible, pedestrian and cyclist friendly link to the Gilmore SkyTrain Station, connect to the Central Valley Greenway as well as the Sea to River Bikeway. Design was approved by Council in 2014, with construction expected to be completed in 2016. Cost-sharing funding with Translink has been obtained by the City for the design, with potential grant funding being sought for the construction works. Project cost for 2015 is planned at $738,500. The City’s share of the cost will be funded by the Gaming Fund.
CITY HALL – A/V SYSTEM UPGRADESThere will be improvements made to the audio-visual system in the Council Chambers to improve the quality of sound within the Chambers, and for those watching proceedings online and via public television. Total project cost is estimated at $750,000 and is funded by the Capital Works Machinery and Equipment Reserve.
1 2

2015Budget ($)
2016Budget ($)
2017Budget ($)
2018 Budget ($)
2019Budget ($)
CAPITAL EXPENDITURES
Parks, Recreation & Cultural ServicesParks Vehicle Replacement 866,000 2,593,000 2,324,000 959,000 1,571,000Parkland Acquisition (including Deer Lake Property) 6,000,000 3,000,000 3,000,000 3,000,000 3,000,000Burnaby Lake Sports Complex Sports Field Development 1,710,800 500,000 1,500,000 1,500,000 1,500,000Artificial Turf Field Replacements 60,000 1,010,000 1,010,000 950,000 - Central Park Developments 1,123,300 500,000 500,000 500,000 500,000 Edmonds Park Redevelopment 2,140,000 450,000 - - - General Parks Facilities Replacements/Improvements 1,557,400 1,450,000 800,000 325,000 325,000 Playground Replacements 1,040,300 860,000 685,000 685,000 510,000 Park Facilities General Development 3,937,600 2,425,000 3,150,000 2,300,000 3,575,000
Park Facilities 11,569,400 7,195,000 7,645,000 6,260,000 6,410,000 Burnaby Lake Arena - Feasibility Study,Design, Construction 350,000 7,500,000 7,500,000 - -
Bonsor Centre Seniors Space & Change Room Improvements 1,841,100 1,100,000 1,100,000 - -
Burnaby Lake Precinct Covered Sports Box 150,000 1,500,000 1,500,000 - - Cameron Rec Centre Facility Upgrade 65,000 - 3,000,000 6,000,000 - CG Brown Pool Design & Construction 365,000 17,000,000 20,000,000 10,000,000 -
Eileen Dailly Pool & Confederation Recreation Complex Renovations 105,000 1,000,000 300,000 6,000,000 13,000,000
Swangard Stadium Running Track Replacement 1,104,000 - - - - Recreation Facilities Replacements/Improvements 1,077,000 1,040,000 965,000 1,000,000 415,000
Recreation Facilities 5,057,100 29,140,000 34,365,000 23,000,000 13,415,000Shadbolt Centre Replacements/Improvements 1,620,000 1,380,000 910,000 410,000 340,000 Burnaby Village Museum & Art Gallery Improvements 1,735,000 2,495,000 2,250,000 250,000 215,000
Cultural Facilities 3,355,000 3,875,000 3,160,000 660,000 555,000 Kensington Pitch & Putt Upgrades/Construct 9-Hole Course 655,000 1,700,000 750,000 - 75,000 Riverway Golf Course Dining Room & Facility Upgrades 680,000 250,000 300,000 900,000 550,000 Burnaby Mtn Eagle Creek Golf Course & Facility Upgrades 1,340,000 675,000 600,000 175,000 655,000
Golf Facilities 2,675,000 2,625,000 1,650,000 1,075,000 1,280,000
TOTAL CAPITAL EXPENDITURES 29,522,500 48,428,000 52,144,000 34,954,000 26,231,000
FUNDING SOURCES
Capital Reserves 22,506,500 42,835,000 46,820,000 30,995,000 24,660,000Vehicle & Equipment Replacement Reserves 866,000 2,593,000 2,324,000 959,000 1,571,000Development Cost Charges & Community Benefit Bonus 6,000,000 3,000,000 3,000,000 3,000,000 - Other 150,000 - - - -
TOTAL CAPITAL FUNDING SOURCES 29,522,500 48,428,000 52,144,000 34,954,000 26,231,000
3
2
1
98 Capital Plan
2015 CAPITAL PLAN SUMMARY | PARKS, RECREATION & CULTURAL SERVICES

Capital Plan 99
HIGHLIGHTS | PARKS, RECREATION & CULTURAL SERVICES
CONFEDERATION PARK PLAYGROUNDThe renovated Confederation Park Playground was officially opened on July 21. Built in-house by the City of Burnaby staff, the 700 square metre playground features amenities for preschoolers and children, including a multi-person see-saw, spinner bowls, child-size picnic tables, swing sets, a climbing rock and more.
The accessible and integrated playground space and water play area are a great addition to the park’s current amenities, walking track, picnic areas, tennis courts, skate park and grass fields.
Planned cost for 2015 improvements is estimated at $352,000 and is primarily funded by the Capital Works Machinery and Equipment Reserve.
EDMONDS PARK OUTDOOR PLAZAThe Edmonds Park Outdoor Plaza was officially opened on July 1st. The plaza is a multi-functional and multi-generational public space. The outdoor venue is suited for outdoor play, community events (local farmers and artisans markets) and entertainment.
Future park expectancies include a children’s playground, water play area, half basketball courts and a walking circuit- complementing and encouraging both indoor and outdoor programs at Edmonds Community Centre.
Planned cost for 2015 improvements is estimated at $2,140,000 and is funded by the Capital Works Machinery and Equipment Reserve.
CENTRAL PARK OUTDOOR FITNESS CIRCUITOfficially opened on May 10th, an outdoor fitness circuit with 12 fitness stations. Promoting sustainable fitness within Central Park. The equipment is designed to focus on one of the following areas: cardiovascular, balance, strength and flexibility. The outdoor Fitness Circuit is environmentally made from 100% recyclable materials: recycled steel to recycled rubberized surfacing. A total of 13,998 lbs. of rubber was used, which 11,771 lbs. of rubber came from recycled scrap ties in BC.
2015 improvements to Central Park are estimated at $1,123,300 and is funded by the Capital Works Machinery and Equipment Reserve.
1 2 3

2015Budget ($)
2016Budget ($)
2017Budget ($)
2018Budget ($)
2019Budget ($)
Land & Land Improvements 30,258,300 27,480,000 25,145,000 21,985,000 23,020,000 Infrastructure & Contingency 59,306,500 53,395,000 51,865,000 51,965,000 52,615,000 Buildings 28,303,800 87,770,000 96,447,500 78,272,500 49,952,500 Vehicles & Equipment 30,896,800 34,370,400 33,076,400 27,468,300 16,729,800
148,765,400 203,015,400 206,533,900 179,690,800 142,317,300
100 Capital Plan
2015–2019 CAPITAL PLAN | ASSET SUMMARY
The City of Burnaby’s vision as a livable, sustainable and thriving City provides a roadmap for the future.

CapitalReserves
Vehicle & Equipment
ReplacementReserves
UtilitiesReserve
DCC/Comm Benefit
ReserveFunds
GamingFunds
OtherReserve
Funds2015
BudgetGENERAL GOVERNMENT
Tenant Property Improvements 11,000 - - - - - 11,000
11,000 - - - - - 11,000
Artificial Turf Field Replacements 60,000 - - - - - 60,000Burnaby Lake Precinct Covered Sports Box 150,000 - - - - - 150,000
Burnaby Lake Sports Complex Sports Field Development 1,610,800 - - - - - 1,610,800
Burnaby Mountain Eagle Creek Golf Course and Restaurant Upgrades 410,000 - - - - - 410,000
Burnaby Village Museum and Art Gallery Upgrades 570,000 - - - - - 570,000
Central Park Perimeter Trail/Parking Lot/ Development 1,023,300 - - - - - 1,023,300
Edmonds Park Redevelopment 2,140,000 - - - - - 2,140,000General Parks Facilities Equipment Replacements/Improvements 1,357,400 - - - - 150,000 1,507,400
Kensington Pitch and Putt Upgrades/Construct 9-Hole Course 430,000 - - - - - 430,000
Park Facilities General Development 3,804,600 - - - - - 3,804,600Parkland Acquisition (including Deer Lake Property) - - - 6,000,000 - - 6,000,000
Playground Replacements 1,040,300 - - - - - 1,040,300Riverway Golf Course Dining Room and Kitchen Upgrades 250,000 - - - - - 250,000
Shadbolt Centre Replacements/Improvements 75,000 - - - - - 75,000
12,921,400 - - 6,000,000 - 150,000 19,071,400
PLANNING & BUILDING- -
Community Plan Implementation 150,000 - - - 831,250 568,750 1,550,000
Community AmenityProgram Priorities - - - - - - -
Land Assembly and Development 7,785,100 - - - 173,300 - 7,958,400Urban Trail Program 75,000 - - - 714,750 377,750 1,167,500
8,010,100 - - - 1,719,300 946,500 10,675,900
20,942,500 - - 6,000,000 1,719,300 1,096,500 29,758,300
PARKS, RECREATION & CULTURAL SERVICES
2015 CAPITAL PROGRAM | LAND & LAND IMPROVEMENTS

CapitalReserves
Vehicle & Equipment
ReplacementReserves
UtilitiesReserve
DCC/CommBenefit
ReserveFunds
GamingFunds
OtherReserve
Funds2015
Budget
- - - - - - -Contingency 500,000 - - - - - 500,000
500,000 - - - - - 500,000
Bridge Rehabilitation 1,089,000 - - - 150,000 - 1,239,000 Bus Shelter Program 440,000 - - - - - 440,000 City Roads Rehabilitation Programs 6,505,000 - - - - 3,340,000 9,845,000 Local Area Services 6,560,000 - - - - - 6,560,000 Major Intersection Improvements 8,905,000 - - - - - 8,905,000 Sanitary Sewermain Renewal Program - - 10,480,000 - - - 10,480,000
Storm Sewer Rehabilitation and Replacement Program 4,475,000 - - - - 350,000 4,825,000
Streetlight Pole Replacement Program 1,450,000 - - - - - 1,450,000
Traffic Signals and Street Lighting Replacement Program 1,268,200 - - - 224,300 - 1,492,500
Watermain Renewal Program - - 13,570,000 - - - 13,570,000
30,692,200 - 24,050,000 - 374,300 3,690,000 58,806,500
31,192,200 - 24,050,000 - 374,300 3,690,000 59,306,500
GENERAL GOVERNMENT
ENGINEERING
102 Capital Plan
2015 CAPITAL PROGRAM | INFRASTRUCTURE & CONTINGENCY

CapitalReserves
EquipmentReplacement
ReservesUtilitiesReserve
BenefitReserve
FundsGaming
Funds
OtherReserve
Funds2015
BudgetGENERAL GOVERNMENT
Business system enhancements 1,424,600 - - - - - 1,424,600Capital Asset Lifecycle Management 1,915,000 - - - - - 1,915,000Decentralized Time Entry 300,000 - - - - 300,000Electronic Data Records Management System 175,000 - - - - - 175,000
Enterprise Application Enhancements 3,080,000 - - - - - 3,080,000Fleet Vehicle Replacement - 80,000 - - - - 80,000Heritage Scanning, Archives Digitization and Archives Expansion - - - - 69,500 - 69,500
Library Materials 1,493,800 - - - - - 1,493,800Library Vehicle Replacements 40,000 100,000 - - - - 140,000Licences, Permits & Inspections System - - - - - - -
Networking, Communications and Security - - - - - - -
Print Shop Equipment 120,000 - - - - - 120,000Servers and Storage 750,500 - - - - - 750,500Tax and Revenue Management 550,000 - - - - - 550,000Workstation Replacement 931,900 - - - - - 931,900
10,780,800 180,000 - - 69,500 - 11,030,300
Burnaby Mountain Eagle Creek Golf Course and Restaurant Upgrades 50,000 - - - - - 50,000
Burnaby Village Museum and Art Gallery Upgrades - - - - - - -
Park Facilities General Development 75,000 - - - - - 75,000Parks Vehicle Replacement - 866,000 - - - - 866,000Recreation Facilities Replacements/Improvements 509,000 - - - - - 509,000
Shadbolt Centre Replacements/Improvements 290,000 - - - - - 290,000
924,000 866,000 - - - - 1,790,000
PARKS, RECREATION AND CULTURAL SERVICES
Capital Plan 103
2015 CAPITAL PROGRAM | BUILDINGS
Table continued on next page

CapitalReserves
EquipmentReplacement
ReservesUtilitiesReserve
BenefitReserve
FundsGaming
Funds
OtherReserve
Funds2015
Budget
Command Unit Replacements - 660,000 - - - - 660,000Fire Vehicle Replacements - 130,000 - - - - 130,000Ongoing General Equipment Replacement 420,000 - - - - - 420,000
Turn Out Gear Replacement 320,000 - - - - - 320,000
740,000 790,000 - - - - 1,530,000
ENGINEERING
Vehicle and Equipment Replacement 1,175,000 6,278,000 75,000 - - - 7,528,000
1,175,000 6,278,000 75,000 - - - 7,528,000
13,619,800 8,114,000 75,000 - 69,500 - 21,878,300
104 Capital Plan
2015 CAPITAL PROGRAM | BUILDINGS

CapitalReserves
EquipmentReplacement
ReservesUtilitiesReserve
BenefitReserve
FundsGaming
Funds
OtherReserve
Funds2015
BudgetGENERAL GOVERNMENT
Business system enhancements 1,424,600 - - - - - 1,424,600 Capital Asset Lifecycle Management 1,915,000 - - - - - 1,915,000 Decentralized Time Entry 300,000 - - - - 300,000 Electronic Data Records Management System 175,000 - - - - - 175,000
Enterprise Application Enhancements 3,080,000 - - - - - 3,080,000 Fleet Vehicle Replacement - 80,000 - - - - 80,000 Heritage Scanning, Archives Digitization and Archives Expansion - - - - 69,500 - 69,500
Library Materials 1,493,800 - - - - - 1,493,800 Library Vehicle Replacements 40,000 100,000 - - - - 140,000 Licences, Permits & Inspections System - - - - - - -
Networking, Communications and Security - - - - - - -
Print Shop Equipment 120,000 - - - - - 120,000 Servers and Storage 750,500 - - - - - 750,500 Tax and Revenue Management 550,000 - - - - - 550,000 Workstation Replacement 931,900 - - - - - 931,900
10,780,800 180,000 - - 69,500 - 11,030,300
Burnaby Mountain Eagle Creek Golf Course and Restaurant Upgrades 50,000 - - - - - 50,000
Burnaby Village Museum and Art Gallery Upgrades - - - - - - -
Park Facilities General Development 75,000 - - - - - 75,000 Parks Vehicle Replacement - 866,000 - - - - 866,000 Recreation Facilities Replacements/Improvements 509,000 - - - - - 509,000
Shadbolt Centre Replacements/Improvements 290,000 - - - - - 290,000
924,000 866,000 - - - - 1,790,000
PARKS, RECREATION AND CULTURAL SERVICES
Capital Plan 105
2015 CAPITAL PROGRAM | VEHICLES & EQUIPMENT
Table continued on next page

CapitalReserves
EquipmentReplacement
ReservesUtilitiesReserve
BenefitReserve
FundsGaming
Funds
OtherReserve
Funds2015
BudgetPROTECTIVE SERVICES
Command Unit Replacements - 660,000 - - - - 660,000 Fire Vehicle Replacements - 130,000 - - - - 130,000 Ongoing General Equipment Replacement 420,000 - - - - - 420,000
Turn Out Gear Replacement 320,000 - - - - - 320,000
740,000 790,000 - - - - 1,530,000
ENGINEERING
Vehicle and Equipment Replacement 1,175,000 6,278,000 75,000 - - - 7,528,000
1,175,000 6,278,000 75,000 - - - 7,528,000
13,619,800 8,114,000 75,000 - 69,500 - 21,878,300
106 Capital Plan
2015 CAPITAL PROGRAM | VEHICLES & EQUIPMENT

Sunrise at Barnet Marine Park
DEBT-FREE LIVABLE & VIBRANT BURNABY

PHOTOS CREDITS (BY ORDER OF APPEARANCE)
Cover Burnaby Mountain UniverCity City of BurnabyCover Brentwood Development Rendering Shape PropertiesCover Scandinavian Festival in Deer Lake Park Scandinavian CentreContents Metrotown Pedestrian Overpass City of BurnabyPg. 6 His Worship Mayor Derek Corrigan City of BurnabyPg. 7 Burnaby Mountain UniverCity City of BurnabyPg. 11 Burnaby Skyline as seen from Deer Lake Park Kenny LouiePg. 13 Metrotown Town Centre City of BurnabyPg. 14 Burnaby Mountain View JellybeanzPg. 16 Edmonds Community Centre City of BurnabyPg. 19 Infographic Map City of BurnabyPg. 21 Burnaby City Hall Nick KaranasosPg. 23 2015 Burnaby Mayor and Council City of BurnabyPg. 24 Burnaby City Hall Close Up Nick KaranasosPg. 26 Burnaby Fire Department City of BurnabyPg. 27 Burnaby Recycling Eco-Centre City of BurnabyPg. 28 Barnet Marine Park Shoreline C. GehlenPg. 29 Metrotown Towers Rendering Anthem PropertiesPg. 31 Burnaby at Night Alfred ShumPg. 32 Lougheed Station BC Ministry of Transportation Pg. 32 Burnaby Foreshore Park Susannah AndersonPg. 32 Burnaby Skyline Andy SmithPg. 32 Metrotown Pedestrian Overpass City of BurnabyPg. 32 Edmonds Community Centre CEI ArchitecturePg. 32 Aerial View of Burnaby and Greater Vancouver Area City of BurnabyPg. 41 Horse Eco-Sculpture Province of British ColumbiaPg. 45 Simon Fraser University Convocation Mall Kevin KrebsPg. 65 Walkway at Bob Prittie Library City of BurnabyPg. 82 Brentwood Plaza Rendering Shape PropertiesPg. 90 Sunset on Burnaby Mountain Derek K. MillerPg. 97 Burnaby Public Library Pop-up Library Burnaby Public LibraryPg. 99 Gray Creek, LED Streetlights on Lougheed City of BurnabyPg. 99 Gilmore Urban Trail CHP ArchitectsPg. 101 AV Equipment City of BurnabyPg. 103 Confederation Park City of BurnabyPg. 103 Edmonds Park Outdoor Plaza CEI ArchitecturePg. 103 Central Park Outdoor Fitness Circuit City of BurnabyPg. 111 Sunrise at Barnet Marine Park James Wheeler

PUBLISHED ON JANUARY 29, 2015