city of alamo, texas audited financial statements prepared ...piper pizza, pizza hut, and wingstop....
TRANSCRIPT


City of Alamo, Texas Audited Financial Statements
For the Year Ended September 30, 2018

CITY OF ALAMO, TEXASAnnual Financial Report
For the Year Ended September 30, 2018
Principal Officials
MAYOR
CITY COMMISSION
Luciano Ozuna, Jr. - City ManagerYvette Mendoza - Finance Director
OTHER OFFICIALS
Diana Martinez
Pete Morales – Mayor Pro-Tem Trino Medina – Commissioner PL. 1
Robert De La Garza – Commissioner PL. 3Maria Del Pilar Garza – Commissioner PL. 4

Introductory Section Page
Title Page
Principal Officials
Table of Contents
1-4
5
7
9-10
11-20
21
22-23
24
26
Reconciliation of Governmental Funds Balance Sheet to the Statement of Net Position 27
Statement of Revenues, Expenditures, and Changes in Fund Balance 28
Reconciliation of Governmental Funds Statements of Revenues, Expenditures, and
Changes in Fund Balance to the Statements of Activities 29
Proprietary Funds: 31
Statement of Net Position 32
Statement of Revenues, Expenses, and Changes in Net Position 33
Statement of Cash Flows 34
Notes to the Financials Statements 36-68
Required Supplemtary Information 69
Schedule of Funding Progress for Retirement Plan (Unaudited) 70
Schedule of Changes in Net Position Liability and Related Ratios (Last 10 Years) 71
Schedule of Revenues, Expenditures, and Changes in Fund Balance - Budget and Actual
General Fund 72
Schedule of Revenues, Expenditures, and Changes in Fund Balance - Budget and Actual
Alamo Economic Development Corporation 73
City of Alamo, Texas
Comprehensive Annual Financial Report
For the Year Ended September 30, 2018
Table of Contents
Basic Financial Statements:
Letter of Transmittal
City Organizational Chart
Financial Section
Independent Auditor's Report
Management's Discussion and Analysis
Balance Sheet
Government-Wide Financial Statements
Statement of Net Position
Statement of Activities
Fund Financial Statements:
Governmental Funds:

(Continued)
Other Supplementary Information Page
Schedule of Delinquent Taxes Receivable 75-76
Combining Balance Sheet - Non-Major Governmental Funds 77-78
Combining Statements of Revenues, Expenditures and Changes in Fund Balance 79-80
- Non Major Governmental Funds
Schedule of Revenues and Expenses to Indicate Net Revenue Available for Debt 81
Capital Assets used in the Operation of Governmental Funds 82
Capital Assets Used in the Operation of Governmental Funds
Comparative Schedule by Source 83
Capital Assets Used in the Operation of Governmental Funds
Schedule of Changes by Function and Activity 84
Capital Assets Used in the Operation of Governmetnal Funds
Schedule by Function and Activity 85
86
88
89-90
91
92
Governmental Activities Tax Revenues by Source 93
Assessed and Estimated Actual Value of Taxable Property 94
95
Principal Taxpayers 96
Property Tax Levies and Collections 97
Water Sewer Revenues 98
City of Alamo, Texas
Comprehensive Annual Financial Report
For the Year Ended September 30, 2018
Table of Contents (continued)
Fund Balances of Governmental Funds
Service
Statistical Section
Financial Trends:
Net Position By Component
Changes in Net Position
Changes in Fund Balances of Governmental Funds
Revenue Capacity:
Property Tax Rates Direct and Overlapping Governments

(continued)
Statistical Section Continued Page
Debt Capacity:
Ratio of Outstanding Debt by Type 99
Ratio of General Bonded Debt Outstanding 100
Direct and Overlapping Governmental Activities Debt 101
Computation of Legal Debt Margin 102
Pledge Revenue Coverage 103
Demograpgic and Economic Information:
Demographic and Economic Statistics 104
Principal Employers 105
Full-Time Equivalent City Government Employees by Function 106
107
108
Internal Control/ Compliance Section
Independent Auditor's Report on Internal Control over Financial Reporting and on
Compliance and Other Matters Based on an Audit of Financial Statements
Performed in Accordance with Governmental Auditing Standards 110-111
Schedule of Findings and Responses 112
Operating Information
City of Alamo, Texas
Comprehensive Annual Financial Report
For the Year Ended September 30, 2018
Table of Contents (continued)
Operating Indicators by Function
Capital Assets Statistics by Function

INTRODUCTORY SECTION
CITY OF ALAMO, TEXAS
This page left blank intentionally.

March 21, 2019
The Honorable Mayor, City Council
City of Alamo
Alamo, Texas
The Finance Department is pleased to submit the Comprehensive Annual Financial Report
(CAFR) for the City of Alamo, Texas for the fiscal year ended September 30, 2018. This report
is published to provide the City Council, City staff, our citizens, our bondholders, and other
interested parties with detailed information concerning the financial condition and activities of the
City government. Management assumes responsibility for both the accuracy of the data and the
completeness and fairness of the presentation, including all disclosures
We believe the data presented is accurate in all materials respects and is organized in a manner
designed to present fairly the financial position and results of operations of the City as measured
by the financial activity of its various funds.
Oscar R. Gonzalez, CPA & Associates, P.L.LC. Certified Public Accountants, have issued an
unmodified (“clean”) opinion on the City’s financial statements for the year ended September 30,
2018. The independent auditor’s report is located at the front of the financial section of this report.
Management’s Discussion and analysis (MD&A) immediately follows the independent auditors’
report and provides a narrative introduction, overview, and analysis of the basic financial
statements. This letter of transmittal is designed to complement MD&A and should be read in
conjunction with it. The MD&A can be found immediately following the report of the independent
auditor.
PROFILE OF THE GOVERNMENT
The City of Alamo, Texas was incorporated in May 12, 1924 under the laws of State of Texas and
adopted the Commission – Manager form of government with the adoption of its Charter on
January 20, 1979. The City’s Home Rule Charter provides for a Board of Commissioners form of
government, comprised of a Mayor and four Commissioners, along with a Municipal Judge,
elected by the people. The City Council is responsible for enacting ordinances, resolutions, and
regulation governing the City, appointing members of various statutory and advisory boards and
the City Manager, City Attorney, City Secretary, and Court Administrator. As chief administrative
officer, the City Manager is responsible for the enforcement of laws and ordinances, and appoints
and supervises the heads of department of the City organization.
The City provides the following municipal government services including police and fire
protection, municipal courts, highways and streets, water and sewer services, planning and zoning,
1

code enforcement, building inspection, parks and recreation, library, economic development and
general administration services. The City of Alamo is not financially accountable for any of the
other area entities within its jurisdiction such as school districts or other non-profit or for profit
corporations.
Component units are legally separate organizations that a primary government must include as a
part of its financial entity. The City has included financial statement for the Alamo Economic
Development Corporation (4B). The 4B Funds account for the local sales tax used to stimulate
local economy, development, and redevelopment.
ACCOUNTING SYSTEM AND BUDGETARY CONTROL
The City’s accounting records for general governmental operations are maintained on a modified
accrual basis, with the revenues being recorded when available and measurable and expenditures
being recorded when the services or goods are received and the liabilities are incurred. Accounting
records for the City utilities and other proprietary activities are maintained on the accrual basis.
The City Ordinance establishes the fiscal year as October 1 through September 30. The City
budget will be prepared in accordance with State Law, City Charter. The annual budget serves as
the foundation for the City’s financial planning and control. All departments of the City are
required to submit requests for appropriations to the City Manager during the annual budget
process. The City Manager presents the proposed budget to the City Council for review. The City
of Alamo is required to hold a public hearing on the proposed budget. The City Council formally
adopts the budget by the passage of a budget ordinance. The Mayor, City Council adopts an annual
budget for the General Fund, Debt Service Fund, Special Revenue Funds, and Proprietary Funds.
The appropriated budged is prepared by fund, department and function. The City Manager is
required to inform the City Council and obtain City Council approval for any revisions of
expenditures of any fund or department.
Budgetary control has been established at the department level. The City maintains internal
budgetary control at the expenditure category (i.e., Personnel Services, Supplies, Other Services
and Capital Outlay.) Monthly financial reports for the City Council are provided showing budget
and actual revenues and expenditures.
ECONOMIC CONDITION AND OUTLOOK
The City of Alamo has a land area of 7.10 square miles and an estimated population of
approximately 20,041. The City of Alamo is located between the cities of McAllen and Harlingen,
along Interstate 2, roughly five miles north of the Rio Grande. The City is an integral part of the
broad-and-diverse McAllen-Edinburg-Mission area. The City is empowered to levy a property tax
on both real and personal property located within its boundaries. The local economy is largely
supported by retail, health care, education, tourism, agriculture, and international trade. The City
draws residents from across the region for commercial retail activity. Currently, the City is
developing a nursing and rehabilitation facility and a freestanding emergency health center. These
facilities will increase the city’s tax base growth.
2

The City of Alamo is also the gateway to the Santa Ana National Wildlife Refuge, which is 7 ½
miles south of Alamo, Texas. Established in 1943, it is situated along the southern stretch of the
Rio Grande, the Santa Ana Wildlife Refuge is home to different species of migratory birds. The
Santa Ana offers visitors an opportunity to see birds, butterflies and many other species not found
anywhere else in the United States beyond deep South Texas.
The City of Alamo continues to grow with the help of the Alamo Economic Development
Corporation. Over the years, the City of Alamo has acquired several retail chain stores which
include (1) H.E.B. store, (1) Wal-Mart store, (1) Walgreen Pharmacy, (1) CVS Pharmacy, (1)
Kautsch Lumber Co., (1) Bealls, Inc. In addition to retail chain stores, the City has obtained The
Original Willie’s Bar-B-Q, Willie’s Sweets, Tower Burger, Burger King, McDonalds, Church’s
Chicken, Subway Sandwiches, Little Caesars Pizza, Dairy Queen, Stars Drive-In, Carl’s Jr, Peter
Piper Pizza, Pizza Hut, and Wingstop.
The City continues to enjoy a stable outlook with property tax values at $611,441,742 up to 7%
over the previous year. The Hidalgo County unemployment rate was 7.10% in 2017. The top 10
taxpayers are diverse, accounting for 13.08% of market value.
The City approved a decrease of $.0245 in property tax rate from $0.5810 to $.5565. The decrease
is the result of the efficient use of Maintenance Funds and Operation Funds and the increase in
property taxable value. The City of Alamo is expecting to have its assessed property values
increase due to economic development growth. One of the major impacts the City will have is the
installation of the South Texas Health System ER.
The City’s sales tax revenue increased 5% in collections compared to FY 2016-2017. While the
governmental entities are working to continuously watch over the region’s economy, the City of
Alamo has seen stable trends.
LONG-TERM FINANCIAL PLANNING
The City reviews annually the needs for capital improvements, City’s infrastructure, replacement
and renovation needs, and new potential projects. Capital improvement projects are funded with
general governmental revenues or through the issuance of long-term debt. The City annually
prepares short-term improvement plans for parks, streets, water, sewer, and water plant projects.
The capital improvement plans require funding sources to be identified for each project. All
projects, ongoing and proposed, are prioritized based on an analysis of current needs and resource
availability.
The City’s current bond rating of last issue in the following categories:
General Obligation Revenue
Standard & Poor’s A+ A+
3

4

5

CITY OF ALAMO, TEXAS
This page left blank intentionally.
6

FINANCIAL SECTION
7

CITY OF ALAMO, TEXAS
This page left blank intentionally.
8

INDEPENDENT AUDITOR’S REPORT
To the City Commission of City of Alamo, Texas
Report on the Financial Statements
We have audited the accompanying financial statements of the governmental activities, the business-type activities, the blended component units, each major fund, and the aggregate remaining fund information of City of Alamo, Texas, as of and for the year ended September 30, 2018, and the related notes to the financial statements, which collectively comprise the City of Alamo, Texas’ basic financial statements as listed in the table of contents.
Management’s Responsibility for the Financial Statements
Management is responsible for the preparation and fair presentation of these financial statements in accordance with accounting principles generally accepted in the United States of America; this includes the design, implementation, and maintenance of internal control relevant to the preparation and fair presentation of financial statements that are free from material misstatement, whether due to fraud or error.
Auditor’s Responsibility
Our responsibility is to express opinions on these financial statements based on our audit. We conducted our audit in accordance with auditing standards generally accepted in the United States of America and the standards applicable to financial audits contained in Government Auditing Standards, issued by the Comptroller General of the United States. Those standards require that we plan and perform the audit to obtain reasonable assurance about whether the financial statements are free from material misstatement.
An audit involves performing procedures to obtain audit evidence about the amounts and disclosures in the financial statements. The procedures selected depend on the auditor’s judgment, including the assessment of the risks of material misstatement of the financial statements, whether due to fraud or error. In making those risk assessments, the auditor considers internal control relevant to the entity’s preparation and fair presentation of the financial statements in order to design audit procedures that are appropriate in the circumstances, but not for the purpose of expressing an opinion on the effectiveness of the entity’s internal control. Accordingly, we express no such opinion. An audit also includes evaluating the appropriateness of accounting policies used and the reasonableness of significant accounting estimates made by management, as well as evaluating the overall presentation of the financial statements.
We believe that the audit evidence we have obtained is sufficient and appropriate to provide a basis for our audit opinions.
Opinions
In our opinion, the financial statements referred to above present fairly, in all material respects, the respective financial position of the governmental activities, the business-type activities, the blended component units, each major fund, and the aggregate remaining fund information of the City of Alamo, Texas, as of September 30, 2018, and the respective changes in financial position, and, where applicable, cash flows thereof for the year then ended in accordance with accounting principles generally accepted in the United States of America.
9

Change in Accounting Principle
As described in Note C to the financial statements, in 2018, the City adopted new accounting guidance, GASB No. 75, Accounting and Financial Reporting for Postemployment Benefits Other Than Pensions. Our opinion is not modified with respect to this matter.
Other Matters
Required Supplementary Information
Accounting principles generally accepted in the United States of America require that the management’s discussion and analysis, schedule of funding progress, and schedule of net pension liability and related ratios (last 10 years), as listed in the table of contents, be presented to supplement the basic financial statements. Such information, although not a part of the basic financial statements, is required by the Governmental Accounting Standards Board, who considers it to be an essential part of financial reporting for placing the basic financial statements in an appropriate operational, economic, or historical context. We have applied certain limited procedures to the required supplementary information in accordance with auditing standards generally accepted in the United States of America, which consisted of inquiries of management about the methods of preparing the information and comparing the information for consistency with management’s responses to our inquiries, the basic financial statements, and other knowledge we obtained during our audit of the basic financial statements. We do not express an opinion or provide any assurance on the information because the limited procedures do not provide us with sufficient evidence to express an opinion or provide any assurance.
Other Information
Our audit was conducted for the purpose of forming opinions on the financial statements that collectively comprise the City of Alamo, Texas’ basic financial statements. The schedule of delinquent taxes receivable and combining and individual nonmajor fund financial statements are presented for purpose of additional analysis and are not a required part of the basic financial statements.
The combining and individual nonmajor fund financial statements and the budgetary comparison information are the responsibility of management and were derived from and relate directly to the underlying accounting and other records used to prepare the basic financial statements. Such information has been subjected to the auditing procedures applied in the audit of the basic financial statements and certain additional procedures, including comparing and reconciling such information directly to the underlying accounting and other records used to prepare the basic financial statements or to the basic financial statements themselves, and other additional procedures in accordance with auditing standards generally accepted in the United States of America. In our opinion, the combining and individual nonmajor fund financial statements and budgetary comparison information are fairly stated in all material respects in relation to the basic financial statements as a whole.
The schedule of delinquent taxes receivable has not been subjected to the auditing procedures applied in the audit of the basic financial statements and, accordingly, we do not express an opinion or provide any assurance on them.
Other Reporting Required by Government Auditing Standards
In accordance with Government Auditing Standards, we have also issued our report dated March 21, 2019, on our consideration of the City of Alamo, Texas’ internal control over financial reporting and on our tests of its compliance with certain provisions of laws, regulations, contracts, and grant agreements and other matters. The purpose of that report is solely to describe the scope of our testing of internal control over financial reporting and compliance and the results of that testing, and not to provide an opinion on the effectiveness of the City of Alamo, Texas’ internal control over financial reporting or on compliance. That report is an integral part of an audit performed in accordance with Government Auditing Standards in considering the City of Alamo, Texas’ internal control over financial reporting and compliance.
Oscar R. Gonzalez, CPA & Associates, PLLC Certified Public Accountants Pharr, Texas March 21, 2019
10

MANAGEMENT'S DISCUSSION AND ANALYSIS
11

Management’s Discussion and Analysis
As management of the City of Alamo, Texas (the City), we offer readers of the City’s financial statements
this narrative overview and analysis of the financial activities of the City of Alamo for the fiscal year
ended September 30, 2018.
FINANCIAL HIGHLIGHTS
The assets of the City’s governmental activities exceeded its liabilities at the close of the most
recent fiscal year by $22,756,375 (net position). Of this amount, $4,051,289 million (unrestricted
net position) may be used to meet the governments ongoing obligations to citizens and creditors.
At the end of the current fiscal year, fund balance for all governmental funds decreased by
$101,046, or -1.12%; from $9,017,182 to $8,916,136. This decrease is due to increase in
expenses.
The assets of the City’s business-type activities exceeded its liabilities at the close of the most
recent fiscal year by $25,131,569 (net position). Of this amount, $3,318,192 (unrestricted net
position), may be used to meet the water and sewer systems ongoing obligations to citizens and
creditors.
The General Fund assets exceeded its liabilities by over $4,116,015 (fund balance). Of this
amount, $4,116,015 (unassigned fund balance) may be used to meet the General Fund’s ongoing
obligations. This is a decrease of $321,696 from prior year or 41.41% of total general fund
expenditures.
OVERVIEW OF THE FINANCIAL STATEMENTS
This discussion and analysis are intended to serves as an introduction to the City’s basic financial
statements. The City’s basic financial statements comprise of three components: 1) government-wide
financial statements, 2) fund financial statements, and 3) notes the financial statements themselves.
Government-Wide Financial Statements
The government-wide financial statements are designed to provide readers with a broad overview of the
City’s finances, in a manner like a private-sector business.
The Statement of Net Position presents information on all the City’s assets and liabilities as well as
deferred outflow and inflow of resources, with the difference being reported as net position. Over time,
increases or decreases in net position may serve as a useful indicator of whether the financial position of
the City is improving or deteriorating.
The Statement of Activities presents information showing how the City’s net position changed during the
most recent fiscal year. All changes in net position are reported as soon as the underlying event giving
rise to the change occurs, regardless of the timing of related cash flows. Thus, revenues and expenses are
reported in this statement for some items that will only result in cash flows in future fiscal periods (e.g.,
uncollected taxes and earned but unused vacation leave).
Both government-wide financial statements distinguish function of the City that are principally supported
by taxes and intergovernmental revenues (governmental activities) from other functions that are intended
to recover all or significant portion of their costs through user fees and changes (business-type activities).
The governmental activities of the City include services provided to the citizens for the basic health,
safety, welfare, and administration of the City. Examples would include police and fire protection, animal
12

Management’s Discussion and Analysis
control, streets, parks and recreation, and the youth center. The business-type activities of the City which
include the services provided to the citizens, the cost of which is recouped by user fees charged for the
services. This includes water and wastewater services fees to all residents and businesses.
The government-wide financial statements include not only the City itself (known as the primary
government), but also legally separate component units for which the City is financially accountable: the
Alamo Economic Development Corporation (blended component unit).
Fund Financial Statements
A fund is a group of related account that is used to maintain control over resources that have been
segregated for specific activities or objectives. The City, like other state and local governments, uses fund
accounting to ensure and demonstrate compliance with finance-related legal requirements. All of the
funds of the City can be divided into four categories: governmental funds, proprietary funds, and
fiduciary funds.
Governmental Funds
Governmental fund are used to account for essentially the same functions reported as governmental
activities in the government-wide financial statements. However, unlike the government-wide financial
statements, governmental fund financial statements focus on near-term inflows and outflows of resources
that can be spent, as well as on balances of resources that can be spent available at the end of the fiscal
year. Such information may be useful in evaluating a government’s near-term financing requirements.
Because the focus of governmental funds is narrower than that of the government-wide financial
statements, it is useful to compare the information presented for governmental funds with similar
information presented for governmental activities in the government-wide financial statements. By doing
so, readers may better understand the long-term impact of the government’s near-term financing
decisions. Both the governmental funds Balance Sheet and the governmental funds Statement of
Revenues, Expenditures, and Changes in Fund Balances provide a reconciliation to facilitate this
comparison between governmental funds and governmental activities.
The City maintains multiple governmental funds. Information for the major funds is presented separately
in the governmental fund Balance Sheet and in the governmental fund Statement of Revenues,
Expenditures and Changes in Fund Balance. The General Fund is the only major governmental fund.
Data from the other governmental funds are combined into a single, aggregated presentation. Individual
fund data for each of these non-major funds is provided in the form of combining statements elsewhere in
this report. The City adopts an annual appropriated budget for the General, Hotel/Motel, and Debt Service
governmental funds with the exception of grant funded special revenue funds and capital project funds, if
any.
Proprietary Funds
The City maintains one type of proprietary fund, an enterprise fund. Enterprise funds are used to report
the same functions presented as business-type activities in the government-wide financial statements. The
City uses one enterprise funds to account for its collection of water and sewer services provided for
residents. There are no internal service funds being used by the City at this time.
Proprietary funds provide the same type of information as the government-wide financial statements, only
in more detail. The proprietary funds financial statements provide separate information for the water and
wastewater operations. The proprietary fund is presented in a single, aggregates presentation in the
proprietary fund financial statements. Individual fund data for the proprietary fund is provided in this
report on pages 19 through 21.
The City adopts an annual appropriated budget for the Utility Fund.
13

Management’s Discussion and Analysis
Notes to the Financial Statements
The notes provide additional information that is essential to a full understanding of the data provided in
the government-wide and fund financial statements. The notes to the financial statements can be found
on pages 22 through 54 of this report.
Other Information
The City’s progress in funding its obligations to provide pension benefits to its employees can be found at
the end of the notes to the financial statements.
In addition to the basic financial statements and accompanying notes, this report also presents certain
required supplementary information concerning the result of activities comparing the budget versus
actual.
The combining statements referred to earlier in connection with non-major governmental funds are
presented immediately following the required supplementary information.
Government-wide Financial Analysis
As noted earlier, net position may serve over time as a useful indicator of a government’s financial
position. In the case of the City, assets exceeded liabilities by $47,887,944 and $47,260,002 for 2018 and
2017 as adjusted, respectively, for governmental activities.
The City’s condensed Statement of Net Position along with last fiscal year’s numbers is presented for
comparison in the table is located below:
14

Management’s Discussion and Analysis
Increase
2018 2017 2018 2017 2018 2017 (Decrease)
Assets
Current Assets 10,635,570$ 10,826,972$ 4,233,409$ 4,680,019$ 14,868,979$ 15,506,991$ (638,012)$
Non-Current Assets 36,446,193 26,173,045 31,730,731 27,268,209 68,176,924 53,441,254 14,735,670
Total Assets 47,081,763 37,000,017 35,964,140 31,948,228 83,045,903 68,948,245 14,097,658
Deferred Outflow of Resources
Total Deferred outflow of resource535,789 621,996 97,264 40,494 633,053 662,490 (29,437)
Liabilities
Current Liabilities 2,169,060 1,759,151 1,167,016 946,238 3,336,076 2,705,389 630,687
Non-Current Liabilities 13,240,316 13,886,355 6,593,407 5,769,070 19,833,723 19,655,425 178,298
Total Liabilities 15,409,376 15,645,506 7,760,423 6,715,308 23,169,799 22,360,814 808,985
Deferred Inflow of Resources
Total Deferred inflow of resource985,291 536,693 103,019 25,161 1,088,310 561,854 526,456
Net Position
Net Invested in capital assets,
net of related debt 15,068,507 14,002,698 21,813,377 21,141,916 36,881,884 35,144,614 1,737,270
Restricted 3,636,579 4,579,468 - - 3,636,579 4,579,468 (942,889)
Unrestricted 4,051,289 3,429,583 3,318,192 4,106,337 7,369,481 7,535,920 (166,439)
Total net position 22,756,375$ 22,011,749$ 25,131,569$ 25,248,253$ 47,887,944$ 47,260,002$ 627,942$
City of Alamo's Net Position
Governmental Business-Type
Activities Activities Totals
The excess of liabilities/deferred inflows of resources over assets/deferred outflows of resources reported
on the government-wide Statement of Net Position of $22,756,375 at September 30, 2018 results from
several factors. The most significant items include certain long-term liabilities that do not require current
funding such as net pension liabilities of $905,910 as of September 30, 2018, and other unfunded long-
term liabilities which include compensated claims and compensated absences.
One of the largest portions of the City’s net position ($36,881,884) reflects its Net Invested in Capital
Assets (e.g., land building, machinery, and equipment), less any related debt used to acquire those assets
that are still outstanding. The City uses these capital assets to provide citizens; consequently, these assets
are not available for future spending. Although, the City’s investments in its capital assets is reported net
of related debt, it should be noted that the resources needed to repay this debt must be provided from
other sources, since the capital assets themselves cannot be used to liquidate these liabilities.
A portion of the City’s net position ($3,636,579) represent resources that are subject to external
restrictions on how they may be used. The remaining balance of unrestricted net position ($7,369,481)
may be used to meet the government’s ongoing obligations to citizens and creditors. At the end of the
current fiscal year, the City is able to report positive balances in all three categories of net assets for the
government as a whole.
15

Management’s Discussion and Analysis
The City’s condensed Changes in Net Position along with last fiscal year’s numbers are presented for
comparison in the following table below:
Increase
2018 2017 2018 2017 2018 2017 (Decrease)
Revenues
Program Revenues
Charges for services 2,861,532$ 2,919,033$ 4,147,141$ 4,053,730$ 7,008,673$ 6,972,763$ 35,910$
Operating grants and - - -
contributions 463,046 1,239,115 - 463,046 1,239,115 (776,069)
Capital grants and - - -
contributions - - - - - - -
General Revenues - - -
Property Tax 3,463,220 3,355,089 - 3,463,220 3,355,089 108,131
Sales Tax 3,599,081 3,435,440 - 3,599,081 3,435,440 163,641
Other Tax 647,922 633,175 - 647,922 633,175 14,747
Other Revenues 287,700 273,371 - 18,361 287,700 291,732 (4,032)
Total Revenues 11,322,501$ 11,855,223$ 4,147,141$ 4,072,091$ 15,469,642$ 15,927,314$ (457,672)$
Expenses
General Government 4,331,411$ 5,174,598$ -$ -$ 4,331,411$ 5,174,598$ (843,187)$
Public Safety 4,150,946 3,850,703 - - 4,150,946 3,850,703 300,243
Highways/Streets 592,114 742,394 - - 592,114 742,394 (150,280)
Health & Welfare 230,586 317,566 - - 230,586 317,566 (86,980)
Culture & Recreation 1,109,758 840,164 - - 1,109,758 840,164 269,594
Economic Development 256,933 396,258 - - 256,933 396,258 (139,325)
Interest - Long-Term Debt 286,889 363,387 - - 286,889 363,387 (76,498)
Principal Expense (244) - - - (244) - (244)
Waterworks/Sewer Systems - - 3,757,600 3,469,082 3,757,600 3,469,082 288,518
Total Expenses 10,958,393 11,685,070 3,757,600 3,469,082 14,715,993 15,154,152 438,159-
Transfers 549,300 549,300 (549,300) (549,300) - 1,098,600 (1,098,600)
Net Change in net position 913,408 1,469,242 (112,222) 53,709 801,186 1,522,951 2,324,137
-
Prior Period Adjustment (168,782) 454,740 (4,462) 79,891 (173,244) 534,631 361,387
-
Net position - beginning 22,011,749 20,087,767 25,248,253 25,114,653 47,260,002 45,202,420 92,462,422
Net position - ending 22,756,375$ 22,011,749$ 25,131,569$ 25,248,253$ 47,887,944$ 47,260,002$ 627,942$
City of Alamo's Changes in Net PositionGovernmental Business-Type
Activities Activities Totals
The City’s governmental activities increased the City’s net position by $744,626. The key changes this
fiscal year along with element of decrease is described as follows:
Property tax revenue including penalties and interest increased 3.22% (108,131) during the fiscal
year. Property tax constitutes 31% of governmental revenues.
Sales tax revenue was $3,599,081, an increase of 4.7% over the prior year. Sales tax revenue
constitutes 32% of o the total revenue for governmental activities.
Other taxes, which include franchise taxes, hotel tax and mixed beverage taxes, totaled $647,922.
Lower than projected expenses throughout the year.
16

Management’s Discussion and Analysis
The City’s governmental activities’ revenue source distribution is presented below.
Revenues by Source – Governmental Activities
Business-Type Activities
The business-type activities decreased net position by $116,684. Key changes during the fiscal year for
the increase and decrease:
Revenues increased due to increase in Water & Sewer rate fees during the fiscal year.
Water and sewer expenses increased $288,518 or 8.3% from the prior year.
Revenues by Source – Business-Type Activities
GENERAL FUND BUDGETARY HIGHLIGHTS
The General Fund’s original budget was amended during the year. Expenditures did not exceed
appropriations of the general government functions. Actual revenues for the year exceeded actual
expenditures by $299,983. Actual revenues did not exceed budgeted revenues by $123,812, while actual
expenditures did not exceed appropriations by $314,480.
Charges for
Services
100%
Charges for
Services
25%
Operating Grants
4%
Sales Taxes
32%
Property Taxes
31%
Other Taxes
6%
Other Revenue 3%
17

Management’s Discussion and Analysis
CAPITAL ASSET AND DEBT ADMINISTRATION
Capital Assets
The City of Alamo’s Capital assets for its governmental and business-type activities amounts to
$53,015,099 and $53,463,356 (net of accumulated depreciation) for 2018 and 2017. This investment in
capital assets includes land, buildings, and systems improvements, machinery and equipment and
equipment net of depreciation. The total decrease in the City’s net investment in capital assets for the
current fiscal year was $448,257.
Increase
2018 2017 2018 2017 2018 2017 (Decrease)
Capital Assets, not being
depreciated:
Land 1,731,590$ 1,731,590$ 2,943,078$ 2,943,078$ 4,674,668$ 4,674,668$ -$
Construction-in-progress* 553,193 1,744,631 444,637 112,561 997,830 1,857,192 (859,362)
2,284,783 3,476,221 3,387,715 3,055,639 5,672,498 6,531,860 (859,362)
Capital Assets, being
depreciated:
Buildings 13,034,989 13,034,989 4,838,176 4,838,176 17,873,165 17,873,165 -
Vehicles 3,384,300 2,826,631 233,117 233,117 3,617,417 3,059,748 557,669
Machinery & Equipment 2,564,483 2,532,116 1,664,859 1,634,585 4,229,342 4,166,701 62,641
Infrastructure 16,095,690 14,838,887 25,930,826 25,428,782 42,026,516 40,267,669 1,758,847
35,079,462 33,232,623 32,666,978 32,134,660 67,746,440 65,367,283 2,379,157
Accumulated Depreciation (11,553,244) (10,513,697) (8,557,370) (7,922,090) (20,110,614) (18,435,787) (1,674,827)
Total Capital Assets, being
Depreciated, net 23,526,218 22,718,926 24,109,608 24,212,570 47,635,826 46,931,496 704,330
Capital Assets, Net 25,811,001$ 26,195,147$ 27,497,323$ 27,268,209$ 53,308,324$ 53,463,356$ (155,032)$
City of Alamo's Capital Assets
Governmental Business-Type
Activities Activities Totals
*Restated
Long-Term Debt
State statues limit the amount general obligation debt that the City may issue to 10% of its total assessed
valuation ($634,860,998). The City’s general obligation debt maximum is $63,486,099, compared to the
City’s debt of $14,969,000.
18

Management’s Discussion and Analysis
At the end of the current fiscal year, the City had a total contractually obligated long-term debt of
$14,969,000. The details of the change in debt from last fiscal year are as indicated:
Increase
2018 2017 2018 2017 2018 2017 (Decrease)
Long-Term Obligations
General Obligation Bonds 9,475,000$ 10,345,000$ 5,494,000$ 5,831,000$ 14,969,000$ 16,176,000$ (1,207,000)$
Capital Leases 638,794 812,657 189,946 313,457 828,740 1,126,114 (297,374)
Loan Payables 628,700 653,254 - - 628,700 653,254 (24,554)
Compensated Absences 333,694 357,962 29,476 41,403 363,170 399,365 (36,195)
Total 11,076,188$ 12,168,873$ 5,713,422$ 6,185,860$ 16,789,610$ 18,354,733$ (1,565,123)$
City of Alamo's Long-Term Obligations
Governmental Business-Type
Activities Activities Totals
Long-term debt for the Governmental activities decreased by $870,000. This decrease is the reduction of
the debt by principal as amortized.
Long-term debt for the Business-Type activities decreased by $337,000. This decrease is the reduction of
the debt by principal as amortized.
Additional information on the City’s long-term debt can be found in the Notes to the Financial
Statements.
Pension
The adoption of Statement No. 68 resulted in the City’s reporting of net pension liabilities and deferred
inflows of resources and deferred outflows of resources for each of its qualifies pension plans and the
recognition of pension expense in accordance with the provisions of the Statement.
The decrease in the City’s net pension liability (NPL) to $ 1,065,776 at September 30, 2018 from
$1,797,804 at September 30, 2017 was the result of a significant increase in net investment income in the
TMRS plan during 2017.
The table below provides the City’s key pension statistics related to the TMRS plan as of and for the
fiscal year ended September 30, 2017.
PENSION
City of Alamo’s Key Pension Statistics
Net Pension Liability (NPL) $1,065,776
Pension Expense $ (282,265)
19

Management’s Discussion and Analysis
Additional information on the City’s net pension liability can be found in the notes to the financial
statements as indicated in the table of contents of this report.
The City continues to maintain favorable ratings from bond rating agencies. The current General
Obligation, Combination Tax and Revenue Certificates of Obligation, and Revenue Bonds ratings are as
follows.
Standard
& Poor’s
General obligation bonds A+
Certificates of obligation A+
Revenue bonds A+
ECONOMIC FACTORS AND NEXT YEAR’S BUDGETS AND RATES
Appraisal values used in preparing 2018-2019 budget increased $23,419,256 over the prior year,
or 4 percent higher than the prior year.
The ad valorem property tax rate was set at $0.5817. The City’s effective tax rate is $.5517.
The property tax rate should generate $254,206 of additional tax revenues; an increase of 9.42%
over the previous year.
The 2018-2019 General Fund operating budget was prepared using $4,037,570 as the estimated
fund balance at September 30, 2018. The actual unassigned fund balance for the General Fund
was $4,116,015.
Weather conditions for potential droughts may affect the utility rates and operations. Causing
more water to be used which strains utility infrastructure.
The City’s financial stability remains strong and City management and City Council members are
in constant review of the City’s fund balance to ensure there are sufficient funds always on hand
to cover any unforeseen events. The City’s General Fund maintains six months’ worth of
expenses in reserve for such events.
REQUESTS FOR INFORMATION
This financial report is designed to provide a general overview of the City’s finances for all those with an
interest in the City’s finances. Questions concerning any of the information provided in this report or
requests for additional financial information should be addressed to the Office of the City of Alamo,
Texas, Finance Director: 420 N. Tower Road, Alamo, Texas 78516.
20

BASIC FINANCIAL STATEMENTS
21

ASSETS
Current Assets
Cash and Cash Equivalents $ 3,974,924 $ 1,815,437 $ 5,790,361
Investments 3,972,110 1,929,610 5,901,720
Accounts Receivable (Net of Allowance)
Property Taxes 424,043 - 424,043
Court 285,337 - 285,337
Customers 253,632 412,744 666,376
Sales Tax 590,165 556 590,721
Franchise Tax 60,033 72,000 132,033
Other 437,639 - 437,639
Note Receivables 474,383 - 474,383
Prepaid and Other Assets 5,541 - 5,541
Internal Balances 169,100 ( 169,100 ) -
Total Current Assets 10,646,907 4,061,247 14,708,154
Non-Current Assets
Land 1,731,590 2,943,078 4,674,668
Construction In Progress 553,193 444,636 997,829
Building and Improvements (Net) 9,108,944 3,201,281 12,310,225
Vehicles (Net) 1,145,940 90,903 1,236,843
Furniture and Equipment (Net) 1,273,181 808,258 2,081,439
Infrastructure (Net) 11,997,775 20,009,166 32,006,941
Total Non-Current Assets 25,810,623 27,497,322 53,307,945
Total Assets 36,457,530 31,558,569 68,016,099
DEFERRED OUTFLOWS OF RESOURCES
Unamortized Discount on Bonds - 17,271 17,271
Unamortized Loss on Refunding of Debt 70,677 - 70,677
Related from Pension OPEB 11,816 - 11,816
Related from Pension GASB 68 453,296 79,993 533,289
Total Deferred Outflows of Resources 535,789 97,264 633,053
The notes to these statements are an integral part of these statements.
Business-type
Activities Total
CITY OF ALAMO, TEXAS
Statement of Net Position
September 30, 2018
Primary Government
Governmental
Activities
22

LIABILITIES
Current Liabilities
Accounts Payable 443,297 - 443,297
Payroll Withholding and Deductions 11,785 4,196 15,981
Other Current Liabilities 322,137 20,334 342,471
Unearned Revenues - Property Taxes - - -
Unearned Revenues - Other 267,168 - 267,168
Accrued Interest 48,573 27,227 75,800
Customers Deposits - 465,037 465,037
Matured Debt Payable Within One Year 1,087,437 478,060 1,565,497
Total Current Liabilities 2,180,397 994,854 3,175,251
Non-Current Liabilities
Bonds Payable More than One Year 8,590,000 5,143,000 13,733,000
Loans Payable More than One Year 603,901 - 603,901
Leases Payable More than One Year 461,156 62,885 524,041
Compensated Absences 333,694 29,476 363,170
Net Pension Liability 905,910 159,866 1,065,776
OPED Pension Liability 176,595 31,164 207,759
Total Non-Current Liabilities 11,071,256 5,426,391 16,497,647
Total Liabilities 13,251,653 6,421,245 19,672,898
DEFERRED INFLOWS OF RESOURCES
Unamortized Premium on Bonds 401,519 - 401,519
Related to Pension 583,772 103,019 686,791
Total Deferred Inflows of Resources 985,291 103,019 1,088,310
NET POSITION
Net Invested in Capital Assets 15,068,507 21,813,377 36,881,884
Restricted for:
Capital Projects - - -
Debt Service 945,383 - 945,383
Economic Development 1,377,791 - 1,377,791
Special Revenue 1,313,405 - 1,313,405
Unrestricted 4,051,289 3,318,192 7,369,481
Total Net Position $ 22,756,375 $ 25,131,569 $ 47,887,944
Primary Government
Governmental
Activities
Business-type
Activities Total
23

Functions/Programs
Primary Government
Governmental Activities:
General Government $ 4,331,411 $ 239,556 $ 293,225 $ - $ ( 3,798,630 ) $ - $ ( 3,798,630 )
Public Safety 4,150,946 454,237 124,200 - ( 3,572,509 ) - ( 3,572,509 )
Highways and Streets 592,114 2,023,837 - - 1,431,723 - 1,431,723
Health and Welfare 230,586 16,205 - - ( 214,381 ) - ( 214,381 )
Culture and Recreation 1,109,758 127,697 45,621 - ( 936,440 ) - ( 936,440 )
Economic Development 256,933 - - - ( 256,933 ) - ( 256,933 )
Debt Interest 286,645 - - - ( 286,645 ) - ( 286,645 )
Total Governmental Activities 10,958,393 2,861,532 463,046 - ( 7,633,815 ) - ( 7,633,815 )
Business-type Activities:
Water & Sewer 3,757,600 4,147,141 - - - 389,541 389,541
2007 Reserve - - - - - - -
Total Business-type Activities 3,757,600 4,147,141 - - - 389,541 389,541
Total Primary Government $ 14,715,993 $ 7,008,673 $ 463,046 $ - $ ( 7,633,815 ) $ 389,541 $ ( 7,244,274 )
$ 3,463,220 $ - $ 3,463,220
3,599,081 - 3,599,081
557,694 - 557,694
90,228 - 90,228
159,342 - 159,342
128,358 47,537 175,895
549,300 ( 549,300 ) -
8,547,223 ( 501,763 ) 8,045,460
913,408 ( 112,222 ) 801,186
Net Position at Beginning of Period 22,011,749 25,248,253 47,260,002
Prior Period Adjustments ( 168,782 ) ( 4,462 ) ( 173,244 )
Net Position at Beginning of Period (Restated) 21,842,967 25,243,791 47,086,758 Net Position at
End of Period $ 22,756,375 $ 25,131,569 $ 47,887,944
The notes to these statements are an integral part of these statements.
Governmental
Activities
Capital Grants
and
Contributions
Primary Government
Business-type
Activities Total
CITY OF ALAMO, TEXAS
Statement of Activities
For the Year Ended September 30, 2018
Revenues
Sales Taxes
Charges for
Services
Operating
Grants and
Contributions
General Purpose Revenues and Transfers:
Expenses
Total General Revenues and Transfers
Change in Net Position
Miscellaneous General Revenues
Property Taxes
Interest Revenue
Transfers
Franchise Taxes
Other Taxes
24

GOVERNMENTAL FUNDS
25

ASSETS
Cash and Cash Equivalents $ 1,450,865 $ 967,745 $ 1,556,316 $ 3,974,926
Investments 2,412,859 574,144 985,107 3,972,110
Accounts Receivable -
Property Taxes 351,212 - 72,831 424,043
Court 285,337 - - 285,337
Customers 245,132 - 8,500 253,632
Sales Tax 442,624 147,541 - 590,165
Franchise Tax 60,033 - - 60,033
Other 83,483 8,353 345,803 437,639
Note Receivables - 474,383 - 474,383
Prepaid and Other Assets 5,541 - - 5,541
Due From Other Funds 445,605 - - 445,605
Total Assets 5,782,691 2,172,166 2,968,557 10,923,414
DEFERRED OUTFLOWS OF RESOURCES
Aggregated Deferred Outflows - - - -
Total Deferred Outflows of Resources - - - -
Total Assets and Deferred Outflows of Resources $ 5,782,691 $ 2,172,166 $ 2,968,557 $ 10,923,414
LIABILITIES
Accounts Payable $ 440,156 $ 3,141 $ - $ 443,297
Payroll Withholding and Deductions - - - -
Other Current Liabilities 334,080 - - 334,080
Unearned Revenues - - 267,168 267,168
Due To Other Funds 274,584 1,921 - 276,505
Total Liabilities 1,048,820 5,062 267,168 1,321,050
DEFERRED INFLOWS OF RESOURCES
Deferred Property Taxes 332,519 - 68,372 400,891
Deferred Court Fines 285,337 - - 285,337
Total Deferred Inflows of Resources 617,856 - 68,372 686,228
FUND BALANCE
Restricted for:
Debt Service - - 1,357,515 1,357,515
Capital Projects - - - -
Special Projects - - 1,275,502 1,275,502
Economic Development & Tourism - 2,167,104 - 2,167,104
Unassigned 4,116,015 - - 4,116,015
Total Fund Balance 4,116,015 2,167,104 2,633,017 8,916,136
Total Liabilities, Deferred Inflows of Resources and
Fund Balance $ 5,782,691 $ 2,172,166 $ 2,968,557 $ 10,923,414
The notes to these statements are an integral part of these statements.
Balance Sheet
CITY OF ALAMO, TEXAS
Alamo
Economic
Development
Corporation
Total
Governmental
FundsGeneral
Non-Major
Governmental
Funds
September 30, 2018
Governmental Funds
26

Total Fund Balance - Governmental Funds $ 8,916,136
Fixed assets are capitalized in the Statement of Net Assets and depreciated in the Statement of
Activities. These are expensed when acquired in the Statement of Revenues, Expenditures, and
Changes in Fund Balance. 25,816,623
Long-term liabilities applicable to the city's governmental activities are not due in the current period
and accordingly are not reported as fund liabilities. All liabilities, both current and long-term, are
reported in the Statement of Net Position. ( 11,816,913 )
Because some court fines will not be collected for some time after the city's fiscal year ends, they are
not considered as "available" revenues in the governmental funds and are considered deferred in the
funds, but recognized in the Statement of Net Position. ( 8,695 )
Revenue deferred in governmental fund statements if not received within sixty days. 294,032
Compensated absences expensed as paid in governmental fund statements, expensed as incurred in
entity wide statements, and reflected as liability on Statement of Net Assets. ( 333,694 )
Interest expense in the Statement of Activities differs from the amount reported in the governmental
funds due to accrued interest calculated for bonds and note payables. ( 48,415 )
The difference between the reacquisition price and the net carrying amount of a refunded bond is
recorded as other financing uses - payments to refunded bond escrow agent in the funds as it is
received by the escrow agent, but is recorded as a deferred outflow of resources - loss on refunding of
debt and expensed over the shorter of the life of the old debt or the life of the new debt, whichever is
shorter. 70,677
Proceeds from resulting from premiums received on the issuance of long term debt appear as other
financing sources and netted to fund balance on the governmental funds, but it is recorded as a deferred
inflow of resources and amortized over the life of the debt on the government-wide statements. ( 401,519 )
Principal payments on long-term expensed in governmental fund statements, treated as reductions of
outstanding debt in entity wide statements. 1,068,417
Long term liabilities applicable to the city's governmental activities are not due in the current period
and accordingly are not reported as fund liabilities. GASB 68 is recorded in the Statement of Net
Position. ( 1,036,386 )
Long term liabilities applicable to the city's governmental activities are not due in the current period
and accordingly are not reported as fund liabilities. GASB 75 is recorded in the Statement of Net
Position. ( 164,779 )
Because property tax will not be collected for several months after the city's fiscal year end, they are
not considered as "available" revenues in the governmental funds and are considered deferred, but
recognized as revenues in the Statement of Net Position 400,891
Total Net Position of Governmental Activities - Statement of Net Position $ 22,756,375
The notes to these statements are an integral part of these statements.
CITY OF ALAMO, TEXAS
Reconciliation of Governmental Funds Balance Sheet to the Statement of Net Position
September 30, 2018
27

Revenues
Property Taxes $ 2,897,817 $ - $ 581,680 3,479,497$
Sales Taxes 2,699,311 899,770 - 3,599,081
Franchise Taxes 557,694 - - 557,694
Other Taxes 2,883 - 87,345 90,228
Court Fines and Fees 342,999 - - 342,999
Licenses and Permits 140,526 - - 140,526
Charges for Services 2,366,152 - - 2,366,152
Local Events and Contributions 52,143 - - 52,143
Other Revenues 73,505 7,791 98,596 179,892
State Grants 32,000 - - 32,000
Federal Grants 85,678 - 293,225 378,903
Other Governmental Grants - - - -
Interest Revenue 60,240 36,824 31,294 128,358
Total Revenues 9,310,948 944,385 1,092,140 11,347,473
Expenditures
General Government 3,889,681 - 89,051 3,978,732
Public Safety 3,922,830 - 9,210 3,932,040
Highways and Streets 641,120 - - 641,120
Health and Welfare 255,443 - - 255,443
Culture and Recreation 1,027,353 - - 1,027,353
Economic Development - 247,522 - 247,522
Capital Outlay 12,213 - 495,664 507,877
Debt Principal 173,862 24,310 870,000 1,068,172
Debt Interest 16,242 6,538 295,067 317,847
Total Expenditures 9,938,744 278,370 1,758,992 11,976,106
Excess of Revenues Over
(Under) Expenditures ( 627,796 ) 666,015 ( 666,852 ) ( 628,633 )
Other Financing Sources (Uses)
Loan Proceeds - - - -
Proceeds on Sale of Assets - - - -
Transfers From Other Funds 390,000 194 757,037 1,147,231
Transfers To Other Funds (62,187) (535,744) - (597,931)
Net Other Financing Sources (Uses) 327,813 (535,550) 757,037 549,300
Net Change in Fund Balance (299,983) 130,465 90,185 (79,333)
Fund Balance at Beginning of Period 4,437,711 2,036,639 2,542,832 9,017,182
Prior Period Adjustments ( 21,713 ) - - ( 21,713 )
Fund Balance at End of Period $ 4,116,015 $ 2,167,104 $ 2,633,017 8,916,136$
The notes to these statements are an integral part of these statements.
Alamo
Economic
Development
Corporation
CITY OF ALAMO, TEXAS
Statement of Revenues, Expenditures, and Changes in Fund Balance
Governmental Funds
For the Year Ended September 30, 2018
Total
Governmental
FundsGeneral Fund
Non-Major
Governmental
Funds
28

Total Net Change in Fund Balances - Governmental Funds $ ( 79,333 )
Governmental funds report capital outlays as expenditures. However, in the Statement of Activities the
costs of those assets is allocated over their estimated useful life and depreciated. 1,780,647
Governmental funds do not report capital assets, and accordingly do not record depreciation expense.
Capital assets are recorded on the Statement on Net Position and accordingly depreciation is charged to
its allocable function. ( 1,039,925 )
Accrued interest payable is accrued on Statement of Net Position and expensed on the Statement of
Activities. Interest is expensed on a cash basis on the Statement of Revenues, Expenditures, and
Changes in Fund Balance. 681
Because some court fines will not be collected for some time after the City's fiscal year end, they are not
considered as "available" revenues in the governmental funds and are considered deferred in the funds,
but recognized in the Statement of Net Position. ( 8,695 )
Interest expense in the Statement of Activities differs from the amount reported in the governmental
funds due to accrued interest calculated for bonds and note payables 26,176
Compensated absences expensed as paid in governmental fund statements, expensed as incurred in
entity wide statements, and reflected as liability on Statement of Net Assets. 24,268
GASB 68 recognition on Pension Expense requires an adjustment to reflect in Statement of Activities 243,906
GASB 75 recognition on Pension Expense requires an adjustment to reflect in Statement of Activities ( 18,040 )
Because property tax will not be collected for several months after the city's fiscal year end, they are not
considered as "available" revenues in the governmental funds and are considered deferred, but
recognized as revenues in the Statement of Activities ( 16,277 ) -
Changes in Net Position-Governmental Funds $ 913,408
The notes to these statements are an integral part of these statements.
CITY OF ALAMO, TEXAS
Reconciliation of Governmental Funds Statement of Revenues, Expenditures, and
Changes in Fund Balance with Statement of Activities
For the Year Ended September 30, 2018
29

CITY OF ALAMO, TEXAS
This page left blank intentionally.
30

PROPRIETARY FUNDS
31

ASSETS
Current Assets
Cash and Cash Equivalents $ 1,815,437 $ 1,815,437
Investments 1,929,610 1,929,610
Accounts Receivable - Customers (Net) 412,744 412,744
Accounts Receivable - Other 556 556
Prepaid and Other Assets 72,000 72,000
Due From Other Funds 3,062 3,062
Total Current Assets 4,233,409 4,233,409
Noncurrent Assets
Land 2,943,078 2,943,078
Construction In Progress 444,636 444,636
Building and Improvements (Net) 3,201,281 3,201,281
Vehicles (Net) 90,903 90,903
Furniture and Equipment (Net) 808,258 808,258
Infrastructure (Net) 20,009,166 20,009,166
Total Assets 31,730,731 31,730,731
DEFERRED OUTFLOWS OF RESOURCES
Aggregated Deferred Outflows 97,264 97,264
Total Deferred Outflows of Resources 97,264 97,264
LIABILITIES
Current Liabilities
Other Current Liabilities 20,334 20,334
Payroll Withholding and Deductions 4,196 4,196
Accrued Interest 27,227 27,227
Customers Deposits 465,037 465,037
Due To Other Funds 172,162 172,162
Matured Debt Payable Within One Year 478,060 478,060
Total Current Liabilities 1,167,016 1,167,016
Noncurrent Liabilities
Compensated Absences 29,476 29,476
Bonds Payable More than a Year 5,143,000 5,143,000
Leases Payable More than a Year 62,885 62,885
Net Pension Liability 159,866 159,866
OPEB Pension Liability 31,164 31,164
Total Liabilities 6,593,407 6,593,407
DEFERRED INFLOWS OF RESOURCES
Aggregated Deferred Inflows 103,019 103,019
Total Deferred Inflows of Resources 103,019 103,019
NET POSITION
Net Invested in Capital Assets 17,584,383 17,584,383
Unrestricted 7,547,186 7,547,186
Total Net Position $ 25,131,569 $ 25,131,569
The notes to these statements are an integral part of these statements.
Water and Sewer
Total Enterprise
Funds
Business-type Activities - Enterprise Funds
CITY OF ALAMO, TEXAS
Statement of Net Position
Proprietary Funds
September 30, 2018
32

Operating Revenues
Charges for Services $ 4,146,191 $ 4,146,191
Other Revenues 3,705 3,705
Total Operating Revenues 4,149,896 4,149,896
Operating Expenses
Water Department 874,607 874,607
Sewer Department 990,486 990,486
Water Plant Department 683,651 683,651
Water Billing 218,363 218,363
General Administration 163,193 163,193
Depreciation 635,279 635,279
Total Operating Expenses 3,565,579 3,565,579
Operating Income (Loss) 584,317 584,317
Non-Operating Revenues (Expenses)
Interest Revenue 44,782 44,782
Amortization Expense ( 908 ) ( 908 )
Interest Expense (191,113) (191,113)
Net Non-Operating Revenues (Expenses) (147,239) (147,239)
Income Before Contributions and Transfers 437,078 437,078
Transfers From Other Funds - -
Transfers To Other Funds ( 549,300 ) ( 549,300 )
Change In Net Position ( 112,222 ) ( 112,222 )
Net Position at Beginning of Period 25,248,707 25,248,707
Prior Year Adjustments ( 4,916 ) ( 4,916 )
Net Position at End of Period $ 25,131,569 $ 25,131,569
The notes to these statements are an integral part of these statements.
Water and Sewer
Total Enterprise
Funds
CITY OF ALAMO, TEXAS
Statement of Revenues, Expenses, and Changes in Net Position
Proprietary Funds
For the Year Ended September 30, 2018
Business-type Activities - Enterprise Funds
33

Cash Flows from Operating Activities:
Charges for Services $ 4,137,289
Cash Received from Other Revenue 3,705
Wages and Taxes (854,258)
Supplies and Other (1,890,374)
Net Cash Provided (Used) by Operating Activities 1,396,362
Cash Flows from Non-Capital Financing Activities:
Due From (To) Primary Government 199,114
Transfer From (To) Other Funds (549,300)
Net Cash Provided (Used) by Non-capital Financing Activities (350,186)
Cash Flows from Capital and Related Financing Activities:
Principal Paid (460,512)
Interest Paid (191,113)
Net Cash Provided (Used) for Capital and Related Financing Activities (651,625)
Cash Flows from Investing Activities:
Capital Asset Acquisition (864,394)
Gain (loss) on Sale of Assets -
Interest and Dividends on Investments 44,782
Payments for Acquisition of Investments (29,381)
Net Cash Provided (Used) for Investing Activities (848,993)
Net Increase (Decrease) in Cash and Cash Equivalents (454,442)
Cash and Cash Equivalents at Beginning of Year 2,269,879
Cash and Cash Equivalents at End of Year 1,815,437
Reconciliation of Operating Income to Net Cash
Provided (Used) by Operating Activities:
Operating Income (Loss) 584,317
Adjustments to Reconcile Operating Income to Net Cash
Provided by Operating Activities
Depreciation and amortization 635,280
Change in Assets and Liabilities:
(Increase) Decrease in Receivables (29,402)
(Increase) Decrease in Prepaid Expenses 24,000
(Increase) Decrease in Related to Pension 162,277
Increase (Decrease) in Accounts Payable 11,118
Increase (Decrease) in Customer Deposits 20,500
Increase (Decrease) in Wages and Salaries Payables 200
Increase (Decrease) in Compensated Absences (11,928)
Total Adjustments 812,045
Net Cash Provided (Used) by Operating Activities $ 1,396,362
The notes to these statements are an integral part of these statements.
CITY OF ALAMO, TEXAS
Statement of Cash Flows
Proprietary Funds
For the Year Ended September 30, 2018
Water and Sewer Fund
34

NOTES TO BASIC FINANCIAL STATEMENTS
35

CITY OF ALAMO, TEXAS
Notes to Financial Statements
For the year ended September 30, 2018
I. SUMMARY OF SIGNIFICANT ACCOUNTING POLICIES
A. General Statement
The City of Alamo, Texas (City) was incorporated as a general law city in 1924. The charter established a City
Manager form of government. The municipal government provided by the Charter of the City of Alamo shall be
known as the Board of Commissioners. The Board of Commissioners shall consist of a Mayor and five
Commissioners and which shall enact local legislation, adopt budgets, determine policies, and appoint the City
Manager, who is held responsible to the Board of Commissioners for the execution of the laws and the
administration of the government of the City.
The general governmental functions include law enforcement, fire and other public safety activities, streets,
sanitation, public improvements, public charities, parks and recreation, library services, zoning and general
administrative services. The Enterprise fund is used to account for the operation of its utility operations.
The accounting and reporting policies of the City relating to the funds included in the accompanying basic
financial statements conform to accounting principles generally accepted in the United States of America
applicable to state and local governments. Generally accepted accounting principles for local governments include
those principles prescribed by the Governmental Accounting Standards Board (GASB), the American Institute of
Certified Public Accountants in the publication entitled Audits of State and Local Governmental Units by the
Financial Accounting Standards Board (FASB), when applicable.
B. Financial Reporting Entity
The City’s financial reporting entity comprises the following:
Primary Government: City of Alamo, Texas
The City’s basic financial statements include the accounts of all City operations. The criteria for including
organizations as component units with the City’s reporting entity, as set forth in Section 2100 of GASB’s
Codification of Governmental and Financial Reporting Standards, include whether:
The organization is legally separate (can sue and be sued in their own name)
The City holds the corporate powers of the organization
The City appoints a voting majority of the organization’s board
The City is able to impose its will on the organization
The organization has the potential to impose a financial benefit/burden on the City
There is fiscal dependency by the organization on the City
Blended Component Unit
Blended component units are separate legal entities that meet the component unit criteria described above and
whose governing body is the same of substantially the same as the City Commission or the component unit
provides services entirely to the City. These component units’ funds are blended into those of the City’s by
appropriate activity type to compose the primary government presentation.
The City has one blended component unit, the Alamo Economic Development Corporation (AEDC).
36

CITY OF ALAMO, TEXAS
Notes to Financial Statements
For the year ended September 30, 2018
I. SUMMARY OF SIGNIFICANT ACCOUNTING POLICIES (Continued)
Blended Component Unit (continued)
Alamo Economic Development Corporation – (AEDC) is a nonprofit industrial development corporation
organized for the purpose of promoting, assisting and enhancing economic development activities for the City as
provided by the Development Corporation Act of 1979. Sales Taxes are collected under Section 4B of the
Development Corporation Act of 1979 for these purposes. AEDC was incorporated on January 8, 1999. The
AEDC board is fully appointed by the City Board of Commissioners. The reason it is a blended component unit
is, because the City appoints all AEDC board members and can remove them at will, the AEDC board is
substantially the same as the City governing body. A copy of their annual financial report can be requested and
obtained in the office of the City of Alamo.
C. Government-Wide and Fund Financial Statements
The government-wide financial statements include the statement of the net position and the statement of activities.
These statements report information on all of the non-fiduciary financial information for the City and its
component units. The primary government and component units are presented separately within the financial
statements with the focus on the primary government. Eliminations have been made to minimize the double-
counting of internal activities. Individual funds are not displayed, but the statements distinguish governmental
activities (generally supported by taxes and the city general revenue) from business-type activities (generally
financed in whole or in part with fees charged to external customers). The effect of interfund activity, within the
governmental and business-type activities columns, has been removed from these statements.
The statement of activities demonstrates the degree to which the direct expenses of a given program are offset by
program revenues. Direct expenses are those that are clearly identifiable with a specific function or program.
Program revenues includes 1) charges to customers or applicants whose purchase, use, or directly benefit from
goods, services, or privileges provided by a given program and 2) operating or capital grants and contributions
that are restricted to meeting the operations or capital requirements of a particular program. Taxes and other items
not properly included among program revenues are reported instead as general revenues.
The fund financial statements provide reports on the financial condition and results of operations about the City’s
funds, with separate statements presented for each fund category. The emphasis of fund financial statements is on
major governmental funds, each displayed in a separate column. All remaining governmental funds are
aggregated and reported as non-major funds.
Proprietary fund operating revenues, such as charges for services, result from exchange transactions associated
with the principal activity of the fund. Exchange transactions are those in which each party receives and gives up
essentially equal values. Non-operating revenues, such as subsidies and investment earnings, result from non-
exchange transactions or ancillary activities.
D. Measurement Focus, Basis of Accounting, and Financial Statement Presentation
The financial statements of the City are prepared in accordance with generally accepted accounting principles
(GAAP). The City’s reporting entity applies all relevant GASB pronouncements and applicable FASB
pronouncements and accounting Principles Board (APB) opinions issued on or before November 30, 1989, unless
they conflict with GASB pronouncements. The City’s reporting entity does not apply FASB pronouncements or
APB pronouncements or APB opinions issued after November 30, 1989.
37

CITY OF ALAMO, TEXAS
Notes to Financial Statements
For the year ended September 30, 2018
I. SUMMARY OF SIGNIFICANT ACCOUNTING POLICIES (Continued)
D. Measurement Focus, Basis of Accounting, and Financial Statement Presentation (continued)
The government-wide statements and fund financial statements for proprietary funds are reported using the
economic resources measurement focus and the accrual basis of accounting, as are the proprietary fund financial
statements. The economic resources measurement focus means all assets and liabilities (whether current or non-
current) and deferred outflows and inflows of resources are included on the statement of net position and the
operating statements present increase (revenues) and decrease (expenses) in net total assets.
Under the accrual basis of accounting, revenues are recognized when earned, including unbilled water and sewer
services which are accrued. Expenses are recognized at the time the liability is incurred. Property taxes are
recognized as revenues in the year for which they are levied. Grants and similar items are recognized as revenue
as soon as all eligibility requirements imposed by the provider have been met.
Governmental fund financial statements are reported using the current financial resources measurement focus and
are accounted for using the modified accrual basis of accounting. Under the modified accrual basis of accounting,
revenues are recognized when susceptible to accrual; i.e., when they become both measurable and available.
“Measurable” means the amount of the transaction can be determined and “available” means collectible within the
current period or soon enough thereafter to be used to pay liabilities of current period. The City considers property
taxes as available if they are collected within 60 days after year-end. Expenditures are recorded when the related
fund liability is incurred. However, debt service expenditures, as well as expenditures related to compensated
absences are recorded only when payment is due. The revenues susceptible to accrual are property taxes, franchise
taxes, licenses, charges for service, interest income and intergovernmental revenues. Sales taxes collected and
held by the state at year-end on behalf of the government are also recognized as revenue. All other governmental
fund revenues are recognized when received. Operating income reported in proprietary fund financial statements
includes revenues and expenses related to the primary, continuing operations of the fund. Principal operating
revenues for proprietary funds are charges to customers for sales or services. Principal operating expenses are the
costs of providing goods and services and include administrative expenses and depreciation of capital assets.
Other revenues and expenses are classified as non-operating in the financial statements.
When both restricted and unrestricted resources are available for use, it is the City’s policy to use restricted
resources first, then unrestricted resources as needed.
E. Fund Types and Major Funds
Governmental Funds
The City’s basic financial statements include the accounts of all City operations. The criteria for including
organizations
General Fund – reports the primary fund of the City. This fund is used to account for all financial
resources not reported in other funds.
Alamo Economic Development Corporation – is a nonprofit industrial development corporation organized
for the purpose of promoting, assisting and enhancing economic development activities for the City.
Proprietary Funds
The City reports the following major enterprise funds:
Water & Sewer Fund – accounts for the provision of water and sewer services to the residents of the City.
38

CITY OF ALAMO, TEXAS
Notes to Financial Statements
For the year ended September 30, 2018
I. SUMMARY OF SIGNIFICANT ACCOUNTING POLICIES (Continued)
Other Fund Types
Additionally, the City reports internal service funds which are used to account for the financing of goods or
services provided by one department to other departments within the City on a cost-reimbursement basis. These
services include fleet management. These are proprietary funds that are reported with governmental activities in
the government-wide financial statements, because the majority of activity is for governmental activities.
Direct expenses are not eliminated from the various functional categories, whereas indirect expenses are.
Reimbursements are treated as reduction of expenses.
F. Assets, Liabilities and Net Position
1. Cash and Investments
Cash of all funds, including restricted cash, are pooled into common pooled accounts in order to maximize
investment opportunities. Each fund whose monies are deposited in the pooled cash accounts has equity therein,
and interest earned on the investment of these monies is allocated based upon relative equity at month end. An
individual fund’s pooled cash are available upon demand and are considered to be “cash equivalents” when
preparing financial statements. All investments are recorded at fair value based on quoted market prices. Fair
Value is the amount at which a financial instrument could be exchanged in a current transaction between willing
parties.
2. Property Taxes
Property taxes are levied by October 1 on the assessed value listed as of the prior January 1 for all real and
business personal property located in the City in conformity with Subtitle E, Texas Property Tax Code. Taxes are
due on receipt of the tax bill and are delinquent if not paid before February 1 of the year following the year in
which imposed. On January 31 of each year, a tax lien attaches to property to secure the payment of all taxes,
penalties, and interest ultimately imposed. Property tax revenues are considered available when they become due
or past due and receivable within the current period.
Taxable property includes real property and certain personal property situated in the City. Certain properties of
religious, educational and charitable organizations, including the federal government and the State of Texas, are
exempt from taxation.
Additionally, there are other exemptions as noted below in arriving at the total assessed valuation of taxable
property. The valuations are subject to county-wide revaluation every five years. The effective rate is based upon
the previous year’s total assessed valuation.
Allowances for uncollectible tax receivables within the General and Debt Service funds are based upon historical
experience in collecting property taxes. Uncollectible personal property taxes are periodically reviewed and
included as part of the allowance for uncollectible; except for tax receivables over 20 year, the city is prohibited
from writing off real property taxes without specific statutory authority from the Texas Legislature. The City does
no write off tax receivable greater than 20 years.
3. Inventories
The inventories are recorded at cost and are accounted for by the consumption method.
39

CITY OF ALAMO, TEXAS
Notes to Financial Statements
For the year ended September 30, 2018
I. SUMMARY OF SIGNIFICANT ACCOUNTING POLICIES (Continued)
4. Receivables and Payables
Activities between funds that are representative of lending/borrowing arrangements outstanding at the end of the
fiscal year are referred to as either “due to/from other funds”. Any residual balances outstanding between the
governmental activities and business-type activities are reported in the governmental-wide financial statements as
“internal balances.” All trade and property tax receivables are shown net of an allowance for uncollectible.
5. Transactions between Funds
Legally authorized transfers are treated as interfund transfers and are included in the results of operations of both
Governmental and Proprietary Funds.
6. Capital Assets
Capital assets include property, plant, and equipment, are reported in the applicable governmental or business-
type activities columns in the government-wide financial statements and in the fund financial statements for
proprietary funds. All capital assets are valued at historical cost or estimated historical cost if actual historical is
not available. Donated assets are capital assets valued at their fair market value on the date donated. Repairs and
maintenance are recorded as expenses. Renewals and betterments are capitalized. Interest has not been
capitalized during the construction period on property, plant and equipment. Assets capitalized have an original
cost of $5,000 or more and over three years of useful life. Depreciation has been calculated on each class of
depreciable property using the straight-line method. Estimated useful lives are as follows:
Buildings 50 Years
Infrastructure 30 Years
Improvements 20 Years
Water and Sewer System 30-50 Years
Machinery and Equipment 3-15 Years
7. Compensated Absences
The liability for compensated absences reported in the government-wide and proprietary fund statements consist
of unpaid, accumulated annual and sick leave balances. The City’s policy allows employees to accumulate unused
sick leave and extra compensation time on an unlimited basis and vacation leave based on the number of years of
full time employment with the City in accordance with the following chart:
Years of Employment Pro-Rata Accrual Rate per Month
0-19 Years 10 hours (15 days per year)
20 & Over 13.33 hours (20 days per year)
Non-exempt employees may accumulate no more than a maximum of two years allotment of vacation leave as set
above. Exempt employees can accumulate more than the maximum. Sick leave may be accrued but will not be
paid out to employees that leave before retirement.
8. Long-Term Obligations
In the government-wide, proprietary and component unit financial statements, long-term debt and other long-term
obligations are reported as liabilities. Bond premiums and discounts, as well as issuance cost are deferred and
amortized over the life of the bonds using the straight line method as the amount is immaterial against the
effective interest method. Unamortized bond premium and discount, issuance cost and gain or loss on refunding
are not netted against the liability, but recorded in the asset portion of the financial statements.
40

CITY OF ALAMO, TEXAS
Notes to Financial Statements
For the year ended September 30, 2018
I. SUMMARY OF SIGNIFICANT ACCOUNTING POLICIES (Continued)
8. Long-Term Obligations (continued)
In the fund financial statements, long-term liabilities are not recorded in the governmental funds as the payment
of the obligations will not be made by current financial resources. The governmental fund financial statements
recognize the proceeds of debt as other financing resources.
9. Restricted Assets
The proceeds and required reserves of debt issuances are recorded as restricted assets as they are restricted for
debt service and/or capital projects, payments and /or purchases.
10. Net Position/ Fund Equity
In the fund financial statements, governmental funds report reservations of fund balance for amounts that are not
available or are legally restricted by outsource parties for use for a specific purpose.
11. Estimates
The preparation of financial statements in accordance with generally accepted accounting principles requires the
use of estimates by management.
12. General Fund’s Fund Balance Policy
The City has adopted GASB 54 as part of its fiscal year ending September 30, 2011. Implementation of GASB
54 is required for all cities for the fiscal year ending 2011. The intention of the GASB is to provide a more
structured classification of fund balance and to improve the usefulness of fund balance reporting to the users if the
City’s financial statements. The reporting standard establishes a hierarchy for fund balance classifications and the
constraints imposed on the use of those resources. GASB 54 provides for two major types of fund balances which
are non-spendable and spendable.
Non-spendable: Fund balances that cannot be spent because they are not expected to be converted to cash or they
are legally or contractually required to remain intact. Examples of this classification are prepaid items,
inventories, noncurrent advances to other funds that are not expected to be collected in the next fiscal year, and
the principal (corpus) of an endowment fund. The City does not have any prepaid items or non-spendable funds
related to an endowment. In addition to non-spendable fund balance, GASB 54 has provided a hierarchy of
spendable fund balances, based on a hierarchy of spending constraints.
Restricted: Fund balances constrained by external parties, constitutional provisions, or enabling legislation. All of
the City’s restricted funds are from capital projects, debt service, economic development and special revenue
funds, whose funds are revenues legally restricted for expenditures for a particular purpose.
Committed: Fund balances that contain self-imposed constraints of the government from its highest level of
decision-making authority. The responsibility to commit funds rests with the elected City Commissioners and
Mayor. Committed amounts cannot be used for any other purpose unless the governing board removes those
constraints by taking the same type of formal action. The City has no committed fund balance as of September
30, 2018.
Assigned: Fund balances that contain self-imposed constraints of the government to be used for a particular
purpose. The responsibility to assign funds rests with the City Manager.
Unassigned: Fund balances of the general fund that is not constrained for any particular purpose. This is also
where negative amounts from the other categories of fund balance are recognized.
41

CITY OF ALAMO, TEXAS
Notes to Financial Statements
For the year ended September 30, 2018
I. SUMMARY OF SIGNIFICANT ACCOUNTING POLICIES (Continued)
12. General Fund’s Fund Balance Policy (continued)
When an expense is incurred for purposes for which both restricted and unrestricted net position are available, the
City typically first applies restricted resources, as appropriate opportunities arise, but reserves the right to
selectively defer he use thereof to a future project or replacement equipment acquisition. When an expense is
incurred for which committed, assigned, or unassigned fund balances are available, the City considers amounts to
have been spent first out of assigned then unassigned, and finally committed funds.
G. Pensions
For the purposes of measuring the net pension liability, deferred outflows of resources and deferred inflows of
resources related to pensions, and pension expense, information about the Fiduciary Net Position of the Texas
Municipal Retirement System (TMRS) and additions to/deductions from TMRS’s Fiduciary Net Position have
been determined on the same basis as they are reported by TMRS.
For this purpose, plan contributions are recognized in the period that compensation is reported for the employee,
which is when contributions are legally due. Benefit payments and refunds are recognized when due and payable
in accordance with the benefit terms. Investments are reported at fair value.
II. STEWARDSHIP, COMPLIANCE AND ACCOUNTABILITY
A. Budgetary Data
The City follows the procedures outlined below in establishing budgetary data reflected in the financial
statements:
Annual Budgets are legally adopted for all City funds with revenue and expense/expenditure activity. The City
Charter states that between sixty (60) and ninety (90) days prior to the end of the fiscal year, the City Manager is
required to submit to the Board of Commissioners a proposed operating budget for the fiscal year commencing
the following October 1. The operating budget includes the proposed expenditures/expenses and the proposed
method to finance them. Dates for public hearings, the purpose of which are to obtain taxpayer’s comments are
set by the Board of Commissioners at the same time the budget is submitted to that body. The Board of
Commissioners may add to, subtract from or change appropriations, but may not change the form of the proposed
budget. Any changes must be within the revenue and reserves estimated as available by the City Manager. Prior
to September 25 of each year, the budget is legally enacted through the passage of an ordinance.
The appropriated budget is prepared by fund, function, and department. The City’s department head’s may make
transfers of appropriations between/within a department in the same fund with the City Administrator’s approval.
Transfers of appropriations between funds require the approval of the Board of Commissioners. The legal level of
budgetary control (i.e., the level at which expenditures may not legally exceed appropriations) is the fund level.
At any time during the fiscal year, the City Manager can reallocate expenditures within a fund without the
approval of the Board of Commissioners. However, any revisions to the budget which increase the total budgeted
expenditures/expenses within any fund must be approved by the Board of Commissioners.
The Board of Commissioners made several budget amendments during the fiscal year. The major reasons for the
amendment were to increase or decrease the budget for revenues increase or decrease the budget for expenditures.
42

CITY OF ALAMO, TEXAS
Notes to Financial Statements
For the year ended September 30, 2018
II. STEWARDSHIP, COMPLIANCE AND ACCOUNTABILITY (Continued)
B. Budget Basis of Accounting
The City prepares its annual budget on a basis (budget basis), which differs from generally accepted accounting
principles (GAAP Basis). The budget and all transactions are presented in accordance with the City’s method
(budget basis) in the Statement of Revenues, Expenditures and Changes in Fund Balances – Budget and Actual –
General fund to provide a meaningful comparison of actual results with the budget. The major differences
between budget and GAAP basis are debt service transactions, capital outlay purchases and the recording of bond
and loan proceeds.
C. Excess of General Fund Expenditures over Appropriations
At September 30, 2018, general fund total expenditures were below budget appropriations by $314,480. Actual
revenues were less than budgeted revenues by $123,812. Actual expenditures for the year exceeded actual
revenues by $299,983, after other financing sources.
D. Finance-Related Legal and Contractual Provisions
In accordance with GASB Statement No. 38, “Certain Financial Statement Note Disclosures”, violations of
finance-related legal and contractual provisions, if any, are reported below, along with actions taken to address
such violations:
Violation Action Taken
None Not Applicable
E. Deficit Fund Equity / Net Position
There were not any funds with a deficit fund balance/net position.
III. DETAILED NOTES ON FUNDS AND COMPONTENT UNITS
A. Cash and Cash Equivalents
1. Deposits and Investments
City’s funds are required to be deposited and invested under the terms of a depository contract and investment
policy pursuant to state statute. The depository bank deposits for safekeeping and trust with its agent approved
pledged securities authorized by Chapter 2257 Collateral for Public Funds of the Government Code in an amount
sufficient to protect City funds on a day-to-day basis during the period of the contract. The pledge of approved
securities is waived only to the extent of the dollar amount of Federal Deposit Insurance Corporation (FDIC)
insurance.
At September 30, 2018, the carrying amount of the City’s deposits was $5,790,362.
The City has one depositary account: Frost Bank
Custodial credit risk is the risk that in the event of a bank failure, the City’s deposits may not be returned to it.
The City has a policy of maintaining contact with the trust department of its depository agency to eliminate all
custodial credit risk.
43

CITY OF ALAMO, TEXAS
Notes to Financial Statements
For the year ended September 30, 2018
III. DETAILED NOTES ON FUNDS AND COMPONTENT UNITS
A. Cash and Cash Equivalents
1. Deposits and Investments (continued)
The highest cash balance for the city occurred November 2, 2017 in the amount of $5,793,000 and was fully
collateralized by pledged securities in the amount of $5,146,067. As of September 30, 2018, the City’s bank
balance of $5,107,466, was not exposed to custodial credit risk and was fully insured and fully collateralized by
$250,000 FDIC insurance and $5,146,067 of pledged securities.
B. Investments
The City of Alamo, Texas is required by Government Code Chapter 2256, The Public Funds Investment Act, to
adopt, implement, and publicize an investment policy. That policy must address the following areas: (1) safety of
principal and liquidity, (2) portfolio diversification, (3) allowable investments, (4) acceptable risk levels, (5)
expected rates of return, (6) maximum allowable stated maturity of portfolio investments, (7) maximum average
dollar-weighted maturity allowed based on the stated maturity date for the portfolio, (8) investment staff quality
and capabilities, and (9) bid solicitation preferences for certificates of deposit.
The Public Investment Act (“Act”) requires an annual audit of investment practices. The City has adopted a
deposit and investment policy. Audit procedures in this area conducted as a part of the audit of the basic financial
statements disclosed that in the areas of investment practices, management reports and establishment of
appropriate policies, the City adhered to the requirements of the Act.
A total of $5,901,721 was invested in TexPool as of September 30, 2018.
The Act determines the types of investments which are allowable for the City:
1) Obligations of, or guaranteed by, governmental entities as permitted by Government Code 2256.009
2) Certificates of deposit and share certificates as permitted by Government Code 2256.010
3) Fully collateralized repurchase agreements as permitted by Government Code 2256.011
4) A securities lending program as permitted by Government Code 2256.0115
5) Banker’s acceptances as permitted by Government Code 2256.012
6) Commercial paper as permitted by Government Code 2256.013
7) No-load money market mutual funds and no-load mutual funds as permitted by Government Code
2256.014
8) A guaranteed investment contract as an investment vehicle for bond proceeds, provided it meets the
criteria and eligibility requirements as established by Government Code 2256.015
9) Public funds investment pools as permitted by Government Code 2256.016
State law and the City’s Investment Policy restrict depository time and demand deposits to those fully
collateralized or FDIC insured from eligible depositories (banks) doing business in Texas. By policy, depository
CDs are limited to maturities not exceeding two (2) years and require collateralization to 102% with pledged
securities (and 110% if collateral is a mortgage backed security). All collateral is to be held by an independent
custodian. The pledging bank is contractually responsible for monitoring and maintaining the collateral margins
daily. Brokered CD securities must be FDIC insured and delivered versus payment to the City’s depository. The
maximum maturity for brokered CDs is one year and FDIC insurance must be verified before purchase. The
policy requires that FDIC status of the brokered CD banks be monitored weekly and any mergers exposing the
City to non-FDIC coverage requires immediate liquidation.
44

CITY OF ALAMO, TEXAS
Notes to Financial Statements
For the year ended September 30, 2018
III. DETAILED NOTES ON FUNDS AND COMPONTENT UNITS (Continued)
B. Investments (continued)
State law and the City’s adopted Investment Policy limit repurchase agreements to primary dealers or banks doing
business in Texas. The policy requires independent safekeeping of collateral, and a 102% margin on collateral.
Repurchase agreements are limited to a maximum maturity of three (3) years executed under a Master Repurchase
Agreement.
Constant dollar, local-government investment pools, as by state law (2256.016) and approved by the adopted
Policy are authorized. By state law, all local government pools are rated AAA or equivalent by at least one
NRSRO (Nationally Recognized Securities Ratings Organization). All pools by Policy must strive to maintain a
$1 NAV. Debt issued by states, local governments and other political subdivisions must be general obligations of
the issuer and be rated A or better by at least one NRSRO and are restricted to two (2) years to maturity. AAA
rated, SEC registered money market mutual funds are authorized if they strive to maintain a $1 NAV. The
Qualified School Construction Note Funds are defined as a separate sub-portfolio which has a maximum stated
maturity and weighted average maturity of five (5) years. The policy restricts all other investments to a maximum
stated maturity of two (2) years and also restricts the portfolio to a weighted average maturity of 180 days.
As of September 30, 2018:
Holdings in Agencies represented 58.3% of the total portfolio.
Holdings in Repurchase Agreements represent 27.4% of the total portfolio.
Holdings in Money Market funds represented 9.3% of the portfolio.
Holdings in U.S Treasury obligations represented 5.0% of the total portfolio.
GASB Statement No. 40 requires a determination as to whether the City was exposed to the following specific
investment risks at year end and if so, the reporting of certain related disclosures:
Interest Rate Risk: Interest-rate risk reduces the exposure to changes in interest rates that could adversely
affect the value of investments. The City shall use final and weighted-average maturity data. In order to
limit interest and market rate risk from changes in interest rates, the City’s adopted Investment Policy
sets a maximum maturity of two (2) years. The total portfolio has a dollar weighted average maturity
(WAM) limit of 180 days. The investment in the QSCN Reserve Fund has a maturity of 667 days in
keeping with its specific policy and goals. the City’s investment in TexPool are available daily.
Credit Risk: Credit risk is the risk that an issuer or other counterparty to an investment will not fulfill its
obligations. The ratings of securities by nationally recognized agencies are designed to give an
indication of credit risk. At year end, the City was not exposed to credit risk.
Custodial Credit Risk: Deposits and investments are exposed to custodial credit risk if they are not
covered by depository insurance and the deposits and investments are uncollateralized, collateralized
with securities held by the pledging financial institution, or collateralized with securities held by the
pledging financial institution’s trust department or agent but not in the City’s name. At year end, the City
was not exposed to custodial credit risk.
Concentration of Credit Risk: The investment policy of the City contains no limitations on the amount
that can be invested in any one issuer beyond that stipulated by the Public Funds Investment Act.
45

CITY OF ALAMO, TEXAS
Notes to Financial Statements
For the year ended September 30, 2018
III. DETAILED NOTES ON FUNDS AND COMPONTENT UNITS (Continued)
B. Investments (continued)
Foreign Currency Risk: This is the risk that exchange rates will adversely affect the fair value of an
investment. At year end, the City was not exposed to foreign currency risk.
The City’s general policy is to report money market investments and short-term participating interest-earning
investment contracts at amortized cost and to report nonparticipating interest-earning investment contracts using a
cost-based measure. However, if the fair value of an investment is significantly affected by the impairment of the
credit standing of the issuer or by other factors, it is reported at fair value. All other investments are reported at
fair value unless a legal contract exists which guarantees a higher value.
The term “short-term” refers to investments which have a remaining term of one year or less at the time of
purchase. The term “nonparticipating” means that the investment’s value does not vary with market interest rate
changes. Nonnegotiable certificates of deposit are examples of nonparticipating interest-earning investment
contracts.
Public Funds Investment Pools
Public funds investment pools in Texas ("Pools") are established under the authority of the Interlocal Cooperation
Act, Chapter 79 of the Texas Government Code, and are subject to the provisions of the Public Funds Investment
Act (the "Act"). Chapter 2256 of the Texas Government Code, in addition to other provisions of the Act designed
to promote liquidity and safety of principal, the Act requires Pools to: 1) have an advisory board composed of
participants in the pool and other persons who do not have a business relationship with the pool and are qualified
to advise the pool; 2) maintain a continuous rating of no lower than AAA or AAA-m or an equivalent rating by at
least one nationally recognized rating service; and 3) maintain the market value of its underlying investment
portfolio within one half of one percent of the value of its shares.
The City’s investment in Pools are reported at an amount determined by the fair value per share of the pool's
underlying portfolio, unless the pool is 2a7-like, in which case they are reported at amortized cost. A 2a7-like
pool is one which is not registered with the Securities and Exchange Commission ("SEC") as an investment
company, but nevertheless has a policy that it will, and does, operate in a manner consistent with the SEC's Rule
2a7 of the Investment Company Act of 1940.
Texas Local Government Investment Pool (TexPool), which is a local government investment pool that was
established in conformity with the Interlocal Cooperation Act, Chapter 791 of the Texas Government Code, and
operates under the Public Funds Investment Act, Chapter 2256 of the Texas Government Code. The State
Comptroller of Public Accounts oversees TexPool. Federated Investors, Inc. is the administrator and investment
manager of TexPool under a contract with the State Comptroller. In accordance with the Public Funds Investment
Act, the State Comptroller has appointed the TexPool Investment Advisory Board to advice with respect to
TexPool. The board is composed equally of participants in TexPool Portfolios and other persons who do not have
a business relationship with TexPool Portfolios and are qualified to advice in respect to TexPool Portfolios. The
Advisory Board members review the investment policy and management fee structure. TexPool is rated AAAm
by Standard & Poor’s and operates in a manner consistent with the SEC’s Rule 2a7 of the Investment Company
Act of 1940. All investments are stated at amortized cost, which usually approximates the market value of the
securities. The stated objective of TexPool is to maintain a stable average of $1.00 per unit net asset value;
however, the $1.00 net asset value is not guaranteed or insured. The financial statements can be obtained from the
Texas Trust Safekeeping Trust Company website at www.ttstc.org.
46

CITY OF ALAMO, TEXAS
Notes to Financial Statements
For the year ended September 30, 2018
III. DETAILED NOTES ON FUNDS AND COMPONTENT UNITS (Continued)
B. Investments (continued)
The City’s investments at September 30, 2018 are shown below:
Reported At Description
Reported
Amount
Weighted
Average
Maturity
(days)
Standard
& Poor's
Rating
Concentration
of Credit Risk
Market Value TexPool Investment Fund $ 5,901,720 28 AAA-m 100.0%
C. Disaggregation of Receivables
Receivables for the City at September 30, 2018, were as follows:
Accounts Allowance for
Governmental Funds Receivable Uncollectible Total (Net)
Property Taxes 471,159$ 47,116$ 424,043$
Sales Taxes 590,165 - 590,165
Franchise Taxes 60,033 - 60,033
Court Fines and Fees 570,674 285,337 285,337
Note Receivables 474,382 - 474,382
Utility Customers 245,281 - 245,281
Other Sources 184,001 - 184,001
2,595,696$ 332,453$ 2,263,243$
Accounts Allowance for
Business-Type- Funds Receivable Uncollectible Total (Net)
Utility Customers 585,552$ 172,808$ 412,744$
Other Sources 556 - 556
586,108$ 172,808$ 413,300$
47

CITY OF ALAMO, TEXAS
Notes to Financial Statements
For the year ended September 30, 2018
III. DETAILED NOTES ON FUNDS AND COMPONTENT UNITS (Continued)
D. Deferred Inflows of Resources & Unearned Revenues
Governmental funds defer revenue recognition in connection with resources that have been received, but not yet
earned. At the end of the year, the various components of deferred revenue and unearned revenue reported in the
fund financial statements were as follows:
E. Due from Other Funds
The City reports interfund balances between many of its funds. The total of all balances agrees with the sum of
interfund balances presented in the statements of net position/balance sheets for governmental and enterprise
funds. The interfund balances are operational and short-term in nature. Interfund balances at September 30, 2018
consisted of the following:
1. Deferred Inflows of Resources
General Debt Service
Deferred Inflows Description Fund Fund Total
Property Taxes 332,519$ 68,372$ 400,891$
Court Fines 285,337 - 285,337
Total 617,856$ 68,372$ 686,228$
Total Deferred Inflows for Primary Government 686,228$
2. Unearned Revenues
Asset Urban
Unearned Revenues Description Forfeiture County Total
Grant Receivable-CDBG Program 5,181$ 261,987$ 267,168$
Total 5,181$ 261,987$ 267,168$
Total Unearned Revenues for Primary Government 267,168$
General Economic Water &
Fund Development Sewer Fund Totals
General Fund 271,522$ 1,920$ 172,162$ 445,604$
Total Governemental Funds 271,522 1,920 172,162 445,604
Water and Sewer Fund 3,062 - - 3,062
Total Enterprise Funds 3,062 - - 3,062
Totals 274,584$ 1,920$ 172,162$ 448,666$
Due from
Du
e T
o
48

CITY OF ALAMO, TEXAS
Notes to Financial Statements
For the year ended September 30, 2018
III. DETAILED NOTES ON FUNDS AND COMPONTENT UNITS (Continued)
F. Interfund Transfers
The City reports interfund transfers between many of its funds. Interfund transfers for the year ended September
30, 2018, consisted of the following:
Notes to the financials continue on next page
General Economic Water &
Fund Development Sewer Fund Totals
General Fund -$ 40,000$ 350,000$ 390,000$
Economic Development IRP -$ 194 -$ 194
Debt Service Funds - 495,550 199,300 694,850
TIRZ Fund 62,187 - - 62,187
Total Governemental Funds 62,187$ 535,744$ 549,300$ 1,147,231$
Transfers Out
Tra
nsf
ers
In
Transfers From Transfers To Amount Reason
AEDC General Fund 40,000$ Administration Fee.
AEDC Debt Service Fund 495,550 To provide resources for repayment of Certificate
of Obligations Series 2008 & 2013.
AEDC AEDC - IRP 194 Close account.
General Fund TIRZ 62,187
Enterprise Fund General Fund 350,000 To provide resources for administration fees.
General Fund Debt Service Fund 199,300 To provide resources for repayment of certificate
Total 1,147,231$ of obligations Series 2012A.
To provide resources for Annual Contribution for
property tax.
49

CITY OF ALAMO, TEXAS Notes to Financial Statements
For the year ended September 30, 2018
III. DETAILED NOTES ON FUNDS AND COMPONTENT UNITS (Continued) G. Capital Assets Capital asset activity for the year ended September 30, 2018 was as follows:
Primary GovernmentGovernmental Activities: Beginning EndingCapital Assets not being depreciated: Balances Increases Decreases Balances
Land and right of way 1,731,590$ -$ -$ 1,731,590$ Construction in Progress 1,744,253 296,363 (1,487,423) 553,193
Total capital assets, not being depreciated 3,475,843 296,363 (1,487,423) 2,284,783
Capital assets, being depreciated:Building and Improvements 13,034,989 - - 13,034,989 Vehicles 2,826,631 557,669 - 3,384,300 Machinery & Equipment 2,532,116 32,367 - 2,564,483 Infrastructure 14,838,887 1,256,803 - 16,095,690
Total capital assets, being depreciated 33,232,623 1,846,839 - 35,079,462
Less accumulated depreciation for:Buildings and Improvement (3,619,707) (306,338) - (3,926,045) Vehicles (2,009,148) (229,212) - (2,238,360) Machinery & Equipment (1,150,438) (140,766) - (1,291,204) Infrastructure (3,734,026) (363,609) - (4,097,635)
Total accumulated depreciation (10,513,319) (1,039,925) - (11,553,244) Total capital assets, being depreciated, net 22,719,304 806,914 - 23,526,218 Governmental activities capital assets, net 26,195,147$ 1,103,277$ (1,487,423)$ 25,811,001$
Business-Type Activities Beginning EndingCapital Assets not being depreciated: Balances Increases Decreases Balances
Land and right of way 2,943,078$ -$ -$ 2,943,078$ Construction in Progress 112,561 640,035 (307,959) 444,637
Total capital assets, not being depreciated 3,055,639 640,035 (307,959) 3,387,715
Capital assets, being depreciated:Building and Improvements 4,838,176 - - 4,838,176 Vehicles 233,117 - - 233,117 Machinery & Equipment 1,634,585 30,274 - 1,664,859 Infrastructure 25,428,782 502,044 - 25,930,826
Total capital assets, being depreciated 32,134,660 532,318 - 32,666,978
Less accumulated depreciation for:Buildings and Improvement (1,531,758) (105,137) - (1,636,895) Vehicles (116,703) (25,512) - (142,215) Machinery & Equipment (690,101) (166,500) - (856,601) Infrastructure (5,583,528) (338,131) - (5,921,659)
Total accumulated depreciation (7,922,090) (635,280) - (8,557,370) Total capital assets, being depreciated, net 24,212,570 (102,962) - 24,109,608 Business-Type capital assets, net 27,268,209$ 537,073$ (307,959)$ 27,497,323$
Total Primary Governnment Total 53,463,356$ 1,640,350$ (1,795,382)$ 53,308,324$
50

CITY OF ALAMO, TEXAS
Notes to Financial Statements
For the year ended September 30, 2018
III. DETAILED NOTES ON FUNDS AND COMPONTENT UNITS (Continued)
G. Capital Assets (continued)
H. Long Term Obligations
The following schedule summarizes the changes in long-term debt, pension liability, and compensated absences
as of September 30, 2018:
Depreciation expense was charged to functions of the governmental activities as follows:
Depreciation
Expenditures By Function
General Government 405,148$
Public Safety 408,601
Highways and Streets 66,779
Health and Welfare 26,607
Culture and Recreation 107,009
Economic Development 25,781
Total Allocable Expenditures 1,039,925$
Governmental Activities Original Final Coupon Original Outstanding
Description Issue Maturity Rate % Issue Balance 9/30/18
Bond Series 2008 4/17/2008 2/15/2028 3.75% 3,000,000 1,800,000
Bond Series 2012 - A 12/1/2012 2/15/2032 2.00% - 3.00% 7,075,000 5,300,000
Bond Series 2013 1/15/2013 2/15/2026 2.00% - 3.25% 3,835,000 2,375,000
13,910,000$ 9,475,000$
Interest paid on bonded indebtness during the current year was 295,065$
Deferred Outflow/Inflow of Resources Beginning Balance Increase Decrease Ending Balance
Unamortized Premium / Discount (437,948)$ -$ 36,429$ (401,519)$
Unamortized Loss on Refunding of Debt 79,512 - 8,835 70,677
Business-Type Activities Original Final Coupon Original Outstanding
Description Issue Maturity Rate % Issue Balance 9/30/18
W & S, Bond Series 2000 6/1/2000 8/1/2040 4.50% 2,967,000$ 2,274,000$
Bond Series 2007 10/18/2007 3/1/2027 2.20% - 2.75% 4,000,000 2,410,000
Bond Series 2012 4/2/2012 3/1/2022 0.008% - 2.48% 279,000 125,000
Bond Series 2017 3/30/2017 3/1/2037 .120% - 2.87% 1,000,000 955,000
8,246,000$ 5,764,000$
Interest paid on bonded indebtness during the current year was 185,576$
Restated
Deferred Outflow/Inflow of Resources Beginning Balance Increase Decrease Ending Balance
Unamortized Premium / Discount (18,179)$ -$ 908$ (17,271)$
51

CITY OF ALAMO, TEXAS
Notes to Financial Statements
For the year ended September 30, 2018
III. DETAILED NOTES ON FUNDS AND COMPONTENT UNITS (Continued)
H. Long Term Obligations (continued)
Governmental Activities Outstanding Issued Retired Outstanding Amounts Due
Description Balance 10/01/17 Current Current Balance 9/30/18 Within One year
Bond Series 2008 1,945,000$ - 145,000 1,800,000 150,000
Bond Series 2012 - A 5,670,000 - 370,000 5,300,000 375,000
Bond Series 2013 2,730,000 - 355,000 2,375,000 360,000
Total Bonds Payable 10,345,000$ -$ 870,000$ 9,475,000$ 885,000$
Business-Type Activities Outstanding Issued Retired Outstanding Amounts Due
Description Balance 10/01/17 Current Current Balance 9/30/2018 Within One year
W & S, Bond Series 2000 2,333,000$ -$ 59,000$ 2,274,000$ 62,000$
Bond Series 2007 2,345,000 - 205,000 2,140,000 215,000
Bond Series 2012 153,000 - 28,000 125,000 29,000
Bond Series 2017 1,000,000 - 45,000 955,000 45,000
Total Bonds Payable 5,831,000$ -$ 337,000$ 5,494,000$ 351,000$
Governmental Activities Beginning Ending Amounts Due
Obligation Balance Increases Decreases Balance Within One year
General Obligation Bonds 10,345,000$ -$ 870,000$ 9,475,000$ 885,000$
Capital Leases 812,657 - 173,863 638,794 177,638
Loan Payables 653,254 - 24,554 628,700 24,799
Sick and Vacation Leave 357,962 282,568 306,836 333,694 -
Total Governmental Activities 12,168,873$ 282,568$ 1,375,253$ 11,076,188$ 1,087,437$
Business-Type Activities Beginning Ending Amounts Due
Obligation Balance Increases Decreases Balance Within One year
General Obligation Bonds 5,831,000$ -$ 337,000$ 5,494,000$ 351,000$
Capital Leases 313,457 - 123,511 189,946 124,012
Sick and Vacation Leave 41,403 31,598 43,525 29,476 -
Total Business-Type Activities 6,185,860$ 31,598$ 504,036$ 5,713,422$ 475,012$
Governmental Activities
Restated
Beginning Ending
Obligation Balance Increases Decreases Balance
**Net Pension Liability 1,647,672$ -$ 741,762$ 905,910$
Business-Type Activities Beginning Ending
Obligation Balance Increases Decreases Balance
**Net Pension Liability 150,132$ 9,734$ 159,866$
** Per GASB 68, beginning balance for net pension liability includes the restatement of net pension liability at September 30, 2017
52

53

54

CITY OF ALAMO, TEXAS
Notes to Financial Statements
For the year ended September 30, 2018
IV. OTHER INFORMATION
A. Risk Management
The City is exposed to various risks of loss related to torts, theft of, damage to, and destruction of assets, errors
and omissions, injuries to employees (workman’s compensation), and natural disasters. During the fiscal year, the
City obtained general liability coverage at a cost that is considered to be economically justifiable by joining
together with other governmental entities in the State as a member of the Texas Municipal League
Intergovernmental Risk Pool (TML). TML is a self-funded pool operating as a common risk management and
insurance program. The City pays an annual premium to TML for its above insurance coverage. The agreement
for the formation of TML provides that TML will be self-sustaining through member premiums and will reinsure
through commercial companies for claims in excess of acceptable risk levels; however, each category of coverage
has its own level of reinsurance. The City continues to carry commercial insurance for other risks of loss. There
were no significant reductions in commercial insurance coverage in the past fiscal year and settled claims
resulting from these risks have not exceeded coverage in any of the past three fiscal years. A copy of TML’s
comprehensive annual report may be obtained by request at the following address:
Texas Municipal League
1821 Rutherford Lane, Suite 400
Austin, TX 78754-5128
B. Defined Benefit Pension Plans
1. Plan Description
The City participates as one of 860 plans in the non-traditional, joint contributory, hybrid defined benefit plan
administered by the Texas Municipal Retirement System (TMRS). TMRS is an agency created by the State of
Texas and administered in accordance with the TMRS Act, Subtitle G, Title 8, Texas Government Code (the
TMRS Act) as an agent multiple-employer retirement system for municipal employees in the State of Texas. The
TMRS Act places the general administration and management of the System with a six-member Board of
Trustees. Although the Governor, with the advice and consent Senate, appoints the Board, TMRS is not fiscally
dependent on the State of Texas. TMRS’s defined benefit pension plan is a tax-qualified plan under Sections
401(a) of the Internal Revenue Code. TMRS issues a publicly available comprehensive annual financial report
(CAFR) that can be obtained at www.tmrs.com.
All eligible employees of the City are required to participate in TMRS.
Notes to the financials continue on next page
55

CITY OF ALAMO, TEXAS
Notes to Financial Statements
For the year ended September 30, 2018
IV. OTHER INFORMATION (Continued)
B. Defined Benefit Pension Plans (continued)
2. Benefits Provided
TMRS provides retirement, disability, and death benefits. Benefit provisions are adopted by the governing body
of the City, within the options available in the state statutes governing TMRS.
At retirement, the benefit is calculated as if the sum of the employee’s contributions, with interest, and the city-
financed monetary credits with interest were used to purchase an annuity. Members may choose to receive their
retirement benefit in one of seven payments options. Members may also choose to receive a portion of their
benefit as a Partial Lump Sum Distribution in an amount equal to 12, 24, or 36 monthly payments, which cannot
exceed 75% of the member’s deposits and interest. Plan provisions for the City were as follows:
3. Contributions
The Contribution rates for employees in TMRS are either 5%, 6%, or 7% of employee gross earnings, and the
City matching percentages are either 100%, 150%, or 200%, both as adopted by the governing body of the City.
Under the state law governing TMRS, the contribution rate for each city is determined annually by the actuary,
using the Entry Age Normal (EAN) actuarial cost method. The actuarially determined rate is the estimated
amount necessary to finance the cost of benefits earned by employees during the year, with an additional amount
to finance any unfunded accrued liability.
Employees for the City of Alamo, Texas were required to contribute 5% of their annual gross earnings during the
fiscal year. The contribution rates for the City of Alamo, Texas were 7.50% and 7.50% in calendar years 2016 and
2017, respectively. The City’s contributions to TMRS for the year ended September 30, 2018, were $336,920, and
were equal to the required contributions.
4. Net Pension Liability
The City’s Net Pension Liability (NPL) was measured as of December 31, 2018, and the Total Pension Liability
(TPL) used to calculate the Net Pension Liability was determined by an actuarial valuation as of that date.
Plan Year 2018 Plan Year 2017
Employee deposit rate 5.00% 5.00%
Matching ratio (city to employee) 1.5 to 1 1.5 to 1
Years required for vesting 5 5
Retirement Eligibility
(Age/Service) 60/5, 0/20 60/5, 0/20
Updated Service Credit 100% Repeating, Transfers 100% Repeating, Transfers
Annuity Increase (to retirees) 70% of CPI Repeating 70% of CPI Repeating
Supplemental Death Benefit to
Active Employees Yes Yes
Supplemental Death Benefit to
Retirees Yes Yes
56

CITY OF ALAMO, TEXAS
Notes to Financial Statements
For the year ended September 30, 2018
IV. OTHER INFORMATION (Continued)
B. Defined Benefit Pension Plans (continued)
Actuarial assumptions:
The Total Pension Liability in the December 31, 2017 actuarial valuation was determined using the following
actuarial assumptions:
Actuarial assumptions used in the December 31, 2017, valuation were based on the results of actuarial experience
studies. The experience study in TMRS was for the period December 31, 2010 through December 31, 2014, first
used in the December 31, 2015 actuarial valuation. Healthy post-retirement mortality rates and annuity purchase
rates were updated based on a Mortality Experience Investigation Study covering 2009 through 2011, and dated
December 31, 2013. These assumptions were first used in the December 31, 2013 valuation, along with a change
to the Entry Age Normal (EAN) actuarial cost method. Assumptions are reviewed annually. No additional
changes were made for the 2015 valuation.
The long-term expected rate of return on pension plan investments is 6.75%. The pension plan’s policy in regard
to the allocation of invested assets is established and may be amended by the TMRS Board of Trustees. Plan
assets are managed on a total return basis with an emphasis on both capital appreciation as well as the production
of income, in order to satisfy the sort-term and long-term funding needs of TMRS.
Notes Actuarially determined contribution rates are calculated as of December 31
and become effective in January 13 months later.
Actuarial Cost Method Entry Age Normal
Amortization Method Level Percentage of Payroll, Closed
Remaining Amortization Period 28 years
Asset Valuation Method 10 year smoothed market; 15% soft corridor
Inflation 2.50%
Salary Increases 3.50% to 10.5% including inflation
Investment Rate of Return 6.75%
Retirement Age Experience-based table of rates that are specifit to the City's plan of benefits.
Last updated for the 2015 valuation pursuant to an experience study of the
period 2010-2014.
Mortality RP2000 Combined Mortality Table with Blue Collar Adjustment with male rates
multiplied by 109% and female rates multiplied by 103% and projected on a fully
generational basis with scale BB.
Other Information
Notes There were no benefit changes during the year.
Methods and Assumptions Used to Determine Contribution Rates:
Valuation Date:
57

CITY OF ALAMO, TEXAS
Notes to Financial Statements
For the year ended September 30, 2018
IV. OTHER INFORMATION (Continued)
B. Defined Benefit Pension Plans (continued)
The long-term expected rate of return on pension plan investments was determined using a building – block
method in which best estimate ranges of expected future real rates of return (expected returns, net of pension plan
investment expense and inflation) are developed for each major assets class. These ranges are combined to
produce the long-term expected rate of return by weighting the expected future real rates of return by the target
assets allocation percentage and by adding expected inflation.
The target allocation rates of return for each major asset class are summarized in the following table:
Discount Rate
The discount rate used to measure the Total Pension Liability was 6.75%. The projection of cash flows used to
determine the discount rate assumed that employee and employer contributions will be made at the rates specified
in statute. Based on that assumption, the pension plan’s Fiduciary Net Position was projected to be available to
make all projected future benefit payments of current active and inactive employees. Therefore, the long-term
expected rate of return on pension plan investments was applied to all periods of projected benefit payments to
determine the Total Pension Liability.
At September 30, 2018, the City reported a net pension liability of $1,065,776.
Net Pension Liability 12/31/2017 12/31/2016
Total Pension Liability 10,568,255$ 9,889,636$
Plan Fiduciary Net Position 9,502,479 8,091,832
Net Pension Liability 1,065,776$ 1,797,804$
Plan Fiduciary Net Position as a Percentage of Total Pension Liability 89.92% 81.82%
Net Pension Liability as a Percentage of Covered Payroll 24.05% 41.17%
Asset Minimum Target Maximum
Class Allocation Allocation Allocation
U.S. Equity 12.5% 17.5% 22.5%
International Equity 12.5% 17.5% 22.5%
Core Fixed Income 5% 10% 15%
Non-Core Fixed Income 15% 20% 25%
Real Return 5% 10% 15%
Real Estate 5% 10% 15%
Absolute Return 5% 10% 15%
Private Equity 0% 5% 10%
Cash Equivalent 0% 0% 10%
Total 100%
58

CITY OF ALAMO, TEXAS
Notes to Financial Statements
For the year ended September 30, 2018
IV. OTHER INFORMATION (Continued)
B. Defined Benefit Pension Plans (continued)
For the year ended September 30, 2018, the City recognized a pension expense of $282,265.
Sensitivity of the net pension liability to changes in the discount rate.
The following presents the net pension liability of the City, calculated using the discount rate of 6.75%, as well as
what the City’s net pension liability would be if it were calculated using a discount rate that is 1 percentage-point
lower (5.75%) or 1 percentage point higher (7.75%) than the current rate:
Pension Plan Fiduciary Net Position
Detailed information about the pension plan’s Fiduciary Net Position is available in a separately-issued TMRS
financial report. That report may be obtained on the internet at www.tmrs.com.
1. Total Service Cost 436,093$
2. Interest on the Total Pension Liability 673,375
3. Current Period Benefit Charges -
4. Emoloyee Contributions (Reduction of Expense) (221,367)
5. Projected Earnings on Plan Investments (Reduction of Expense) (546,199)
6. Administrative Expense 5,812
7. Other Fiduciary Net Position 295
8. Recognition of Current Year Outflow (inflow) of Resources - Liabilities (31,751)
9. Recognition of Current Year Outflow (inflow) of Resources - Assets (115,158)
10. Amortization of Prior Year Outflows (Inflows) of Resources - Liabilities (33,323)
11. Amortization of Prior Year Outflows (Inflows) of Resources - Assets 114,488
12. Total Pension Expense 282,265$
Schedule of Pension Expense
Current Single
1% Decrease Rate Assumption 1% Increase
5.75% 6.75% 7.75%
2,817,334$ 1,065,776$ (342,219)$
59

CITY OF ALAMO, TEXAS
Notes to Financial Statements
For the year ended September 30, 2018
IV. OTHER INFORMATION (Continued)
B. Defined Benefit Pension Plans (continued)
At September 30, 2018, the City reported its deferred outflows and inflows of resources to pensions from the
following sources:
The amount of $(596,208) reported as deferred outflows of resources related to pensions resulting from
contributions subsequent to the measurement date will be recognized as a reduction of the net pension liability for
the year ending September 30, 2018.
Recognition 2017 Deferred
Period (or Total (Inflow) Recognized (Inflow)/Outflow
Amortization or Ourflow of in Current in Future
Years) Resources Pension Expense Expense
Due to Liabilities:
Difference in expected
and actual experience 5.2700 (167,328)$ (31,751)$ (135,577)$
[actuarial (gains) or losses]
Change in assumptions 5.2700 - - -$
[actuarial (gains) or losses]
(31,751)$ (135,577)$
Due to Assets:
Difference in projected and
actual earnings on pension 5.0000 (575,789) (115,158) (460,631)
plan investments
[actuarial (gains) or losses]
(115,158)$ (460,631)$
Total (596,208)$
Deferred Outflows and Deferred Inflows of Resources, by year, to be recognized in future pension expense as follows:
2017 65,744$
2018 75,319
2019 172,050
2020 152,828
2021 8,573
Thereafter -
Total 474,514$
(Inflows) of Resources
Net Deferred Outflows
60

CITY OF ALAMO, TEXAS
Notes to Financial Statements
For the year ended September 30, 2018
IV. OTHER INFORMATION (Continued)
C. Other Post Employment Benefit (OPEB) Programs
1. Plan Description
Texas Municipal Retirement System (“TMRS”) administers a defined benefit group-term life insurance plan
known as the Supplemental Death Benefits Funds (“SDBF”). This is a voluntary program in which participating
member cities may elect, by ordinance, to provide group-term life insurance coverage for their active members,
including or not including retirees. The death benefit for active employees provides a lump-sum payment
approximately equal to the employee’s annual salary (calculated based on the employee’s actual earning, for the
12-month period preceding the month of death). The death benefit for retirees is considered another
postemployment benefit (“OPEB”) and is a fixed amount of $7,500. As the SDBF covers both active and retiree
participants, with no segregation of assets, the SDBF is an unfunded OPEB plan (i.e. no assets are accumulated).
The member city contributes to the SDBF at a contractual required rate as determined by an annual actuarial
valuation. The rate is equal to the cost of providing one-year term life insurance. The funding policy for the
SDBF program is to assure that adequate resources are available to meet all death benefit payments for the
upcoming year. The intent is not to pre-fund retiree term life insurance during employees’ entire careers.
GASB 75 requires employee to recognize the total OPEB liability and the OPEB expense on their financial
statements. The OPEB expense recognized each fiscal year is equal to the change in the total OPEB liability from
the beginning of the year to the end of the year, adjusted for deferred recognition of certain changes in the
liability.
In the year of implementation, the employer should make a prior period adjustment for the total OPEB liability as
of the 12/31/2016 measurement date (provided) and record a deferred outflow of resources for contributions
recorded by the city (retiree porting of SDB rate only) from December 31, 2016 to its prior fiscal year end.
TMRS has elected to not calculate other deferrals as of the December 31, 2016 measurement date.
The total OPEB liability shown in this report is based on an actuarial valuation performed as of December 31,
2017 and a measurement date of December 31, 2017; as such, no roll-forward is required.
2. Supplemental Death Benefit (SDBF) Plan Contributions
The City contributes to the SDBF at a contractually required rate as determined by an annual actuarial valuation.
The rate is equal to the cost of providing one-year term life insurance. The funding policy for the SDBF program
is to assure that adequate resources are available to meet all death benefit payments for the upcoming year; the
intent is not pre-fund retiree term life insurance during employees’ entire careers.
Plan/Calendar Year
Total SDB
Contribution (Rate)
Retiree Portion of SDB
Contribution (Rate)
2017 0.18% 0.04%
2018 0.19% 0.04%
61

CITY OF ALAMO, TEXAS
Notes to Financial Statements
For the year ended September 30, 2018
IV. OTHER INFORMATION (Continued)
C. Other Post Employment Benefit (OPEB) Programs
3. OPEB Liability
The Other Post-Employment benefits (OPEB) was measured as of December 31, 2017, and the Total Liability
used to calculate the Net Pension Liability was determined by an actuarial valuation as of that date.
Actuarial assumptions: The Total OPEB Liability in the December 31, 2017 actuarial valuation was determined
using the following actuarial assumptions.
Inflation 2.5%
Salary increases 3.50% to 10.5% including inflation
Discount Rate * 3.31%
Retirees’ share of benefit-related costs $0
*The discount rate was based on the Fidelity Index’s “20-Year Municipal GO AA Index” rate as of the December 31. 2017.
The change in the City’s OPEB for City of Alamo for the fiscal year ended September 30, 2018 is as follows:
*Membership counts for inactive employees currently receiving or entitled to but not yet receiving benefits will differ from
GASB 68 as they include only those eligible for a SDBF benefit (i.e. excludes beneficiaries, non vested termination due a
refund, etc.).
**Due to the SDBF being considered an unfunded OPEB plan under GASB 75, benefit payments are treated as being equal
to the employer’s yearly contributions for retirees.
12/31/2017
Membership*
Number of:
-Inactive employees currently receiving benefits 23
-Inactive employees entitled to but not yet receiving benefits 7
-Active employees 140
-Total 170
Covered Payroll 4,427,336$
Changes in the Total OPEB Liability
Total OPEB Liability - beginning of year 172,733$
Changes for the year
Service Cost 14,167$
Interest on Total OPEB Liability 6,764
Changes of benefit terms -
Difference between expected and actual experience -
Changes in assumptions or other inputs 15,866
Benefit payments** (1,771)
Net changes 35,026
Total OPEB Liability - end of year 207,759$
Total OPEB Liability as a Percentage of Covered Payroll 4.69%
62

CITY OF ALAMO, TEXAS
Notes to Financial Statements
For the year ended September 30, 2018
IV. OTHER INFORMATION (Continued)
C. Other Post Employment Benefit (OPEB) Programs
Sensitivity of the Net Position liability changes in discount rate
1% Decrease
2.31%
Current Single Rate
Assumption 3.31%
1% Increase
4.31%
Total OPEB Liability $247,787 $207,759 $175,772
4. OPEB Expense
For the year ended September 30, 2018, the City recognized OPEB expense of $23,000.
Service cost $ 14,167
Interest on total OPEB liability 6.764
Changes in benefit terms -
Employer administrative costs -
Recognition of deferred outflows/inflows of resources:
Difference between expected and actual experience -
Changes in assumptions or other inputs 2,069
Total OPEB expense $ 23,000
*In the year of implementation, the beginning of year liability is rolled back from the measurement date, so there
will be experience loss/(gain).
**Generally, this will only be the annual change in the municipal bond index rate.
5. OPEB Expense and Deferred Outflows of Resources and deferred inflows of resources related to
Pensions
At September 30, 2018, the city reported deferred outflows of resources and deferred inflows of resources related
to pension from the following sources:
Due to Liabilities
7.6700 -$ -$ -$
7.6700 15,866$ 2,069$ 13,797$
13,797$
Recognition
Period (or
amortization
years)*
Total (Inflow) or
Outflow of
Resources
2017 Recognized
in current OPEB
expense
Deferred
(Inflow)/Outflow
in future
expense
Difference in expected and
actual experience [actuarial
(gains) or losses]
Difference in assumption
[actuarial (gains) or losses]
Contributions made subsequent
to measurement date
Total (excluding city provided
contributions made subsequent
to measurement date):
63

CITY OF ALAMO, TEXAS
Notes to Financial Statements
For the year ended September 30, 2018
IV. OTHER INFORMATION (Continued)
5. OPEB Expense and Deferred Outflows of Resources and deferred inflows of resources related to
Pensions (continued)
The net amounts of the City’s balances of deferred outflows of resources and deferred inflows related to pensions
will be recognized in OPEB expense as follows:
*The recognition period for liability (gains) or losses may differ from GASB 68 reporting due to differences in
the covered inactive populations
D. Urban County
The City of Alamo and other municipalities in Hidalgo County participate in Hidalgo County's “Urban County”
Program. By being designated as an “Urban County,” Hidalgo County and the participating cities are entitled to
receive a formula share of entitlement CDBG program funds from U.S. Department of Housing and Urban
Development (HUD).
Monies received from HUD are allocated to the cities participating in the program based on agreed upon
formulas. The County is responsible for the administration of the program and is ultimately responsible for
including the grant activity related to the “Urban County Program” in its audit report (s) as per CDBG guidelines.
All monies received from HUD on this program are handled by the County. The County pays the vendors or
contractors directly for goods or services which benefit the different cities. The County also reimburses the cities
for general administration cost incurred by those cities. The City received $293,225 for expenses occurred
between October 1, 2017 to September 30, 2018.
E. New Accounting Principles
In fiscal year 2017, the City adopted five new statements of financial accounting standards issued by the
Governmental Accounting Standards Board:
Statement No. 83, Certain Asset Retirement Obligations Statement No. 84, Fiduciary Activities Statement No. 85, Omnibus 2017 Statement No. 86, Certain Debt Extinguishment Issues Statement No. 87, Leases
2018 2,069$
2019 2,069
2020 2,069
2021 2,069
2022 2,069
Thereafter 3,452
Total 13,797$
Net deferred
outflows (Inflows) of
resources
64

CITY OF ALAMO, TEXAS
Notes to Financial Statements
For the year ended September 30, 2018
IV. OTHER INFORMATION (Continued)
E. New Accounting Principles (continued) a. Statement No. 83 addresses accounting and financial reporting for certain asset retirement obligations
(AROs). An ARO is a legally enforceable liability associated with the retirement of a tangible capital asset. A
government that has legal obligations to perform future asset retirement activities related to its tangible capital
assets should recognize a liability based on the guidance in this Statement.
This Statement establishes criteria for determining the timing and pattern of recognition of a liability and a
corresponding deferred outflow of resources for AROs. This Statement requires that recognition occur when
the liability is both incurred and reasonably estimable. The determination of when the liability is both
incurred and reasonably estimable. The determination of when the liability is incurred should be based on the
occurrence of external laws, regulations, contracts, or court judgments, together with the occurrence of an
internal event that obligates a government to perform asset retirement activities. Laws and regulations may
require governments to take specific actions to retire certain tangible capital assets at the end of the useful
lives of those capital assets, such as decommissioning nuclear reactors and dismantling and removing sewage
treatment plants. Other obligations to retire tangible capital assets may arise from contracts or court
judgments. Internal obligating events include the occurrence of contamination, placing into operation a
tangible capital asset that is required to be retired, abandoning a tangible capital asset before it is placed into
operation, or acquiring a tangible capital asset that has an existing ARO.
This Statement also requires disclosure of information about the nature of a government’s AROs, the methods
and assumptions used for the estimates of the liabilities, and the estimated remaining useful life of the
associated tangible capital assets. If an ARO (or portions thereof) has been incurred by a government but is
not yet recognized because it is not reasonably estimable, the government is required to disclose that fact and
the reasons therefor. This Statement requires similar disclosures for a government’s minority shares of ARO.
The requirements of this Statement are effective for reporting periods beginning after June 15, 2018. Earlier
application is encouraged.
The adoption of Statement No. 83 has no impact on the City’s financial statements.
b. Statement No. 84 objective is to improve guidance regarding the identification of fiduciary activities for
accounting and financial reporting purposes and how those activities should be reported.
This Statement describes four fiduciary funds that should be reported, if applicable: (1) pension (and other
employee benefit) trust funds, (2) investment trust funds, (3) private-purpose trust funds, and (4) custodial
funds. Custodial funds generally should report fiduciary activities that are not held in a trust or equivalent
arrangement that meets specific criteria.
This Statement also provides for recognition of a liability to the beneficiaries in a fiduciary fund when an
event has occurred that compels the government to disburse fiduciary resources. Events that compel a
government to disburse fiduciary resources occur when a demand for the resources has been made or when no
further action, approval, or condition is required to be taken or met by the beneficiary to release the assets.
The requirements of this Statement are effective for reporting periods beginning after December 15, 2018.
Earlier application is encouraged.
The adoption of Statement No. 73 has no impact on the City’s financial statements.
65

CITY OF ALAMO, TEXAS
Notes to Financial Statements
For the year ended September 30, 2018
IV. OTHER INFORMATION (Continued)
E. New Accounting Principles (continued)
c. Statement No. 85 addresses practice issues that have been identified during implementation and application of
certain GASB Statements. This Statement addresses a variety of topics including issues related to blending
component units, goodwill, fair value measurement and application, and postemployment benefits (pension
and other postemployment benefits (pension and other postemployment benefits [OPEB]).
The requirements of this Statement are effective for reporting periods beginning after June 15, 2017. Earlier
application is encouraged.
The adoption of Statement No. 85 has no impact on the City’s financial statements.
d. Statement No. 86 objective is to improve consistency in accounting and financial reporting for in-substance
defeasance of debt by providing guidance for transactions in which cash and other monetary assets acquired
with only existing resources-resources other than the proceeds of refunding debt-are placed in an irrevocable
trust for the sole purpose of extinguishing debt. This Statement also improves accounting and financial
reporting for prepaid insurance on debt that is extinguished and notes to financial statements for debt that is
defeased in substance.
Governments that defease debt using only existing resources should provide a general description of the
transaction in the notes to financial statements in the period of the defeasance. In all periods following an in-
substance defeasance of debt using only existing resources, the amount of that debt that remains outstanding
at period-end should be disclosed.
For governments that extinguish debt, whether through a legal extinguishment or through an in-substance
defeasance, this Statement requires that any remaining prepaid insurance related to the extinguished debt be
included in the net carrying amount of that debt for the purpose of calculating the difference between the
reacquisition price and the net carrying amount of the debt.
The requirements of this Statement are effective for reporting periods beginning after June 15, 2017. Earlier
application is encouraged.
The adoption of Statement No. 86 has no impact on the City’s financial statements.
e. Statement No. 87 objective is to better meet the information needs of financial statement users by improving
accounting and financial reporting for leases by governments. This Statement increases the usefulness of
governments’ financial statements by requiring recognition of certain lease assets and liabilities for leases that
previously were classified as operating leases and recognized as inflows of resources or outflows of resources
based on the payment provisions of the
contract. It establishes a single model for lease accounting based on the foundational principle that leases are
financings of the right to use an underlying asset. Under this Statement, a lessor is required to recognize a
lease receivable and a deferred inflow of resources, thereby enhancing the relevance and consistency of
information about governments’ leasing activities.
The requirements of this Statements are effective for reporting periods beginning after December 15, 2019.
The adoption of Statement No. 87 has impact on the City’s financial statements.
66

CITY OF ALAMO, TEXAS
Notes to Financial Statements
For the year ended September 30, 2018
V. PRIOR PERIOD ADJUSTMENT
Prior period adjustment was required in several funds in order to properly state the correct financial position of
the City. The adjustment and reason are as follows:
VI. COMMITMENTS
1. Grant Programs
The City participates in several federal and state assisted grant programs. Under the terms of these grants, the City
is subject to program compliance audits by the grantors or their representatives. Accordingly, the City’s
compliance with applicable grant requirements will be established at some future date. If future program
compliance audits result in questioned or disallowed costs, reimbursements would be made to the grantor
agencies. The amounts of expenditures which might be disallowed by the grantor agencies cannot be determined
at this time: however, management believes such amounts, if any, would be immaterial.
2. Texas Water Development Board Disclosure
Texas Water Code, Chapter 16, Section 16.356 indicates a political subdivision that receives financial assistance
from the economically distressed areas program under Subchapter K, Chapter 17, may not use any revenue
received from fees collected from water supply or sewer service constructed in whole or in part from funds from
the economically distressed areas program account for purposes other than utility purposes.
The City of Alamo, Texas did not use any revenue received from fees collected from a water supply or sewer
service constructed in whole or in part from funds from the economically distressed areas program account for
purposes other than utility purposes.
Amount
Fund Balance Adjustments
General Fund
To correct payments made for Construction in Progress for prior year (21,723)$
To correct revenues from fire and emergency calls for prior year -
Total General Fund Balance Adjustments (21,723)
Debt Service Fund
To correct payment made for Prior year -
Total Fund Balance Adjustments (21,723)$
Government-Wide Adjustments
To record prior period related to pension (168,782)$
Total Governmental Fund Adjustment (168,782)$
Water and Sewer Fund
To record prior period related to pension (4,916)
Total Water and Sewer Fund Adjustments (4,916)$
Total Prior Period Adjustments (195,421)$
67

CITY OF ALAMO, TEXAS Notes to Financial Statements
For the year ended September 30, 2018
VI. COMMITMENTS (Continued) 3. Litigation The City has no material, pending or threatened litigation matters, claims or assessments as of March 21, 2019. 4. Subsequent Events On August 21, 2018, the Commission approved an ordinance authorizing the issuance, sale and delivery of City of Alamo, Texas Waterworks and Sewer Revenue Bonds, Series 2018, in the amount of $10,335,000. The bond proceeds sold on October 4, 2018. For the purposes of reporting subsequent events, management has considered events occurring up to March 21, 2019, the date the report was available to be issued. No further subsequent events were noted.
68

Required supplementary information includes financial information and disclosures required by the Governmental Accounting Standards Board but not considered a part of the basic financial statements.
REQUIRED SUPPLEMENTARY INFORMATION
69

CITY OF ALAMO, TEXAS
This page left blank intentionally.

12/31/2010 4,037,306 5,723,745 70.54% 1,686,439 3,461,557 48.72%
12/31/2011 4,693,873 6,307,303 74.42% 1,613,430 3,711,823 43.47%
12/31/2012 5,421,002 6,902,395 78.54% 1,481,393 3,732,583 39.69%
12/31/2013 6,128,190 7,909,553 77.50% 1,781,363 3,961,917 45.00%
12/31/2014 6,903,601 8,583,041 80.43% 1,679,440 3,998,291 42.00%
12/31/2015 7,475,679 9,224,929 81.00% 1,749,250 4,344,846 40.30%
12/31/2016 8,250,885 9,889,636 83.40% 1,638,751 4,367,106 37.50%
12/31/2017 9,123,952 10,568,255 86.30% 1,444,303 4,427,336 32.60%
Covered Payroll
UAAL as aPercentage of
Covered Payroll
CITY OF ALAMO, TEXAS
Schedule of Funding Progress for Retirement Plan (Unaudited)For the Year Ended September 30, 2018
ActuarialValuation
Date
ActuarialValue of Assets
ActuarialAccruedLiability(AAL)
Funded Ratio
Excess of Assets Over/UnfundedAAL (UAAL)
Texas Municipal Retirement System
70

2017 2016Total Pension Liability
Service Cost 436,093$ 433,217$ Interest (on the total pension liability) 673,375 628,448 Changes of Benefit Terms - - Difference between Expected and Actual Experience (167,328) (134,575) Change of Assumptions - - Benefit Payments, including Refunds of Employee Contributions (263,521) (262,383) Net Change in Total Pension Liability 678,619$ 664,707$ Net Pension Liability - Beginning 9,889,636 9,224,929 Total Pension Liability - Ending 10,568,255$ 9,889,636$
Plan Fiduciary Net Position
Contributions - Employer 336,920$ 331,899$ Contributions - Employee 221,367 218,355 Net Investment Income 1,121,988 494,584 Benefit Payments, including Refunds of Employee Contributions (263,521) (262,383) Administrative Expense (5,812) (5,583) Other (295) (301) Net Change in Plan Fiduciary Net Position 1,410,647$ 776,571$ Plan Fiduciary Net Position - Beginning 8,091,832 7,315,261 Plan Fiduciary Net Position - Ending 9,502,479$ 8,091,832$
Net Pension Liability 1,065,776$ 1,797,804$ Plan Fiduciary Net Position as a Percentage of Total Pension Liability 89.92% 81.82%Covered Employee Payroll 4,427,336$ 4,367,106$ Net Pension Liability as a Percentage of Covered Employee Payroll 24.07% 41.17%
*GASB 68 required 10 fiscal years of data (built prospectively) to be provided in this schedulemost current year is displayed above. As information becomes available, it will be added to table.
For the Year Ended September 30, 2018
CITY OF ALAMO, TEXASSchedule of Changes in Net Pension Liability and Related Ratios
Last 10 Years*
71

Final
Actual Variance
Budget Budget
Original Final Basis Basis
Revenues
Property Taxes $ 2,983,976 $ 2,983,976 $ 2,897,817 $ ( 86,159 )
Sales Taxes 2,532,274 2,692,274 2,699,311 7,037
Franchise Taxes 505,000 505,000 557,694 52,694
Other Taxes 1,000 1,000 2,883 1,883
Court Fines and Fees 509,550 509,550 342,999 ( 166,551 )
Licenses and Permits 87,960 131,960 140,526 8,566
Charges for Services 1,923,500 2,344,500 2,366,152 21,652
Local Events and Contributions 40,000 45,000 52,143 7,143
Miscellaneous revenues 51,500 66,500 73,505 7,005
State Grants 35,000 35,000 32,000 ( 3,000 )
Federal Grants 70,000 65,000 85,678 20,678
Interest Revenue 5,000 55,000 60,240 5,240
Total Revenues 8,744,760 9,434,760 9,310,948 ( 123,812 )
Other Financing Sources
Proceeds from Loans - - - -
Proceeds on Sale of Assets - - - -
Transfers from other funds 390,000 390,000 390,000 -
Total Revenues and Other
Financing Sources 9,134,760 9,824,760 9,700,948 ( 123,812 )
Expenditures
General Government 3,413,729 4,021,871 3,889,681 132,190
Public Safety 3,830,582 3,964,995 3,922,830 42,165
Highways & Streets 737,531 693,331 641,120 52,211
Health & Welfare 271,357 271,307 255,443 15,864
Culture & Recreation 983,405 1,097,041 1,027,352 69,689
Capital Outlay 6,100 14,014 12,213 1,801
Debt Principal 173,862 173,862 173,862 -
Debt Interest 16,620 16,620 16,243 377
Total Expenditures 9,433,186 10,253,041 9,938,744 314,297
Other Financing Uses
Transfers to other funds 62,370 62,370 62,187 183
Total Expenditures and Other
Financing Uses 9,495,556 10,315,411 10,000,931 314,480
Excess (Deficiency) of Revenues and
Other Sources Over Expenditures
and Other Uses ( 360,796 ) ( 490,651 ) ( 299,983 ) 190,668
Net Change in Fund Balance ( 360,796 ) ( 490,651 ) ( 299,983 ) 190,668
Fund Balance at Beginning of Period 4,437,711 4,437,711 4,437,711 -
Prior Period Adjustment ( 21,713 ) ( 21,713 ) ( 21,713 ) -
Fund Balance at End of Period $ 4,055,202 $ 3,925,347 $ 4,116,015 $ 190,668
CITY OF ALAMO, TEXAS
Schedule of Revenues, Expenditures, and Changes in Fund Balance-Budget and Actual
General Fund
For the Year Ended September 30, 2018
Budgeted Amounts
72

Variance
Final Budget
Favorable
Original Final Actual (Unfavorable)
Revenues
Sales Taxes 844,092$ 850,000$ 899,770$ 49,770$
Interest Earned 1,000 4 36,823 36,819
Miscellaneous - - 7,792 7,792
Total Revenues 845,092 850,004 944,385 94,381
Expenditures
Current
General Government 329,860 410,103 183,664 226,439
Promotional and Development 12,000 89,267 63,858 25,409
Capital Outlay - - - -
Debt Services -
Principal - 755,000 24,554 730,446
Interest - 350,080 6,294 343,786
Total expenditures 341,860 1,604,450 278,370 1,326,080
Excess (Deficiency) of Revenues 503,232 (754,446) 666,015 1,420,461
Over Expenditures
Other Financing Sources (Uses)
Operating Transfers In (Out) - - - -
Capital Transfers In (Out) - 755,000 (535,550) (535,550)
Note Proceeds - - - -
Bond Premiums - - - -
Bond Issuance Costs - - - -
Total Other Financing
Sources (Uses) - 755,000 (535,550) (535,550)
Net Changes in Fund Balances 503,232$ 554$ 130,465 884,911$
Fund Balance, October 1 2,036,638
Fund Balance, September 30 2,167,103$
For the Year Ended September 30, 2018
ALAMO ECONOMIC DEVELOPMENT CORPORATION
Budget
CITY OF ALAMO, TEXAS
Schedule of Revenues, Expenditures, and Changes inf Fund Balance- Budget and Actual
73

Other supplementary information includes financial information and disclosures not required by the Governmental Accounting Standards Board and not considered a part of the basic financial statements.
It may, however, include information which is required by other entities.
OTHER SUPPLEMENTARY INFORMATION
74

2009 & Prior Years $ Various $ Various $ Various
2010 0.48399 0.10792 439,311,243
2011 0.47512 0.11679 466,885,353
2012 0.47111 0.11438 452,905,402
2013 0.48757 0.1114 477,293,393
2014 0.48965 0.1093 489,447,908
2015 0.49347 0.1055 518,376,862
2016 0.4836 0.1045 546,953,409
2017 0.4798 0.1012 569,133,760
2018 (Unaudited) 0.4627 0.0938 611,441,742
For the Year Ended September 30, 2018Schedule of Delinquent Taxes Receivable
CITY OF ALAMO, TEXAS
Year Ended September 30,
1
Tax RatesMaintenance
2
DebtService
3Assessed/Appraised
Value for CityTax Purposes
75

112,325$ 4,920$ 1,115$ ( 1,684 )$ 104,606$
15,927 1,722 384 ( 306 ) 13,515
22,242 1,879 462 ( 306 ) 19,595
19,845 2,151 522 ( 456 ) 16,716
24,767 3,256 744 270 21,037
36,254 4,708 1,051 ( 2,093 ) 28,402
49,512 12,619 2,697 1,069 35,265
75,918 25,851 5,586 ( 141 ) 44,340
133,741 54,396 11,475 ( 4,066 ) 63,804
- 3,353,635 2,671,099 541,673 ( 16,983 ) 123,880
490,531$ 3,353,635$ 2,782,601$ 565,709$ ( 24,697 )$ 471,159$
Allowance for Uncollectible Taxes 47,116$
Total 424,043$
50Ending Balance
September 30, 2018
10Beginning Balance
October 1, 2017
20
Current Year's Total Levy
31
MaintenanceCollections
32
Debt Service
Collections
40
Entire Year's
Adjustments
76

ASSETSCash and Cash Equivalents $ - $ 5,174 $ 296,123 $ 16,428 Investments - - 495,025 - Note Receivables - - - - Accounts Receivable - Property Taxes - - - - Accounts Receivable - Other 261,987 - 83,816 8,500 Due From Other Funds - - - - Total Assets 261,987 5,174 874,964 24,928
DEFERRED OUTFLOWS OF RESOURCESAggregated deferred outflows - - - -
Total Assets and Deferred Outflows of Resources $ 261,987 $ 5,174 $ 874,964 $ 24,928
LIABILITIESAccounts Payable $ - $ - $ - $ - Unearned Revenue 261,987 5,181 - - Due to Other Funds - - - - Total Liabilities 261,987 5,181 - -
DEFERRED INFLOWS OF RESOURCESAggregated deferred inflows - - - - Total Deferred Inflows of Resources - - - -
FUND BALANCERestricted for: Debt Service - - - - Capital Projects - - - - Special Projects - ( 7 ) 874,964 24,928 Tourism - - - - Unassigned - - - - Total Fund Balance - ( 7 ) 874,964 24,928 Total Liabilities, Deferred Inflows of Resources and Fund Balance $ 261,987 $ 5,174 $ 874,964 $ 24,928
Urban County Fund
Special Revenue Funds
CITY OF ALAMO, TEXASCombining Balance Sheet
Non-Major Governmental FundsSeptember 30, 2018
Asset Forefeiture Fund Hotel / Motel Fund
State Forfeiture Fund
77

$ 375,617 $ 109,293 $ 753,681 $ 1,556,316 - - 490,082 985,107 - - - - - - 72,831 72,831 - - - 354,303 - - - -
375,617 109,293 1,316,594 2,968,557
- - - -
$ 375,617 $ 109,293 $ 1,316,594 $ 2,968,557
$ - $ - $ - $ - - - - 267,168 - - - - - - - 267,168
- - 68,372 68,372 - - 68,372 68,372
- 109,293 1,248,222 1,357,515 - - - -
375,617 - - 1,275,502 - - - - - - - -
375,617 109,293 1,248,222 2,633,017
$ 375,617 $ 109,293 $ 1,316,594 $ 2,968,557
Tax Increment Fund
Total Non-Major Governmental
FundsDebt Service Interest and Series 2013
Debt Service
78

Revenues
Property Taxes $ - $ - $ - $ -
Other Taxes - - 87,345 -
Miscellaneous Revenues - - - 16,443
Federal Grants 293,225 - - -
Interest Revenue - 57 10,913 144
Total Revenues 293,225 57 98,258 16,587
Expenditures
General Government - - 88,251 -
Public Safety - - - 9,210
Capital Outlay 293,225 - - -
Debt Principal - - - -
Debt Interest - - - -
Total Expenditures 293,225 - 88,251 9,210
Excess of Revenues Over
(Under) Expenditures - 57 10,007 7,377
Other Financing Sources (Uses)
Proceeds for Issuance of Bonds - - - -
Premium on Refunding Bonds - - - -
Transfers from other funds - - - -
Payment to Refunded Bond Escrow Agent - - - -
Transfers to other funds - - - -
Net Other Financing Sources (Uses) - - - -
Net Change in Fund Balance - 57 10,007 7,377
Fund Balance at Beginning of Period - (64) 864,957 17,551
Prior Period Adjustments - - - -
Fund Balance at End of Period $ - $ (7) $ 874,964 $ 24,928
For the Year Ended September 30, 2018
State Forfeiture
Fund
Special Revenue Funds
Asset
Forfeiture
Fund
Non-Major Governmental Funds
CITY OF ALAMO, TEXAS
Combining Statement of Revenues, Expenditures, and Changes in Fund Balance
Urban County
Grant
Hotel / Motel
Fund
79

$ - $ - $ 581,680 $ 581,680
- - - 87,345
82,153 - - 98,596
- - - 293,225
2,755 854 16,571 31,294
84,908 854 598,251 1,092,140
- - 800 89,051
- - - 9,210
202,439 - - 495,664
- - 870,000 870,000
- - 295,067 295,067
202,439 - 1,165,867 1,758,992
( 117,531 ) 854 ( 567,616 ) ( 666,852 )
- - - -
- - - -
62,187 - 694,850 757,037
- - - -
- - - -
62,187 - 694,850 757,037
(55,344) 854 127,234 90,185
430,961 108,439 1,120,988 2,542,832
- - - -
$ 375,617 $ 109,293 $ 1,248,222 $ 2,633,017
Special Revenue
Debt Service
Debt Service Tax Increment Fund
Total Non-Major
Governmental
Funds
Interest and
Series 2013
Funds
80

Operating RevenuesCharges for Services $ 4,147,142 $ 4,147,142 Other Revenues - -
Total Operating Revenues 4,147,142 4,147,142
Operating Expenses Payments to Employees 842,531 842,531
Payments to Supplies and Others 2,111,074 2,111,074 Total Operating Expenses 2,953,605 2,953,605
Income before Non-operating Revenues (Expenses) 1,193,536 1,193,536
Non-Operating Revenues (Expenses)Interest Revenue 44,782 44,782 Federal Grants - -
Net Non-Operating Revenues (Expenses) 44,782 44,782
Net Revenue Available for Debt Service $ 1,238,318 $ 1,238,318
Water & SewerFund
Total Enterprise Funds
Business-type Activities - Enterprise Funds
CITY OF ALAMO, TEXASSchedule of Revenues and Expenses to Indicate
Net Revenue Available for Debt ServiceProprietary Funds
For the Year Ended September 30, 2018
81

CAPITAL ASSETS USED IN THE OPERATION OF GOVERNMENTAL FUNDS
82

2018 2017
$ 1,731,590 $ 1,731,590
553,193 1,722,530
13,034,989 13,034,989
3,384,300 2,826,631
2,564,483 2,532,116
16,095,690 14,838,887
$ 37,364,245 $ 36,686,743
$ 25,886,629 $ 26,762,741
1,892,902 1,099,787
9,584,714 8,824,216
$ 37,364,245 $ 36,686,743
Mach and Equip
INFRAST
With Comparative Totals for September 30, 2017
City of Alamo, Texas
Capital Assets Used in the Operation of Governmenral Funds
Comparative Schedule by Source
Year Ended September 30, 2018
Governmental Funds Capital Assets
Land and Right of Way
Construction in Progress
Building and Improvements
Vehicles
Machinery and Equipment
Infrastructure
Total Governmental Funds Capital Assets
Investments in Governmental Funds Capital Assets
Capital Projects
Grants-in-aid
General Fund Revenues
Total Investments in Governmental Funds Capital Assets
83

Governmental
Funds
Capital Assets
September 30,
2016 Additions
Reclassifications/
Deductions
Governmental
Funds
Capital Assets
September 30,
2017
$ 5,956,613 $ 5,500 $ 151,041 5,811,072
6,402,062 590,037 545,456 6,446,643
15,850,646 561,199 - 16,411,845
1,544,779 - - 1,544,779
6,932,642 986,467 769,203 7,149,906
- - - -
$ 36,686,743 $ 2,143,203 $ 1,465,701 $ 37,364,245
Function and Activity
City of Alamo, Texas
Capital Assets Used in the Operation of Governmenral Funds
Schedule of Changes by Function and Activity
Year Ended September 30, 2018
General Government
Public Safety
Highways and Streets
Health and Welfare
Culture and Recreation
Total Governmental Funds Capital Assets
84

Land and
Right of Way
Construction
in Progress
Building and
Improvements Vehicles
Machinery and
Equipment Infrastructure Total
$ 1,731,590 $ - $ 3,509,843 303,156 $ 266,483 - 5,811,072
- $ - $ 2,056,753 2,595,214 $ 1,794,676 - 6,446,643
- $ 455,915 $ - 368,654 $ 433,553 15,153,723 16,411,845
- $ - $ 1,503,677 41,102 $ - - 1,544,779
- $ 97,278 $ 5,964,715 76,174 $ 69,771 941,967 7,149,906
$ 1,731,590 $ 553,193 $ 13,034,989 $ 3,384,300 $ 2,564,483 $ 16,095,690 $ 37,364,245
Public Safety
Highways and Streets
Health and Welfare
City of Alamo, Texas
Capital Assets Used in the Operation of Governmental Funds
Schedule by Function and Activity
Year Ended September 30, 2018
Culture and Recreation
Total General Fixed Assets
Function and Activity
General Government
85

Financial Trends
Debt Capacity
Demographic and Economic Information
Operating Information
These schedules contain information to help the reader assess the government's most significant
local revenue source, the property tax.
The schedules present information to help the reader assess the affordablility of the government's
current level of outstanding debt and the government's ability to issue additional debt in the
future.
These schedules offer demographic and economic indicators to help the reader understand the
environment within which the government's financial activities take place.
These schedules contain service and infrastructure data to help the reader understand how the
information in the government's financial report relates to the services the government provides
and the activities it performs.
Revenue Capacity
These schedules contain trend information to help the reader understand how the government's
financial performance and well-being have changed over time.
This part of the City of Alamo's comprehensive annual financial report presents detailed
information as a context for understading what the information in the financial statements, note
disclosures, and required supplementary information says about the City of Alamo's overall
finanial health.
STATISTICAL SECTION
86

CITY OF ALAMO, TEXAS
This page left blank intentionally.
87
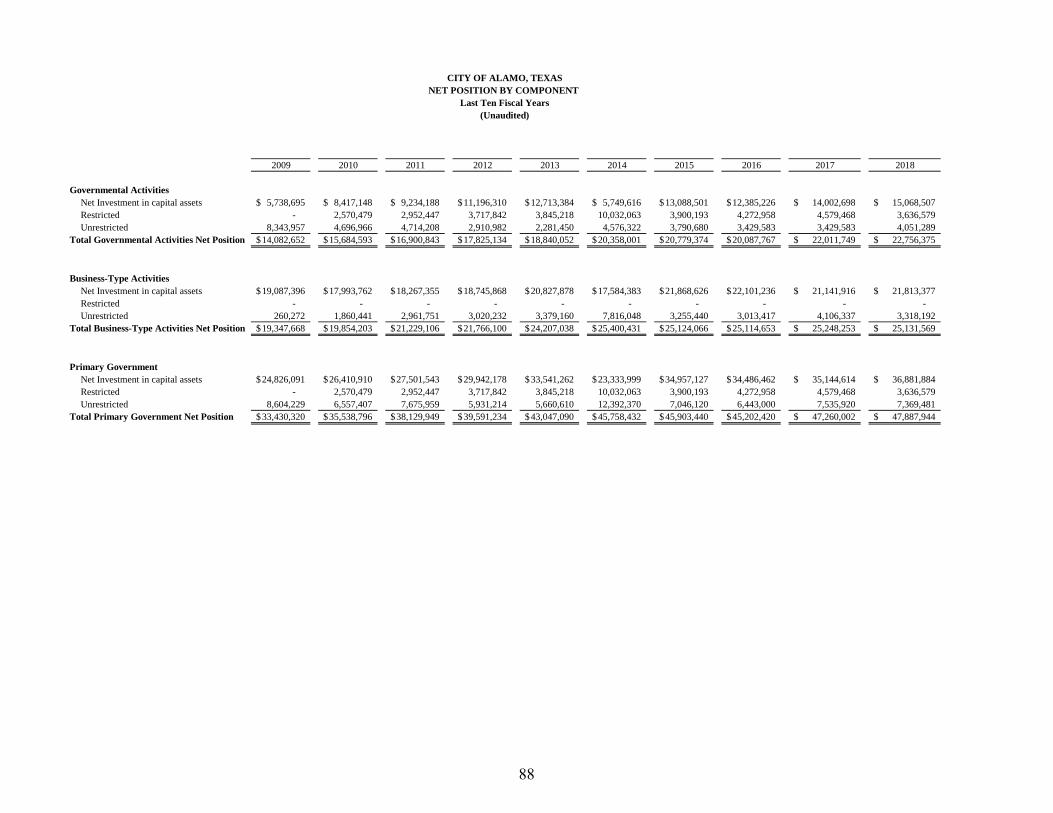
2009 2010 2011 2012 2013 2014 2015 2016 2017 2018
Governmental Activities
Net Investment in capital assets 5,738,695$ 8,417,148$ 9,234,188$ 11,196,310$ 12,713,384$ 5,749,616$ 13,088,501$ 12,385,226$ 14,002,698$ 15,068,507$
Restricted - 2,570,479 2,952,447 3,717,842 3,845,218 10,032,063 3,900,193 4,272,958 4,579,468 3,636,579
Unrestricted 8,343,957 4,696,966 4,714,208 2,910,982 2,281,450 4,576,322 3,790,680 3,429,583 3,429,583 4,051,289
Total Governmental Activities Net Position 14,082,652$ 15,684,593$ 16,900,843$ 17,825,134$ 18,840,052$ 20,358,001$ 20,779,374$ 20,087,767$ 22,011,749$ 22,756,375$
Business-Type Activities
Net Investment in capital assets 19,087,396$ 17,993,762$ 18,267,355$ 18,745,868$ 20,827,878$ 17,584,383$ 21,868,626$ 22,101,236$ 21,141,916$ 21,813,377$
Restricted - - - - - - - - - -
Unrestricted 260,272 1,860,441 2,961,751 3,020,232 3,379,160 7,816,048 3,255,440 3,013,417 4,106,337 3,318,192
Total Business-Type Activities Net Position 19,347,668$ 19,854,203$ 21,229,106$ 21,766,100$ 24,207,038$ 25,400,431$ 25,124,066$ 25,114,653$ 25,248,253$ 25,131,569$
Primary Government
Net Investment in capital assets 24,826,091$ 26,410,910$ 27,501,543$ 29,942,178$ 33,541,262$ 23,333,999$ 34,957,127$ 34,486,462$ 35,144,614$ 36,881,884$
Restricted - 2,570,479 2,952,447 3,717,842 3,845,218 10,032,063 3,900,193 4,272,958 4,579,468 3,636,579
Unrestricted 8,604,229 6,557,407 7,675,959 5,931,214 5,660,610 12,392,370 7,046,120 6,443,000 7,535,920 7,369,481
Total Primary Government Net Position 33,430,320$ 35,538,796$ 38,129,949$ 39,591,234$ 43,047,090$ 45,758,432$ 45,903,440$ 45,202,420$ 47,260,002$ 47,887,944$
CITY OF ALAMO, TEXAS
NET POSITION BY COMPONENT
Last Ten Fiscal Years
(Unaudited)
88

2009 2010 2011 2012 2013 2014 2015 2016 2017 2018
Expenses
Governmental Activities
General Government 3,613,968$ 4,092,556$ 3,593,226$ 3,285,674$ 3,566,213$ 3,548,970$ 3,906,733$ 5,174,598$ 4,054,005$ 4,331,411$
Public Safety 2,872,533 2,602,282 3,000,252 3,295,121 3,291,594 3,518,106 3,790,022 3,850,703 3,815,052 4,150,946
Highways and streets 644,943 209,570 244,195 618,195 791,483 618,237 650,109 742,394 1,107,940 592,114
Health and welfare 152,380 559,193 662,955 251,043 252,775 255,552 277,341 317,566 298,817 230,586
Culture and recreation 756,870 609,826 678,787 858,249 799,113 832,050 890,470 840,164 930,782 1,109,758
Interest on long-term debt 424,196 14,765 6,817 322,631 401,141 243,693 347,026 363,387 312,456 286,645
Economic Development 1,611,789 404,705 470,935 294,059 268,008 367,914 421,173 396,258 416,229 256,933
Total Governmental Activities Net Position 10,076,679$ 8,492,897$ 8,657,167$ 8,924,972$ 9,370,327$ 9,384,522$ 10,282,874$ 11,685,070$ 10,935,281$ 10,958,393$
Business-Type Activities
Water and Sewer 2,582,153 2,130,082 2,384,117 2,680,613 2,691,230 2,745,936 2,841,016 3,194,302 3,469,082 3,757,600
Total Business-Type Activities Net Position 2,582,153 2,130,082 2,384,117 2,680,613 2,691,230 2,745,936 2,841,016 3,194,302 3,469,082 3,757,600
Total Primary Government Expenses 12,658,832$ 10,622,979$ 11,041,284$ 11,605,585$ 12,061,557$ 12,130,458$ 13,123,890$ 14,879,372$ 14,404,363$ 14,715,993$
Program Revenue
Governmental Activities
Charges for services -$ -$ -$ -$ -$ -$ -$ -$ -$ -$
General Government 290,511 64,962 95,513 91,035 139,285 151,369 170,208 192,336 216,257 239,556
Public Safety 145,258 190,535 207,709 522,662 563,257 681,410 767,639 802,605 623,525 454,237
Highways and streets 33,522 1,362,908 1,422,428 10,890 1,470,805 1,695,218 1,792,373 1,887,112 1,925,177 2,023,837
Health and welfare 16,759 - - 1,545,700 10,914 19,271 15,643 14,966 14,732 16,205
Culture and recreation 39,106 41,598 44,177 56,267 76,342 96,181 101,742 89,162 139,442 127,697
Operating grants and contributions - 630,710 757,061 517,019 519,801 383,318 392,832 314,057 1,239,115 463,046
Capital grants and contributions - - 221,150 250,000 - 195,000 - - - -
Total Primary Governmental Activities 525,156$ 2,290,713$ 2,748,038$ 2,993,573$ 2,780,404$ 3,221,767$ 3,240,437$ 3,300,238$ 4,158,248$ 3,324,578$
Business-Type Activities
Charges for services 2,968,400 2,869,762 3,318,492 3,437,288 3,567,374 3,528,534 3,545,358 3,759,170 4,053,730 4,147,141
Operating grants and contributions - - 716,219 - - - - - - -
Capital grants and contributions - - - 77,118 1,992,606 956,583 38,450 - - -
Total Business-Type Activities Program Revenues2,968,400 2,869,762 4,034,711 3,514,406 5,559,980 4,485,117 3,583,808 3,759,170 4,053,730 4,147,141
Total Primary Government Program Expenses 3,493,556$ 5,160,475$ 6,782,749$ 6,507,979$ 8,340,384$ 7,706,884$ 6,824,245$ 7,059,408$ 8,211,978$ 7,471,719$
Net (expense)/revenue
Governmental Activities (9,551,523)$ (6,202,184)$ (5,909,129)$ (5,931,399)$ (6,589,923)$ (6,162,755)$ (7,042,437)$ (8,384,832)$ (6,777,033)$ (7,633,815)$
Business-Type Actviities 386,247 739,680 1,650,594 833,793 2,868,750 1,739,181 742,792 564,868 584,648 389,541
Total Primary Government Net Expense (9,165,276)$ (5,462,504)$ (4,258,535)$ (5,097,606)$ (3,721,173)$ (4,423,574)$ (6,299,645)$ (7,819,964)$ (6,192,385)$ (7,244,274)$
CITY OF ALAMO, TEXAS
CHANGES IN NET POSITION
Last Ten Fiscal Years
(Unaudited)
89

2009 2010 2011 2012 2013 2014 2015 2016 2017 2018
General Revenue and Other Changes
in Net Position
Governmental Activities
Taxes
Property taxes 2,647,668$ 2,879,274$ 2,809,375$ 2,752,818$ 2,901,895$ 2,847,121$ 3,224,247$ 3,281,010$ 3,355,089$ 3,463,220$
Sales taxes 2,873,775 2,959,092 3,139,704 3,357,024 3,374,825 3,466,644 3,483,713 3,457,159 3,435,440 3,599,081
Franchise taxes 420,008 429,137 450,143 479,688 497,435 511,976 514,954 526,425 537,167 557,694
Hotel/motel taxes 119,875 156,561 154,853 138,451 135,899 131,149 130,731 120,183 96,008 90,228
Invetment earning 56,355 14,650 3,523 4,874 52,794 42,343 39,591 40,722 65,424 128,358
Miscellaneous 1,700,853 339,045 442,171 179,748 50,863 132,171 155,547 111,836 207,947 159,342
Grants and contribution not restricted 334,011 169,944 - - - - - - - -
Transfers 830,896 289,152 289,152 323,850 373,324 549,300 956,213 549,300 549,300 549,300
Total Governmental Activities 8,983,441$ 7,236,855$ 7,288,921$ 7,236,453$ 7,387,035$ 7,680,704$ 8,504,996$ 8,086,635$ 8,246,375$ 8,547,223$
Business-Type Activities
Invetment earning 6,840$ 3,718$ 2,025$ 1,346$ 1,504$ 879$ 1,106$ 5,554$ 16,711$ 47,537$
Miscellaneous 37,024 - - - - 2,633 - - 1,650 -
Transfers (292,272) (289,152) (289,152) (323,850) (373,324) (549,300) (956,213) (549,300) (549,300) (549,300)
Total Business-Type Activities (248,408) (285,434) (287,127) (322,504) (371,820) (545,788) (955,107) (543,746) (530,939) (501,763)
Total Primary Government 8,735,033$ 6,951,421$ 7,001,794$ 6,913,949$ 7,015,215$ 7,134,916$ 7,549,889$ 7,542,889$ 7,715,436$ 8,045,460$
Change in Net Position
Governmental Activities (568,082)$ 1,034,671$ 1,379,792$ 1,305,054$ 797,112$ 1,517,949$ 1,462,559$ (298,197)$ 1,469,342$ 913,408$
Business-Type Actviities 137,839 454,246 1,363,467 511,289 2,496,930 1,193,393 (212,315) 21,122 53,709 (112,222)
Total Primary Government (430,243)$ 1,488,917$ 2,743,259$ 1,816,343$ 3,294,042$ 2,711,342$ 1,250,244$ (277,075)$ 1,523,051$ 801,186$
CHANGES IN NET POSITION (Continued)
Last Ten Fiscal Years
(Unaudited)
CITY OF ALAMO, TEXAS
90
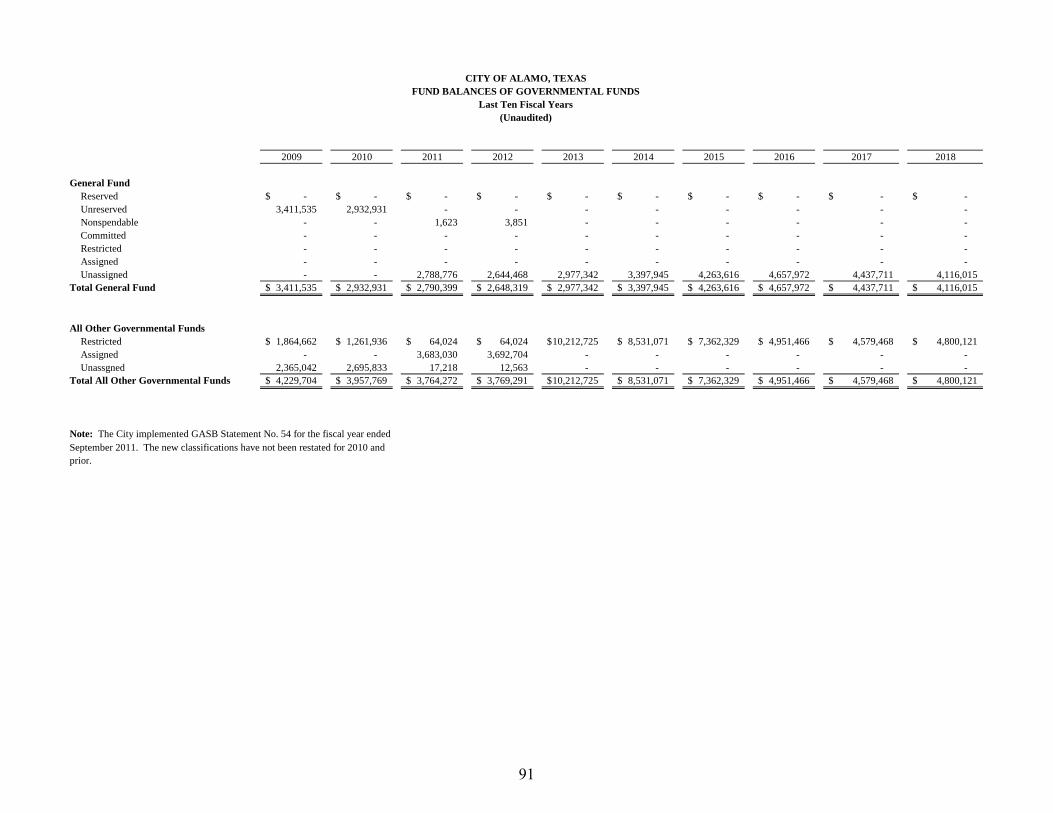
2009 2010 2011 2012 2013 2014 2015 2016 2017 2018
General Fund
Reserved -$ -$ -$ -$ -$ -$ -$ -$ -$ -$
Unreserved 3,411,535 2,932,931 - - - - - - - -
Nonspendable - - 1,623 3,851 - - - - - -
Committed - - - - - - - - - -
Restricted - - - - - - - - - -
Assigned - - - - - - - - - -
Unassigned - - 2,788,776 2,644,468 2,977,342 3,397,945 4,263,616 4,657,972 4,437,711 4,116,015
Total General Fund 3,411,535$ 2,932,931$ 2,790,399$ 2,648,319$ 2,977,342$ 3,397,945$ 4,263,616$ 4,657,972$ 4,437,711$ 4,116,015$
All Other Governmental Funds
Restricted 1,864,662$ 1,261,936$ 64,024$ 64,024$ 10,212,725$ 8,531,071$ 7,362,329$ 4,951,466$ 4,579,468$ 4,800,121$
Assigned - - 3,683,030 3,692,704 - - - - - -
Unassgned 2,365,042 2,695,833 17,218 12,563 - - - - - -
Total All Other Governmental Funds 4,229,704$ 3,957,769$ 3,764,272$ 3,769,291$ 10,212,725$ 8,531,071$ 7,362,329$ 4,951,466$ 4,579,468$ 4,800,121$
Note: The City implemented GASB Statement No. 54 for the fiscal year ended
September 2011. The new classifications have not been restated for 2010 and
prior.
CITY OF ALAMO, TEXAS
FUND BALANCES OF GOVERNMENTAL FUNDS
Last Ten Fiscal Years
(Unaudited)
91

2009 2010 2011 2012 2013 2014 2015 2016 2017 2018
Revenues
Taxes 6,109,664$ 6,325,469$ 6,554,949$ 6,782,249$ 6,919,827$ 6,954,202$ 7,337,252$ 7,390,754$ 7,458,819$ 7,726,500$
Fines 193,734 174,813 251,491 368,652 464,604 534,424 646,975 614,993 475,042 342,999
Licenses and permits 52,825 107,856 126,356 105,652 97,109 100,448 111,964 128,594 141,026 140,526
Charges for services 1,574,600 1,660,003 1,749,105 1,752,251 1,710,408 1,966,157 2,064,472 2,180,401 2,227,264 2,366,152
Local events and contributions - - 221,150 - 41,249 36,463 32,725 48,693 69,225 52,143
Oher revenues 404,850 56,376 64,324 - 50,913 124,471 161,998 111,936 234,339 179,892
Other 334,011 800,654 757,061 767,019 478,552 541,855 360,107 265,368 1,169,890 410,903
Interest revenue 56,355 14,650 24,245 31,339 52,794 42,343 39,590 40,722 65,424 128,358
Total Revenues 8,726,039$ 9,139,821$ 9,748,681$ 9,807,162$ 9,815,456$ 10,300,363$ 10,755,083$ 10,781,461$ 11,841,029$ 11,347,473$
Expenditures
General Government 3,334,718$ 3,425,084$ 4,042,874$ 3,008,980$ 3,091,915$ 3,270,509$ 3,586,188$ 4,778,793$ 4,598,997$ 3,978,732$
Public Safety 2,750,941 2,584,510 2,736,108 3,044,995 3,032,377 3,242,071 3,450,501 3,422,325 4,635,048 3,932,040
Highways and streets 613,527 202,615 222,385 571,269 743,220 562,193 590,526 666,445 633,853 641,120
Health and welfare 235,953 560,251 606,619 231,987 232,853 237,441 252,224 251,847 245,589 255,443
Culture and recreation 715,456 612,973 618,703 793,101 736,130 766,766 810,378 750,957 846,669 1,027,353
Economic Development 1,554,641 581,369 617,653 271,737 243,521 224,817 384,608 343,008 379,598 247,522
Capital Outlay - 729,240 407,311 2,765,675 1,366,563 2,591,683 1,986,439 1,550,006 943,793 507,877
Debt Principal 605,000 484,727 443,515 836,925 928,095 935,867 958,370 976,959 1,289,056 1,068,172
Debt Interest 424,196 499,765 511,817 324,821 411,774 399,567 375,255 352,952 341,024 317,847
Bond Issuance cost - - - - 258,793 - - - - -
Total Expenditures 10,234,432$ 9,680,534$ 10,206,985$ 11,849,490$ 11,045,241$ 12,230,914$ 12,394,489$ 13,093,292$ 13,913,627$ 11,976,106$
Excess of Revenues Over (Under) Expenditures(1,508,393) (540,713) (458,304) (2,042,328) (1,229,785) (1,930,551) (1,639,406) (2,311,831) (2,072,598) (628,633)
Other Financing Sources (Uses)
Transfers In 780,896$ 1,518,326$ 1,108,848$ 751,953$ 1,485,211$ 1,143,966$ 1,595,092$ 1,302,012$ 1,135,164$ 1,147,231$
Transfer Out - (1,229,174) (819,696) (428,103) (1,111,887) (594,666) (638,879) (752,712) (585,863) (597,931)
Proceeds from refunding bonds - - - - 3,835,000 - - - - -
Proceeds from General obligation Bonds - - - - 7,075,000 - - - - -
Payment to Bond Escrow Agent - - - - (3,893,686) - - - - -
Premium on Refunding Bonds - - - - 620,092 - - - - -
Proceeds on sale of assets - - - 398,580 - 7,700 - - 16,110 -
Other Resources 50,000 - - - - - - - - -
Loan proceeds - - - 1,210,026 - 112,500 - - 896,614 -
Total Other Financing Sources (Uses) 830,896$ 289,152$ 289,152$ 1,932,456$ 8,009,730$ 669,500$ 956,213$ 549,300$ 1,462,025$ 549,300$
Net Change in Fund Balances (677,497)$ (251,561)$ (169,152)$ (109,872)$ 6,779,945$ (1,261,051)$ (683,193)$ (1,762,531)$ (610,573)$ (79,333)$
Debt service as a percentage of
noncaptial expenditures 10.06% 11.00% 9.75% 12.79% 13.84% 13.85% 12.81% 11.52% 12.57% 12.09%
CITY OF ALAMO, TEXAS
CHANGES IN FUND BALANCE
Last Ten Fiscal Years
(Unaudited)
92

Fiscal
Year
Property
Tax
Sales
Tax
Franchise
Tax
Mixed
Beverage
Tax
Occupancy
Tax Total
2009 2,647,668$ 2,873,775$ 42,008$ 362$ 119,513$ 5,683,326$
2010 2,879,274 2,959,092 429,137 189 156,373 6,424,066
2011 2,809,375 3,139,704 450,143 1,625 153,228 6,554,075
2012 2,752,818 3,357,024 479,688 210 138,242 6,727,982
2013 2,901,895 3,374,825 497,435 199 135,700 6,910,054
2014 2,847,121 3,466,644 511,976 - 131,149 6,956,890
2015 3,224,247 3,483,713 514,954 2,010 128,721 7,353,645
2016 3,281,010 3,457,159 526,425 1,204 118,979 7,384,777
2017 3,355,089 3,435,440 537,167 137 95,870 7,423,703
2018 3,479,497 3,599,081 557,694 2,883 90,228 7,729,383
CITY OF ALAMO, TEXAS
Governmental Activities Tax Revenues by Source
Last Ten Fiscal Years
(Unaudited)
93

Fiscal Year Real Property Personal Property Minerals
Less:
Tax Exempt
Real Property
Total Taxable
Assesses Value
Total Direct
Tax Rate
Estimated Actual
Taxable Value
Assessed Value
as a Percentage of
Actual Value
2009 536,572,121 29,498,816 7,340,910 121,276,756 452,135,091 0.5919 573,411,847 79%
2010 566,405,306 41,134,558 7,453,410 137,760,500 477,232,774 0.5919 614,993,274 78%
2011 561,024,499 42,801,293 - 137,431,858 466,393,934 0.5919 603,825,792 77%
2012 577,000,366 44,411,235 - 144,441,593 476,970,008 0.5854 621,411,601 77%
2013 592,931,548 42,946,680 - 158,584,835 477,293,393 0.5989 635,878,228 75%
2014 603,331,082 46,613,114 - 160,496,288 489,447,908 0.5989 649,944,196 75%
2015 667,514,004 51,466,795 - 200,603,937 518,376,862 0.5989 718,980,799 72%
2016 700,725,523 46,086,274 - 199,858,388 546,953,409 0.5881 746,811,797 73%
2017 720,446,547 48,348,601 - 199,661,388 569,133,760 0.5810 768,795,148 74%
2018 773,390,823 52,455,543 - 214,374,624 611,441,742 0.5565 825,816,366 74%
Assessed And Estimated Actual Value of Taxable Property
City of Alamo, Texas
Last Ten Years
(Unaudited)
94

Fiscal Year
Operating
Tax Rate
Debt Service
Tax Rate
Total City
Tax Rate
Hidalgo
County
Tax Rate
PSJA ISD
School Disctrict
Tax Rate
South Texas
College
Tax Rate
Total Direct and
Overlapping
Rates
2009 0.4683 0.1235 0.5919 0.5900 1.2710 0.1498 2.6027
2010 0.4839 0.1079 0.5919 0.5900 1.3013 0.1491 2.6323
2011 0.4751 0.1167 0.5919 0.5900 1.3592 0.1497 2.6908
2012 0.4711 0.1143 0.5854 0.5900 1.3592 0.1507 2.6853
2013 0.4875 0.1114 0.5989 0.5900 1.3592 0.1507 2.6988
2014 0.4896 0.1093 0.5989 0.5900 1.3592 0.1500 2.6981
2015 0.4934 0.1055 0.5989 0.5900 1.3592 0.1850 2.7331
2016 0.4836 0.1045 0.5881 0.5900 1.3992 0.1850 2.7623
2017 0.4798 0.1012 0.5810 0.5900 1.3992 0.1850 2.7552
2018 0.4627 0.0938 0.5565 0.5800 1.3892 0.1850 2.7107
Source: Hidalgo County Tax Office
City of Alamo, Texas
Property Tax Rates
Direct and Overlapping Governments
Last Ten Fiscal Years
City of Alamo Overlapping Rates
(Unaudited)
Note: Overlapping rates are those of the City, County and School District that apply to property owners within the City of Alamo. Not all
overlapping rates apply to all City of Alamo property owners (for example, the rates of Pharr San Juan Alamo Independent School Disctrict
only apply to the City's property owners whose property is located within the geographic boundaries of the PSJA Independent School
District).
95

Tax
Value Rank
Pecentage
of Total
Taxable
Value
Tax
Value Rank
Pecentage
of Total
Taxable
Value
$ 12,173,521 1 1.99% 11,611,325$ 1 2.32%
11,679,687 2 1.91%
11,382,479 3 1.86% 7,793,411 3 1.56%
8,166,378 4 1.34% 8,629,386 2 1.72%
7,587,016 5 1.24% 4,769,893 4 0.95%
6,853,282 6 1.12%
6,823,080 7 1.12% 3,214,060 9 0.64%
6,050,785 8 0.99%
4,765,991 9 0.78% 4,225,203 5 0.84%
4,499,175 10 0.74%
4,026,731 6 0.80%
3,411,171 7 0.68%
3,352,870 8 0.67%
2,885,671 10 0.58%
$ 79,981,394 13.08% $ 53,919,721 10.76%
Source: Hidalgo County Appraisal Distrcit
Tax Payer
Wal-Mart Real Estate Bus Trust
Wilder Corporation of Delaware
Kim-Taek & Nancy Vargas Trusts
City of Alamo, Texas
Principal TaxPayers
(Unaudited)
2018 2009
Totals
Alamo Bank of Texas
Wal-Mart Stores Texas, LLC
MHC Alamo Palms, LLC
H E Butt Grocery Company
DCTN3 Texas Portfolio, LLC
AEP Texas Central Co.
HMS-US Management, LLC
Rio Grande Plastics
P & P Properties, LTD
Casa Del Valle (TX) MHC LLC
S-SI Alamo Venture No One, LP
96

Fiscal Year Total Tax Delinquent
Ended
September 30
Levy* for
Fiscal Year Amount
Percentage
of Levy
Collections in
Subsequent Years Amount
Percentage
of Levy
2009 2,708,849 2,507,674 92.6% 144,440 2,652,114 97.9%-
2010 2,726,869 2,504,374 91.8% 175,189 2,679,563 98.3%-
2011 2,703,368 2,519,605 93.2% 191,735 2,711,340 100.3%-
2012 2,718,248 2,540,124 93.4% 170,986 2,711,110 99.7%-
2013 2,801,232 2,631,442 93.9% 168,514 2,799,956 100.0%-
2014 2,865,965 2,687,376 93.8% 85,872 2,773,248 96.8%-
2015 3,034,541 2,885,295 95.1% 150,070 3,035,365 100.0%-
2016 3,149,506 3,015,594 95.7% 134,692 3,150,286 100.0%-
2017 3,241,761 3,108,020 95.9% 110,961 3,218,981 99.3%
2018 3,336,652 3,212,772 96.3% 121,136 3,333,908 99.9%-
* Tax Levy including modifications throught the year
Collection within the
Fiscal Year of the Levy Total Collection to Date
City of Alamo, Texas
Property Tax Levies and Collections
Last Ten Fiscal Years
(Unaudited)
97

Fiscal
Year Water Sewer Total
2009 1,734,934$ 1,176,813$ 2,911,747$
2010 1,633,834 1,174,667 2,808,501
2011 1,918,744 1,329,265 3,248,009
2012 1,965,803 1,400,670 3,366,473
2013 2,042,633 1,448,055 3,490,688
2014 1,973,740 1,464,665 3,438,404
2015 1,920,992 1,508,259 3,429,251
2016 2,047,498 1,574,493 3,621,991
2017 2,206,676 1,702,839 3,909,515
2018 2,213,956 1,812,188 4,026,144
CITY OF ALAMO, TEXAS
Water Sewer Revenues
Last Ten Fiscal Years
(Unaudited)
98

Fiscal
Year
General
Obligation
Bonds
Notes
Payable
Capital
Leases
Revenue
Bonds
Capital
Leases
Total
Primary
Government
Percantage
of Personal
Income (1) Per Capita
2009 9,355,000$ -$ 451,929$ 6,521,000$ 185,305$ 16,513,234$ 7.78% 942$
2010 8,690,000 - 192,582 6,345,000 82,535 15,310,117 6.28% 830
2011 8,000,000 - 65,542 6,127,000 28,089 14,220,631 5.12% 763
2012 7,285,000 637,500 828,643 6,181,000 23,222 14,955,365 5.08% 796
2013 13,615,000 637,500 710,548 5,925,000 19,569 20,907,617 7.34% 1,107
2014 12,825,000 725,475 589,206 5,661,000 15,819 19,816,500 6.50% 1,041
2015 12,015,000 701,634 464,677 5,389,000 11,968 18,582,279 6.14% 969
2016 11,190,000 677,564 336,788 5,114,000 8,017 17,326,369 5.94% 901
2017 10,345,000 653,254 812,657 5,831,000 313,457 17,955,368 5.58% 863
2018 9,475,000 628,700 638,794 5,494,000 189,946 16,426,440 5.49% 820
Note: Details regarding the City's outstanding debt can be found in the notes to the financial statements.
(1) Source: Texas Workforce Commission Tax Department.
Governmental Activities Business-Type Activities
CITY OF ALAMO, TEXAS
RATIO OF OUTSTANDING DEBT BY TYPE
Last Ten Fiscal Years
(Unaudited)
99

Fiscal
Year
General
Obligation
Bonds
Less:
Amounts
Available in
Debt Service
Fund Total
Percentage of
Estimated Actual
Taxable Value of
Property (1)
Per
Capita (2)
2009 9,355,000$ 313,288$ 9,041,712$ 2.00% 516$
2010 8,690,000 499,132 8,190,868 1.72% 444
2011 8,000,000 593,096 7,406,904 1.59% 397
2012 7,285,000 686,552 6,598,448 1.38% 351
2013 13,615,000 783,045 12,831,956 2.69% 679
2014 12,825,000 868,515 11,956,485 2.44% 628
2015 12,015,000 973,468 11,041,532 2.13% 576
2016 11,190,000 996,263 10,193,737 1.86% 530
2017 10,345,000 1,120,983 9,224,017 1.62% 443
2018 9,475,000 1,248,222 8,226,778 1.35% 410
Note: Details regarding the city's outstanding debt can be found in the notes to the financial statements.
In addition, amounts listed under general obligation bonds do not include the portion of these bonds that
are being serviced in proprietary funds.
(1) Please see the Scheudle of Assessed Value and Estimated Actual Value of Taxable Property for
property value data.
(2) Population data can be found in the Schedule of Demographic and Economic Statistics.
CITY OF ALAMO, TEXAS
RATIO OF GENERAL BONDED DEBT OUTSTANDING
Last Ten Fiscal Years
(Unaudited)
100

Governmental Unit Date
Debt
Outstanding
Estimated
Percentag
e
Applicabl
e
Estimated
Share of
Overlapping
Debt
Direct:
City of Alamo 9/30/2018 9,475$ 100% 9,475$
Overlapping:
Pharr, San Juan, Alamo ISD 9/30/2018 328,935 10.0% 32,729
Hidalgo County 9/30/2018 363,635 1.8% 6,545
Hidalgo County Irrigation District #1 9/30/2018 119,805 1.8% 2,204
South Texas College 9/30/2018 143,065 1.7% 2,375
South Texas ISD 9/30/2018 - 0.0% -
Total Direct Debt 9,475
Total Net Overlapping Debt 43,854
Total Direct and Overlapping Debt 53,329$
Source: Municipal Advisory Council of Texas
Note: Overlapping governments are those that coincide, at lease in part, with the geographic boundaries of the City.
This schedule estimates the portion of the outstanding debt of those overlapping governments that is borne by the
residents and business of the City of Alamo. This process recognizes that, when considering the government's ability
to issue and repay long-term debt, the entire debt burden borne by the residents and business should be taken into
account. However, this does not imply that every taxpayer is a resident, and therefore responsible for repaying the
debt, of each overlapping government.
CITY OF ALAMO, TEXAS
DIRECT AND OVERLAPPING GOVERNMENTAL ACTIVITIES DEBT
As of September 30, 2018
(amounts expressed in thousands)
101

Assessed Valuation 2017 Tax Roll for Fiscal Year 2018 825,816,366$
Debt Limit - Texas statutes do not prescribe a debt limit; however,
by custom a practical economic debt limit of 10% of the assessed
valuation is used. 10%
82,581,637
Total Bonded Debt 9,475,000
Deduct amount available in debt service fund 1,248,222
Applicable Debt 8,226,778
Economic Debt Margin 74,354,859$
CITY OF ALAMO, TEXAS
COMPUTATION OF LEGAL DEBT MARGIN
(Unaudited)
102

Fiscal
Year
Charges and
Other
Less:
Operating
Expenses
Net Avaliable
Revenue Principal Interest Coverage
2009 3,000,701$ 2,582,153$ 418,548$ 6,521,000$ 185,305$ 0.06
2010 2,873,480 2,130,082 743,398 6,345,000 82,535 0.12
2011 3,320,517 2,384,117 936,400 6,127,000 28,089 0.15
2012 3,438,634 2,680,613 758,021 6,181,000 23,222 0.12
2013 3,367,962 2,490,314 877,648 5,925,000 19,569 0.15
2014 3,531,528 2,745,418 786,110 5,661,000 15,819 0.14
2015 3,584,914 1,416,717 2,168,197 5,389,000 11,968 0.40
2016 3,764,724 1,676,250 2,088,474 5,114,000 8,017 0.41
2017 4,070,441 2,090,305 1,980,136 5,831,000 313,457 0.32
2018 4,194,678 2,901,074 1,293,604 5,494,000 189,946 0.23
Debt Service
CITY OF ALAMO, TEXAS
PLEDGED-REVENUE COVERAGE
Last Ten Fiscal Years
(Unaudited)
Revenue Bonds
103

Fiscal
Year Population (1)
MSA
Per Capita
Personal
Income (3)
Median
Age (3)
Unemployment
Rate (2)
2009 17,526 12,110 33.5 0.50%
2010 18,452 13,202 31.9 2.10%
2011 18,642 14,890 35.1 0.80%
2012 18,778 15,683 35.3 2.90%
2013 18,885 15,078 34.7 0.10%
2014 19,036 16,007 35.6 2.30%
2015 19,171 15,787 35.1 0.30% -
2016 19,220 15,164 33.3 1.90% -
2017 20,804 15,476 34.2 0.10% -
2018 20,041 14,920 31.1 1.80%
(1) Estimated (Information was received from the US Census)
(2) Source: Texas Workforce Commission Tax Department
(3) Source: U.S. Census Bureau, American Community Survey 5-year Estimates
City of Alamo, Texas
Demographic and Economic Statistics
Last Ten Fiscal Years
(Unaudited)
104

Employees Rank
3,500 1
439 2
304 3
148 4
60 5
40 6
34 7
33 8
32 9
30 10
4,620
Source: Alamo Economic Development Corporation
City of Alamo, Texas
Principal Employers
(Unaudited)
Hess Air
Totals
2018
Peter Piper Pizza
City of Alamo
Rio Plex Distributors
McDonald's
Vangaurd Academy Mozart Elementary
South Texas Health Systems ER
H.E.B
Employees
PSJA Independent School District
Wal-Mart
105

Fiscal Year Fiscal Year Fiscal Year
General Government 2016 2017 2018
01-510 Mayor and City Council 5 5 5
01-512 Planning and Comm. Develop. 3 3 3
01-514 Municipal Court 2 2 2
01-522 City Manger 2 2 2
01-523 Purchasing 2 2 2
01-524 City Secretary 1 1 1
01-525 Human Resources 1 1 1
01-526 Finance 4 4 4
01-529 Information Technology 2 2 2
01-550 2 2 2
Public Safety
01-513 41 41 46
01-516 19 21 21
Highways and Streets
01-518 17 17 17
01-512 1 1 1
01-515 Library 7 7 7
01-517 Parks & Recreation 11.50 11.50 11.50
01-519 Museum 1 1 1
01-521 Swimming Pool 2.50 2.50 2.50
124 126 131
03-530 Water 10 10 10
03-531 Sewer 4 4 4
03-534 Water Plant 5 5 5
03-536 Billing 4 4 4
23 23 23
147 149 154
Source: City of Alamo Finance Department
Streets
Code Enforcement
Health & Welfare
Culture & Recreation
General Fund Total
Utility
Water/Sewer Fund Total
Grand Total
Storm Water
Police
Fire
City of Alamo, Texas
Full-Time Equivalent City Government Employees by Function
Last Three Fiscal Years
(Unaudited)
106

Function 2017 2018
Public Safety - Police
Physical Arrests 321 1882
38 9
2690 3816
1492 1317
253 234
42 45
1541 2600
Culture and Recreation
Programs 9 9
Parks Maintained 7 7
Water
New Connections 803 857
Water Main Breaks 42 56
Average Daily Consumption (millions of gallons) 1.799 1.683
Wastewater
Average Daily Sewage Treatment (millions of gallons) 1.671 1.547
Source: Various City Departments
Note: Indicators are not available for the general government function
City of Alamo, Texas
Operating Indicators by Function
(Unaudited)
Parking Violations
Traffic Violations
Public Safety - Fire
Traffic Signs Repaired
Solid Waste Services
Materials Recycled - Tons
Number of Calls Answered
Inspections
Highways and Streets
107

Function 2018
Miles of Streets:
Paved 113.48
44.09
89.95
Storm Drainage Ditches 14.54
455
$ 97,806
2
Number of Stations 1
Recreation:
Number of Parks 7
Number of Playgrounds 9
Number of Municipal Swimming Pools 1
Number of Splash Pads 2
Tennis Courts 4
Baseball Fields 7
Soccer Fields 1
Basketball Fields 4
Source: Various City Departments
Fire Protection:
Number of Stations
Police Protection:
City of Alamo, Texas
Capital Assets Statistics by Function
(Unaudited)
Sanitary
Building Permits:
Permits Issued
Estimated Value
Miles of Sewer:
Storm
108

CITY OF ALAMO, TEXAS
This page left blank intentionally.

INTERNAL CONTROL / COMPLIANCE SECTION
109

INDEPENDENT AUDITOR’S REPORT ON INTERNAL CONTROL OVER FINANCIAL REPORTING AND ON COMPLIANCE AND OTHER MATTERS BASED ON AN AUDIT OF FINANCIAL STATEMENTS PERFORMED IN
ACCORDANCE WITH GOVERNMENT AUDITING STANDARDS
To the City Commission of City of Alamo, Texas
We have audited, in accordance with the auditing standards generally accepted in the United States of America and the standards applicable to financial audits contained in Government Auditing Standards issued by the Comptroller General of the United States, the financial statements of the governmental activities, the business-type activities, the blended component units, each major fund, and the aggregate remaining fund information of the City of Alamo, Texas, as of and for the year ended September 30, 2018, and the related notes to the financial statements, which collectively comprise the City of Alamo, Texas’ basic financial statements, and have issued our report thereon dated March 21, 2019.
Internal Control over Financial Reporting
In planning and performing our audit of the financial statements, we considered the City of Alamo, Texas’ internal control over financial reporting (internal control) to determine the audit procedures that are appropriate in the circumstances for the purpose of expressing our opinions on the financial statements, but not for the purpose of expressing an opinion on the effectiveness of the City of Alamo, Texas’ internal control. Accordingly, we do not express an opinion on the effectiveness of the City of Alamo, Texas’ internal control.
A deficiency in internal control exists when the design or operation of a control does not allow management or employees, in the normal course of performing their assigned functions, to prevent, or detect and correct, misstatements on a timely basis. A material weakness is a deficiency, or a combination of deficiencies, in internal control, such that there is a reasonable possibility that a material misstatement of the entity’s financial statements will not be prevented, or detected and corrected on a timely basis. A significant deficiency is a deficiency, or a combination of deficiencies, in internal control that is less severe than a material weakness, yet important enough to merit attention by those charged with governance.
Our consideration of internal control was for the limited purpose described in the first paragraph of this section and was not designed to identify all deficiencies in internal control that might be material weaknesses or significant deficiencies. Given these limitations, during our audit we did not identify any deficiencies in internal control that we consider to be material weaknesses. However, material weaknesses may exist that have not been identified.
Compliance and Other Matters
As part of obtaining reasonable assurance about whether the City of Alamo, Texas’ financial statements are free from material misstatement, we performed tests of its compliance with certain provisions of laws, regulations, contracts, and grant agreements, noncompliance with which could have a direct and material effect on the determination of financial statement amounts. However, providing an opinion on compliance with those provisions was not an objective of our audit, and accordingly, we do not express such an opinion. The results of our tests disclosed no instances of noncompliance or other matters that are required to be reported under Government Auditing Standards.
110

111

A. Summary of Auditor's Results
1. Financial StatementsType of Report Issued: X YES NO
2. Internal control over financial reporting:
One or more material weaknesses identified? YES X NONE REPORTED
One of more significant deficiencies identifiedthat are not considered to be material weaknesses? YES X NONE REPORTED
3. City of Alamo, Texas did not qualify for a single audit within the context of OMB-Circular A-133 or the OMB-Uniform Guidance.
B. Financial Statement Findings
None.
CITY OF ALAMO, TEXASSchedule of Findings and Responses
For the Year Ended September 30, 2018
UNMODIFIED
112