city national corp. (beverly hills, ca)
Post on 11-Jun-2016
215 views
TRANSCRIPT
CITY NATIONAL CORP. (BEVERLY HILLS, CA) Exchange
NYSSymbol
CYNPrice
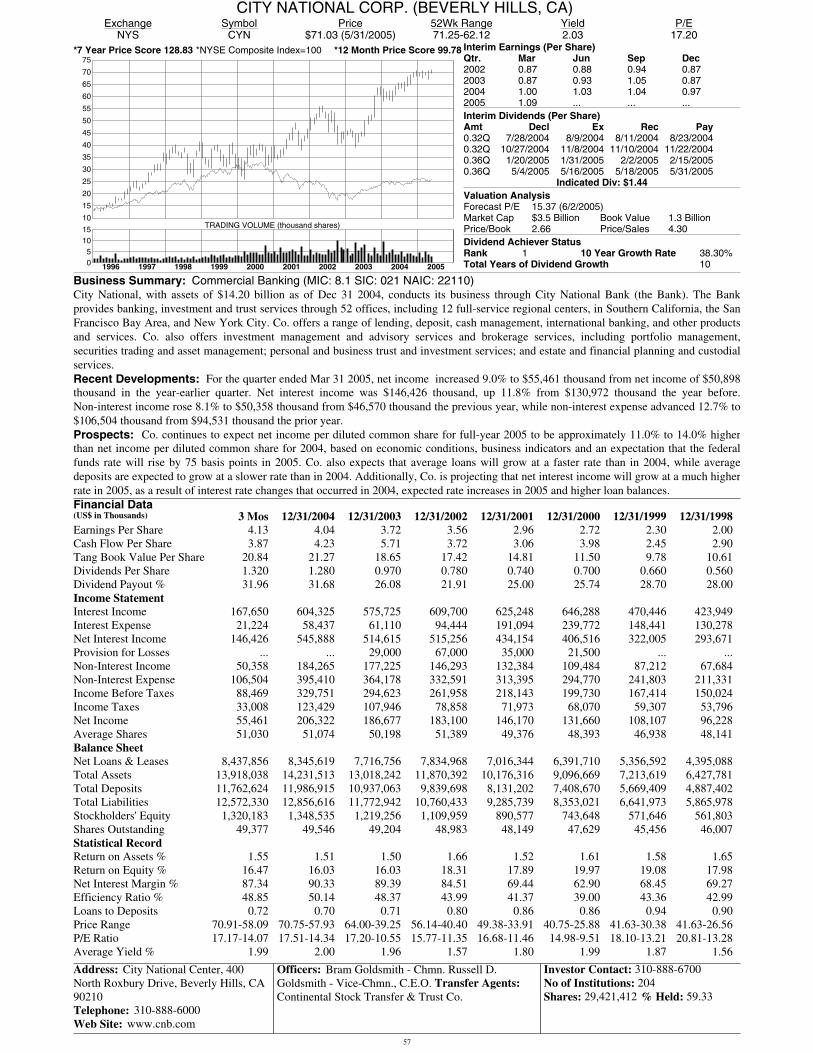
$71.03 (5/31/2005)52Wk Range71.25-62.12
Yield2.03
P/E17.20
*7 Year Price Score 128.83 *12 Month Price Score 99.78*NYSE Composite Index=100 Interim Earnings (Per Share)Qtr. Mar Jun Sep Dec2002 0.87 0.88 0.94 0.872003 0.87 0.93 1.05 0.872004 1.00 1.03 1.04 0.972005 1.09 ... ... ...Interim Dividends (Per Share)Amt Decl Ex Rec Pay0.32Q 7/28/2004 8/9/2004 8/11/2004 8/23/20040.32Q 10/27/2004 11/8/2004 11/10/2004 11/22/20040.36Q 1/20/2005 1/31/2005 2/2/2005 2/15/20050.36Q 5/4/2005 5/16/2005 5/18/2005 5/31/2005
Indicated Div: $1.44Valuation AnalysisForecast P/E 15.37 (6/2/2005)Market Cap $3.5 Billion Book Value 1.3 BillionPrice/Book 2.66 Price/Sales 4.30Dividend Achiever StatusRank 1 10 Year Growth Rate 38.30%Total Years of Dividend Growth 10
TRADING VOLUME (thousand shares)10
15
20
25
30
35
40
45
50
55
60
65
70
75
1996 1997 1998 1999 2000 2001 2002 2003 2004 200505
1015
Business Summary: Commercial Banking (MIC: 8.1 SIC: 021 NAIC: 22110)City National, with assets of $14.20 billion as of Dec 31 2004, conducts its business through City National Bank (the Bank). The Bankprovides banking, investment and trust services through 52 offices, including 12 full-service regional centers, in Southern California, the SanFrancisco Bay Area, and New York City. Co. offers a range of lending, deposit, cash management, international banking, and other productsand services. Co. also offers investment management and advisory services and brokerage services, including portfolio management,securities trading and asset management; personal and business trust and investment services; and estate and financial planning and custodialservices.Recent Developments: For the quarter ended Mar 31 2005, net income increased 9.0% to $55,461 thousand from net income of $50,898thousand in the year-earlier quarter. Net interest income was $146,426 thousand, up 11.8% from $130,972 thousand the year before.Non-interest income rose 8.1% to $50,358 thousand from $46,570 thousand the previous year, while non-interest expense advanced 12.7% to$106,504 thousand from $94,531 thousand the prior year. Prospects: Co. continues to expect net income per diluted common share for full-year 2005 to be approximately 11.0% to 14.0% higherthan net income per diluted common share for 2004, based on economic conditions, business indicators and an expectation that the federalfunds rate will rise by 75 basis points in 2005. Co. also expects that average loans will grow at a faster rate than in 2004, while averagedeposits are expected to grow at a slower rate than in 2004. Additionally, Co. is projecting that net interest income will grow at a much higherrate in 2005, as a result of interest rate changes that occurred in 2004, expected rate increases in 2005 and higher loan balances. Financial Data
Address: City National Center, 400North Roxbury Drive, Beverly Hills, CA90210Telephone: 310-888-6000Web Site: www.cnb.com
Officers: Bram Goldsmith - Chmn. Russell D.Goldsmith - Vice-Chmn., C.E.O. Transfer Agents: Continental Stock Transfer & Trust Co.
Investor Contact: 310-888-6700No of Institutions: 204Shares: 29,421,412 % Held: 59.33
(US$ in Thousands) 3 Mos 12/31/2004 12/31/2003 12/31/2002 12/31/2001 12/31/2000 12/31/1999 12/31/1998Earnings Per Share 4.13 4.04 3.72 3.56 2.96 2.72 2.30 2.00Cash Flow Per Share 3.87 4.23 5.71 3.72 3.06 3.98 2.45 2.90Tang Book Value Per Share 20.84 21.27 18.65 17.42 14.81 11.50 9.78 10.61Dividends Per Share 1.320 1.280 0.970 0.780 0.740 0.700 0.660 0.560Dividend Payout % 31.96 31.68 26.08 21.91 25.00 25.74 28.70 28.00Income StatementInterest Income 167,650 604,325 575,725 609,700 625,248 646,288 470,446 423,949Interest Expense 21,224 58,437 61,110 94,444 191,094 239,772 148,441 130,278Net Interest Income 146,426 545,888 514,615 515,256 434,154 406,516 322,005 293,671Provision for Losses ... ... 29,000 67,000 35,000 21,500 ... ...Non-Interest Income 50,358 184,265 177,225 146,293 132,384 109,484 87,212 67,684Non-Interest Expense 106,504 395,410 364,178 332,591 313,395 294,770 241,803 211,331Income Before Taxes 88,469 329,751 294,623 261,958 218,143 199,730 167,414 150,024Income Taxes 33,008 123,429 107,946 78,858 71,973 68,070 59,307 53,796Net Income 55,461 206,322 186,677 183,100 146,170 131,660 108,107 96,228Average Shares 51,030 51,074 50,198 51,389 49,376 48,393 46,938 48,141Balance SheetNet Loans & Leases 8,437,856 8,345,619 7,716,756 7,834,968 7,016,344 6,391,710 5,356,592 4,395,088Total Assets 13,918,038 14,231,513 13,018,242 11,870,392 10,176,316 9,096,669 7,213,619 6,427,781Total Deposits 11,762,624 11,986,915 10,937,063 9,839,698 8,131,202 7,408,670 5,669,409 4,887,402Total Liabilities 12,572,330 12,856,616 11,772,942 10,760,433 9,285,739 8,353,021 6,641,973 5,865,978Stockholders' Equity 1,320,183 1,348,535 1,219,256 1,109,959 890,577 743,648 571,646 561,803Shares Outstanding 49,377 49,546 49,204 48,983 48,149 47,629 45,456 46,007Statistical RecordReturn on Assets % 1.55 1.51 1.50 1.66 1.52 1.61 1.58 1.65Return on Equity % 16.47 16.03 16.03 18.31 17.89 19.97 19.08 17.98Net Interest Margin % 87.34 90.33 89.39 84.51 69.44 62.90 68.45 69.27Efficiency Ratio % 48.85 50.14 48.37 43.99 41.37 39.00 43.36 42.99Loans to Deposits 0.72 0.70 0.71 0.80 0.86 0.86 0.94 0.90Price Range 70.91-58.09 70.75-57.93 64.00-39.25 56.14-40.40 49.38-33.91 40.75-25.88 41.63-30.38 41.63-26.56P/E Ratio 17.17-14.07 17.51-14.34 17.20-10.55 15.77-11.35 16.68-11.46 14.98-9.51 18.10-13.21 20.81-13.28Average Yield % 1.99 2.00 1.96 1.57 1.80 1.99 1.87 1.56
57