city magnets iii: benchmarking the attractiveness of 50...
TRANSCRIPT

CITY MAGNETS III
Benchmarking the Attractiveness of 50 Canadian Cities.
REPORT SEPTEMBER 2014

City Magnets III: Benchmarking the Attractiveness of 50 Canadian Cities The Conference Board of Canada
Preface
City Magnets III: Benchmarking the Attractiveness of 50 Canadian Cities analyzes and benchmarks the features that make Canadian cities attractive to skilled workers and mobile populations. Cities without the ability to act as magnets and attract new people will struggle to stay prosperous in the decades ahead. In keeping with the Conference Board’s How Canada Performs: A Report Card on Canada, this report ranks outcomes, or proxies for outcomes, and tells us how attractive our cities are to people. The performance of 50 cities is compared across seven different categories: Society, Health, Economy, Environment, Education, Innovation, and Housing.
To cite this report: The Conference Board of Canada, City Magnets III: Benchmarking the Attractiveness of 50 Canadian Cities. Ottawa, The Conference Board of Canada, 2014.
©2014 The Conference Board of Canada* Published in Canada | All rights reserved | Agreement no. 40063028 | *incorporated as AERiC inc.
An accessible version of this document for the visually impaired is available upon request. Accessibility Officer, The Conference Board of Canada Tel.: 613-526-3280 or 1-866-711-2262 E-mail: [email protected]
®The Conference Board of Canada and the torch logo are registered trademarks of The Conference Board, inc. Forecasts and research often involve numerous assumptions and data sources, and are subject to inherent risks and uncertainties. This information is not intended as specific investment, accounting, legal, or tax advice.
CONTENTS
i EXECUTIVE SUMMARY
Chapter 1 1 introduction
Chapter 2 8 Methodology 9 City Selection 10 Indicator Selection 11 Rankings for Each Indicator 12 Rankings for Each Category 13 Overall Rankings
Chapter 3 14 Society
Chapter 4 25 Health
Chapter 5 32 Economy
Chapter 6 42 Environment
Chapter 7 47 Education
Chapter 8 53 innovation
Chapter 9 59 Housing
Chapter 10 65 Magnetic north: The Attractiveness of Canada’s Cities 73 “A” Cities: Strong Magnets 78 “B” Cities: Magnetic Appeal 79 “C” Cities: Room for Improvement 80 “D” Cities: Struggling to Attract
Chapter 11 82 Conclusion
Appendix A 85 Retrospective: Looking Back at City Magnets II
Appendix B 95 Bibliography
Appendix C 97 indicators of Performance in Each Category, by City

AcknowledgementsTeam for the preparation of City Magnets III: Benchmarking the Attractiveness of 50 Canadian Cities
Project Director Pedro Antunes
Principal Author Marni Cappe
Contributors Alan Arcand, Greg Sutherland, Jane McIntyre
Editing Stephanie Small
Proofreading Craig MacLaine
Graphics and Layout Colette Boisvert
Production Management Nikki McGuinty
This work could not have been completed without the incredible support of our investors. Thanks to all of them:
The City of Brampton
The City of Calgary
The City of Edmonton
La Ville de Lévis
The City of Markham
The City of Moncton
La Ville de Montréal
The City of Ottawa
The City of Regina
The City of Richmond
The City of St. John’s
The City of Saskatoon
The City of Surrey
The City of Toronto
The City of Vaughan

Find this and other Conference Board research at www.e-library.ca
EXECUTIVE SUMMARY
City Magnets III: Benchmarking the Attractiveness of 50 Canadian Cities
At a Glance
• City Magnets III grades and ranks 50 Canadian cities according to features that make them attractive to mobile populations.
• The 43 features we identify as making cities attractive are grouped into seven main categories: Society, Health, Economy, Environment, Education, innovation, and Housing.
• Six cities earn “A” grades across the board: Waterloo, Calgary, Ottawa, Richmond Hill, Vancouver, and St. John’s.

CiTy MAGnETS iiiBenchmarking the Attractiveness of 50 Canadian Cities
Find this and other Conference Board research at www.e-library.ca ii
This is the third City Magnets report prepared by The Conference Board of Canada to analyze the dynamics of city living. Like City Magnets II (2010), this report starts with the premise that cities failing to attract new people will struggle to stay prosperous and vibrant. We analyze 50 Canadian cities according to 43 features that make cities attractive to highly mobile populations.
Furthering the work of City Magnets II, this report also investigates
whether university-educated migrants use different criteria than non-
university-educated migrants when choosing where to live. As it turns
out, the criteria used by migrants are almost the same, regardless of
education levels, although modest variations exist on how individual
criteria are weighted. For instance, university-educated migrants value
aspects of urban living that make a city a great place to live, work, and
play (characteristics grouped here under our Society category) more
highly than other migrants do.
This edition of City Magnets includes a retrospective that shows results
for 2014 mirror closely those of 2010: the best cities are still at the top;
and for the most part, the struggling cities continue to struggle.
City Rankings by Category
The 43 features we identify as making cities attractive are grouped
into seven main categories: Society, Health, Economy, Environment,
Education, innovation, and Housing.
in the Society category, Canada’s largest cities generally perform best.
Toronto, Montréal, Vancouver, and Ottawa are the top four, followed
by three cities within the Toronto census metropolitan area: Markham,
Richmond Hill, and Brampton. Each of these “A” cities has its own
unique appeal, but they all share a diverse and strong multicultural base.

Executive Summary | The Conference Board of Canada
Find this and other Conference Board research at www.e-library.ca iii
Small cities tend to have weaker outcomes in this category; five of the
six cities with “D” grades are small. Apart from their small size, these
cities share the following traits: low levels of foreign-born population and
diversity, low density, low levels of non-automobile commuting, and few
residents in cultural occupations.
When it comes to Health, small and mid-sized cities emerge as the
best places for good access to health care. Apart from Halifax (fourth-
best), the top eight cities have populations of less than 160,000. The
performance of small cities is likely due, in part, to the role of regional
health services based in smaller cities and serving a broad hinterland.
Overall, only Kingston and St. John’s score high enough to earn an
“A” grade in the Health category, and only three big cities are counted
among the 11 “B” grades (Québec City, Hamilton, and Vancouver).
Suburban cities generally fare worse than the big cities dominating
their respective census metropolitan areas in Health.
The Economy category, based on 2011 data, provides a snapshot
of how each urban centre performed in the post-recession recovery
period. not surprisingly, cities in the West are among the top performers,
thanks to the booming resource-based economies in Alberta and
Saskatchewan. Overall results reveal solid economies for half of the
50 cities earning “A” or “B” grades. Only 5 cities have a “D” grade;
4 are in Ontario, struggling to recover post-recession.
Cities in British Columbia dominate the Environment category,
accounting for half of the top 10 cities. Montréal and its suburbs
(Longueuil and Laval) have three of the six worst results on the
environment. Montréal (50th) is the only city with a “D” grade. not
much better off, Toronto and the suburbs of Oakville, Mississauga,
and Vaughan find themselves among the bottom 8 cities. What
these cities have in common are too many air quality advisories and
a long solo commute to work.

CiTy MAGnETS iiiBenchmarking the Attractiveness of 50 Canadian Cities
Find this and other Conference Board research at www.e-library.ca iv
in the Education category, two small cities stand out in the field of
50: Waterloo (1st) and Kingston (2nd) get the only two “A” grades.
Both enjoy the benefits of a “town and gown” city, with two universities
located within each of their borders. The cities with the poorest results
are generally (although not uniformly) small and also have weak results
on the knowledge employment indicator in the Economy category. in
fact, the cities with the seven lowest results on Education overall are the
same seven cities at the bottom on knowledge employment.
Five cities earn an “A” grade on Innovation: Calgary, Waterloo,
Richmond Hill, Markham, and Burnaby. not surprisingly, the top two
cities, Calgary (1st) and Waterloo (2nd) are also the two best cities in
the Economy category. Of the 10 “B” cities in the innovation category,
3 are in the Toronto census metropolitan area and 3 are in the
Vancouver census metropolitan area. Ottawa, Edmonton, and Regina
complete the list. All but 3 of the 18 “D” cities are in Ontario and Quebec
and, for the most part, have economies based on manufacturing or
resources (excluding oil and gas). The cities with the weakest scores
on innovation also fared badly in the Economy overall.
The Housing category is the smallest, relying on only three indicators,
of which two relate to affordability and the third to housing condition.
Small and mid-sized cities dominate the top tier in this category (with
the notable exception of Québec City and Calgary). Led by Lévis, half of
the six “A” cities are in Quebec—one contributing factor is the existence
of strong rent control legislation resulting in relatively affordable rents.
Oakville, Waterloo, and Calgary account for the other three “A”s—all
three are among the leading cities when it comes to per capita income,
allowing for relatively strong results on affordability. At the low end of the
spectrum, 10 cities have “D” grades, including Vancouver, three of its
suburbs, and Victoria.

Executive Summary | The Conference Board of Canada
Find this and other Conference Board research at www.e-library.ca v
Magnetic North: The Attractiveness of Canada’s Cities
The overarching goal of this report is to gauge the appeal of these
50 Canadian cities to new migrants and to understand how education
levels may influence locational choices. The evidence is clear: cities that
emerge as the top destinations for university-educated migrants are also
at the top of the list for non-university-educated migrants.
Six cities earn “A” grades across the board: Waterloo, Calgary, Ottawa,
Richmond Hill, Vancouver, and St. John’s. These six cities, extending
from coast to coast, represent a diverse cluster of cities, emblematic
of Canada overall. Each of these cities offers a unique combination of
attributes that add up to a great place to live. For some, like Calgary and
St. John’s, economic opportunities abound; for others, like Vancouver,
welcoming communities strengthen already diverse, multicultural
neighbourhoods. More importantly, each “A” city shares at least one
thing in common: it excels in more than one of the seven categories.
The next tier of successful cities are those 14 cities with an overall
“B” grade, representing six provinces and including a majority of the
mid-sized cities. included among the “B” cities, which are located all
across the country, are a diverse group of suburbs and “hub” cities—
that is, the largest cities within their respective areas, typically the
historical heart of the area
For 17 cities, a “C” grade signals room for improvement. This group
includes a range of small, medium-sized, and big cities from across
Canada, but three-quarters are in Ontario or Quebec. Overall, the
“C” cities have poor results on either Economy or Society, or in a
few instances, on both.
Without question, the “D” cities are struggling, and it matters little
whether they are measured against migrants with a university degree
or without. Most of the “D” cities are in Ontario, and all but one are
small or mid-sized.


Find this and other Conference Board research at www.e-library.ca
CHAPTER 1
Introduction
Chapter Summary
• Attracting skilled and creative workers is crucial to the competitiveness of Canada and its cities.
• City Magnets III compares the performance of 50 Canadian cities across seven categories: Economy, Society, Health, Environment, innovation, Education, and Housing. These categories are broken down into 43 features that make cities attractive to mobile populations.
• Migrants with and without university degrees use similar criteria when choosing where to live, although modest variations exist in how individual criteria are weighted.
• Aside from some notable changes, results for this 2014 report mirror closely those of our 2010 report: the best cities are still at the top; and for the most part, the struggling cities continue to struggle.

CiTy MAGnETS iiiBenchmarking the Attractiveness of 50 Canadian Cities
Find this and other Conference Board research at www.e-library.ca 2
This is the third City Magnets report prepared by The Conference Board of Canada to analyze the dynamics of city living. Like City Magnets II (2010), this report starts with the premise that cities failing to attract new people will struggle to stay prosperous and vibrant. The Conference Board has been a keen observer and analyst of the Canadian economy, and has argued strenuously that attracting skilled and creative workers is crucial to this country’s competitiveness.
in City Magnets III, we analyze 50 Canadian cities according to
43 features that make them attractive to mobile populations, be they
from other countries, other provinces, or other cities. These indicators
were developed based on the Conference Board’s own work and
informed by the work of other urban experts. in this 2014 edition, two
new indicators have been added: full-time employment and population
in occupations supporting health care. As in our previous City Magnets
report, cities are benchmarked by grouping the indicators into seven
categories: Economy, Society, Health, Environment, innovation,
Education, and Housing.
in preparing the overall results, the Conference Board developed
a unique analytical tool to explore more deeply the relationship
between migrants and successful cities. As explained in the following
Methodology section, this analytical tool is based on calculating weights
for each of the seven categories, in accordance with the education
levels of immigrants. We set out to explore whether university-educated
migrants use different criteria than non-university-educated migrants
when choosing where to live. As it turns out, the criteria used by migrants
are almost the same, regardless of education levels, although modest
variations exist in how individual criteria are weighted. For instance,
university-educated migrants value education more highly than other
migrants do, but not dramatically more.

Chapter 1 | The Conference Board of Canada
Find this and other Conference Board research at www.e-library.ca 3
This edition of City Magnets includes a retrospective comparing current
results with those of City Magnets II. As it happens, results for 2014
mirror closely those of 2010: the best cities are still at the top; and for the
most part, the struggling cities continue to struggle. A handful of cities
have seen significant improvement in their rankings (Saskatoon, Regina,
Burnaby, Moncton, Coquitlam, and Saguenay), but others have dropped.
The 50 cities include the 44 most populous cities in Canada, plus 6 cities
that are critical hubs within their respective census metropolitan areas
(Waterloo, Brantford, Victoria, Peterborough, Saint John, and Moncton).
The cities are found in 9 of Canada’s 10 provinces, although of the total,
nearly half are in Ontario (24). What’s more, of these 24, 18 are part of
the Toronto-centred region known as the Greater Golden Horseshoe.
Another 9 cities are in Quebec; 8 are in British Columbia.
it must be emphasized the Conference Board does not compare these
50 cities on the premise that they are competing against each other. in
an ideal world, each city would be benchmarked against the optimal level
for each indicator; however, in the real world, such an optimum does not
exist. The second-best option is to benchmark them against each other
to gauge where each city ranks vis-à-vis the top performer. De facto,
this makes the best performance the optimal result. Benchmarking also
becomes more useful when carried out consistently over time, allowing
each city to measure its own progress. This is why City Magnets III
includes an additional section that compares the current results with
those of City Magnets II. in this regard, City Magnets III provides much
added value for decision-makers in each of these 50 cities.
Table 1 provides census data on population and growth rates (between
2006 and 2011) for all cities, grouping the cities according to size,
as follows:
• big cities of over 450,000 inhabitants: 12 (2 more than in City Magnets II)
• mid-sized cities of 150,000–449,999: 18
• small cities of 60,000–149,999: 20
Benchmarking becomes more useful when carried out consistently over time, allowing each city to measure its own progress.

CiTy MAGnETS iiiBenchmarking the Attractiveness of 50 Canadian Cities
Find this and other Conference Board research at www.e-library.ca 4
Table 1Population and Growth Rates for 50 of Canada’s Largest Cities
CityPopulation,
2011Population,
2006Average annual
growth (%)Five-year
growth (%)City population as percentage
of census metropolitan area (%) Area km2
Big cities
Toronto, Ont. 2,615,060 2,503,281 0.9 4.5 46.9 630.21
Montréal, Que. 1,649,519 1,620,693 0.4 1.8 43.1 365.13
Calgary, Alta. 1,096,833 988,812 2.1 11.0 90.3 825.29
Ottawa, Ont. 883,391 812,129 1.7 8.8 71.5 2,790.22
Edmonton, Alta. 812,201 730,372 2.1 11.2 70.0 684.37
Mississauga, Ont. 713,443 668,599 1.3 6.8 12.8 292.40
Winnipeg, Man. 663,617 633,451 0.9 4.8 90.9 464.08
Vancouver, B.C. 603,502 578,041 0.9 4.4 26.1 114.97
Brampton, Ont. 523,911 433,806 3.8 20.8 9.4 266.34
Hamilton, Ont. 519,949 504,559 0.6 3.1 72.1 1,117.23
Québec City, Que. 516,622 491,142 1.0 5.2 67.5 454.10
Surrey, B.C. 468,251 394,976 3.5 18.6 20.2 316.41
Mid-sized cities
Laval, Que. 401,553 368,709 1.7 8.9 10.5 247.09
Halifax, n.S. 390,096 372,679 0.9 4.7 99.9 5,490.28
London, Ont. 366,151 352,395 0.8 3.9 77.1 420.57
Markham, Ont. 301,709 261,573 2.9 15.3 5.4 212.58
Vaughan, Ont. 288,301 238,866 3.8 20.7 5.2 273.52
Gatineau, Que. 265,349 242,124 1.8 9.6 21.5 342.98
Longueuil, Que. 231,409 229,330 0.2 0.9 6.1 115.59
Burnaby, B.C. 223,218 202,799 1.9 10.1 9.6 90.61
Saskatoon, Sask. 222,189 202,408 1.9 9.8 85.3 209.56
Kitchener, Ont. 219,153 204,668 1.4 7.1 45.9 136.79
Windsor, Ont. 210,891 216,473 –0.5 –2.6 65.1 146.32
Regina, Sask. 193,100 179,282 1.5 7.7 91.7 145.45
Richmond, B.C. 190,473 174,461 1.8 9.2 8.2 129.27
(continued ...)

Chapter 1 | The Conference Board of Canada
Find this and other Conference Board research at www.e-library.ca 5
Table 1 (cont’d)Population and Growth Rates for 50 of Canada’s Largest Cities
CityPopulation,
2011Population,
2006Average annual
growth (%)Five-year
growth (%)City population as percentage
of census metropolitan area (%) Area km2
Richmond Hill, Ont. 185,541 162,704 2.7 14.0 3.3 100.95
Oakville, Ont. 182,520 165,613 2.0 10.2 3.3 138.88
Burlington, Ont. 175,779 164,415 1.3 6.9 24.4 185.66
Greater Sudbury, Ont. 160,274 157,857 0.3 1.5 99.7 3,227.38
Sherbrooke, Que. 154,601 147,427 1.0 4.9 76.6 353.49
Small cities
Oshawa, Ont. 149,607 141,590 1.1 5.7 42.0 145.68
Saguenay, Que. 144,746 143,692 0.1 0.7 91.7 1,126.48
Lévis, Que. 138,769 130,006 1.3 6.7 18.1 449.31
Barrie, Ont. 135,711 128,430 1.1 5.7 72.6 77.39
Abbotsford, B.C. 133,497 124,258 1.4 7.4 78.4 375.55
St. Catharines, Ont. 131,400 131,989 –0.1 –0.4 33.5 96.11
Trois-Rivières, Que. 131,338 126,293 0.8 4.0 86.5 288.90
Cambridge, Ont. 126,748 120,371 1.0 5.3 26.6 113.00
Coquitlam, B.C. 126,456 114,565 2.0 10.4 5.5 122.30
Kingston, Ont. 123,363 117,207 1.0 5.3 77.3 451.17
Guelph, Ont. 121,688 114,943 1.1 5.9 86.2 87.20
Kelowna, B.C. 117,312 107,035 1.9 9.6 65.2 211.82
Thunder Bay, Ont. 108,359 109,160 –0.1 –0.7 89.1 328.24
St. John's, nfld. 106,172 100,646 1.1 5.5 54.0 446.06
Waterloo, Ont. 98,780 97,475 0.3 1.3 20.7 64.02
Brantford, Ont. 93,650 90,192 0.8 3.8 69.1 72.47
Victoria, B.C. 80,017 78,057 0.5 2.5 23.2 19.47
Peterborough, Ont. 78,698 75,406 0.9 4.4 66.1 63.80
Saint John, n.B. 70,063 68,043 0.6 3 54.8 315.82
Moncton, n.B. 69,074 64,128 1.5 7.7 49.8 141.17
Canada 33,476,688 31,612,897 1.2 5.9 8,965,121.42
Source: The Conference Board of Canada.

CiTy MAGnETS iiiBenchmarking the Attractiveness of 50 Canadian Cities
Find this and other Conference Board research at www.e-library.ca 6
By international standards, of course, a big city would have millions
of people. in Canada, only 3 cities top 1 million: Toronto, Montréal, and
Calgary (joining the 1 million+ club as of Census 2011). Accordingly, for
this Canadian study, we have identified a threshold of 450,000 people for
a city to qualify as “big,” resulting in an inventory of 12 big cities.
Large Census Metropolitan Areas
Statistics Canada defines a census metropolitan area as being formed by one
or more adjacent municipalities centred on a population centre, known as the
core or “hub” city.
Toronto census metropolitan area includes:• Toronto
• Mississauga
• Brampton
• Markham
• Vaughan
• Richmond Hill
• Oakville
• plus 16 other municipalities
Vancouver census metropolitan area includes:• Vancouver
• Surrey
• Burnaby
• Richmond
• Coquitlam
• plus 16 other municipalities
Montréal census metropolitan area includes:• Montréal
• Laval
• Longueuil
• plus 86 other municipalities

Chapter 1 | The Conference Board of Canada
Find this and other Conference Board research at www.e-library.ca 7
Between 2006 and 2011, population growth in key suburbs around
Toronto and Vancouver continued to outpace the rest of urban Canada.
Just as in the previous five-year period, Brampton and Vaughan led
all 50 municipalities with explosive growth, topping 20 per cent—more
than three times the Canadian average. Close behind, Surrey grew by
18.6 per cent. Two other suburban municipalities north of Toronto—
Markham and Richmond Hill—also had double-digit growth over the
period, once again among the fastest-growing cities in Canada, albeit at
a somewhat slower rate than in 2001–06. Among Canada’s largest cities,
Calgary and Edmonton led the way with growth above 11 per cent.
in all, fewer than half the cities grew faster than the Canadian
average of 5.9 per cent. And three cities lost population: Thunder
Bay, St. Catharines, and Windsor (which lost the most with a 2.6 per
cent drop in population). Small population increases of less than 2 per
cent occurred in a handful of cities in Ontario and Quebec, including
Montréal, Longueuil, Greater Sudbury, Saguenay, and Waterloo. it is
worth noting that while Saint John’s population growth was modest at
only 3 per cent over 2006–11, the city managed to reverse the trend of
declining population in 2001–06.

Find this and other Conference Board research at www.e-library.ca
CHAPTER 2
Methodology
Chapter Summary
• This report grades the attractiveness of 50 of Canada’s largest cities, selected not only by population size but also to make sure the core city of each census metropolitan area is included.
• Report card rankings of A–B–C–D are used to assess each city’s overall performance, its performance in each of seven categories, and its performance on a range of indicators within each category.
• Three overall rankings of each city’s attractiveness to migrants were calculated: one for migrants overall, a second for migrants with a university degree, and a third for migrants without a university degree.
• The interplay of the weights of the categories with the migration indicators gave us these three overall rankings, and allowed us to test whether the attractiveness of cities to migrants differs by level of education.

Chapter 2 | The Conference Board of Canada
Find this and other Conference Board research at www.e-library.ca 9
For almost two decades, the Conference Board has been ranking Canada’s performance on a wide range of socio-economic indicators in comparison with other peer countries. In 2007, City Magnets built on that tradition by comparing the performance of all 27 census metropolitan areas in Canada across seven categories: economy, innovation, environment, education, housing, health, and society. The over-arching goal of “a high and sustainable quality of life for all Canadians” provides the context to select specific indicators within these categories.
Drawing on the success of the very first City Magnets report, the
Conference Board created an expanded report card in 2010, grading
50 major Canadian cities. in City Magnets II: Benchmarking the
Attractiveness of Canada’s Cities, we adopted the methodology of
City Magnets by using the same seven categories, using a report card
ranking, and using the same formula to calculate grades. in this edition,
City Magnets III carries forward the methodology and city selection
process used in 2010. However, the indicators have been updated for the
current report—all gross domestic product indicators were re-estimated
using employment data based on place of work (as opposed to place
of residence), while full-time employment and occupations supporting
health care are new indicators.
City Selection
A key starting point for this benchmarking project was the decision
about which cities to include. The original intent was to include
Canada’s 50 largest cities, but that was modified to ensure that the
core city of each census metropolitan area, as defined and used by
Statistics Canada to conduct Canada’s census, was not omitted.

CiTy MAGnETS iiiBenchmarking the Attractiveness of 50 Canadian Cities
Find this and other Conference Board research at www.e-library.ca 10
For that reason, cities with larger populations were excluded in favour
of Guelph, Thunder Bay, St. John’s, Waterloo, Brantford, Victoria,
Peterborough, Saint John, and Moncton.
Indicator Selection
The search for indicators began with a commitment to find measures
that influence the location decisions of Canada’s migrants, be they
international, interprovincial, or intercity migrants. Using this as a
starting point, we set out to benchmark the attractiveness of Canada’s
cities using metropolitan boundaries according to Statistics Canada’s
classification of census subdivisions.
The indicators we selected were based on input from municipal officials
and had to meet the following criteria:
1. The indicator provides valuable information on the performance or status
of the particular category—either as a direct output (e.g., disposable
income) or proxy measure (e.g., number of physicians per capita as a
proxy for health care access).
2. The indicator data are consistent to ensure comparability among the
50 cities and to enable future time series analysis.
3. The data are reliable and have timely availability.
By far, the second criterion was the most limiting, as it ruled out the
possibility of using municipal own-source data and had the effect of
eliminating some key measures. For instance, it is widely recognized that
the availability of green space in a city can be a major draw for people
contemplating a move. However, there is no readily available consistent
source of information on the proportion of green space within cities for
all 50 census subdivisions. Furthermore, terms like green space, open
space, and recreational space are often used interchangeably, putting
a question mark on the reliability of survey data.

Chapter 2 | The Conference Board of Canada
Find this and other Conference Board research at www.e-library.ca 11
Rankings for Each Indicator
This study uses a report card–style ranking of A–B–C–D to assess
the performance of cities on each indicator. We assigned a grade level
to performance using the following method: For each indicator, we
calculated the difference between the top and bottom performer and
divided this figure by four. A city received a grade of “A” on a given
indicator if its score was in the top quartile, a “B” if its score was in the
second quartile, a “C” if its score was in the third quartile, and a “D” if
its score was in the bottom quartile.
For example, on the Society indicator that measures the proportion of
the population that is foreign-born, the top performer (Richmond) had
59.3 per cent of its population foreign-born in 2011 and the bottom
performer (Saguenay) had only 1.1 per cent. Applying the method for
scoring yields the following ranges for each grade:
• “A”: 59.3–43.3 per cent
• “B”: 43.2–28.5 per cent
• “C”: 28.4–13.7 per cent
• “D”: 13.6–1.1 per cent
(note: in this example, a high score indicates a high level of
performance. For indicators where a low score signifies a high level of
performance—such as the incidence of violent crime—the ranking levels
are reversed, i.e., the highest result receives the lower grade.)
it must be emphasized that two cities with “A” grades do not necessarily
perform equally according to this methodology. in the example above, a
city scoring 45 per cent would get an “A” grade in the same way that a
city scoring 55 per cent would. However, when we establish a ranking of
cities, the city scoring a 55 per cent would be placed higher than the one
scoring 45 per cent even if they both get an “A” grade.
CiTy MAGnETS iiiBenchmarking the Attractiveness of 50 Canadian Cities
Find this and other Conference Board research at www.e-library.ca 12
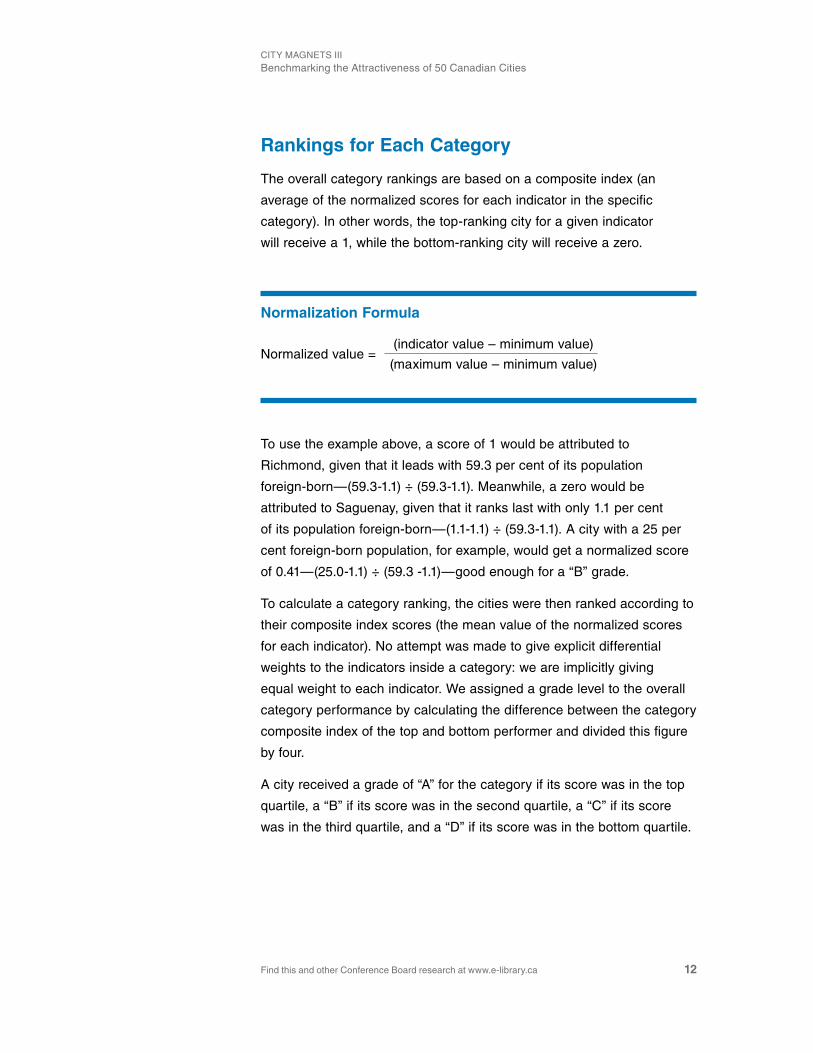
Rankings for Each Category
The overall category rankings are based on a composite index (an
average of the normalized scores for each indicator in the specific
category). in other words, the top-ranking city for a given indicator
will receive a 1, while the bottom-ranking city will receive a zero.
Normalization Formula
normalized value =(indicator value – minimum value)
(maximum value – minimum value)
To use the example above, a score of 1 would be attributed to
Richmond, given that it leads with 59.3 per cent of its population
foreign-born—(59.3-1.1) ÷ (59.3-1.1). Meanwhile, a zero would be
attributed to Saguenay, given that it ranks last with only 1.1 per cent
of its population foreign-born—(1.1-1.1) ÷ (59.3-1.1). A city with a 25 per
cent foreign-born population, for example, would get a normalized score
of 0.41—(25.0-1.1) ÷ (59.3 -1.1)—good enough for a “B” grade.
To calculate a category ranking, the cities were then ranked according to
their composite index scores (the mean value of the normalized scores
for each indicator). no attempt was made to give explicit differential
weights to the indicators inside a category: we are implicitly giving
equal weight to each indicator. We assigned a grade level to the overall
category performance by calculating the difference between the category
composite index of the top and bottom performer and divided this figure
by four.
A city received a grade of “A” for the category if its score was in the top
quartile, a “B” if its score was in the second quartile, a “C” if its score
was in the third quartile, and a “D” if its score was in the bottom quartile.

Chapter 2 | The Conference Board of Canada
Find this and other Conference Board research at www.e-library.ca 13
Overall Rankings
Overall scores were calculated for each city by taking a weighted value
of the normalized scores for all seven categories. The weights were
calculated with three additional indicators that were ranked using the
same methodology above: total number of migrants (international,
interprovincial, and intercity) per city population, total number of
migrants with a university education per city population, and total
number of migrants without a university education per city population.
We then conducted three ordinary least squares regressions where
the independent variables (the seven category rankings) remained the
same in each equation. Conversely, the dependant variable changed in
each equation, with the three migration indicators represented in each
regression equation.
This allowed us to estimate the relationship between these three
migration indicators and all seven categories, thereby creating estimated
coefficients for each category. We constrained these coefficients to
be non-negative and to sum to one. Thus, the constrained coefficients
gave us differential weights for each category. it is the interplay of these
weights with the migration indicators that gave us three different sets
of overall rankings, and allowed us to test whether the attractiveness
of cities to migrants differs by level of education.
For the three sets of rankings, we assigned a grade level to the overall
performance by calculating the difference between the overall score of
the top and bottom performers and dividing this figure by four. A city
received an overall grade of “A” if its score was in the top quartile, a
“B” if its score was in the second quartile, a “C” if its score was in the
third quartile, and a “D” if its score was in the bottom quartile.

Find this and other Conference Board research at www.e-library.ca
CHAPTER 3
Society
Chapter Summary
• Five of the seven cities with “A” grades in the Society category are big cities: Toronto, Montréal, and Vancouver lead the way with strong results on population diversity, people employed in cultural occupations, population density, non-automobile commuting, low incidence of drug crime, and access to libraries and museums.
• Toronto’s surrounding suburbs also rank high.
• Apart from their small size, “D” cities share the following traits: low levels of foreign-born population and diversity, low density, low levels of non-automobile commuting, and few residents in cultural occupations.

Chapter 3 | The Conference Board of Canada
Find this and other Conference Board research at www.e-library.ca 15
The Society category tries to capture diverse aspects of urban living that make a city a great place to live, work, and play: a place that’s good for raising families, that’s fun and exciting, and that’s full of opportunities. This is the most extensive category, with the largest number of indicators. (Table 3 at the end of this chapter describes each in more detail.) For the most part, each of the 14 indicators in this category relate to one of the four following attributes of a good urban society:
• accessibility (as measured by mode of travel, population density, access
to culture)
• diversity (as measured by foreign-born population, diversity mix, age
cohort, multilingualism)
• social cohesion (as measured by immigrant success, gender equality,
poverty, incidence of crime)
• creativity (as measured by cultural employment)
indicators within each broad theme tend to complement each other;
cities that do well on measures of density, for example, tend to be
cities with higher levels of walking, cycling, and transit use. Similarly,
cities with large foreign-born populations tend to do well on measures
of diversity and multilingualism (although not necessarily on measures
of immigrant success).
Overall, Canada’s largest cities perform best in the Society category, just
as they did in City Magnets ii. Five of the seven cities with “A” grades
are big cities, with Toronto and Montréal once again leading the way.
(See Table 2.) However, improved outcomes for a number of other cities
make Toronto and Montréal less dominant than they were in 2010, when
they were the only two to earn an “A” grade. Vancouver and Ottawa rank
third and fourth, while rounding out the complement of “A” cities are three
Toronto suburbs: Markham, Richmond Hill, and Brampton.

CiTy MAGnETS iiiBenchmarking the Attractiveness of 50 Canadian Cities
Find this and other Conference Board research at www.e-library.ca 16
Table 2Society Report Card
Rank City Grade Rank City Grade
1 Toronto A 26 Kingston B
2 Montréal A 27 Windsor B
3 Vancouver A 28 Oakville C
4 Ottawa A 29 Québec C
5 Markham A 30 Oshawa C
6 Richmond Hill A 31 Hamilton C
7 Brampton A 32 Regina C
8 Victoria B 33 Peterborough C
9 Burnaby B 34 Cambridge C
10 Mississauga B 35 Abbotsford C
11 Vaughan B 36 Saskatoon C
12 Edmonton B 37 Surrey C
13 Guelph B 38 Lévis C
14 Gatineau B 39 Brantford C
15 Longueuil B 40 Barrie C
16 Laval B 41 Sherbrooke C
17 Calgary B 42 St. John’s C
18 Kitchener B 43 Moncton C
19 Winnipeg B 44 Halifax C
20 Waterloo B 45 Thunder Bay D
21 Coquitlam B 46 Saguenay D
22 Richmond B 47 Kelowna D
23 St. Catharines B 48 Greater Sudbury D
24 Burlington B 49 Trois-Rivières D
25 London B 50 Saint John D
Source: The Conference Board of Canada.

Chapter 3 | The Conference Board of Canada
Find this and other Conference Board research at www.e-library.ca 17
Toronto, Montréal, and Vancouver earn “A” grades on half or more of the
indicators, sharing strong results on:
• population diversity
• people employed in cultural occupations
• population density
• non-automobile commuting
• low incidence of drug-related crimes
• access to museums and libraries
Each of the top three cities of course has its own strengths that
characterize its individual attractiveness. For Toronto, it is the city’s large
and vibrant foreign-born population—not only in sheer numbers but also
in the diversity represented by the many countries of origin of Toronto’s
newcomers. Toronto ranks first in diversity and, perhaps surprisingly,
only seventh in the proportion of the population that is foreign-born (at
47.9 per cent). Rather, it is the large suburbs of Toronto and Vancouver
that outrank Toronto and the other big cities on foreign-born population.
in five cities, more than half the population is foreign-born: Richmond
ranks the highest, at 59.3 per cent, followed by Markham, Richmond Hill,
Mississauga, and Brampton.
On other measures, Toronto distances itself from its suburbs with
much higher results on density, non-automobile travel to work, and
people employed in cultural occupations. For instance, 46 per cent of
Torontonians get to work by transit, cycling, or walking compared with
18.6 per cent of Mississauga residents and 13.7 per cent of Brampton
residents. On the other hand, all of the suburban cities in the Toronto
census metropolitan area have much lower levels of violent crime—
about half that of Toronto. in fact, they rank among the top eight cities
for low levels of violent crime in Canada.
Montréal ranks among the top five cities on half of the 14 indicators,
distinguishing itself in particular on multilingualism and gender
equality. nearly three-quarters of the population identify as multilingual
(74.5 per cent), compared with 54.2 per cent in Toronto and 54.1 per
cent in Vancouver. The three most multilingual cities are all in Quebec

CiTy MAGnETS iiiBenchmarking the Attractiveness of 50 Canadian Cities
Find this and other Conference Board research at www.e-library.ca 18
(Montréal, Laval, and Gatineau). not surprisingly, the cities outside
Quebec with large multilingual populations have a high proportion of
foreign-born residents: Richmond Hill, Markham, Richmond, Vaughan,
and Burnaby.
But one indicator in particular sets Montréal apart from Toronto and
Vancouver: gender inequality. Montréal ranks fifth, with university-
educated women earning 80.6 per cent of the income of their male
counterparts. While this is still far from parity, Montréal women are far
better off than their colleagues in Toronto and Vancouver, where the
comparable figure is just above 68 per cent. Worse still, in Calgary, that
income ratio plummets to just 55.8 per cent. When it comes to gender
inequality, six of the best cities for women are in Quebec, with Gatineau
leading them all (earnings of university-educated women are 83.3 per
cent of their male counterparts).
Finally, like Toronto, Montréal outperforms suburban cities when it comes
to sustainable choices for travelling to work. in fact, Montréal ranks first,
with the highest percentage of workers choosing to walk, cycle, or take
transit (at 47.9 per cent).
Vancouver, close behind Toronto and Montréal, is the “youngest” of the
top three cities, with 18.7 per cent of the population aged 25–34, and
the only one to earn an “A” grade on this indicator. Victoria, however,
tops them all with 19.6 per cent of the population in this young labour
force cohort. Vancouver has the highest density of all 50 cities, more
than 25 per cent denser than third-ranked Toronto and nearly four times
denser than Calgary. Like Toronto and Montréal, relatively high numbers
of Vancouverites commute to work by walking, cycling, or transit (46 per
cent, fractionally ahead of Toronto). Vancouver’s multicultural population
also contributes to its high ranking, although like Toronto, it falls slightly
behind two of its big suburbs, Richmond and Burnaby, on indicators for
multilingualism and diversity.
As with their strengths, Toronto, Montréal, and Vancouver share similar
vulnerabilities. in particular, they all have unacceptable levels of people
living in poverty; and the success of their considerable foreign-born
Montréal ranks fifth in gender inequality, with university-educated women earning 80.6 per cent of the income of their male counterparts.

Chapter 3 | The Conference Board of Canada
Find this and other Conference Board research at www.e-library.ca 19
populations is well below that of Canadian-born residents. Measured
by the number of people below Statistics Canada’s low income measure
(LiM), the percentage of Montrealers living in poverty exceeded 26 per
cent in 2011—the highest of all 50 cities surveyed. Vancouver, at
20.5 per cent ranks 44th; Toronto is 41st at 19.3 per cent. These figures
contrast sharply with the best cities, such as Burlington where 7.6 per
cent of the population had incomes below the poverty line. And this
cannot be “excused” as a big city problem; the incidence of poverty
in Calgary, Ottawa, and Edmonton is not even half that of Montréal.
nonetheless, for both Montréal and Toronto, suburban cities within
their respective census metropolitan areas reported much lower
levels of poverty. For example, Laval at 12.8 per cent is about half
that of Montréal; similarly, Oakville’s and Vaughan’s levels below
10 per cent are not quite half that of Toronto. in the Vancouver
region, both Richmond and Burnaby had even higher poverty
rates than Vancouver, putting them near the bottom of all 50 cities.
When it comes to immigrant success, we look at the average income
of university-educated immigrants compared with their Canadian-
born counterparts. Toronto, with an otherwise-enviable record on
multiculturalism, continues to have the worst results on immigrants’
economic success. in Toronto, well-educated immigrants earn only
61 per cent of the income of their Canadian-born counterparts; in
Montréal, the comparable figure is 66 per cent. Vancouver’s immigrants
are more successful, earning about 76 per cent of the income of their
counterparts. (Among these three, Vancouver is the only city where
immigrants do better than women when it comes to income parity.)
Suburban cities tend to show better results than their respective census
metropolitan area core cities, although the gap between Toronto and
most of its suburban cities is widest. Unlike Montréal and Toronto,
immigrants in Vancouver do better than their suburban counterparts.
Aside from Toronto, Montréal, and Vancouver, three of the four other
cities that get “A”s in the Society report card are part of the Toronto
census metropolitan area: Markham, Richmond Hill, and Brampton.
Like Toronto, they draw much of their strength from their vibrant

CiTy MAGnETS iiiBenchmarking the Attractiveness of 50 Canadian Cities
Find this and other Conference Board research at www.e-library.ca 20
multicultural and diverse communities. On measures of poverty, they are
more attractive than Toronto. But as mentioned, they falter on measures
related to density and commuting travel.
The other “A” city, with the fourth-best score, is Ottawa, which emerges
near the top of the Society report card on the strength of a balanced
set of results, highlighted by relatively low levels of poverty and crime,
evidence of strong multilingualism, relatively high levels of non-
automobile commuting, and growing diversity. Of the nine cities with
the best record on violent crime, Ottawa is the only one that is not a
suburban city; seven are within the Toronto census metropolitan area
and one is within the Québec City area. Ottawa’s success is marred by
its low density—the only indicator for which it gets a “D” grade. However,
at 2,790 square kilometres, Ottawa is the third-largest city among the
50 in this report—four times larger than Toronto—and includes
agricultural communities within its borders.
Of the 27 cities with “A” or “B” grades in the Society category, the
majority are big or mid-sized cities. However, 6 small cities emerge
from the shadows, with Victoria, eighth-highest overall, leading the
way. Guelph, Waterloo, Coquitlam, St. Catharines, and Kingston follow.
Victoria’s success portrays a somewhat atypical small city. Victoria led
all 50 cities on 3 of the 14 indicators: proportion of the population aged
25–34, proportion of the population employed in cultural occupations,
and travel time to museums. Furthermore, Victoria sets itself apart
from other small cities because of its density (only slightly greater
than Toronto’s) and its strong share of non-automobile travel to work.
With 47.4 per cent of the population walking, cycling, or taking transit
to work, Victoria is second only to Montréal, putting it ahead of
Vancouver and Toronto.
Of the six cities with “D” grades on the Society report card, five are
small (with a population below 150,000) and are found in four different
provinces: new Brunswick (Saint John), British Columbia (Kelowna),
Quebec (Trois-Rivières and Saguenay), and Ontario (Thunder Bay).
Greater Sudbury is the one mid-sized city with a “D” grade (still, at
160,000, at the small end of the mid-size range). Apart from their small
Victoria led all 50 cities on all 3 of the 14 indicators: population aged 25–34, population employed in cultural occupations, and travel time to museums.

Chapter 3 | The Conference Board of Canada
Find this and other Conference Board research at www.e-library.ca 21
size, these cities share the following traits: low levels of foreign-born
population and diversity, low density, low levels of non-automobile
commuting, and few residents in cultural occupations.
individually, each of the “D” cities has particular characteristics that
complete its make-up. in the case of Saint John (50th), the incidence of
violent crime is the highest among all 50 cities (more than double that
of Toronto and triple Calgary’s), further cementing its weak position.
Similarly, Kelowna is pulled down by high levels of violent crime (third-
worst) and drug crime (second-worst). Trois-Rivières also finds itself with
one of the highest rates of drug crime, just a little better than Kelowna.
On the other hand, Saguenay’s results present a paradox: it ranks last
on the indicators of foreign-born population and diversity, but it earns an
“A” grade on the success of its foreign-born population (second-highest
overall). Only 1.1 per cent of the population in Saguenay are foreign-
born, and they are succeeding in ways that would be envied by other
cities: university-educated newcomers are out-earning their Canadian-
born counterparts (15 per cent higher).
Greater Sudbury suffers from its size: the second largest city among the
50, at over 3,700 km2, it is six times larger than Toronto. not surprisingly,
Greater Sudbury emerges as the least dense of all cities; this, in turn,
contributes to its poor score on travel time to museums (twice as long as
the second-worst time reported in Barrie) and relatively weak outcomes
on travel time to libraries (third-highest).
Finally, Thunder Bay (the best of the “D” cities) is fairly representative of
the overall struggles of all “D” cities, with its worst result on the indicator
measuring travel time to libraries (still, only a 6.3-minute journey, but
longer than any that of any other city).
no discernible pattern emerges among the 17 “C” grade cities; they
come from seven different provinces and include cities across all size
ranges—from under 70,000 to over 500,000. Oakville and Québec
City are the best of this cluster, narrowly missing out on a “B” grade.
Oakville offers the advantages of being a safe city (second-lowest rate
of violent crime) where low income levels are well below average, at

CiTy MAGnETS iiiBenchmarking the Attractiveness of 50 Canadian Cities
Find this and other Conference Board research at www.e-library.ca 22
only 8.6 per cent (third-best overall). yet on another key measure of
inclusion, Oakville stumbles badly, with the worst record on gender
inequality—university-educated women earn just over half that of their
male counterparts. Québec City, with just 5.3 per cent of its population
foreign-born, loses ground on this same indicator and on diversity, where
it sits among the 4 least diverse cities in the survey—all of which are in
the province of Quebec.
Table 3Indicators of Performance in the Society Category
Indicator Definition MeaningBright spots (ranking)
Disappointments (ranking)
Population aged 25–34, 2011
This measures the proportion of the population between the ages of 25 and 34.
This young adult population represents the mobile and educated heart of the “creative class.” A city able to attract workers in this age range is better positioned for the future.
• Victoria (1)• Vancouver (2)• Edmonton (3)• Montréal (4)• Calgary (5)
• Oakville (50)• Richmond Hill (49)• Burlington (48)• St. Catharines (47)• Laval (46)
Foreign-born population, 2011
This is based on the proportion of the population in the city who are foreign-born.
immigrants are key to boosting Canada’s workforce in the future. Cities with a high proportion of foreign-born residents are ethnically diverse, tolerant, and therefore attractive to newcomers.
• Richmond (1)• Markham (2)• Richmond Hill (3)• Mississauga (4)• Brampton (5)
• Saguenay (50)• Lévis (49)• Trois-Rivières (48)• St. John’s (47)• Saint John (46)
Success of foreign-born population, 2011
A composite measure, this compares the average income of university-educated immigrants to that of Canadian-born residents, based on immigrants arriving in the five years between the 2006 Census and 2011 Census.
University-educated immigrants will seek jobs commensurate with their educational qualifications. A city with less disparity between immigrant and Canadian-born earners will have great advantages in attracting newcomers.
• St. John’s (1)• Saguenay (2)• Thunder Bay (3)• Halifax (4)• Peterborough (5)
• Toronto (50)• Richmond (49)• Surrey (48)• Longueuil (47)• Montréal (46)
Diversity of population, 2011
Using only first- and second-generation immigrant data, a formula was created to establish the ethnic composition of the population (adapted from the Shannon Diversity index).
This is meant to show the “diversity of diversity,” recognizing that it is important to attract large numbers of newcomers from many different cultures. A city with a wide variety of people from around the world ranks highest.
• Toronto (1)• Mississauga (2)• Richmond Hill (3)• Vaughan (4)• Oakville (5)
• Saguenay (50)• Lévis (49)• Trois-Rivières (48)• Québec City (47)• St. John’s (46)
Evidence of multilingualism, 2011
This is based on the proportion of the population with “knowledge of” a second language, defined by Statistics Canada as an individual’s ability to carry on a conversation.
More than just a measure of diversity, this indicator determines how proficient Canadians are in other languages. it can also be viewed as a “cultural” indicator, revealing the percentage of the population that is multilingual.
• Montréal (1)• Laval (2)• Gatineau (3)• Richmond Hill (4)• Markham (5)
• St. John’s (50)• Peterborough (49)• Brantford (48)• Barrie (47)• Oshawa (46)
(continued ...)

Chapter 3 | The Conference Board of Canada
Find this and other Conference Board research at www.e-library.ca 23
Table 3 (cont’d)Indicators of Performance in the Society Category
Indicator Definition MeaningBright spots (ranking)
Disappointments (ranking)
Population with low income, 2011
This measures the percentage of the population below the low income measure, established by Statistics Canada.
The indicator is a proxy for the incidence of poverty. The highest-scoring cities have the lowest incidence of people below the low income measure.
• Burlington (1)• Lévis (2)• Oakville (3)• Vaughan (4)• Waterloo (5)
• Montréal (50)• Windsor (49)• Richmond (48)• Saint John (47)
(only 4 cities with a “D” grade)
Gender equality, 2011
This shows the average income of university-educated females compared with their male counterparts, expressed as a percentage (100 per cent is best).
income distribution can be an important determinant for attracting people. The greater the income equality between men and women, the more attractive the city.
• Gatineau (1)• Sherbrooke (2)• Longueuil (3)• Lévis (4)• Montréal (5)
• Oakville (50)• Calgary (49)
(only 2 cities with a “D” grade)
Population density, 2011
This measures the number of people per square kilometre within the City.
This indicator is a proxy for urban sprawl. A denser city uses land more efficiently and makes service provision more cost-effective, particularly urban transit.
• Vancouver (1)• Montréal (2)• Toronto (3)• Victoria (4)
(only 4 cities earned “A” grades and none earned a “B”)
• Greater Sudbury (50)• Halifax (49)• Saguenay (48)• Saint John (47)• St. John’s (46)
Travel to work by public transit, walking, cycling, 2011
This measures the percentage of people who commute to work by transit, walking, or cycling (i.e., non-automobile).
A city with a high proportion of non-auto commuters is a more sustainable community. A city with access to good public transit, cycling routes, and pedestrian paths is more attractive.
• Montréal (1)• Victoria (2)• Vancouver (3)• Toronto (4)• Burnaby (5)
• Abbotsford (50)• Saguenay (49)• Cambridge (48)• Trois-Rivières (47)• Brantford (46)
Travel time to libraries, 2010
This measures the average travel time (in minutes) from home to the nearest library in the city, based on all modes of transportation.
This indicator is a proxy for access to culture within the City. A city with greater access is more attractive.
• Regina (1)• Saskatoon (2)• Guelph (3)• London (4)• Québec City (5)
• Thunder Bay (50)
(only 1 city with a “D” grade)
Travel time to museums, 2010
This measures the average travel time (in minutes) from home to museums within the city, based on all modes of transportation.
As with libraries, this indicator is a proxy for access to culture. A city with easier access is more attractive to potential newcomers.
• Victoria (1)• Peterborough (2)• Regina (3)• Oshawa (4)• Saskatoon (5)
• Greater Sudbury (50)
(only 1 city with a “D” grade)
Population employed in cultural occupations, 2011
Based on Statistics Canada, this shows the percentage of the employed work force in cultural occupations, such as writers, curators, artists, performers, and designers.
A city with a greater proportion of cultural workers is appealing to the creative class, and more broadly offers diversity and access to a wide range of associated cultural events.
• Victoria (1)• Toronto (2)• Vancouver (3)• Gatineau (4)• Montréal (5)
• Saint John (50)• Surrey (49)• Cambridge (48)• Oshawa (47)• Peterborough (46)
(continued ...)

CiTy MAGnETS iiiBenchmarking the Attractiveness of 50 Canadian Cities
Find this and other Conference Board research at www.e-library.ca 24
Table 3 (cont’d)Indicators of Performance in the Society Category
Indicator Definition MeaningBright spots (ranking)
Disappointments (ranking)
incidence of violent crime, 2012
This is based on the number of violent crimes per 100,000 people, including homicides, attempted murders, assaults, other sexual offences, abductions and robberies.
Cities with a low crime rate offer a safer environment and are more attractive to newcomers and domestic migrants.
• Burlington (1)• Oakville (2)• Markham (3)• Richmond Hill (4)• Vaughan (5)
• Saint John (50)• Victoria (49)• Kelowna (48)
(only 3 cities with a “D” grade)
incidence of drug crime, 2012
This is based on the number of drug-related crimes per 100,000, including possession, trafficking, importation, and production.
Drug-related crimes are generally viewed as some of the most serious and threatening crimes in a community. A low rate of criminal drug activity makes a city more desirable.
• Calgary (1)• Winnipeg (2)• Montréal (3)• Toronto (4)• St. Catharines (5)
• Victoria (50)• Kelowna (49)
(only 2 cities with a “D” grade)
Note: For each indicator, bright spots are the five top-ranked cities with at least a “B” grade. Disappointments are the five lowest-ranked cities with a “D” grade.Sources: The Conference Board of Canada; Statistics Canada.

Find this and other Conference Board research at www.e-library.ca
CHAPTER 4
Health
Chapter Summary
• Small and mid-sized cities emerge as the best places for good access to health care, likely due, in part, to the role of regional health services based in smaller cities that serve a broader community of people who live well beyond the city’s borders.
• Only Kingston and St. John’s earn an overall “A” grade, and only 3 big cities are counted among the 11 “B” grades (Québec City, Hamilton, and Vancouver). The other big cities get “C” grades overall.
• Suburban cities generally fare the worst: other than Toronto itself, all six of the cities within the Toronto census metropolitan area earn “D” grades.

CiTy MAGnETS iiiBenchmarking the Attractiveness of 50 Canadian Cities
Find this and other Conference Board research at www.e-library.ca 26
Access to health care is a highly valued characteristic of most attractive cities. This focus on health access in this study does not undermine the importance of sound health outcomes. However, relevant data on outcomes are typically available only for larger geographic units, such as census metropolitan areas. Therefore, the following five indicators are used in this edition of City Magnets to measure access to health care:
• number of hospital beds per 100,000 population
• number of general practitioners (GPs) per 100,000 population
• number of specialist physicians per 100,000 population
• proportion of population employed in health care services
• proportion of population employed in occupations supporting health care
The fifth indicator, proportion of population employed in occupations
supporting health care, is new to this edition of City Magnets. it takes
into account workers who are critical in ensuring quick and effective
access to health care, including firefighters, emergency medical
responders, etc. Table 5 describes each indicator in more detail, along
with a summary of the cities with highest and lowest results.
Just as in City Magnets II, small and mid-sized cities emerge as the
best places for good access to health care. (See Table 4.) Apart from
Halifax (fourth-best), the top eight cities have populations of less than
160,000. The performance of small cities is likely due, in part, to the role
of regional health services based in smaller cities that serve a broader
community of people who live well beyond the city’s borders. Despite
the pivotal role provinces play in funding and managing health care,
provincial trends are less easy to identify in the rankings. in fact, each
of the top six cities is in a different province: Ontario, newfoundland and
Labrador, Quebec, nova Scotia, British Columbia, and new Brunswick.

Chapter 4 | The Conference Board of Canada
Find this and other Conference Board research at www.e-library.ca 27
Table 4Health Report Card
Rank City Grade Rank City Grade
1 Kingston A 26 Barrie C
2 St. John’s A 27 Toronto C
3 Sherbrooke B 28 Windsor C
4 Halifax B 29 Burnaby C
5 Victoria B 30 Calgary C
6 Moncton B 31 Abbotsford D
7 Thunder Bay B 32 Oshawa D
8 Saint John B 33 Brantford D
9 Saskatoon B 34 Burlington D
10 London B 35 Coquitlam D
11 Québec City B 36 Surrey D
12 Hamilton B 37 Longueuil D
13 Vancouver B 38 Gatineau D
14 Winnipeg C 39 Laval D
15 Edmonton C 40 Oakville D
16 Kelowna C 41 Kitchener D
17 Peterborough C 42 Guelph D
18 Trois-Rivières C 43 Richmond Hill D
19 Saguenay C 44 Richmond D
20 Greater Sudbury C 45 Markham D
21 Lévis C 46 Mississauga D
22 Ottawa C 47 Cambridge D
23 Regina C 48 Waterloo D
24 Montréal C 49 Brampton D
25 St. Catharines C 50 Vaughan D
Source: The Conference Board of Canada.

CiTy MAGnETS iiiBenchmarking the Attractiveness of 50 Canadian Cities
Find this and other Conference Board research at www.e-library.ca 28
Overall, only Kingston and St. John’s score high enough to earn an
“A” grade, and only 3 big cities are counted among the 11 “B” grades
(Québec City, Hamilton, and Vancouver).
Kingston tops all cities on three of the five indicators, lifting it easily into
first place overall. Kingston claims the most general practitioners and
most specialists per 100,000 population, and has the highest percentage
of people employed in occupations that support health care. Second-
best St. John’s scores among the top four cities on the four original
indicators, but drops to the bottom third on the indicator measuring
occupations supporting health care. The presence of a medical
school at Queen’s University in Kingston and at Memorial University
in St. John’s no doubt provides a boost for these two small cities
when it comes to health care.
Canada’s two biggest cities, Toronto and Montréal, earn “C” grades,
positioned in the middle rank of the 50 cities, scoring well below
Kingston, the country’s leader. Calgary barely ekes out a “C” grade,
while Edmonton performs much better and just misses out on a “B.”
Canada’s largest cities (except Edmonton) typically show their best
results on the number of specialist physicians per 100,000 population,
scoring more highly than on the number of general practitioners.
Vancouver outscores Edmonton, Toronto, Montréal, and Calgary on
four of the five indicators, but falters when it comes to the proportion
of people employed in supporting health care. in this instance,
Edmonton and Calgary do better.
Suburban cities generally fare worse than the big cities dominating their
respective census metropolitan areas. All six of the suburban cities
within the Toronto area earn “D” grades, with Brampton and Vaughan
the weakest two cities of all. The “suburban factor” appears to be more
important than the “provincial factor,” notwithstanding the fact that these
“D” cities are all in Ontario.
Little has changed since City Magnets II in terms of the availability
of hospital beds in Canada’s cities. The best seven cities are all
small, with Victoria and Moncton offering the most number of beds
Suburban cities generally fare worse on health indicators than the big cities dominating their respective census metropolitan areas.

Chapter 4 | The Conference Board of Canada
Find this and other Conference Board research at www.e-library.ca 29
per 100,000 population, well ahead of every other city. Victoria, with
more than 1,200 beds per 100,000 people, has proportionately triple the
number of Vancouver, which ranks 13th overall. Victoria and Moncton are
so dominant that they are the only two cities to earn an “A” grade. And
the next group of four cities are the only ones with “B” grades for hospital
beds, pushing 44 cities into “C” and “D” territory. Saint John, St. John’s,
St. Catharines, and Thunder Bay make up the “B” cities—all small and
all serving a much wider regional population. Of the big Canadian cities,
Winnipeg and Vancouver do best, although as noted, offering far less
access to hospital beds than Victoria or Moncton. Edmonton, Toronto,
and Montréal are clustered in the middle, offering hospital beds in the
range of 320 to 301 per 100,000 people. Suburban municipalities find
themselves at the bottom of the list of cities. Despite having a hospital in
their community, they rely on nearby facilities in larger centres (Montréal,
Toronto, Vancouver, e.g.) for hospital access. Two cities are still without
hospitals: Vaughan and Waterloo, although residents in each of these
communities also have access to hospitals in nearby communities.
Kingston sets the bar high on access to physicians, both general
practitioners and specialists. Kingston stands alone as the only
“A” city for general practitioners; at 385 per 100,000, Kingston has
proportionately twice as many GPs as Québec City, the ninth-best
city, and three times as many as Regina (27th). Five other cities earn
“B” grades, with more than 210 GPs per 100,000: St. John’s is second-
best, followed by Vancouver, Sherbrooke, London, Saskatoon, and
Halifax. Apart from Vancouver, all other big cities earn “C” or “D” grades.
Looking at the number of specialist physicians per 100,000 people, the
top “GP cities” generally also score well on this indicator, led again by
Kingston (1st) and St. John’s (2nd). Although big cities generally do
better on the ratio of specialists than on the ratio of GPs, Vancouver is
the only big city to earn one of the four “A” grades (Sherbrooke is the
other “A” city). Toronto is 10th-best for specialists (15th for GPs) but
still has barely half the number of specialists per 100,000 people as
Kingston (180 vs. 357); Montréal has a similar profile. Winnipeg, 9th-best
Kingston sets the bar high on access to physicians, both general practitioners and specialists.

CiTy MAGnETS iiiBenchmarking the Attractiveness of 50 Canadian Cities
Find this and other Conference Board research at www.e-library.ca 30
for specialists, is one of the weakest big cities for GPs (27th) and, in
fact, offers its residents far more specialists than GPs (202 per 100,000
compared with 121).
Small cities across the country are the best places to live if access to
health care professionals is a top priority. Thunder Bay has the highest
proportion of people employed in health care services, followed by
Saint John, St. John’s, Sherbrooke, and Peterborough. Of the 10 “A”
cities, only 1, Saskatoon, has a population greater than 200,000.
At the bottom of the list, 11 the 12 cities that earn “D” grades are all in
southern Ontario, including Toronto and the 6 cities within the Toronto
census metropolitan area. (Richmond is the non-Ontario city with a
“D” and, in fact, does a little better than the other 11.) Waterloo (50) has
proportionately only half the number of people employed in health care
services as top-ranked Thunder Bay (2.6 per cent vs. 5.8 per cent).
Finally, when taking into account occupations that support health care,
we see that Kingston strengthens its commanding lead on access to
health care. Once again, Kingston leads all 50 cities, just ahead of
Halifax. no discernible pattern emerges here; of the four “A” cities,
Kingston and Trois-Rivières are small, Halifax is mid-sized, and Québec
City is big. And they represent three different provinces. On the other
hand, the cities that fare worst are generally the same cities with poor
results on employment in health care services occupations—in other
words, Toronto and the other six cities within its census metropolitan
area, together with Waterloo and Richmond. in addition, Vancouver
earns its only “D” grade in the Health category on this indicator.

Chapter 4 | The Conference Board of Canada
Find this and other Conference Board research at www.e-library.ca 31
Table 5Indicators of Performance in the Health Category
Indicator Definition MeaningBright spots (ranking)
Disappointments (ranking)
Hospital bed availability, 2012
This measures the number of hospital beds per 100,000 people in the city.
This indicator is a measure of availability of and access to hospital care. A city with a proportionately greater number of beds is more attractive.
• Victoria (1)• Moncton (2)• Saint John (3)• St. John’s (4)• St. Catharines (5)
• Waterloo (50)• Vaughan (50)• Markham (48)• Surrey (47)• Cambridge (46)
Access to general practitioners, 2011
This indicator shows the number of general practitioners per 100,000 people living in the city.
The availability of GPs is a common proxy for access to health care. A city with more family doctors per population is more attractive for newcomers.
• Kingston (1)• St. John’s (2)• Vancouver (3)• Sherbrooke (4)• London (5)
• Oshawa (50)• Brampton (49)• Brantford (48)• Surrey (47)• Richmond (46)
Access to specialist physicians, 2011
This indicator shows the number of specialist physicians (including surgeons, e.g.) per 100,000 people living in the city.
Similar to the indicator for GPs, the greater the proportion of specialists, the more attractive the city will be to newcomers.
• Kingston (1)• St. John’s (2)• Sherbrooke (3)• Vancouver (4)• Halifax (5)
• Brampton(50)• Cambridge (49)• Oshawa (48)• Kitchener (47)• Abbotsford (46)
Population employed in health care services, 2011
This indicator measures the percentage of employed people working in any health-related service (e.g., nurses, ambulance drivers, emergency medical technicians) per 100,000 people living in the city.
This is another indicator of health care availability and access. A greater number of health care workers indicates better potential access, and adds to the city’s attractiveness.
• Thunder Bay (1)• Saint John ( 2)• St. John’s (3)• Sherbrooke (4)• Peterborough (5)
• Waterloo (50)• Vaughan (49)• Oakville (48)• Cambridge (47)• Guelph (46)
Population employed in occupations supporting health care, 2011
This indicator measures the percentage of employed people working in occupations that support health services, such as emergency medical responders, nurse aides, firefighters, and police officers (excluding commissioned police officers).
This is another indicator of access to health care services, considered in a broader context. A greater number of workers supporting health services indicates better and more efficient access.
• Kingston (1)• Halifax (2)• Québec City (3)• Trois-Rivières (4)• Sherbrooke (5)
• Richmond Hill (50)• Vaughan (49)• Markham (48)• Oakville (47)• Waterloo (46)
Note: For each indicator, bright spots are the five top-ranked cities with at least a “B” grade. Disappointments are the five lowest-ranked cities with a “D” grade.Sources: The Conference Board of Canada; Statistics Canada.

Find this and other Conference Board research at www.e-library.ca
CHAPTER 5
Economy
Chapter Summary
• Cities in the West are among the top performers in the Economy category, thanks to the booming resource-based economies in Alberta and Saskatchewan.
• Overall results reveal solid economies for half of the 50 cities, earning “A” or “B” grades.
• Only five cities get a “D” grade; four are in Ontario, struggling to recover post-recession and highlighting the difficulties associated with automobile manufacturing and forestry.
• Four big cities generally perform well on the employment indicators (Calgary, Ottawa, Vancouver, and Edmonton), but Toronto and Montréal do not (apart from knowledge workers).

Chapter 5 | The Conference Board of Canada
Find this and other Conference Board research at www.e-library.ca 33
No one disputes the importance of local economic factors to a city’s attractiveness; for many, they are the main draw. After all, a city with a strong economy promises opportunity, jobs, and good incomes. In recognizing the importance of urban economies to residents and employers, the Conference Board has been tracking the economy of Canada’s census metropolitan areas in its Metropolitan Outlook series, published quarterly, since 1998. Furthermore, as study after study has shown, economically robust cities are not only vital to local communities but are important to provincial and national economies.
in this edition of City Magnets, the Conference Board uses
eight indicators to assess the attractiveness to migrants of a city’s
economy, including one new indicator to deepen our understanding of
these 50 urban economies. The indicators rely on a mix of standard
(indicators 1 through 6) and innovative measures (7 to 8):
1. GDP per capita
2. GDP growth
3. employment growth
4. unemployment rate
5. full-time employment (new)
6. disposable income per capita
7. knowledge employment (jobs that are key to a successful, modern city)
8. proportion of workforce commuting outside the city

CiTy MAGnETS iiiBenchmarking the Attractiveness of 50 Canadian Cities
Find this and other Conference Board research at www.e-library.ca 34
Table 8, at the end of this chapter, describes each indicator in
more detail along with a summary of the cities with highest and
lowest outcomes.
As with the other categories, economic data is based on the 2011
Census and national Household Survey, allowing us to examine these
economies in the post-recession recovery period. not surprisingly,
cities in the West are among the top performers, thanks to the booming
resource-based economies in Alberta and Saskatchewan. Overall
results reveal solid economies for half of the 50 cities, earning “A” or
“B” grades. (See Table 6.) Only five cities get a “D” grade; four are in
Ontario, struggling to recover post-recession. For example, Oshawa
(49th) and Windsor (50th) are two cities dependent on the automobile
manufacturing sector.
Calgary leads the western juggernaut, with Regina (4th) and Edmonton
(6th) close behind. St. John’s, another city benefiting from the resource
sector, claims 5th place. Ottawa, with high incomes and sizable
knowledge-based workforce is 2nd-best, and Waterloo, on the strength
of its knowledge economy, is 3rd. Of course, since data was collected
for the 2011 Census and national Household Survey, both Waterloo and
Ottawa have faced and continue to face big job cuts. This would suggest
a likely realignment at the top when more recent data are available. For
now, four of the nine “A” cities are big cities (Québec City is 9th). This
contrasts with City Magnets II, when Calgary and Edmonton were the
only 2 big cities within the cluster of 11 “A” and “B” cities.
Calgary is the only city with no “C” or “D” grades, displaying strength
across all eight economic indicators. its best results are on disposable
income per capita, GDP per capita, and low proportion of the workforce
travelling outside the city for employment. in the case of the latter,
Calgary’s success in providing work opportunities for its residents is not
surprising, given that the city accounts for more than 90 per cent of the
Calgary census metropolitan area. For Ottawa, its top-five rankings on
disposable income per capita and knowledge employment lift it to the top
of the pack. However, Ottawa also benefits from a solid GDP per capita
ranking. in Waterloo, success comes from its number-one ranking on
Calgary is the only city with no “C” or “D” grades, displaying strength across all eight economic indicators.

Chapter 5 | The Conference Board of Canada
Find this and other Conference Board research at www.e-library.ca 35
Table 6Economy Report Card
Rank City Grade Rank City Grade
1 Calgary A 26 Kelowna C
2 Ottawa A 27 London C
3 Waterloo A 28 Sherbrooke C
4 Regina A 29 Greater Sudbury C
5 St. John’s A 30 Markham C
6 Edmonton A 31 Burnaby C
7 Saskatoon A 32 Richmond C
8 Oakville A 33 Barrie C
9 Québec City B 34 Peterborough C
10 Gatineau B 35 Surrey C
11 Halifax B 36 Montréal C
12 Moncton B 37 Kitchener C
13 Richmond Hill B 38 Laval C
14 Vancouver B 39 Thunder Bay C
15 Toronto B 40 Abbotsford C
16 Burlington B 41 Trois-Rivières C
17 Lévis B 42 Brampton C
18 Winnipeg B 43 Brantford C
19 Vaughan B 44 Hamilton C
20 Kingston B 45 Longueuil C
21 Guelph B 46 Cambridge D
22 Mississauga B 47 Coquitlam D
23 Saint John B 48 St. Catharines D
24 Saguenay B 49 Oshawa D
25 Victoria B 50 Windsor D
Source: The Conference Board of Canada.

CiTy MAGnETS iiiBenchmarking the Attractiveness of 50 Canadian Cities
Find this and other Conference Board research at www.e-library.ca 36
knowledge employment and second-best on employment growth. On
three other indicators, Waterloo is among the five best cities. Regina, our
fourth-best “A” city, claims the most “A” grades of all on the Economy,
including leading the country on GDP growth. However, Regina’s
three “C” grades on other economic indicators offset the otherwise
stellar results.
Taking a closer look at per capita GDP, four of the six top-ranked cities
are small: Victoria, St. John’s, Moncton, and Waterloo. Calgary and
Edmonton join this group of “A” cities in 3rd and 6th place respectively.
Per capita GDP in Victoria is highest of all. At $68,383, it is not only
well above the average for Canada, it is at least double that of 17 other
cities, including, for example, Hamilton, Richmond Hill, Kitchener, and
Gatineau. More than one-third of all cities earn a “D” grade for GDP per
capita, with some of the suburban cities around Vancouver, Montréal,
and Toronto posting the lowest results.
Waterloo is the only city with a top-five result for both per capita GDP
and GDP growth, but in each case, it was outperformed at the top.
Regina’s 4.2 per cent average annual GDP growth between 2007
and 2011 was the highest, followed closely by Surrey and Saskatoon.
Edmonton has the highest GDP growth rate of all big cities—the only
one to earn an “A” grade. The more dramatic story comes at the bottom,
where eight cities had zero or negative growth. All but one (Victoria) are
in Ontario, highlighting the difficulties associated with manufacturing,
auto-making, and forestry (particularly in Thunder Bay). Windsor fared
worst of all, experiencing an average drop in GDP of 2.5 per cent each
year in 2007–2011.
The suburban-urban relationship, often cited in this report, comes
into sharp focus on the indicator reporting on workforce commuting.
Residents of suburban cities are more likely to have to travel outside
their cities for work. in general, cities with a lower percentage of
residents working outside their boundaries are more attractive
because fewer people must leave the city to find work.
Eight cities (seven in Ontario) had zero negative growth, highlighting the difficulties associated with manufacturing, auto-making, and forestry.

Chapter 5 | The Conference Board of Canada
Find this and other Conference Board research at www.e-library.ca 37
This indicator is also affected by an area’s political boundaries—that is,
whether or not an area’s core city dominates its census metropolitan
area. Specifically, the proportion of the workforce travelling outside the
city for work is inversely correlated with the size of the city relative to
its census metropolitan area (generally, but not perfectly—the proximity
of census metropolitan areas within the Greater Toronto and Hamilton
area leads to a lot of commuting between them). Table 7 illustrates this.
Halifax, the city that not only dominates but consumes the entire census
metropolitan area, has the smallest share of its workforce commuting
outside the city, just 4 per cent. The best four cities follow a similar
pattern. On the other hand, smaller suburbs that make up only a small
portion of a larger census metropolitan area have a greater share of their
population leaving the city to work. For instance, looking at the bottom,
Richmond Hill, which makes up only 3.3 per cent of the Toronto census
metropolitan area, has over 77 per cent of its workforce commuting
beyond its borders—the highest of all 50 cities.
Table 7Residents of Suburban Cities More Likely to Commute Outside Their City to Work(per cent)
City
City population’s share of wider census metropolitan
area populationProportion of the workforce commuting outside the city
Halifax 99.9 4.0
Calgary 90.3 4.2
Winnipeg 90.9 4.2
Greater Sudbury 99.7 4.5
Markham 5.4 69.4
Coquitlam 5.5 76.5
Richmond Hill 3.3 77.1
Sources: The Conference Board of Canada; Statistics Canada.

CiTy MAGnETS iiiBenchmarking the Attractiveness of 50 Canadian Cities
Find this and other Conference Board research at www.e-library.ca 38
Four indicators contribute to our understanding of employment trends:
employment growth, unemployment rate, full-time employment, and
knowledge employment. no one city or region dominates across all
four indicators; five provinces are represented among the “A” cities
on at least one of these four indicators. Four big cities generally
perform well on these markers of employment (Calgary, Ottawa,
Vancouver, and Edmonton), but Toronto and Montréal do not (apart
from knowledge workers).
However, one city stands out for achieving two “A” grades on
employment. Lévis, a suburb of Québec City, had the lowest
unemployment rate and the sixth-best employment growth. Lévis also
ranked eighth on real GDP growth. in each case, Lévis outperforms
Québec City, the dominant city within the census metropolitan area.
Lévis’s success comes from the public sector, as significant gains in
health, education, and government employment put it near the top of
the rankings. yet Lévis finds itself in the middle of the pack (lagging
Québec City) on knowledge employment—a field dominated by a
handful of cities led by Waterloo and Ottawa.
Two other cities show strong employment-related results: Richmond Hill
and Calgary. They are the only cities to earn at least two “A” and no “C”
or “D” grades. Richmond Hill’s success mirrors that of suburban Lévis
by being more successful than its dominant census metropolitan city,
Toronto, but in Richmond Hill’s case, it succeeds by a very wide margin
on three of the four indicators: employment growth, unemployment
rate, and full-time employment (where Toronto is second-lowest of
all). Richmond Hill is particularly strong on knowledge-economy
employment—no doubt a contributing factor to its solid employment
growth. Finally, although Calgary is not among the top five leaders on
any of the employment indicators, its posts a suite of solid employment
results across the board—the largest city to do so.
Although many cities show signs of employment struggles, four
Ontario cities show signs of persistent distress. Cambridge, Oshawa,
St. Catharines, and Windsor each have at least three “D” grades.
Employment fell in all four of these cities between 2007 and 2011,
Many cities show signs of employment struggles but four Ontario cities show signs of persistent distress: Cambridge, Oshawa, St. Catharines, Windsor.

Chapter 5 | The Conference Board of Canada
Find this and other Conference Board research at www.e-library.ca 39
causing high unemployment rates. As cities with solid manufacturing
ties, none of the four have a strong base of knowledge employment.
However, Oshawa, which is highly dependent on the automotive sector,
distinguishes itself with a rate of full-time employment of 61.8 per cent,
thanks to strong union participation. Of the other three communities
that are highly dependent on the automotive sector (Cambridge, St.
Catharines, and Windsor), St. Catharines and Windsor had a greater
share of part-time employment than Oshawa.
A closer look at full-time employment uncovers an interesting group of
new leaders; only three of the eight “A” cities show strong results on
other employment indicators—Ottawa, Richmond Hill, and Burlington.
And Ottawa is the only one among these eight to earn an “A” grade
overall on the Economy. Saint John leads all cities on full-time
employment, with 65.4 per cent of the resident workforce in full-time
employment, yet it had 0.5 per cent annual average employment
growth and an unemployment rate of 9.7% (well above top-ranked Lévis
at 4 per cent). interestingly, most provincial capitals rank high on the full-
time employment indicator, no doubt from a larger presence of unionized
public sector employees. The same can be said for the large number of
full-time workers in the Ottawa and Gatineau area. nevertheless, Victoria
(53.2 per cent) has the second-lowest level of full-time employment after
Abbotsford (53.7 per cent) and shows weaknesses on other employment
indicators. The B.C. government recently eliminated numerous full-time
positions in Victoria, leading to the city’s increased reliance on part-time
work. And nearly 6 per cent of Abbotsford’s workforce is employed in
the agricultural sector (by far the largest of the 50 cities), which tends
to employ more part-time and seasonal workers.
The remaining indicator, disposable income per capita, is of course
related to employment factors. So it is no surprise to see Calgary
(2nd), Ottawa (4th), Waterloo (5th), and Edmonton (6th) among the
top six cities. However, the highest disposable per capita incomes are
found in suburban Oakville, at just under $50,000. Torontonians, along
with residents in two other suburbs within the census metropolitan area
(Vaughan and Richmond Hill), are among the top 10 income earners.

CiTy MAGnETS iiiBenchmarking the Attractiveness of 50 Canadian Cities
Find this and other Conference Board research at www.e-library.ca 40
incomes in Calgary are close enough to those in Oakville to merit an “A”
grade; beyond that, the next four cities make up the total inventory of “B”
cities. More than half the cities have “D” grades, and 31 cities fall below
the Canadian average of $33,998. Four of the five cities with the lowest
incomes are in Québec City, including Montréal; the fifth is Saint John.
Table 8Indicators of Performance in the Economy Category
Indicator Definition MeaningBright spots (ranking)
Disappointments (ranking)
GDP per capita, 2011
GDP measures the overall value of goods and services produced in the city. GDP is divided by total population to get GDP per capita.
GDP is the broadest measure of aggregate economic activity. This is commonly used to compare relative wealth between cities.
• Victoria (1)• St. John’s (2)• Calgary (3)• Moncton (4)• Waterloo (5)
• Coquitlam (50)• Surrey (49)• Richmond Hill (48)• Laval (47)• Brampton (46)
GDP growth, 2007–11
GDP growth is the average annual increase in GDP over the five years between 2007 and 2011.
A city with stronger GDP growth generates more employment opportunities, making it more attractive to people.
• Regina (1)• Surrey (2)• Saskatoon (3)• Waterloo (4)• Gatineau (5)
• Windsor (50)• St. Catharines (49)• Oshawa (48)• Cambridge (47)• Thunder Bay (46)
Employment growth, 2007–11
Percentage increases in total employment are calculated for 2007 to 2011.
Strong employment growth means more opportunities for work, making a city more attractive.
• Surrey (1)• Waterloo (2)• Richmond Hill (3)• Gatineau (4)• Saskatoon (5)
• Windsor (50)• St. Catharines (49)• Oshawa (48)• Cambridge (47)• Thunder Bay (46)
Unemployment rate, 2011
This measures the percentage of the labour market without a job.
A city with a lower unemployment rate has a more engaged workforce and therefore is more attractive to migrants.
• Lévis (1)• Québec City (2)• Regina (3)• Gatineau (4)• Saskatoon (5)
• Windsor (50)• Oshawa (48)
(only 2 cities with a “D” grade)
Disposable income per capita, 2011
Average after-tax income is divided by total population.
A city with high average incomes will attract more people, both domestic and international migrants.
• Oakville (1)• Calgary (2)• Burlington (3)• Ottawa (4)• Waterloo (5)
• Trois-Rivières (50)• Montréal (49)• Sherbrooke (48)• Saint John (47)• Longueuil (46)
Full-time employment, 2011
This measures the percentage of employed persons in a city in full-time positions, i.e., people who usually worked 30 hours or more per week, at their main or only job.
Cities with more full-time employment are more attractive, particularly to highly mobile and global workforce.
• Saint John (1)• St. John’s (2)• Halifax (3)• Richmond Hill (4)• Vaughan (5)
• Victoria (50)• Abbotsford (49)• Kelowna (48)• Sherbrooke (47)• Montréal (46)
(contiued...)
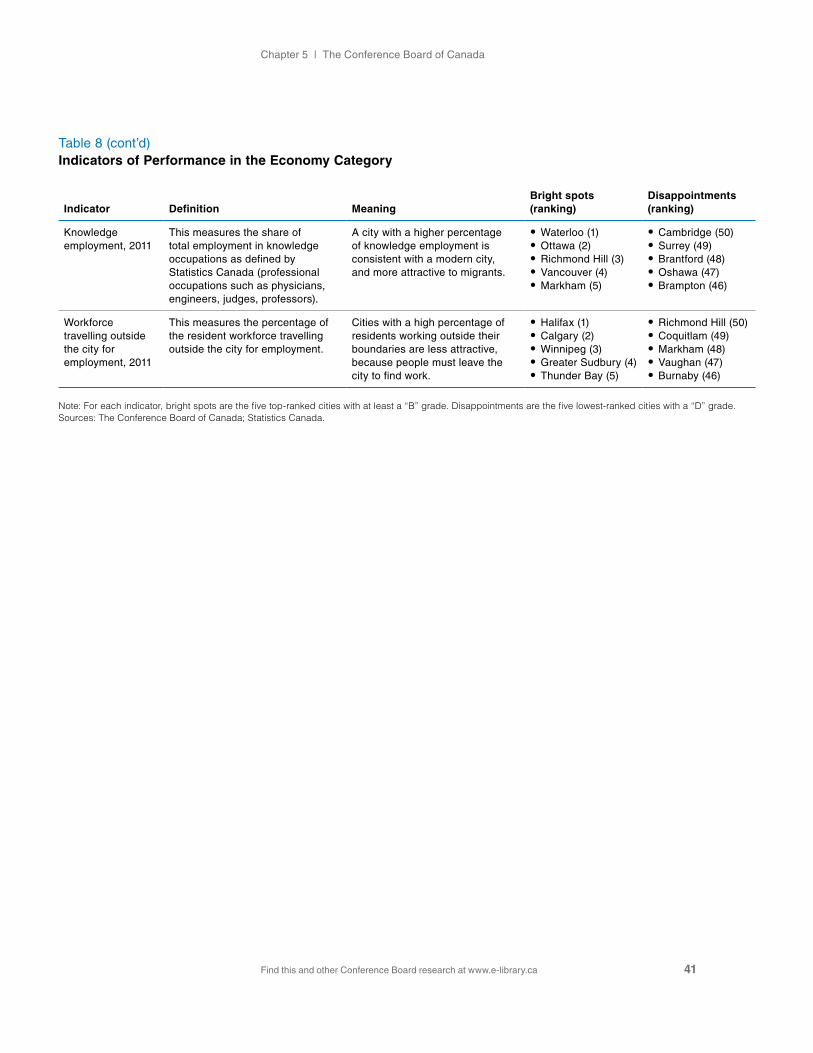
Chapter 5 | The Conference Board of Canada
Find this and other Conference Board research at www.e-library.ca 41
Table 8 (cont’d)Indicators of Performance in the Economy Category
Indicator Definition MeaningBright spots (ranking)
Disappointments (ranking)
Knowledge employment, 2011
This measures the share of total employment in knowledge occupations as defined by Statistics Canada (professional occupations such as physicians, engineers, judges, professors).
A city with a higher percentage of knowledge employment is consistent with a modern city, and more attractive to migrants.
• Waterloo (1)• Ottawa (2)• Richmond Hill (3)• Vancouver (4)• Markham (5)
• Cambridge (50)• Surrey (49)• Brantford (48)• Oshawa (47)• Brampton (46)
Workforce travelling outside the city for employment, 2011
This measures the percentage of the resident workforce travelling outside the city for employment.
Cities with a high percentage of residents working outside their boundaries are less attractive, because people must leave the city to find work.
• Halifax (1)• Calgary (2)• Winnipeg (3)• Greater Sudbury (4)• Thunder Bay (5)
• Richmond Hill (50)• Coquitlam (49)• Markham (48)• Vaughan (47)• Burnaby (46)
Note: For each indicator, bright spots are the five top-ranked cities with at least a “B” grade. Disappointments are the five lowest-ranked cities with a “D” grade.Sources: The Conference Board of Canada; Statistics Canada.

Find this and other Conference Board research at www.e-library.ca
CHAPTER 6
Environment
Chapter Summary
• Cities in British Columbia dominate the top of the Environment report card, accounting for half of the top 10 cities, thanks to mild weather and good air quality.
• Montréal, Toronto, and their respective suburbs have too many air quality advisory days and long solo commutes to work.
• The top five cities with the shortest solo commutes are where residents drive to work in overwhelming numbers.
• Although 15 cities earn “A” grades for water use, Richmond Hill stands out above the rest with per capita domestic water use that’s four times less than the worst city, Saint John.

Chapter 6 | The Conference Board of Canada
Find this and other Conference Board research at www.e-library.ca 43
Canadians are increasingly aware of the importance of environmental stewardship, as climate change continues to affect daily living in dramatic and sometimes tragic ways. Extreme weather events are on the rise. Flooding in Calgary and ice storms in southern Ontario and Quebec affected millions of Canadians in 2013–14. The Insurance Bureau of Canada recorded 2013 as the year with the highest levels of insured losses, valued at $3.2 billion.1
With local governments responsible directly or indirectly for 44 per cent
of total greenhouse gas emissions, it is no wonder that cities seek ways
to monitor the environment within their communities.2 in this report, we
use four indicators of environmental health and quality of life that affect
a city’s attractiveness:
• average monthly maximum temperature
• domestic water use, based on per capita household flow
• number of days under Environment Canada’s air quality advisory
• median driving distance to work for solo commuters
Table 10 describes each indicator in more detail at the end of
this chapter, along with a summary of the cities with highest and
lowest outcomes.
Cities in British Columbia dominate the top of the field, accounting
for half of the top 10 cities. (See Table 9.) Led by Victoria, the cities
of Abbotsford (2nd), Kelowna (3rd), and Coquitlam (4th) are close
behind; Surrey is 8th-best. interrupting the chain of five B.C cities are
the cities of Moncton, Regina, and St. John’s. At the other end of the
spectrum, Montréal and its suburbs (Longueuil, Laval) have three of
1 insurance Bureau of Canada, Canada Inundated by Severe Weather in 2013.
2 Partners for Climate Protection, National Measures Report 2012, 1.

CiTy MAGnETS iiiBenchmarking the Attractiveness of 50 Canadian Cities
Find this and other Conference Board research at www.e-library.ca 44
Table 9Environment Report Card
Rank City Grade Rank City Grade
1 Victoria A 26 Guelph B
2 Abbotsford A 27 Burnaby B
3 Kelowna A 28 Ottawa B
4 Coquitlam A 29 Richmond Hill B
5 Moncton A 30 Kingston B
6 Regina A 31 Cambridge B
7 St. John’s A 32 Lévis B
8 Surrey A 33 Greater Sudbury B
9 Sherbrooke A 34 Edmonton B
10 St. Catharines A 35 Gatineau B
11 Brantford A 36 Calgary B
12 Vancouver A 37 Hamilton B
13 Barrie A 38 Markham C
14 London A 39 Québec City C
15 Saskatoon A 40 Brampton C
16 Richmond B 41 Burlington C
17 Halifax B 42 Saguenay C
18 Thunder Bay B 43 Oakville C
19 Trois-Rivières B 44 Toronto C
20 Windsor B 45 Laval C
21 Winnipeg B 46 Mississauga C
22 Peterborough B 47 Vaughan C
23 Oshawa B 48 Longueuil C
24 Kitchener B 49 Saint John C
25 Waterloo B 50 Montréal D
Source: The Conference Board of Canada.

Chapter 6 | The Conference Board of Canada
Find this and other Conference Board research at www.e-library.ca 45
the six worst results on the environment. Montréal (50th) is the only
city with a “D” grade. not much better off, Toronto and the suburbs of
Oakville, Mississauga, and Vaughan find themselves among the bottom
seven cities. What these cities have in common are too many air quality
advisories and a long solo commute to work.
naturally, everyone jumps to climate as a key factor binding the top B.C.
cities, but mild weather alone doesn’t account for these strong results.
All of the cities in B.C. enjoy good air quality, with Victoria having a
perfect record: no air quality advisories were issued during the eight
years spanning 2004 to 2011. in this, Victoria is joined by five other
cities: Regina, Saskatoon, St. John’s, Thunder Bay, and Winnipeg.
Among cities in B.C., Vancouver and three of its suburbs had the
most advisories but still averaged only 4.1 days over the period. By
contrast, Montréal has the worst record, with an average of 24.5 air
quality advisory days—the only city with more than 20. All of the cities
with “C” or “D” grades are in Ontario and Quebec, lying within Canada’s
manufacturing heartland and upwind from the industries of the northern
and mid-western United States.
The dominance of B.C cities ends when it comes to domestic water
use. All six cities in the Lower Mainland plus Victoria rank in the
bottom quartile; only Kelowna is in the top half. Although 15 cities earn
“A” grades, Richmond Hill stands out above the rest. Per capita domestic
water use averages only 122 litres per day, less than half the rate of
Toronto and 29 other cities. in Saint John—the biggest water user—per
capita daily domestic water usage exceeds 560 litres. This is a city
where a mix of flat-rate pricing and metering contributes to high water
consumption. Saguenay is the only other city with a “D” grade.
The fourth and final indicator in the environment category looks at solo
commuting in each city, reporting on the median driving distances to
work. Commuters in the “A” cities travel fewer than 7 kilometres to work
and typically live in small or mid-sized cities. Brantford leads the way
with a 5-kilometre trip, closely followed by Regina and Thunder Bay.
The big city with the best result is Winnipeg (still only 22nd), with a
median solo commute of 7.2 kilometres. All of the top five cities with
Richmond Hill has the lowest per capita domestic water use, averaging only 122 litres per day, less than half the rate of Toronto and 29 other cities.

CiTy MAGnETS iiiBenchmarking the Attractiveness of 50 Canadian Cities
Find this and other Conference Board research at www.e-library.ca 46
the shortest solo commutes are cities where residents drive to work
in overwhelming numbers. in the five cities with the shortest solo
commutes, about 90 per cent of workers travel by car (an indicator
in the Society category). Only one city captures an “A” grade on both
indicators: Victoria. More than 47 per cent of Victoria’s residents travel to
work by walking, cycling, or transit; for those who drive, the commuting
distance to work is about 5.6 kilometres (7th best of all 50 cities).
Table 10Indicators of Performance in the Environment Category
Indicator Definition MeaningBright spots (ranking)
Disappointments (ranking)
Average maximum temperature, 1991–2010
This indicator is based on the maximum temperature reading recorded monthly by Environment Canada. This measures the average of those 12 readings each year.
A mild climate is generally viewed as “better weather.” in Canada, this will of course mean that a city with warmer average temperatures is more attractive.
• Richmond (1)• Surrey (2)• Abbotsford (3)• Vancouver (4)• Coquitlam (5)
• Saskatoon (50 )• Edmonton (49)• Thunder Bay (48)• Saguenay (47)• Winnipeg (46)
Domestic water use, 2004
This measures water use in households, based on per capita average daily water flow in litres for each city.
This indicator deals with domestic use only, and does not take into account local pricing or other policies affecting usage. A city where water use is low is using this resource more efficiently and sustainably, and will rank highest.
• Richmond Hill (1)• Ottawa (2)• St. John’s (3)• Regina (4)• Sherbrooke (5)
• Saint John (50)• Saguenay (49)
(only 2 cities get a “D” grade)
Air quality advisory days, 2004–11
This indicator shows the number of days under an air quality advisory for each city. These advisories are issued by provincial governments, and the number of days per year are averaged over the eight-year period.
Air quality is an important factor in a city’s attractiveness. Poor air quality can have serious repercussions on the health of the population, stifle economic growth, and ruin the city’s overall aesthetics. Therefore, fewer days under air quality advisory makes a city more attractive.
Six cities had zero air quality advisory days: St. John’s, Thunder Bay, Winnipeg, Regina, Saskatoon, and Victoria. Calgary and Halifax each had less than 1.0.
• Montréal (50)• Laval (49)• Windsor (48)• Oakville (47)• Mississauga (46)
Driving distance to work for solo commuters, 2006
This indicator shows the median driving distance (in kilometres) for automobile commuters travelling alone.
ideally, if people must drive to work alone, then a shorter driving distance makes a city more attractive and does less harm to the environment.
• Brantford (1)• Regina (2)• Thunder Bay (3)• Trois-Rivières (4)• Saskatoon (5)
• Toronto (50)• Vaughan (49)• Mississauga (48)• Oakville (47)• Burlington (46)
Note: For each indicator, bright spots are the five top-ranked cities with at least a “B” grade. Disappointments are the five lowest-ranked cities with a “D” grade.Sources: The Conference Board of Canada; Statistics Canada.

Find this and other Conference Board research at www.e-library.ca
CHAPTER 7
Education
Chapter Summary
• Two small cities stand out: Waterloo (first) and Kingston (second) garner the only two “A” grades on Education, thanks to their relatively large universities, which account for a sizable share of employment in each city. They also rank first and second for their share of professors and college instructors.
• The cities with the poorest Education results are generally (although not uniformly) small and also have weak results on the knowledge employment indicator in the Economy category.
• Big cities tend to do worse than small and mid-sized cities on the teacher–student ratio. in particular, cities that have grown rapidly also do badly on this indicator, such as Brampton, Surrey, Calgary, and Edmonton.

CiTy MAGnETS iiiBenchmarking the Attractiveness of 50 Canadian Cities
Find this and other Conference Board research at www.e-library.ca 48
Opportunities to get a good education are among the most highly valued attributes of an attractive city. Immigrants often cite “better chances for my children” as a motivating factor for moving to Canada. Education is not only a key predictor of an individual’s success, but it also contributes to overall prosperity within a community.
Four indicators are used to benchmark success in the
Education category:
• proportion of the population with at least a bachelor’s degree
• proportion of the population with an advanced degree (master’s,
doctorate, law, medicine)
• number of teachers (elementary and secondary) per school-age
population
• number of professors and college instructors per 1,000 adult population
Table 12 describes each indicator in more detail at the end of
this chapter, along with a summary of the cities with highest and
lowest outcomes.
Two small cities stand out in the field of 50: Waterloo (1st) and Kingston
(2nd) are well ahead and garner the only two “A” grades on Education.
(See Table 11.) Both enjoy the benefits of a “town and gown” city, with
two universities located within each of their borders. Beyond Waterloo
and Kingston, only nine cities do well enough to earn a “B” grade,
including the four big cities of Vancouver, Ottawa, Toronto, and Montréal.
Victoria (4th) and Guelph (8th) are the only other small cities in the top
10. Rounding out the group are three mid-sized cities in the Greater
Toronto and Hamilton Area: Richmond Hill, Oakville, and Burlington.

Chapter 7 | The Conference Board of Canada
Find this and other Conference Board research at www.e-library.ca 49
Table 11Education Report Card
Rank City Grade Rank City Grade
1 Waterloo A 26 Hamilton C
2 Kingston A 27 Edmonton C
3 Vancouver B 28 Winnipeg C
4 Victoria B 29 Lévis C
5 Ottawa B 30 Trois-Rivières C
6 Richmond Hill B 31 Richmond C
7 Oakville B 32 Moncton C
8 Guelph B 33 Thunder Bay C
9 Toronto B 34 Greater Sudbury C
10 Burlington B 35 Regina C
11 Montréal B 36 St. Catharines C
12 Vaughan C 37 Kitchener C
13 St. John’s C 38 Windsor D
14 Sherbrooke C 39 Saguenay D
15 Markham C 40 Laval D
16 Halifax C 41 Kelowna D
17 Peterborough C 42 Barrie D
18 London C 43 Longueuil D
19 Québec City C 44 Brampton D
20 Gatineau C 45 Brantford D
21 Saskatoon C 46 Abbotsford D
22 Burnaby C 47 Oshawa D
23 Mississauga C 48 Surrey D
24 Coquitlam C 49 Saint John D
25 Calgary C 50 Cambridge D
Source: The Conference Board of Canada.

CiTy MAGnETS iiiBenchmarking the Attractiveness of 50 Canadian Cities
Find this and other Conference Board research at www.e-library.ca 50
The cities with the poorest results are generally (although not uniformly)
small and also have weak results on the knowledge employment
indicator in the Economy category. in fact, the cities with the seven
lowest results on Education overall are the same seven cities with the
lowest proportions of employment in knowledge occupations.
Waterloo and Kingston can, of course, thank the universities in their
communities for lifting them to the top. As large employers in small cities,
the universities contribute to the high proportion of college and university
instructors living in these two cities. Kingston and Waterloo rank first and
second on this indicator, followed by Sherbrooke and Guelph, two other
“town and gown” cities (Sherbrooke is also home to two universities).
in a similar vein, Kingston and Waterloo do well when it comes to the
percentage of adults with advanced degrees. in Waterloo, 15.8 per cent
of the adult population have advanced degrees, making it the most
“educated” city. Ottawa follows with 14.6 per cent. But for Kingston,
the comparable figure is 12.3 per cent (8th best).
Cities With Universities
Cities with five or more universities:
Montréal, Halifax, Québec City, Toronto, Winnipeg
Cities with four universities:
Ottawa, Edmonton, London, Regina
Cities with three universities:
Waterloo, Saskatoon
Cities with two universities:
Vancouver, Victoria, Calgary, Kingston, Hamilton, Greater Sudbury, Sherbrooke,
Gatineau, Saguenay
Cities with one university:
Abbotsford, Burnaby, Guelph, Moncton, Peterborough, St. Catharines,
St. John’s, Saint John, Surrey, Thunder Bay, Trois-Rivières, Windsor
Source: Association of Universities and Colleges of Canada.

Chapter 7 | The Conference Board of Canada
Find this and other Conference Board research at www.e-library.ca 51
Waterloo can also claim to be one of the best cities in the country when
it comes to the percentage of the population with a bachelor’s degree,
but falls short of being number one. Richmond Hill earns that distinction,
with 38.1 per cent of the population having at least a bachelor’s degree,
compared with 36.9 per cent in Waterloo. Eight cities merit an “A” grade;
each one has more than 30 per cent of the population with a bachelor’s
degree, well above the Canadian average of 20.9 per cent (just over half
of the 50 cities do better than the average for Canada). Among these top
eight are four cities in the Toronto census metropolitan area (Richmond
Hill, Oakville, Markham, Toronto), as well as Vancouver, Ottawa, Victoria,
and of course, Waterloo. Six of the top eight cities are also home to the
largest pool of adults with more advanced educational degrees; Victoria
and Markham fall just short.
Looking at the number of elementary and secondary school teachers
per 1,000 school-age population, small and mid-sized cities outperform
big cities at the top of the list. The best four cities are in Ontario, led
by Burlington with 105.5 teachers per 1,000 school-age population.
Peterborough is a close second and the only other city with more
than 100 (104.9). Waterloo and Kingston strengthen their education
credentials with strong third- and fourth-place results on this indicator
(both above 90). With the average for Canada at 68.7 teachers per
1,000 people aged 5 to 19, these top four cities establish a high
standard. The fifth “A” city is in Quebec: Sherbrooke.
Despite the fact that the four top cities for elementary and secondary
school teachers are in Ontario, there is no wider pattern of provincial
success: Brampton, Cambridge, and Mississauga are among the seven
“D” cities. Brampton, in particular, is likely suffering from growing pains,
having recorded the fastest population growth rate of all 50 cities. Surrey,
Calgary, and Edmonton suffer a similar fate; e.g., Surrey has the lowest
teacher-to-student ratio and the second-fastest population growth.
For the number of elementary and secondary school teachers per 1,000 school-age population, small and mid-sized cities outperform big cities.

CiTy MAGnETS iiiBenchmarking the Attractiveness of 50 Canadian Cities
Find this and other Conference Board research at www.e-library.ca 52
Table 12Indicators of Performance in the Education Category
Indicator Definition MeaningBright spots (ranking)
Disappointments (ranking)
Population with a bachelor’s degree, 2011
This measures the proportion of the population 25 years and older with at least a bachelor’s degree.
This is a commonly used indicator to show the proportion of the adult population with a university degree. A more educated population will be more attractive to newcomers.
• Richmond Hill (1)• Waterloo (2)• Oakville (3)• Vancouver (4)• Ottawa (5)
• Oshawa (50)• Brantford (49)• Cambridge (48)• Saint John (47)• Abbotsford (46)
Population with an advanced degree, 2011
This shows the proportion of the population aged 25 and over with an advanced degree (master’s, doctorate, medical).
Highly educated newcomers will most likely be attracted to cities with a large population of similarly educated adults.
• Waterloo (1)• Ottawa (2)• Richmond Hill (3)• Oakville (4)• Vancouver (5)
• Oshawa (50)• Saint John (49)• Brantford (48)• Saguenay (47)• Cambridge (46)
number of elementary and secondary school teachers, 2011
This shows the number of elementary and secondary school teachers per 1,000 school-age children.
This indicator is used as a proxy for a good public education system. More teachers per pupil make a city more attractive.
• Burlington (1)• Peterborough (2)• Waterloo (3)• Kingston (4)• Sherbrooke (5)
• Surrey (50)• Brampton (49)• Richmond (48)• Cambridge (47)• Burnaby (46)
number of university professors and college instructors, 2011
This shows the number of university professors and college instructors per 1,000 people aged 18–39.
This indicator is intended to signal availability of higher education. A city with more college and university instructors will have better access to higher education.
• Kingston (1)• Waterloo(2)• Guelph (3)• Sherbrooke (4)
(only 4 cities get an “A” or a “B” grade)
• Brampton (50)• Brantford (49)• Surrey (48)• Cambridge (47)• Vaughan (46)
Note: For each indicator, bright spots are the five top-ranked cities with at least a “B” grade. Disappointments are the five lowest-ranked cities with a “D” grade.Sources: The Conference Board of Canada; Statistics Canada.

Find this and other Conference Board research at www.e-library.ca
CHAPTER 8
Innovation
Chapter Summary
• Five cities earn an “A” grade on innovation: Calgary, Waterloo, Richmond Hill, Markham, and Burnaby.
• The top two, Calgary and Waterloo, are also the two best in the Economy category. The next three—suburban cities—shine when it comes to the number of science, engineering, and information technology graduates among its employed workforce.
• Of the 10 “B” cities, 3 are in the Toronto census metropolitan area and 3 are in the Vancouver census metropolitan area.
• All but 5 of the 18 “D” cities are in Ontario and Quebec and, for the most part, have manufacturing- or resource-based economies (but not oil and gas).

CiTy MAGnETS iiiBenchmarking the Attractiveness of 50 Canadian Cities
Find this and other Conference Board research at www.e-library.ca 54
The Conference Board of Canada defines innovation as a process through which economic or social value is extracted from knowledge—through the creation, diffusion, and transformation of knowledge to produce new or significantly improved products or processes that are put to use by society.1 Cities are known incubators of innovation, providing dense clusters of talented workers who create and transfer knowledge. A city with stronger markers of innovation will attract the best and brightest from around the globe.
With this in mind, we have developed five indicators for the innovation
category (further described in Table 14 at the end of this chapter):
• proportion of workers employed in natural and applied sciences other
than information technology
• proportion of workers employed in computer and high-technology
occupations
• number of university graduates with a major in engineering,
mathematics, or computer, applied, and physical sciences
• labour productivity level (output per worker)
• labour productivity growth over five years
Five cities earn an “A” grade on innovation: Calgary, Waterloo, Richmond
Hill, Markham, and Burnaby. (See Table 13.) not surprisingly, the top
two cities, Calgary (1st) and Waterloo (2nd) are also the two best cities
in the Economy category. The three suburban cities, while less
successful in the Economy overall, shine when it comes to the number
of science, engineering, and information technology graduates among
its employed workforce. in the case of Richmond Hill and Markham,
1 The Conference Board of Canada, “innovation.”

Chapter 8 | The Conference Board of Canada
Find this and other Conference Board research at www.e-library.ca 55
Table 13Innovation Report Card
Rank City Grade Rank City Grade
1 Calgary A 26 Laval C
2 Waterloo A 27 Lévis C
3 Richmond Hill A 28 Brampton C
4 Markham A 29 Burlington C
5 Burnaby A 30 Guelph C
6 Ottawa B 31 Saint John C
7 Mississauga B 32 Surrey C
8 Coquitlam B 33 Saguenay D
9 Edmonton B 34 London D
10 Vancouver B 35 Greater Sudbury D
11 Richmond B 36 Moncton D
12 Regina B 37 Kelowna D
13 Vaughan B 38 Windsor D
14 Oakville B 39 Cambridge D
15 Toronto C 40 Kingston D
16 St. John’s C 41 Sherbrooke D
17 Saskatoon C 42 Trois-Rivières D
18 Montréal C 43 Hamilton D
19 Kitchener C 44 Thunder Bay D
20 Halifax C 45 Barrie D
21 Québec City C 46 Peterborough D
22 Victoria C 47 Abbotsford D
23 Gatineau C 48 St. Catharines D
24 Longueuil C 49 Brantford D
25 Winnipeg C 50 Oshawa D
Source: The Conference Board of Canada.

CiTy MAGnETS iiiBenchmarking the Attractiveness of 50 Canadian Cities
Find this and other Conference Board research at www.e-library.ca 56
both cities outperform Toronto (15th and a “C” grade) by a wide margin in
this category. Vancouver does better relative to Burnaby, only five places
behind with a “B” grade.
Of the 10 “B” cities, 3 are in the Toronto census metropolitan area and
3 are in the Vancouver census metropolitan area. Ottawa, Edmonton,
Regina and St. John’s complete the list. All but 5 of the 18 “D” cities are
in Ontario and Quebec and, for the most part, have manufacturing- or
resource-based economies (excluding oil and gas). Except for Hamilton,
they are all small or mid-sized. The cities with the weakest scores on
innovation also fare badly in the Economy category overall; in fact,
both Oshawa and St. Catharines finish in the bottom three positions in
both categories.
Calgary emerges at the top of two of the five indicators of innovation,
namely, productivity level and the proportion of population employed in
natural and applied sciences. Just over 10 per cent of Calgarians are
employed in natural and applied sciences, close to double the share in
Toronto. This should come as no surprise, given the number of corporate
headquarters in Calgary linked to the oil and gas sector. yet no other city
earns an “A” grade on this indicator; even second-place Waterloo, with
an 8.1 per cent share, has to settle for a “B” grade. Similarly, Calgary
dominates on the productivity level—the only city with an “A” grade.
in all, three indicators provide insight into the number of science
professionals in a city. Two are employment-based, measuring the
proportion of workers engaged in natural and applied sciences and in
computer and information systems. The third indicator, as highlighted
above, reports on the proportion of university graduates in engineering,
math, and sciences. Waterloo and Richmond Hill are the only two cities
with a first, second, or third ranking on all three indicators. Waterloo
ranks first when it comes to computer and information systems, and
second on each of the other two indicators—results consistent with its
top ranking on knowledge workers in the Economy category and, of
course, reflecting the prominence of the high-tech industry. Richmond
Hill is best when it comes to graduates in engineering, math, and
science, reflecting in part its number-one ranking on university
Calgary is tops in two of the five innovation indicators: productivity level, and proportion of population employed in natural and applied sciences.

Chapter 8 | The Conference Board of Canada
Find this and other Conference Board research at www.e-library.ca 57
graduates overall (see the Education category). The city’s proximity to
engineering and high-tech employment underpins this factor (e.g., iBM
is just next door). And as previously mentioned, Calgary’s strength in the
natural and applied science occupations positions it as the only “A” city.
Burnaby and Ottawa also deserve a mention here, because each city
ranks no lower than sixth on any of these three indicators.
The productivity level and productivity growth indicators tell us how
efficiently a city uses its human and physical capital to create wealth.
Calgary’s productivity levels are hard to match. At $135,400 per worker,
Calgary’s productivity is 50 per cent higher than that of 30 of the
50 cities. in fact, no other city comes close, although second-place
Edmonton at $113,745 is well above the Canadian average of $94,382.
Even so, Edmonton is a “B” city compared with Calgary. These two
Alberta cities outshine the rest, leaving the remaining 48 to eke out
a “C” or “D” grade. At the other end of the spectrum, the bottom
nine cities are all in Quebec, including Montréal and Québec City.
Even the best-performing city in Quebec, Lévis, earns a “D” grade.
Although Calgary can boast the highest productivity level among this
report’s 50 cities, its productivity growth record over the past five years
has been less impressive. On this indicator, Calgary is in the middle of
the pack with average annual compound growth of only 0.5 per cent.
The strongest growth took place in Regina (1st), at an average rate of
2 per cent, and in Saskatoon (2nd with 1.6 per cent average growth)
during a period that saw an economic boom in both cities. Coquitlam
is the only other city to earn an “A” grade on productivity growth.
Weak productivity is a hallmark of Ontario cities across the board. The
best, Vaughan (19th), averaged only 0.5 per cent growth. Even worse,
all of the seven cities suffering productivity declines are in Ontario.
in this case, the blame cannot be pinned solely on the depressed
manufacturing and resource sectors; even Ottawa, Kingston, and
Guelph all had negative productivity growth.

CiTy MAGnETS iiiBenchmarking the Attractiveness of 50 Canadian Cities
Find this and other Conference Board research at www.e-library.ca 58
Table 14Indicators of Performance in the Innovation Category
Indicator Definition MeaningBright spots (ranking)
Disappointments (ranking)
Population employed in natural and applied sciences occupations, 2011
This measures the percentage of employed people with jobs in science occupations (natural and applied) as defined by Statistics Canada (including those in life and physical sciences, engineers, architects, and urban planners, but excluding those in high-tech).
This indicator shows the proportion of people working in “innovative jobs.” The higher the percentage, the more attractive the city.
• Calgary (1)• Waterloo (2)• Richmond Hill (3)• Ottawa (4)• St. John’s (5)
• Abbotsford (50)• Brantford (49)• Oshawa (48)• St. Catharines (47)• Barrie (46)
Population employed in computer and information systems occupations, 2011
This measures the percentage of employed people with jobs in computer and information systems occupations.
A city with a proportionately greater number of people in the information technology sector is viewed as more innovative and creative and, hence, more attractive to the creative class of workers.
• Waterloo (1)• Richmond Hill (2)• Markham (3)• Ottawa (4)• Burnaby (5)
• Brantford (50)• Abbotsford (49)• Greater Sudbury (48)• Trois-Rivières (47)• St. Catharines (46)
Graduates in engineering, math, and science, 2011
This indicator shows the number of employed university graduates with a major in engineering, mathematics, or computer, applied, and physical sciences, per 1,000 people.
This indicator shows the relative numbers of university graduates with degrees in innovative disciplines. The higher the number, the more attractive the city to the creative class of workers.
• Richmond Hill (1)• Waterloo (2)• Markham (3)• Burnaby (4)• Calgary (5)
• Brantford (50)• Abbotsford (49)• Saint John (48)• Oshawa (47)• Barrie (46)
Productivity level, 2011
Productivity is GDP divided by employment and measures total output per worker.
Productivity is highly correlated with technological improvements and generates wealth in a city. The higher the productivity, the more attractive the city.
• Calgary (1)• Edmonton (2)
• Sherbrooke (50)• Trois-Rivières (49)• Saguenay (48)• Laval (47)• Québec City (46)
Productivity growth, 2007–11
Productivity growth is measured over five years from 2007 to 2011, and the results for each city show average annual compound growth.
Productivity growth indicates how quickly a city is making gains in wealth creation. Strong productivity growth fosters greater purchasing power for households. A city with high rates of productivity growth is more attractive.
• Regina (1)• Saskatoon (2)• Coquitlam (3)• Burnaby (4)• Winnipeg (5)
• Peterborough (50)• Ottawa (49)• Oshawa (48)• Kingston (47)• Burlington (46)
Note: For each indicator, bright spots are the five top-ranked cities with at least a “B” grade. Disappointments are the five lowest-ranked cities with a “D” grade.Sources: The Conference Board of Canada; Statistics Canada.

Find this and other Conference Board research at www.e-library.ca
CHAPTER 9
Housing
Chapter Summary
• Small and mid-sized cities dominate the top tier in the Housing category, given that housing is the most expensive in some of Canada’s most popular cities, as population growth and the rising demand for housing outstrips supply.
• The big cities that do well (Calgary, Ottawa, Edmonton) are those where high average incomes compensate for high housing prices.
• All cities in Quebec earn “A” or “B” grades except for Montréal, partly thanks to the existence of strong rent control legislation that results in relatively affordable rents.
• At the low end of the spectrum, 10 cities have “D” grades, including Vancouver, 3 of its suburbs, and Victoria.

CiTy MAGnETS iiiBenchmarking the Attractiveness of 50 Canadian Cities
Find this and other Conference Board research at www.e-library.ca 60
Decent affordable housing is fundamental to a high quality of life. In a world of highly mobile populations, cities that can offer a good supply of housing have a comparative advantage in attracting newcomers. Housing typically accounts for the largest single household expenditure and inevitably becomes an important factor in choosing among locations.
However, housing is the most expensive in some of Canada’s
most popular cities, as population growth and the rising demand for
housing outstrips supply, leading to elevated prices. And in the case of
Vancouver, the local housing market is also being used as a financial
safe haven for wealthy people in emerging markets.1 it is a conundrum
that is difficult to solve as cities become more and more popular,
attracting young and talented workers. Recent reports on the housing
affordability crisis in London, U.K., underscore this dilemma: “The cool,
creative class has been priced out of London, which means the capital
is becoming more bland and boring by the minute.”2
There is not yet any indication that Canada’s “popular” spots are
becoming any more bland and boring. The proportion of young adults
(population 25 to 34 years old, as measured in the Society category) is
still highest in the big cities, and this rate has increased over the past
five years.
The Housing category is our smallest, relying on only three indicators
(described in more detail in Table 16 at the end of the chapter):
• percentage of household income spent on mortgages (includes only
households with mortgages)
1 James Surowiecki, “Real Estate Goes Global”; Robin Wiebe, “Vancouver Housing Markets Cannot Fully Escape the Chinese Dragon.”
2 Alex Proud, “Cool London is Dead, and the Rich Kids Are to Blame.”

Chapter 9 | The Conference Board of Canada
Find this and other Conference Board research at www.e-library.ca 61
• percentage of tenant household income spent on rent (based on
incomes of those who rent)
• percentage of homes in need of major repair
Led by Lévis, half of the six “A” cities are in Quebec, including second-
best Saguenay and sixth-best Québec City. (See Table 15.) Overall,
cities in Quebec do well in this category; all earn “A” or “B” grades
except for Montréal. in this case, one contributing factor is the existence
of strong rent control legislation resulting in relatively affordable rents.
Oakville, Waterloo, and Calgary account for the other three “A”s—all
three are among the leading cities when it comes to per capita income,
allowing for relatively strong results on affordability.
Small and mid-sized cities dominate the top tier in the Housing category,
accounting for 8 of the 10 best (Calgary and Québec City are the
outliers). Apart from Québec City, the big cities that do well (Calgary,
Ottawa, Edmonton) are those where high average incomes that
compensate for high housing prices. At the low end of the spectrum,
10 cities have “D” grades, including Vancouver and 3 of its suburbs:
Richmond, Burnaby, and Coquitlam (Surrey is the exception). Victoria is
the least successful of all 50 cities, with a combination of poor results
on affordability and on housing condition.
Lévis and Saguenay are the most affordable cities for both rental and
ownership housing. When it comes to the percentage of income spent
on mortgages, Lévis edges out Saguenay as the most affordable city;
for renting, Saguenay tenants are fractionally better off. On average,
homeowners in Lévis spend only 12 per cent of their income on
mortgage payments, compared with 19.9 per cent for homeowners in
Brampton, who are the worst off. To put this into perspective, Canadians
on average spend 14.5 per cent of their income on mortgage payments.
in all, 16 cities earn an “A” grade on mortgage affordability; of these,
only 3 big cities are included in this group (Québec City, Calgary, and
Ottawa). Six of the eight cities at the bottom of the list are in British
Columbia, where high home prices mean big mortgage payments.

CiTy MAGnETS iiiBenchmarking the Attractiveness of 50 Canadian Cities
Find this and other Conference Board research at www.e-library.ca 62
Table 15Housing Report Card
Rank City Grade Rank City Grade
1 Lévis A 26 London C
2 Saguenay A 27 Mississauga C
3 Oakville A 28 Winnipeg C
4 Waterloo A 29 Cambridge C
5 Calgary A 30 Moncton C
6 Québec City A 31 Halifax C
7 Trois-Rivières B 32 Regina C
8 Sherbrooke B 33 Windsor C
9 Laval B 34 Brampton C
10 Burlington B 35 Toronto C
11 Gatineau B 36 Hamilton C
12 Thunder Bay B 37 Montréal C
13 Markham B 38 Saint John C
14 Ottawa B 39 St. Catharines C
15 St. John's B 40 Kingston C
16 Longueuil B 41 Brantford D
17 Vaughan B 42 Coquitlam D
18 Surrey B 43 Oshawa D
19 Richmond Hill B 44 Vancouver D
20 Edmonton B 45 Peterborough D
21 Greater Sudbury C 46 Kelowna D
22 Abbotsford C 47 Barrie D
23 Saskatoon C 48 Burnaby D
24 Kitchener C 49 Richmond D
25 Guelph C 50 Victoria D
Source: The Conference Board of Canada.

Chapter 9 | The Conference Board of Canada
Find this and other Conference Board research at www.e-library.ca 63
Across the board, tenants—who tend to be younger and have less
income—spend a greater proportion of their income on housing than
homeowners spend. For tenants, there are only three “A” cities: Surrey
joins Saguenay and Lévis as the most affordable places to rent. in
Saguenay, tenants spend 18.6 per cent of income on rental housing,
compared with the 12.3 per cent that homeowners spend. Surrey, on
the other hand, is the third-most attractive city for tenants, even though
it is the second-most expensive place for homeowners (49th place).
Somewhat of an anomaly, Surrey’s homeowners spend nearly as much
of their income on housing as tenants (18.1 per cent vs. 20.5 per cent).
The top seven cities on rental affordability are either in British Columbia
(two cities) or Quebec (five cities)—provinces with rent control
mechanisms in place. Even Montréal fares well on this indicator. For
Toronto and the six suburbs, rental affordability exceeds the average
for Canada (22.1 per cent). Six cities earn “D” grades, with Kelowna
emerging as the least affordable place for tenants. Despite the presence
of rent controls, Kelowna’s tenants spend 27.7 per cent of their income
on rent. Kelowna’s rapid growth has likely contributed to a housing
squeeze (Kelowna is 40th among 50 cities on homeowner affordability).
As expected, suburban communities, where the housing stock is newer,
are the best places to find housing in good repair. The eight “A” cities
are all in Ontario; of these, five are suburbs in the Toronto census
metropolitan area. nearby Burlington, Waterloo, and Barrie complete
the list. Vaughan is best, with only 2.3 per cent of homes in need of
major repair. By contrast, proportionately, Saint John (50th) and Regina
(49th) have 9.9 per cent and 9.4 per cent of their homes in need of
major repair. Four of Canada’s biggest cities—Toronto, Vancouver,
Montréal, and Winnipeg—also find themselves among the worst
eight cities, while Canada’s oldest city, Québec City, is in the upper
half of the list and earns a “B” grade.
The top seven cities on rental affordability are either in British Columbia or Quebec—provinces with rent control mechanism in place.

CiTy MAGnETS iiiBenchmarking the Attractiveness of 50 Canadian Cities
Find this and other Conference Board research at www.e-library.ca 64
Table 16Indicators of Performance in the Housing Category
Indicator Definition MeaningBright spots (ranking)
Disappointments (ranking)
income spent on mortgage, 2011
This measures the percentage of total household income spent on mortgage payments. Average monthly mortgage payments are divided by average monthly household income for all households with a mortgage.
Housing affordability is a key factor in deciding where to live. CMHC uses 30 per cent as the threshold for affordability. Cities where the share of income spent on mortgages is lowest receive the best grades.
• Lévis (1)• Saguenay (2)• Regina (3)• Thunder Bay (4)• Trois-Rivières (5)
• Brampton (50)• Surrey (49)• Richmond (48)• Burnaby (47)• Barrie (46)
income spent on rent, 2011
This indicator measures the percentage of monthly household income spent on rent, based on average tenant household income.
Rental affordability is a particularly important factor for newcomers, who typically rent housing when they first arrive. Cities with lower average rents are more attractive.
• Saguenay (1)• Lévis (2) • Surrey (3)• Abbotsford (4)• Laval (5)
• Kelowna (50)• Peterborough (49)• Barrie (48)• Kingston (47)• Victoria (46)
Homes in need of major repair, 2011
This shows the percentage of homes in need of major repair within each city. Statistics Canada defines major repairs as: the repair of defective plumbing or electrical wiring, and structural repairs to walls, floors, ceilings, etc.
This indicates the quality of the housing stock in each city. Cities with the lowest percentage of homes in need of major repair rank highest.
• Vaughan (1)• Markham (2)• Richmond Hill (3)• Brampton (4)• Waterloo (5)
• Saint John (50)• Regina (49)• Winnipeg (48)• Montréal (47)• Thunder Bay (46)
Note: For each indicator, bright spots are the five top-ranked cities with at least a “B” grade. Disappointments are the five lowest-ranked cities with a “D” grade.Sources: The Conference Board of Canada; Statistics Canada.

Find this and other Conference Board research at www.e-library.ca
CHAPTER 10
Magnetic North: The Attractiveness of Canada’s Cities
Chapter Summary
• in deciding where to live, all migrants value cities that offer centres of innovation the most. For university-educated migrants, features related to society are second-most important, followed by a city’s economic strength. For migrants without a university education, it’s the environment.
• But overall, the 6 “A” cities are at the top of the list regardless of education levels—Waterloo, Calgary, Ottawa, Richmond Hill, Vancouver, and St. John’s. Each offers a unique combination of attributes that add up to a great place to live.
• The 17 overall “C” cities have poor grades on either Economy or Society, or in a few instances, on both.
• The 13 “D” cities are struggling to attract migrants regardless of whether they have a university degree. Most of these cities are in Ontario, and all but one are small or mid-sized.
CiTy MAGnETS iiiBenchmarking the Attractiveness of 50 Canadian Cities
Find this and other Conference Board research at www.e-library.ca 66
In the previous sections, we assessed 50 of Canada’s largest cities using 43 indicators grouped into seven broad categories. The overarching goal of this research, however, is to gauge these cities’ attractiveness to new migrants. The analysis so far sets the stage, but falls short of explaining which cities are the most attractive overall. To arrive at a measure of overall attractiveness, we need to address the challenging reality that people’s locational choices are influenced by their individual values. For example, some people value educational opportunities for their children as most important; for others, a strong local economy is the biggest draw. In other words, each of our seven categories will be valued differently by different groups of people, with implicit weights assigned to each.
To measure each city’s overall attractiveness to people, we devised a
weighting system to be applied to each category (for more detail, see the
Methodology chapter). We further examined the categories through the
lens of new migrants, distinguishing between migrants with a university
education and those without. As a result, we arrived at three sets of
rankings to help us understand the attractiveness of cities to migrants:
1) for migrants overall; 2) for migrants with a university education; and
3) for migrants without a university education.
in deciding where to live, all migrants value cities that offer centres
of innovation the most. in other words, the innovation category
seems to matter the most in locational decisions, followed by aspects
of urban living that make a city a great place to live, work, and

Chapter 10 | The Conference Board of Canada
Find this and other Conference Board research at www.e-library.ca 67
play—characteristics grouped here under the Society category. (See
Chart 1.) The Environment category is third-most important, slightly
ahead of Economy.
Looking more closely at the two subcategories (migrants with a
university degree and migrants without), the top draws remain the
same: innovation and Society. Modest variations are apparent among
the remaining five categories. For instance, Environment receives a
much smaller weight among university-educated migrants, as Economy
jumps into the third-most important category. (See Chart 2.)
For migrants without a university degree, innovation remains the
most important category. But now, both the Economy and Society are
more evenly weighted, while the Environment has leapfrogged them
both, compared with university-educated migrants. not surprisingly,
Education is less highly valued. (See Chart 3.)
What does all this weighting mean? From our results, regardless of the
level of education, migrants will strongly favour cities that offer centres of
innovation, as well as the best chance for a high quality of life. Economic
opportunities also matter, as do places with access to good health care.
Chart 1Weight Given to Each Category When Migrants Decide Where to Live(per cent)
Source: The Conference Board of Canada.
13.5
4.9
15.0
9.26.2
31.6
19.6
Economy
Education
Environment
Health
Housing
Innovation
Society

CiTy MAGnETS iiiBenchmarking the Attractiveness of 50 Canadian Cities
Find this and other Conference Board research at www.e-library.ca 68
Drilling down further, the next set of charts illustrates the weight that
intercity, interprovincial, and international migrants place on each
category separately. For example, intercity migrants overall place the
most weight on Environment and Housing, with the Economy and
Society also being significant factors. (See Chart 4.) But when we look
at it further, intercity migrants with a university education clearly put the
Chart 2Migrants With a University Degree: Weight Given to Each Category When Deciding Where to Live(per cent)
Source: The Conference Board of Canada.
12.2
4.4
9.6
8.5
7.228.6
29.5Economy
Education
Environment
Health
Housing
Innovation
Society
Chart 3Migrants Without a University Degree: Weight Given to Each Category When Deciding Where to Live(per cent)
Source: The Conference Board of Canada.
14.0
6.7
23.2
10.97.3
23.5
14.4
Economy
Education
Environment
Health
Housing
Innovation
Society

Chapter 10 | The Conference Board of Canada
Find this and other Conference Board research at www.e-library.ca 69
greatest weight on Society. (See Chart 5.) For intercity migrants without
a university education, the Environment is the most important. (See
Chart 6.)
interestingly, interprovincial migrants place the greatest weight on the
Economy category. (See Chart 7.) As we have seen in recent years,
many Canadians are willing to relocate to Alberta and Saskatchewan
for employment. However, it seems that interprovincial migrants with
Chart 4Intercity Migrants: Weight Given to Each Category When Deciding Where to Live(per cent)
Source: The Conference Board of Canada.
18.2
6.7
20.8
10.1
19.0
8.3
16.9
Economy
Education
Environment
Health
Housing
Innovation
Society
Chart 5Intercity Migrants With a University Degree: Weight Given to Each Category When Deciding Where to Live(per cent)
Source: The Conference Board of Canada.
15.8
5.1
13.5
10.216.6
11.8
27.0Economy
Education
Environment
Health
Housing
Innovation
Society

CiTy MAGnETS iiiBenchmarking the Attractiveness of 50 Canadian Cities
Find this and other Conference Board research at www.e-library.ca 70
a university education still favour a location with a strong Society and
Environment score, as quality of life trumps strong job prospects. (See
Chart 8.) For interprovincial migrants without a university education,
strong job prospects are an overwhelming factor. (See Chart 9.)
Chart 6Intercity Migrants Without a University Degree: Weight Given to Each Category When Deciding Where to Live(per cent)
Source: The Conference Board of Canada.
16.3
10.2
27.510.6
18.5
6.0
11.0
Economy
Education
Environment
Health
Housing
Innovation
Society
Chart 7Interprovincial Migrants: Weight Given to Each Category When Deciding Where to Live(per cent)
Source: The Conference Board of Canada.
20.0
7.8
18.6
11.0
10.3
19.0
13.1
Economy
Education
Environment
Health
Housing
Innovation
Society

Chapter 10 | The Conference Board of Canada
Find this and other Conference Board research at www.e-library.ca 71
Finally, international migrants undoubtedly favour innovation and Society
when choosing where to migrate in Canada. (See charts 10, 11, and 12.)
All of the other categories take a backseat. Perhaps this is why most
international migrants chose to land in Toronto, Montréal, or Vancouver;
these cities are top 3 in Society and top 20 in innovation. Of course,
once migrants land in Canada, they will be counted as an intercity or
an interprovincial migrant if they decide to relocate again.
Chart 8Interprovincial Migrants With a University Degree: Weight Given to Each Category When Deciding Where to Live(per cent)
Source: The Conference Board of Canada.
13.8
6.7
20.0
8.911.0
17.2
22.4
Economy
Education
Environment
Health
Housing
Innovation
Society
Chart 9Interprovincial Migrants Without a University Degree: Weight Given to Each Category When Deciding Where to Live(per cent)
Source: The Conference Board of Canada.
22.6
8.8
17.212.6
10.4
18.0
10.5
Economy
Education
Environment
Health
Housing
Innovation
Society

CiTy MAGnETS iiiBenchmarking the Attractiveness of 50 Canadian Cities
Find this and other Conference Board research at www.e-library.ca 72
Table 17 presents the overall scores for attractiveness to migrants for
each of the 50 cities, according to the three scenarios: 1) all migrants;
2) university-educated migrants; and 3) non-university-educated
migrants. Generally, results for the three scenarios are comparable,
despite some variations in weightings. Ultimately, cities that emerge
Chart 10International Migrants: Weight Given to Each Category When Deciding Where to Live(per cent)
Source: The Conference Board of Canada.
7.47.7
9.4
11.2
4.935.1
24.2
Economy
Education
Environment
Health
Housing
Innovation
Society
Chart 11International Migrants With a University Degree: Weight Given to Each Category When Deciding Where to Live(per cent)
Source: The Conference Board of Canada.
8.5
10.3
8.4
11.7
5.133.8
22.0
Economy
Education
Environment
Health
Housing
Innovation
Society

Chapter 10 | The Conference Board of Canada
Find this and other Conference Board research at www.e-library.ca 73
as the top destinations for university-educated migrants are at the top
of the list for non-migrants, suggesting that a city can and should be
attractive to all individuals, regardless of education levels.
“A” Cities: Strong Magnets
Six cities earn overall “A” grades across all three scenarios (all migrants,
university-educated migrants, and non-university-educated migrants),
led by Waterloo, Calgary, and Ottawa. These six cities, extending from
coast to coast, represent a diverse cluster of cities, emblematic of
Canada overall. They include three big and two small cities, but only
one suburb. They represent four provinces, and none are part of the
same census metropolitan area or in neighbouring regions. Two of the
six are capital cities—possibly a relevant common denominator. (All of
the eight provincial capital cities in the report are at least “B” cities and
make it in the top 19.)
Whether you are a migrant with a university degree or without, these
cities are appealing places to live. Each has strong attributes that draw
people to its community, but the top three are particularly highly prized
cities when it comes to the economy.
Chart 12International Migrants Without a University Degree: Weight Given to Each Category When Deciding Where to Live(per cent)
Source: The Conference Board of Canada.
7.26.7
10.8
11.3
5.333.6
25.0
Economy
Education
Environment
Health
Housing
Innovation
Society

CiTy MAGnETS iiiBenchmarking the Attractiveness of 50 Canadian Cities
Find this and other Conference Board research at www.e-library.ca 74
Table 17Attractiveness to Migrants Report Card
CityAll migrants
(rank) GradeUniversity-educated
migrants (rank) GradeNon-university-educated
migrants (rank) Grade
Waterloo 1 A 1 A 1 A
Calgary 2 A 2 A 2 A
Ottawa 3 A 3 A 3 A
Richmond Hill 4 A 4 A 6 A
Vancouver 5 A 5 A 5 A
St. John’s 6 A 8 B 4 A
Edmonton 7 B 6 A 10 B
Regina 8 B 12 B 8 B
Burnaby 9 B 9 B 13 B
Markham 10 B 7 B 15 B
Victoria 11 B 11 B 7 A
Saskatoon 12 B 13 B 9 B
Toronto 13 B 10 B 21 B
Coquitlam 14 B 18 B 16 B
Halifax 15 B 23 B 11 B
Québec City 16 B 16 B 14 B
Oakville 17 B 15 B 20 B
Mississauga 18 B 14 B 27 C
Winnipeg 19 B 20 B 18 B
Kingston 20 B 22 B 12 B
Gatineau 21 C 21 B 24 C
Lévis 22 C 24 C 22 B
Vaughan 23 C 19 B 30 C
Richmond 24 C 26 C 26 C
Guelph 25 C 25 C 25 C
(continued ...)

Chapter 10 | The Conference Board of Canada
Find this and other Conference Board research at www.e-library.ca 75
Table 17 (cont’d)Attractiveness to Migrants Report Card
CityAll migrants
(rank) GradeUniversity-educated
migrants (rank) GradeNon-university-educated
migrants (rank) Grade
Sherbrooke 26 C 30 C 17 B
London 27 C 29 C 23 B
Kitchener 28 C 27 C 28 C
Moncton 29 C 31 C 19 B
Montréal 30 C 17 B 38 C
Burlington 31 C 28 C 29 C
Surrey 32 C 35 C 33 C
Laval 33 C 32 C 41 D
Saguenay 34 C 36 C 37 C
Kelowna 35 C 40 D 31 C
Thunder Bay 36 C 38 D 32 C
Longueuil 37 C 33 C 45 D
Brampton 38 D 34 C 46 D
Trois-Rivières 39 D 42 D 34 C
Peterborough 40 D 39 D 36 C
Abbotsford 41 D 41 D 35 C
Hamilton 42 D 37 D 40 D
Greater Sudbury 43 D 44 D 39 D
Saint John 44 D 45 D 47 D
Windsor 45 D 43 D 44 D
Barrie 46 D 47 D 42 D
St. Catharines 47 D 46 D 43 D
Brantford 48 D 49 D 48 D
Cambridge 49 D 48 D 49 D
Oshawa 50 D 50 D 50 D
Source: The Conference Board of Canada.

CiTy MAGnETS iiiBenchmarking the Attractiveness of 50 Canadian Cities
Find this and other Conference Board research at www.e-library.ca 76
WaterlooWaterloo, despite being one of the smallest of the 50 cities, shines as
one of the top cities for both university- and non-university-educated
migrants. Considering Waterloo’s well-earned reputation for innovation
and education, this should not be surprising. its reputation is borne out
by our analysis, ranking first in Education and second in innovation.
Waterloo and second-best Kingston dominate the Education category
as the only two “A” cities. Education and innovation are drivers of
the economy in Waterloo, leading to a strong third-place result in the
Economy category, behind Calgary and Ottawa. it’s important to note,
however, that data come from the 2011 Census and do not reflect more
recent job cuts and other financial losses associated with BlackBerry.
Still, Waterloo boosts its appeal with well-maintained and relatively
affordable housing. Where Waterloo is vulnerable, however, is in Health,
where it falls to the bottom (48th) with a “D” grade.
CalgaryCalgary is the only city to rank first in two categories: Economy and
innovation. A powerful combination, these two categories lift Calgary
to the top tier of cities despite weak outcomes in Education, Health,
and Environment. Although Calgary has a well-educated workforce,
overall results in Education suffer from poor teacher-to-student ratios,
including those at the university level. This is not uncommon for such a
fast-growing city, where keeping services up with growth is challenging.
Similarly, in Health, Calgary scores a “D” grade for hospital beds per
100,000 people—another symptom of escalating growth.
OttawaOttawa’s appeal can be traced back to solid results in four key
categories: Society, Education, innovation, and Economy. The presence
of a well-educated public sector has also helped to incubate creative
ideas and to seed private sector innovation. Ottawa’s ranking is boosted
by the fact that it ranks in the top half in each of the seven categories.
These strengths help us understand why Ottawa ranks second when
Ottawa’s appeal can be traced back to solid results in four key categories: Society, Education, innovation, and Economy.

Chapter 10 | The Conference Board of Canada
Find this and other Conference Board research at www.e-library.ca 77
it comes to migrants with university education, where Education and
innovation are valued more highly. Ottawa’s weakness can be found
in Health, where it earns its only “C” grade, attributed primarily to
low numbers of health care support workers, rather than physicians
or specialists.
Richmond HillBoosted by strong results in Education, innovation, and Society,
Richmond Hill is the fourth “A” city. With over 54 per cent of its
population foreign-born, it is the third-most diverse city in Canada after
Toronto and Mississauga. you will also find the highest number of
graduates in engineering, science, and math per capita in Richmond
Hill, along with the second-highest share of computer and information
systems employees. The city’s proximity to large engineering and high-
tech businesses is a draw for these workers. not surprisingly, Richmond
Hill is somewhat more attractive to migrants with a university education.
VancouverVancouver is the fifth “A” city, appealing because of its overall high
quality of life, demonstrated by strong results on Society, Education,
and Environment. Graced with a beautiful setting and temperate climate,
Vancouver is one of the key destinations for new Canadians, including
a young demographic. no doubt, climate also contributes to the large
numbers of cycling and walking commuters, but so does good planning
and good governance. Vancouver’s Achilles heel is housing; it ranks
near the bottom with a “D” grade—the city’s high cost of housing is
an unfortunate side effect of its success and geography.
St. John’sThe second of the small “A” cities, St. John’s is boosted by strong
economic activity and exceptional outcomes in the Health category.
Activity in the oil and gas sector has made St. John’s one of Canada’s
“A-list” urban economies, with the second-highest GDP per capita and
third-highest productivity level of all 50 cities. However, it is in the Health

CiTy MAGnETS iiiBenchmarking the Attractiveness of 50 Canadian Cities
Find this and other Conference Board research at www.e-library.ca 78
category that St. John’s distinguishes itself from every other city except
Kingston. Ranked second overall behind Kingston and only one of two
“A” cities in Health, St. John’s has the second-best ratio of GPs and
specialists per 100,000 people. To improve its overall attractiveness,
St. John’s needs to find ways to improve its outcomes in the Society
category, where it languishes in the bottom decile of all 50 cities.
“B” Cities: Magnetic Appeal
The next tier of successful cities are the 14 cities with an overall “B”
grade, representing six provinces and including a majority of the mid-
sized cities. included among the “B” cities are a diverse group of suburbs
and “core” cities (that is, cities that are the largest within the respective
census metropolitan areas, typically the historic heart of the metropolitan
area), located all across the country.
included in the “B” list is Toronto, one of four “B” cities in the Toronto
census metropolitan area, along with Oakville, Markham, and
Mississauga. All of these cities in the Toronto area boast large numbers
of residents born outside Canada. Toronto’s draw comes from a number
of factors highlighted in the Society category, where it is best overall. As
the biggest welcoming metropolis for immigrants to Canada, Toronto’s
diversity generates its own magnetic appeal.
Four western cities rank among the “B” cities: Edmonton (7th overall),
Regina (8th), Saskatoon (12th), and Winnipeg (19th). All have seen
sizable increases in newcomer populations during the past 10 years
as local economies have improved. Edmonton’s relatively low
unemployment rates, high per capita incomes, and growing employment
opportunities have attracted newcomers in growing numbers. in the case
of Saskatoon and Regina, resources in Saskatchewan have fostered
booming economies, making both cities “A” cities in the Economy,
among the top 7 of all 50 cities. Though it garners middle-of-the-pack
results in most categories, Winnipeg’s success comes in its top-15
ranking in Health.
As the biggest welcoming metropolis for immigrants to Canada, Toronto’s diversity generates its own magnetic appeal.

Chapter 10 | The Conference Board of Canada
Find this and other Conference Board research at www.e-library.ca 79
Of the remaining “B” cities, 3 are in British Columbia (Victoria, Burnaby,
and Coquitlam), while Halifax, Québec City, and Kingston round out the
group. Burnaby (9th overall) and Coquitlam (14th), part of the Vancouver
census metropolitan area, share some of the benefits stemming from the
metropolitan region, but lag behind Vancouver when it comes to Society,
Education, Health, and Housing (Coquitlam ranks two spots ahead of
Vancouver on Housing, but still receives a “D” grade). Victoria (11th),
thanks to its temperate climate and young and educated population,
scores best on Environment, Education, and Society. Meanwhile, Halifax
(15th) and Québec City (16th) earn great results in the Health category,
being well supported with GPs, specialists, and workers in support of
health care. Finally, Kingston’s “A” grade on Education, Environment,
and Health were enough to lift it into 20th position.
“C” Cities: Room for Improvement
For 17 cities, a “C” grade signals room for improvement. Just like the
“A” and “B” cities, this group includes a range of small, medium-sized,
and big cities from across Canada, but three-quarters are in Ontario
or Quebec (Gatineau, Lévis, Vaughan, Guelph, Sherbrooke, London,
Kitchener, Montréal, Burlington, Laval, Saguenay, Thunder Bay, and
Longueuil.) in addition, two suburban cities in B.C.—Richmond and
Surrey—find themselves well behind Vancouver, the hub of the census
metropolitan area. Particularly weak outcomes on Education and Society
are at the root of this particular city-suburban gap. Overall, the “C” cities
have poor outcomes on either Economy or Society, or in a few instances,
on both.
Elsewhere, Moncton balances weak results in Society with strong
Environment and Health credentials, while Kelowna’s low ranking
on Society and Housing offsets its third place in Environment.
nonetheless, despite their differences, all cities that earn a “C” grade
would strive to do better in order to boost their appeal to newcomers.
Overall, the “C” cities have poor outcomes on either Economy or Society, or, in a few instances, on both.

CiTy MAGnETS iiiBenchmarking the Attractiveness of 50 Canadian Cities
Find this and other Conference Board research at www.e-library.ca 80
“D” Cities: Struggling to Attract
Without question, the “D” cities are struggling, and it matters little
whether they are measured against migrants with a university degree
or without. Except for Brampton and Hamilton, all cities are small or
mid-sized. in all, 13 cities are included in this group, which is dominated
by Ontario (which has 10 of 13 “D” cities):
• Ontario: Brampton, Peterborough, Hamilton, Greater Sudbury, Windsor,
Barrie, St. Catharines, Brantford, Cambridge, and Oshawa
• B.C.: Abbotsford
• Quebec: Trois-Rivières
• new Brunswick: Saint John
Of these 13 “D” cities, 9 experienced very low or negative population
growth (1 per cent annually or lower), including 2 that saw their
population decline between 2006 and 2011, namely, St. Catharines
and Windsor. Overall on Society, 10 of the cities are in the bottom
half, but notably, Brampton gets an “A,” thanks to its diversity and
foreign-born population.
Almost all of the “D” cities (except Peterborough) fall in the bottom half
of the rankings on Education, and 8 are included among the 13 cities
with a “D” grade in this category. Similarly, all are in the bottom half of
the Economy and innovation categories; 10 of 13 earn “D” grades on
innovation. Cities in central and southern Ontario were hit hard by the
recession and the slow recovery of the manufacturing and automotive
sectors. This is evident in the poor economic results for Hamilton,
Cambridge, St. Catharines, Windsor, and Oshawa. Each had negative
GDP growth, negative employment growth, and high unemployment
rates. Furthermore, 8 of these “D” cities are among the 10 weakest in
the Economy. Similarly, a poor showing in the Economy category, also
caused by the slow recovery of the manufacturing sector, hurt the overall
ranking of Trois-Rivières.
Cities in central and southern Ontario were hit hard by the recession and the slow recovery of the manufacturing and automotive sectors.

Chapter 10 | The Conference Board of Canada
Find this and other Conference Board research at www.e-library.ca 81
Saint John, the second-smallest city among all 50 cities, struggles to
improve on measures linked to Society, Education, and Environment
where it lands in 49th or 50th place. Saint John does better than all
other “D” cities on the Economy, thanks to decent GDP growth that has
resulted in making Saint John the ninth-highest city for GDP per capita.

Find this and other Conference Board research at www.e-library.ca
CHAPTER 11
Conclusion
Chapter Summary
• An attractive city is attractive to everyone—despite the different weight migrants may attach to the various aspects that make cities appealing.
• The strength of the most magnetic cities has stood the test of time: the top six cities in our last ranking are still at the top this year.
• The most noticeable improvements since our last ranking came in the Economy category, driven by robust growth in the West, but spreading out across the country to places like Moncton and Halifax. However, for manufacturing cities in southern Ontario, economic growth remained elusive, keeping Windsor and Oshawa from progressing up the list of 50 cities.

Chapter 11 | The Conference Board of Canada
Find this and other Conference Board research at www.e-library.ca 83
This report analyzes the magnetic appeal of Canada’s cities, with a particular perspective focusing on the hundreds of thousands of migrants who have been drawn to Canada’s cities for decades. Following closely the format of City Magnets II (2010), this edition continued to explore three different scenarios, viewed from the perspective of: 1) university-educated migrants; 2) migrants without a university degree; and 3) all migrants. In so doing, we are better able to understand whether there are attributes of a city with greater appeal to university-educated migrants, and similarly those with more appeal to non-university-educated migrants. In other words, can we assess whether a migrant’s level of education strongly influences locational choice?
After examining three sets of tabulations based on 43 indicators,
our conclusions support, and indeed strengthen, the conclusion first
arrived at in City Magnets II : “an attractive city is attractive to everyone.”1
While it is surprising that university-educated migrants place less weight
on Education outcomes than migrants with no university degree, both
groups of migrants are more interested in innovation outcomes than
anything else. The overall results bear this out—the top three cities
are the same no matter which category of migrants is examined; ditto
for the bottom three cities.
in all, six cities earn “A” grades: Waterloo, Calgary, Ottawa, Richmond
Hill, Vancouver, and St. John’s. With such a diverse group of big
and small cities strung across the country, there is clearly no magic
formula for magnetic appeal. Each in their own way offers an attractive
1 The Conference Board of Canada, City Magnets II, 55.

CiTy MAGnETS iiiBenchmarking the Attractiveness of 50 Canadian Cities
Find this and other Conference Board research at www.e-library.ca 84
combination of attributes. For instance, Calgary is an economic
juggernaut holding the promise of jobs and steady incomes. Meanwhile,
Vancouver is a shining example of a city built on diversity to strengthen
its outcome in Society. Waterloo, on the other hand, receives its ranking
from its reliance on the high-tech sector. Significantly, all six are tops
across the board for migrants, regardless of their education.
For the most part, the fundamentals of these top cities have stood the
test of time. in our 2010 report, we identified that 8 of the top 10 cities
remained at the top. This year, all of the six “A” cities in 2010 hung on to
their top spots in 2014. Saskatoon and Regina are the newcomers in the
top 10, displacing Victoria and Vaughan (which dropped slightly). The
most noticeable improvements came in the Economy category, driven
by robust growth in the West, but spreading out across the country to
places like Moncton and Halifax. However, for manufacturing cities in
southern Ontario, economic growth remained elusive, keeping Windsor
and Oshawa from progressing up the list of 50 cities.
Certainly, the evidence from this report reinforces the important message
first put to policy-makers in our previous edition, namely, to be careful
in crafting immigration policies that are aimed solely at attracting
university graduates.
Finally, by identifying the cities that act as strong magnets, this report
sheds lights on what it takes to be a magnetic city. Cities that fail to
attract new migrants from other countries, other provinces, and other
cities will struggle to be prosperous and vibrant. indeed, attracting skilled
and creative workers is crucial to the competitiveness of Canada and its
cities. Most importantly, a successful city must be attractive to all people.
Tell us how we’re doing—rate this publication.
www.conferenceboard.ca/e-Library/abstract.aspx?did=6441

Appendix A | The Conference Board of Canada
Find this and other Conference Board research at www.e-library.ca 85
APPENDIX A
Retrospective: Looking Back at City Magnets II
in this edition of City Magnets, we seized the opportunity to compare
current results with those of City Magnets II, released in 2010. The
following retrospective is based on a systematic review of each category,
ensuring that the 2014 results are directly comparable to those in the
2010 report. Accordingly, for this retrospective, we recalculated the
rankings in this year’s report based on the definitions and number of
indicators used in 2010. This involved adjusting the GDP figures to
align with the methodology used in the 2010 report, and extracting the
new indicators from the current results (see Methodology section for a
description of the indicators added for the 2014 report and the changes
to GDP calculations). Consequently, two indicators were eliminated (full-
time employment and population in occupations supporting health care)
and four indicators were adjusted:
• real GDP per capita
• real GDP growth
• labour productivity
• labour productivity growth
So, on this basis, what changed in the past five years? As it happens,
results for 2014 mirror closely those of 2010: the best cities are still at
the top; and for the most part, the struggling cities continue to struggle.

CiTy MAGnETS iiiBenchmarking the Attractiveness of 50 Canadian Cities
Find this report and other Conference Board research at www.e-library.ca 86
The overarching message from 2010 resonates even more strongly in
2014; namely, that an attractive city is attractive to everyone, despite the
different values migrants may attach to their choice of relocation.1
Even so, we identified a number of changes since 2010. The following
are the most important:
1. The number of “D” cities rose, from 9 to 17.
2. The difference in results between migrants with a university degree and
those without is much less pronounced in 2014 than in 2010.
3. Six cities saw significant improvements in ranking in 2014: Saskatoon,
Regina, Burnaby, Moncton, Coquitlam, and Saguenay. in four of these
cities (Regina and Saguenay excluded), there was also an improvement
in grade.
4. Eight cities declined significantly in ranking in 2014: Guelph, Lévis,
Vaughan, London, Barrie, Kingston, Sherbrooke, and St. Catharines.
Vaughan, Kingston, and Sherbrooke kept the same letter grade; all
others dropped.
5. in the Economy category, there are more “A” cities and fewer “D” cities,
and western cities are more dominant than ever.
6. in the Environment category, many cities saw improvements: in 2014,
50 per cent more cities earned “A” grades (15 vs. 10); and only one city,
Montréal, earned a “D,” compared with seven in 2010.
Five cities are included in the top flight of “A” cities, one fewer than
in 2010. (See Table 1.) At the top, the best five cities stay the same,
although Waterloo slips to 5th place, while Ottawa, Richmond Hill,
and Vancouver all move up a spot, to 2nd, 3rd, and 4th place,
respectively. Calgary maintains its number-one position. At this
point, the relative strengths of each of these five cities have been
robust enough to keep them at the top. For Calgary, it’s the Economy
and innovation; for Waterloo, it’s Education and innovation; and for
Ottawa, it’s Economy and Society.
1 The Conference Board of Canada, City Magnets II, 54.

Find this report and other Conference Board research at www.e-library.ca 87
Appendix A | The Conference Board of Canada
Table 1Comparison of City Rankings and Grades
City
All migrants University-educated migrants Non-university-educated migrants
2014 report 2010 report 2014 report 2010 report 2014 report 2010 report
Rank Grade Rank Grade Rank Grade Rank Grade Rank Grade Rank Grade
Calgary 1 A 1 A 1 A 3 A 4 A 1 A
Ottawa 2 A 3 A 2 A 2 A 2 A 3 A
Richmond Hill 3 A 4 A 3 A 4 A 8 A 5 A
Vancouver 4 A 5 A 4 A 6 A 5 A 4 A
Waterloo 5 A 2 A 5 A 1 A 1 A 2 A
Edmonton 6 B 7 B 6 B 12 B 10 B 7 A
St. John’s 7 B 6 A 9 B 5 A 3 A 6 A
Saskatoon 8 B 30 C 10 B 29 C 9 A 29 C
Markham 9 B 9 B 7 B 8 B 23 B 9 B
Regina 10 B 18 B 15 B 23 C 6 A 14 B
Victoria 11 B 8 B 11 B 9 B 7 A 8 B
Oakville 12 B 12 B 12 B 10 B 17 B 12 B
Toronto 13 B 14 B 8 B 13 B 19 B 18 B
Burnaby 14 B 27 C 13 B 22 C 18 B 32 C
Moncton 15 B 31 C 18 B 31 C 14 B 30 C
Vaughan 16 B 10 B 14 B 14 B 28 C 10 B
Kingston 17 B 11 B 16 B 7 B 11 B 11 B
Coquitlam 18 B 28 C 17 B 27 C 25 C 33 C
Halifax 19 B 16 B 20 C 17 B 12 B 16 B
Burlington 20 C 20 B 19 C 18 B 26 C 20 B
Québec City 21 C 19 B 21 C 16 B 13 B 19 B
Winnipeg 22 C 22 C 23 C 25 C 15 B 22 C
Richmond 23 C 25 C 25 C 28 C 29 C 26 C
Gatineau 24 C 23 C 24 C 24 C 21 B 23 C
London 25 C 15 B 28 C 15 B 22 B 17 B
(continued ...)

CiTy MAGnETS iiiBenchmarking the Attractiveness of 50 Canadian Cities
Find this report and other Conference Board research at www.e-library.ca 88
Table 1 (cont’d)Comparison of City Rankings and Grades
City
All migrants University-educated migrants Non-university-educated migrants
2014 report 2010 report 2014 report 2010 report 2014 report 2010 report
Rank Grade Rank Grade Rank Grade Rank Grade Rank Grade Rank Grade
Guelph 26 C 13 B 27 C 11 B 24 B 13 B
Mississauga 27 C 24 C 22 C 20 B 27 C 25 C
Sherbrooke 28 C 21 C 31 C 21 C 16 B 21 C
Lévis 29 C 17 B 29 C 19 B 20 B 15 B
Kelowna 30 C 34 C 33 C 45 D 30 C 28 C
Kitchener 31 C 26 C 30 C 30 C 31 C 27 C
Surrey 32 C 38 C 32 C 43 D 33 C 35 C
Montréal 33 C 35 C 26 C 26 C 38 C 39 C
Thunder Bay 34 D 36 C 38 D 32 C 32 C 36 C
Abbotsford 35 D 32 C 36 D 36 C 35 C 31 C
Greater Sudbury 36 D 40 C 41 D 35 C 39 C 40 C
Brampton 37 D 33 C 34 C 38 D 46 D 34 C
Hamilton 38 D 41 C 37 D 37 C 40 D 42 C
Saguenay 39 D 47 D 39 D 44 D 37 C 47 D
Laval 40 D 43 D 35 C 41 D 42 D 43 D
Peterborough 41 D 37 C 40 D 33 C 34 C 37 C
Trois-Rivières 42 D 44 D 43 D 42 D 36 C 44 D
Barrie 43 D 29 C 45 D 39 D 41 D 24 C
Saint John 44 D 49 D 46 D 49 D 43 D 49 D
St. Catharines 45 D 39 C 44 D 34 C 44 D 38 C
Longueuil 46 D 48 D 42 D 47 D 45 D 48 D
Cambridge 47 D 42 D 48 D 46 D 49 D 41 C
Windsor 48 D 45 D 47 D 40 D 48 D 46 D
Brantford 49 D 46 D 50 D 48 D 47 D 45 D
Oshawa 50 D 50 D 49 D 50 D 50 D 50 D
Note: Rankings for 2014 are recalculated (and therefore slightly different from the rankings in the main body of the report) to make them directly comparable with the rankings in the 2010 report.Source: The Conference Board of Canada.

Find this report and other Conference Board research at www.e-library.ca 89
Appendix A | The Conference Board of Canada
Unfortunately, the number of cities falling into the “D” category
increased—from 9 in 2010 to 17 in 2014. Hamilton, Brampton,
Peterborough, Greater Sudbury, Abbotsford, St. Catharines, Thunder
Bay, and Barrie all dropped from a “C” to a “D” grade. no common
trend underpins the decline of these seven cities; for some, worsening
economies were a factor— Barrie was hit particularly hard; for others,
poorer outcomes in the Society category contributed to their downfall
(e.g., Greater Sudbury).
The second important change reinforces the conclusion that a city
attractive to university-educated migrants is attractive to all. This finding
is even more pronounced in this 2014 edition of City Magnets, which
reveals only modest differences among university-educated migrants
and those without a university degree. Perhaps the most significant
variation is the value placed on outcomes in the Education category; in
this edition, migrants without a university education viewed them as more
important. Even so, the difference is small (with the Education category
weighted at 6.7 per cent for migrants without a university degree vs.
4.4 per cent for migrants with a university degree). Looking back to 2010,
migrants with a university degree overwhelmingly considered Education
as the most important category (accounting for 21 per cent of the total
decision). By contrast, migrants without a university degree view the
Economy category as most important (at 33 per cent) and Education
only at 10 per cent (half the weighting of those with a university degree).
Overall, five cities saw significant improvements since 2010, including
four that rose 10 or more points in the rankings. Saskatoon experienced
the most dramatic improvement, jumping from 30th to 8th place, from a
“C” to a “B” grade. A booming economy fuelled Saskatoon’s rise, pushing
the city up to an “A” grade in the Economy, from its “C” standing in 2010.
Strong GDP and employment growth underpin Saskatoon’s success.
The only other city from Saskatchewan—Regina—moved up 8 places
in the rankings, but kept its “B” grade. Regina’s rise can be attributed
mostly to Economy, where it finished in 2nd spot. Moncton’s rise is just
as impressive, up 16 places from 31st to 15th, from a “C” to a “B” grade.
Like Saskatoon, big gains in the economy lifted Moncton in the overall

CiTy MAGnETS iiiBenchmarking the Attractiveness of 50 Canadian Cities
Find this report and other Conference Board research at www.e-library.ca 90
rankings. Formerly a “C” city in the Economy category, Moncton earns
a “B” grade in 2014, largely thanks to significant gains in GDP per
capita, alongside strong GDP and employment growth. Both Burnaby
and Coquitlam were also able to jump in the rankings, moving from a
“B” to a “C.” Like most of the other cities with big gains, Burnaby and
Coquitlam improved thanks to stronger economic performance leading
to gains in both the Economy and innovation categories. But both also
saw improvement in the Health category, while Burnaby made huge
strides in Society. Finally, Saguenay also moved up 8 places in the
rankings to 39th, but did not improve on its “D” grade.
Gains for some cities brought losses for others: eight cities fell
significantly in ranking and grade. Five of the cities are in Ontario,
where they all suffered from economic losses: Kingston, Vaughan,
London, Guelph, Barrie, and St. Catharines. in the most extreme
example, Barrie dropped from 29 to number 41 in the Economy category.
The struggling manufacturing sector in Ontario has been highlighted
previously. Lévis and Sherbrooke are the only non-Ontario cities that
experienced significant losses, though their drop is not a result of
economic decline. Although Lévis retained its number-one ranking in the
Housing category, its drop from a “B” to a “C” grade (and from 17th to
29th) is linked more closely to poorer results in the Society category.
The final two key changes relate to shifts within two of the categories:
Economy and Environment. Both saw collective improvements: more
“A” cities, fewer “D” cities. notwithstanding the struggling Ontario
manufacturing sector, the 2014 Economy category includes 5 “A” cities,
up from only 3 in 2010, and perhaps more impressively, only 4 “D” cities
compared with 17 in 2010. While this is in part due to the formulaic
methodology used to assign grades, it does, more importantly, signal
an upswing in many parts of the country. This is most acutely observed
in Western Canada, where as Table 2 illustrates, four of the five top
economies are in the West: Calgary, Regina, Edmonton, and Saskatoon.
Vancouver and Winnipeg also saw significant gains. Looking eastward,
economic fortunes also improved for Toronto, Québec City, Montréal,
Halifax, and Moncton, among others.

Find this report and other Conference Board research at www.e-library.ca 91
Appendix A | The Conference Board of Canada
Similarly, in the Environment category, a number of cities had significant
improvements. Fifteen cities earned “A” grades, compared to ten in 2014.
Equally significant is the drop in the number of “D” grades: Montréal is
the lone “D” city in 2014, stuck at the bottom as it was in 2010. Cities in
British Columbia still dominate, blessed by good weather and good air
quality—factors unlikely to change. Still, better air quality in cities along
the Great Lakes meant far fewer air quality advisory days. in the previous
report, 21 cities averaged 20 or more air quality advisory days; that
number has now shrunk to only one. For many cities, shorter commuting
distances also boosted their overall outcomes in the Environment
category, e.g., Saskatoon, London, and Winnipeg.
Table 2 provides a closer look at the comparative performances of
cities in the 2014 and 2010 reports, highlighting the bright spots and
disappointments by each of the seven categories. Apart from the
differences noted above, the results for the best cities (bright spots)
show remarkable consistency. For example, Calgary is the top city
in both reports for Economy and innovation. Waterloo and Kingston
continue to dominate at the top of the Education category, just as
Kingston and St. John’s continue to lead all others in Health. Four of
the top cities in innovation are the same; Calgary replaces St. John’s
at the top. in this instance, St. John’s suffered a notable decline,
dropping to 17th place, but still maintaining a “B” grade. As noted
above, B.C. cities continue to claim four of the top five spots on the
Environment. Finally, the top results for Society are similarly consistent,
with modest variations among the top 10. (not shown on the summary
table are results for the entire top 10. in Society, Mississauga and
Victoria dropped slightly from 2010 to 2014 but stay in the top 10.
Ottawa and Vancouver had previously ranked 6th and 7th.)
Looking more closely at “disappointments,” we note greater—but
typically not dramatic—variations for the most part. One notable
exception is Saguenay’s improvement in the Economy category,
climbing from 50th place in 2010 to 24th in 2014—a jump from a “D”
to a “B” grade, mostly from improved employment growth and a lower
unemployment rate. St. Catharines had already been a “D” Economy
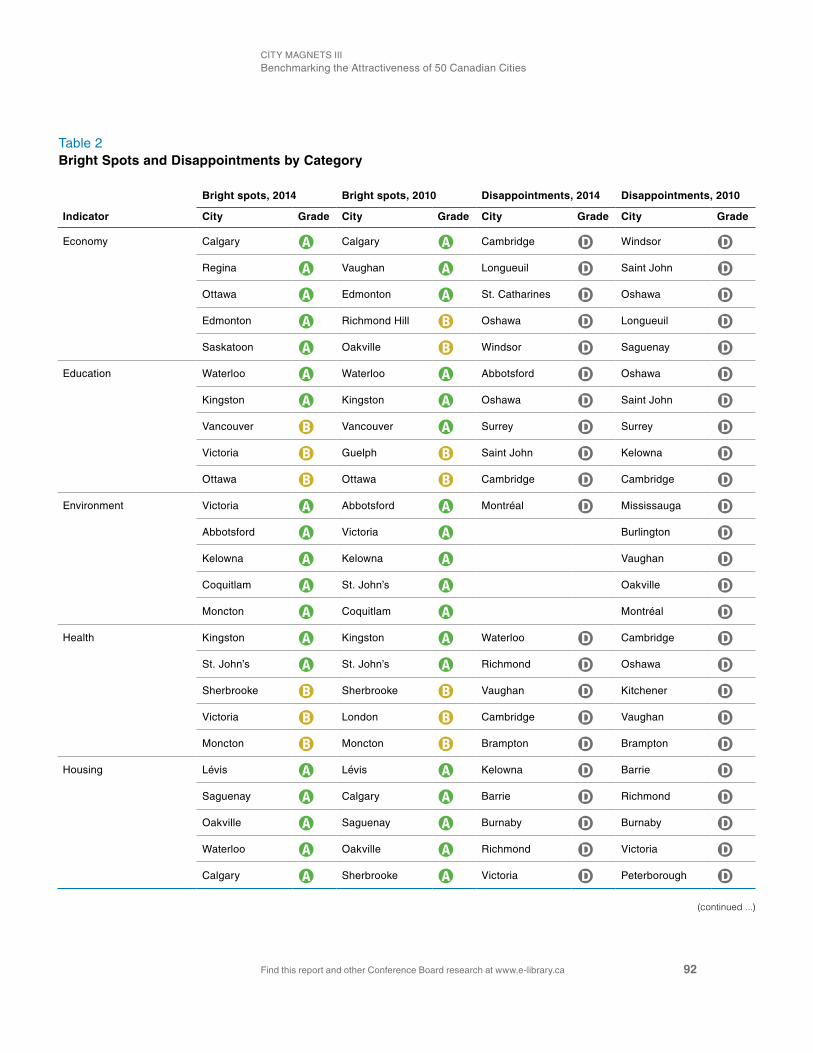
CiTy MAGnETS iiiBenchmarking the Attractiveness of 50 Canadian Cities
Find this report and other Conference Board research at www.e-library.ca 92
Table 2Bright Spots and Disappointments by Category
Indicator
Bright spots, 2014 Bright spots, 2010 Disappointments, 2014 Disappointments, 2010
City Grade City Grade City Grade City Grade
Economy Calgary A Calgary A Cambridge D Windsor D
Regina A Vaughan A Longueuil D Saint John D
Ottawa A Edmonton A St. Catharines D Oshawa D
Edmonton A Richmond Hill B Oshawa D Longueuil D
Saskatoon A Oakville B Windsor D Saguenay D
Education Waterloo A Waterloo A Abbotsford D Oshawa D
Kingston A Kingston A Oshawa D Saint John D
Vancouver B Vancouver A Surrey D Surrey D
Victoria B Guelph B Saint John D Kelowna D
Ottawa B Ottawa B Cambridge D Cambridge D
Environment Victoria A Abbotsford A Montréal D Mississauga D
Abbotsford A Victoria A Burlington D
Kelowna A Kelowna A Vaughan D
Coquitlam A St. John’s A Oakville D
Moncton A Coquitlam A Montréal D
Health Kingston A Kingston A Waterloo D Cambridge D
St. John’s A St. John’s A Richmond D Oshawa D
Sherbrooke B Sherbrooke B Vaughan D Kitchener D
Victoria B London B Cambridge D Vaughan D
Moncton B Moncton B Brampton D Brampton D
Housing Lévis A Lévis A Kelowna D Barrie D
Saguenay A Calgary A Barrie D Richmond D
Oakville A Saguenay A Burnaby D Burnaby D
Waterloo A Oakville A Richmond D Victoria D
Calgary A Sherbrooke A Victoria D Peterborough D
(continued ...)

Find this report and other Conference Board research at www.e-library.ca 93
Appendix A | The Conference Board of Canada
performer in 2010. in the Health category, Waterloo is the only city to
have experienced a significant change in outcomes since 2010, dropping
from a “C” grade (32nd) all the way to 46th. Waterloo lost ground on both
measures related to physicians in the community: general practitioners
and specialists. Once again, Saguenay is the outlier in the innovation
category; with a stronger economy, outcomes in innovation improved
enough to lift Saguenay from a “D” to a “C” city. Otherwise, the shifts
within the innovation category are minor: all other cities have “D” grades
in both reports despite small shifts in the ranking. The final variation
worth noting is Saskatoon’s improvement in the Society category, moving
from a disappointing 49th place in 2010 to 36th and a “C” grade in 2014.
Saskatoon’s gains in Society can be linked to its growth and economic
success, as evidenced by improvements on diversity, gender equality,
and young labour force population (aged 25–34).
Table 2 (cont’d)Bright Spots and Disappointments by Category
Indicator
Bright spots, 2014 Bright spots, 2010 Disappointments, 2014 Disappointments, 2010
City Grade City Grade City Grade City Grade
innovation Calgary A Calgary A Kelowna D Thunder Bay D
Richmond Hill A Richmond Hill A St. Catharines D Saguenay D
Waterloo A Ottawa (A) A Barrie D Sherbrooke D
Markham A St. John’s B Brantford D Brantford D
Ottawa A Markham B Abbotsford D Trois-Rivières D
Society Toronto A Toronto A) A Saguenay D Saguenay D
Montréal A Montréal A) A Kelowna D Saint John D
Vancouver A Victoria B Greater Sudbury D Trois-Rivières D
Ottawa A Mississauga B Trois-Rivières D Saskatoon D
Markham A Richmond Hill B Saint John D Kelowna D
Note: For each category, bright spots are the five top-ranked cities with at least a “B” grade. Disappointments are the five lowest-ranked cities with a “D” grade.Sources: The Conference Board of Canada; Statistics Canada.

CiTy MAGnETS iiiBenchmarking the Attractiveness of 50 Canadian Cities
Find this report and other Conference Board research at www.e-library.ca 94
Finally, while the overall picture of Canada’s biggest 50 cities has
changed little since City Magnets II, for a handful of cities, change is
significant. The uptick in the economy has meant progress and growth
for a number of cities particularly in the West, but it has left some others
behind—particularly, in southern Ontario. Saskatoon has powered its
way up 18 places to land just behind the top 10, propelled by economic
prosperity and growth. On the other hand, Barrie has fallen 17 places to
arrive at a disappointing 46th spot. Across Canada, migrants continue to
account for the main source of growth in urban areas, and as we have
learned, the factors that appeal to migrants with a university education
are representative of those of all.

Appendix B | The Conference Board of Canada
Find this and other Conference Board research at www.e-library.ca 95
APPENDIX B
Bibliography
Association of Universities and Colleges of Canada. Our Universities.
www.aucc.ca/canadian-universities/our-universities/.
Canadian Council on Learning. www.ccl-cca.ca/ccl/.
Canadian institute for Health information. www.cihi.ca/CiHi-ext-portal/
internet/En/Home/home/cihi000001.
Environment Canada. Municipal Water Use Data. www.ec.gc.ca/eau-
water/default.asp?lang=En&n=ED0E12D7-1.
Environment Canada. National Climate Data and Information Archive.
http://climate.weather.gc.ca/index_e.html#access.
insurance Bureau of Canada. Canada Inundated by Severe Weather
in 2013. news release, Toronto: iBC, January 20, 2014. www.ibc.ca/en/
Media_Centre/news_Releases/index.asp.
Lefebvre, Mario, and Marni Cappe. City Magnets: Benchmarking the
Attractiveness of Canada’s CMAs. Ottawa: The Conference Board of
Canada, 2007.
Ontario Ministry of the Environment and Climate Change. Smog Advisory
Statistics. www.airqualityontario.com/press/smog_advisories.php.
Partners for Climate Protection. National Measures Report 2012.
Ottawa: Federation of Canadian Municipalities, 2012. www.fcm.ca/
Documents/reports/PCP/2013/PCP_national_Measures_Report_
2012_Five_year_Edition_En.pdf.

CiTy MAGnETS iiiBenchmarking the Attractiveness of 50 Canadian Cities
Find this report and other Conference Board research at www.e-library.ca 96
Proud, Alex. “Cool London is Dead, and the Rich Kids Are to Blame.”
The Telegraph, April 7, 2014. www.telegraph.co.uk/men/thinking-
man/10744997/Cool-London-is-dead-and-the-rich-kids-are-to-blame.html.
Quebec Ministry of Sustainable Development, Environment, and the
Fight Against Climate Change. Portrait statistique: qualité de l’air et
smog. www.mddelcc.gouv.qc.ca/air/info-smog/portrait/.
Statistics Canada. 2011 Census of Canada. www12.statcan.gc.ca/
census-recensement/index-eng.cfm.
—. 2006 Census of Canada. www12.statcan.gc.ca/census-
recensement/2006/index-eng.cfm.
—. National Household Survey. www12.statcan.gc.ca/nhs-enm/index-
eng.cfm?HPA.
—. Table 252-0051 Crimes, by Type of Violation, and by Province
and Territory. www.statcan.gc.ca/tables-tableaux/sum-som/l01/cst01/
legal50b-eng.htm.
—. Tables 252-0075 to 252-0081, Incident-Based Crime Statistics, by
Detailed Violations and Police Services, 1998 to 2013. www5.statcan.
gc.ca/cansim/a03?lang=eng&pattern=252-0075..252-0090&p2=31.
Surowiecki, James. “Real Estate Goes Global.” The New Yorker,
May 26, 2014. www.newyorker.com/talk/financial/2014/05/26/140526ta_
talk_surowiecki.
The Conference Board of Canada. City Magnets II: Benchmarking the
Attractiveness of 50 Canadian Cities. Ottawa: CBoC, 2010.
—. “innovation,” How Canada Performs: A Report Card on Canada.
www.conferenceboard.ca/hcp/details/innovation.aspx.
Wiebe, Robin. “Vancouver Housing Markets Cannot Fully Escape the
Chinese Dragon.” The Conference Board of Canada, March 11, 2014.
www.conferenceboard.ca/economics/hot_eco_topics/default/13-03-11/
vancouver_housing_markets_cannot_fully_escape_the_chinese_dragon.
aspx.

Appendix C | The Conference Board of Canada
Find this and other Conference Board research at www.e-library.ca 97
APPENDIX C
Indicators of Performance in Each Category, by City
The following section outlines the performance of each city on every
indicator across the seven main categories. included is a letter grade
for each indicator, as well as the overall letter grade weighted by all
migrants. The Appendix is in alphabetical order.

CiTy MAGnETS iiiBenchmarking the Attractiveness of 50 Canadian Cities
Find this report and other Conference Board research at www.e-library.ca 98
Abbotsford D
Economy C
GDP per capita D
GDP growth B
Workforce travelling outside the city for work B
Employment growth A
Unemployment rate C
Disposable income per capita D
Knowledge employment D
Full-time employment D
Education D
Population with a bachelor’s degree D
Population with an advanced degree D
number of elementary and secondary school teachers D
number of university professors and college instructors D
Environment A
Average maximum temperature A
Air quality advisory days A
Domestic water use B
Driving distance to work for solo commuters A
Health D
Hospital bed availability D
Access to general practitioners D
Access to specialist physicians D
Population employed in health care services C
Population employed in occupations supporting health care B
Housing C
income spent on mortgage C
income spent on rent B
Homes in need of major repair B
Innovation D
Proportion of population employed in natural and applied science occupations D
Graduates in engineering, math, and science D
Productivity level C
Productivity growth C
Proportion of population employed in computer and information systems occupations D
Society C
Population aged 25–34 C
Foreign-born population C
Success of foreign-born population C
Diversity of population B
Evidence of multilingualism C
Population with low income B
Gender equality B
Population density D
Travel to work by public transit, walking, cycling D
Travel time to libraries B
Travel time to museums A
Proportion of population employed in cultural occupations C
incidence of violent crime B
incidence of drug crime B

Find this report and other Conference Board research at www.e-library.ca 99
Appendix C | The Conference Board of Canada
Barrie D
Economy C
GDP per capita D
GDP growth B
Workforce travelling outside the city for work B
Employment growth B
Unemployment rate C
Disposable income per capita C
Knowledge employment D
Full-time employment B
Education D
Population with a bachelor’s degree D
Population with an advanced degree D
number of elementary and secondary school teachers B
number of university professors and college instructors D
Environment A
Average maximum temperature B
Air quality advisory days C
Domestic water use A
Driving distance to work for solo commuters A
Health C
Hospital bed availability D
Access to general practitioners D
Access to specialist physicians D
Population employed in health care services B
Population employed in occupations supporting health care B
Housing D
income spent on mortgage D
income spent on rent D
Homes in need of major repair A
Innovation D
Proportion of population employed in natural and applied science occupations D
Graduates in engineering, math, and science D
Productivity level D
Productivity growth D
Proportion of population employed in computer and information systems occupations D
Society C
Population aged 25–34 C
Foreign-born population D
Success of foreign-born population C
Diversity of population B
Evidence of multilingualism D
Population with low income A
Gender equality B
Population density C
Travel to work by public transit, walking, cycling D
Travel time to libraries B
Travel time to museums B
Proportion of population employed in cultural occupations D
incidence of violent crime A
incidence of drug crime A

CiTy MAGnETS iiiBenchmarking the Attractiveness of 50 Canadian Cities
Find this report and other Conference Board research at www.e-library.ca 100
Brampton D
Economy C
GDP per capita D
GDP growth B
Workforce travelling outside the city for work D
Employment growth A
Unemployment rate C
Disposable income per capita D
Knowledge employment D
Full-time employment B
Education D
Population with a bachelor’s degree C
Population with an advanced degree C
number of elementary and secondary school teachers D
number of university professors and college instructors D
Environment C
Average maximum temperature B
Air quality advisory days C
Domestic water use B
Driving distance to work for solo commuters C
Health D
Hospital bed availability D
Access to general practitioners D
Access to specialist physicians D
Population employed in health care services D
Population employed in occupations supporting health care D
Housing C
income spent on mortgage D
income spent on rent B
Homes in need of major repair A
Innovation C
Proportion of population employed in natural and applied science occupations D
Graduates in engineering, math, and science C
Productivity level C
Productivity growth D
Proportion of population employed in computer and information systems occupations C
Society A
Population aged 25–34 C
Foreign-born population A
Success of foreign-born population C
Diversity of population A
Evidence of multilingualism B
Population with low income A
Gender equality A
Population density C
Travel to work by public transit, walking, cycling D
Travel time to libraries A
Travel time to museums A
Proportion of population employed in cultural occupations D
incidence of violent crime A
incidence of drug crime A

Find this report and other Conference Board research at www.e-library.ca 101
Appendix C | The Conference Board of Canada
Brantford D
Economy C
GDP per capita D
GDP growth C
Workforce travelling outside the city for work B
Employment growth C
Unemployment rate B
Disposable income per capita D
Knowledge employment D
Full-time employment B
Education D
Population with a bachelor’s degree D
Population with an advanced degree D
number of elementary and secondary school teachers B
number of university professors and college instructors D
Environment A
Average maximum temperature B
Air quality advisory days C
Domestic water use A
Driving distance to work for solo commuters A
Health D
Hospital bed availability D
Access to general practitioners D
Access to specialist physicians D
Population employed in health care services C
Population employed in occupations supporting health care B
Housing D
income spent on mortgage B
income spent on rent C
Homes in need of major repair C
Innovation D
Proportion of population employed in natural and applied science occupations D
Graduates in engineering, math, and science D
Productivity level D
Productivity growth C
Proportion of population employed in computer and information systems occupations D
Society C
Population aged 25–34 C
Foreign-born population D
Success of foreign-born population B
Diversity of population B
Evidence of multilingualism D
Population with low income B
Gender equality A
Population density D
Travel to work by public transit, walking, cycling D
Travel time to libraries A
Travel time to museums A
Proportion of population employed in cultural occupations D
incidence of violent crime C
incidence of drug crime B

CiTy MAGnETS iiiBenchmarking the Attractiveness of 50 Canadian Cities
Find this report and other Conference Board research at www.e-library.ca 102
Burlington C
Economy B
GDP per capita C
GDP growth C
Workforce travelling outside the city for work C
Employment growth B
Unemployment rate A
Disposable income per capita B
Knowledge employment C
Full-time employment A
Education B
Population with a bachelor’s degree B
Population with an advanced degree C
number of elementary and secondary school teachers A
number of university professors and college instructors D
Environment C
Average maximum temperature A
Air quality advisory days C
Domestic water use B
Driving distance to work for solo commuters D
Health D
Hospital bed availability D
Access to general practitioners C
Access to specialist physicians C
Population employed in health care services C
Population employed in occupations supporting health care D
Housing B
income spent on mortgage B
income spent on rent B
Homes in need of major repair A
Innovation C
Proportion of population employed in natural and applied science occupations C
Graduates in engineering, math, and science C
Productivity level C
Productivity growth D
Proportion of population employed in computer and information systems occupations C
Society B
Population aged 25–34 D
Foreign-born population C
Success of foreign-born population C
Diversity of population B
Evidence of multilingualism D
Population with low income A
Gender equality C
Population density D
Travel to work by public transit, walking, cycling D
Travel time to libraries A
Travel time to museums A
Proportion of population employed in cultural occupations D
incidence of violent crime A
incidence of drug crime A

Find this report and other Conference Board research at www.e-library.ca 103
Appendix C | The Conference Board of Canada
Burnaby B
Economy C
GDP per capita B
GDP growth B
Workforce travelling outside the city for work D
Employment growth B
Unemployment rate B
Disposable income per capita D
Knowledge employment C
Full-time employment B
Education C
Population with a bachelor’s degree B
Population with an advanced degree B
number of elementary and secondary school teachers D
number of university professors and college instructors D
Environment B
Average maximum temperature A
Air quality advisory days A
Domestic water use C
Driving distance to work for solo commuters C
Health C
Hospital bed availability C
Access to general practitioners D
Access to specialist physicians D
Population employed in health care services B
Population employed in occupations supporting health care C
Housing D
income spent on mortgage D
income spent on rent C
Homes in need of major repair C
Innovation A
Proportion of population employed in natural and applied science occupations B
Graduates in engineering, math, and science B
Productivity level C
Productivity growth B
Proportion of population employed in computer and information systems occupations B
Society B
Population aged 25–34 B
Foreign-born population A
Success of foreign-born population D
Diversity of population A
Evidence of multilingualism A
Population with low income C
Gender equality A
Population density C
Travel to work by public transit, walking, cycling B
Travel time to libraries A
Travel time to museums A
Proportion of population employed in cultural occupations D
incidence of violent crime A
incidence of drug crime B
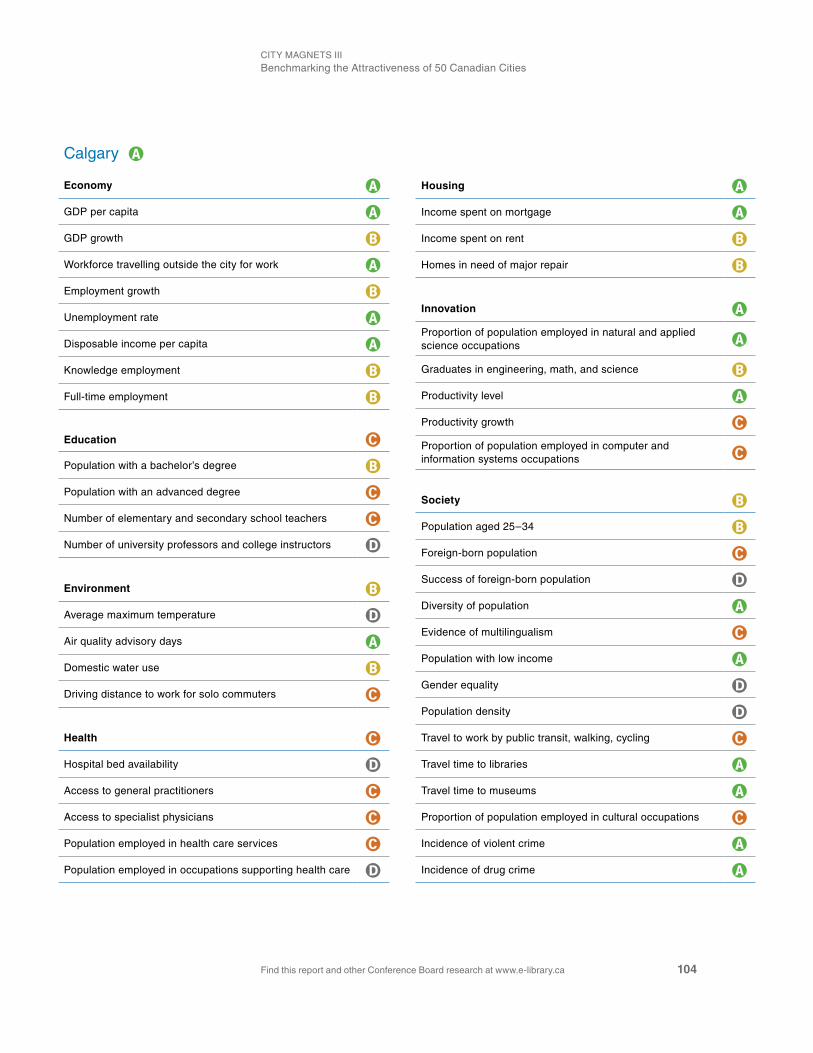
CiTy MAGnETS iiiBenchmarking the Attractiveness of 50 Canadian Cities
Find this report and other Conference Board research at www.e-library.ca 104
Calgary A
Economy A
GDP per capita A
GDP growth B
Workforce travelling outside the city for work A
Employment growth B
Unemployment rate A
Disposable income per capita A
Knowledge employment B
Full-time employment B
Education C
Population with a bachelor’s degree B
Population with an advanced degree C
number of elementary and secondary school teachers C
number of university professors and college instructors D
Environment B
Average maximum temperature D
Air quality advisory days A
Domestic water use B
Driving distance to work for solo commuters C
Health C
Hospital bed availability D
Access to general practitioners C
Access to specialist physicians C
Population employed in health care services C
Population employed in occupations supporting health care D
Housing A
income spent on mortgage A
income spent on rent B
Homes in need of major repair B
Innovation A
Proportion of population employed in natural and applied science occupations A
Graduates in engineering, math, and science B
Productivity level A
Productivity growth C
Proportion of population employed in computer and information systems occupations C
Society B
Population aged 25–34 B
Foreign-born population C
Success of foreign-born population D
Diversity of population A
Evidence of multilingualism C
Population with low income A
Gender equality D
Population density D
Travel to work by public transit, walking, cycling C
Travel time to libraries A
Travel time to museums A
Proportion of population employed in cultural occupations C
incidence of violent crime A
incidence of drug crime A

Find this report and other Conference Board research at www.e-library.ca 105
Appendix C | The Conference Board of Canada
Cambridge D
Economy D
GDP per capita C
GDP growth D
Workforce travelling outside the city for work C
Employment growth D
Unemployment rate C
Disposable income per capita D
Knowledge employment D
Full-time employment B
Education D
Population with a bachelor’s degree D
Population with an advanced degree D
number of elementary and secondary school teachers D
number of university professors and college instructors D
Environment B
Average maximum temperature B
Air quality advisory days C
Domestic water use A
Driving distance to work for solo commuters B
Health D
Hospital bed availability D
Access to general practitioners D
Access to specialist physicians D
Population employed in health care services D
Population employed in occupations supporting health care C
Housing C
income spent on mortgage C
income spent on rent B
Homes in need of major repair B
Innovation D
Proportion of population employed in natural and applied science occupations C
Graduates in engineering, math, and science D
Productivity level C
Productivity growth D
Proportion of population employed in computer and information systems occupations D
Society C
Population aged 25–34 C
Foreign-born population C
Success of foreign-born population C
Diversity of population B
Evidence of multilingualism D
Population with low income A
Gender equality B
Population density D
Travel to work by public transit, walking, cycling D
Travel time to libraries A
Travel time to museums A
Proportion of population employed in cultural occupations D
incidence of violent crime B
incidence of drug crime A

CiTy MAGnETS iiiBenchmarking the Attractiveness of 50 Canadian Cities
Find this report and other Conference Board research at www.e-library.ca 106
Coquitlam B
Economy D
GDP per capita D
GDP growth B
Workforce travelling outside the city for work D
Employment growth C
Unemployment rate B
Disposable income per capita D
Knowledge employment C
Full-time employment C
Education C
Population with a bachelor’s degree B
Population with an advanced degree C
number of elementary and secondary school teachers C
number of university professors and college instructors D
Environment A
Average maximum temperature A
Air quality advisory days A
Domestic water use C
Driving distance to work for solo commuters B
Health D
Hospital bed availability D
Access to general practitioners D
Access to specialist physicians D
Population employed in health care services B
Population employed in occupations supporting health care C
Housing D
income spent on mortgage D
income spent on rent C
Homes in need of major repair B
Innovation B
Proportion of population employed in natural and applied science occupations C
Graduates in engineering, math, and science B
Productivity level D
Productivity growth A
Proportion of population employed in computer and information systems occupations C
Society B
Population aged 25–34 C
Foreign-born population B
Success of foreign-born population D
Diversity of population A
Evidence of multilingualism B
Population with low income C
Gender equality B
Population density D
Travel to work by public transit, walking, cycling C
Travel time to libraries A
Travel time to museums A
Proportion of population employed in cultural occupations C
incidence of violent crime A
incidence of drug crime B

Find this report and other Conference Board research at www.e-library.ca 107
Appendix C | The Conference Board of Canada
Edmonton B
Economy A
GDP per capita A
GDP growth A
Workforce travelling outside the city for work A
Employment growth B
Unemployment rate B
Disposable income per capita B
Knowledge employment C
Full-time employment C
Education C
Population with a bachelor’s degree C
Population with an advanced degree C
number of elementary and secondary school teachers C
number of university professors and college instructors C
Environment B
Average maximum temperature D
Air quality advisory days A
Domestic water use A
Driving distance to work for solo commuters B
Health C
Hospital bed availability C
Access to general practitioners C
Access to specialist physicians C
Population employed in health care services B
Population employed in occupations supporting health care B
Housing B
income spent on mortgage B
income spent on rent B
Homes in need of major repair C
Innovation B
Proportion of population employed in natural and applied science occupations C
Graduates in engineering, math, and science C
Productivity level B
Productivity growth C
Proportion of population employed in computer and information systems occupations D
Society B
Population aged 25–34 A
Foreign-born population C
Success of foreign-born population C
Diversity of population A
Evidence of multilingualism C
Population with low income B
Gender equality B
Population density D
Travel to work by public transit, walking, cycling C
Travel time to libraries A
Travel time to museums A
Proportion of population employed in cultural occupations C
incidence of violent crime B
incidence of drug crime A

CiTy MAGnETS iiiBenchmarking the Attractiveness of 50 Canadian Cities
Find this report and other Conference Board research at www.e-library.ca 108
Gatineau C
Economy B
GDP per capita D
GDP growth A
Workforce travelling outside the city for work C
Employment growth A
Unemployment rate A
Disposable income per capita C
Knowledge employment B
Full-time employment B
Education C
Population with a bachelor’s degree C
Population with an advanced degree C
number of elementary and secondary school teachers B
number of university professors and college instructors C
Environment B
Average maximum temperature C
Air quality advisory days A
Domestic water use C
Driving distance to work for solo commuters B
Health D
Hospital bed availability D
Access to general practitioners D
Access to specialist physicians D
Population employed in health care services C
Population employed in occupations supporting health care C
Housing B
income spent on mortgage A
income spent on rent B
Homes in need of major repair C
Innovation C
Proportion of population employed in natural and applied science occupations C
Graduates in engineering, math, and science D
Productivity level D
Productivity growth C
Proportion of population employed in computer and information systems occupations B
Society B
Population aged 25–34 C
Foreign-born population D
Success of foreign-born population D
Diversity of population C
Evidence of multilingualism A
Population with low income B
Gender equality A
Population density D
Travel to work by public transit, walking, cycling C
Travel time to libraries A
Travel time to museums A
Proportion of population employed in cultural occupations A
incidence of violent crime B
incidence of drug crime B

Find this report and other Conference Board research at www.e-library.ca 109
Appendix C | The Conference Board of Canada
Greater Sudbury D
Economy C
GDP per capita C
GDP growth C
Workforce travelling outside the city for work A
Employment growth C
Unemployment rate B
Disposable income per capita C
Knowledge employment D
Full-time employment C
Education C
Population with a bachelor’s degree D
Population with an advanced degree D
number of elementary and secondary school teachers B
number of university professors and college instructors C
Environment B
Average maximum temperature D
Air quality advisory days A
Domestic water use B
Driving distance to work for solo commuters B
Health C
Hospital bed availability C
Access to general practitioners D
Access to specialist physicians C
Population employed in health care services B
Population employed in occupations supporting health care C
Housing C
income spent on mortgage B
income spent on rent B
Homes in need of major repair C
Innovation D
Proportion of population employed in natural and applied science occupations C
Graduates in engineering, math, and science D
Productivity level C
Productivity growth C
Proportion of population employed in computer and information systems occupations D
Society D
Population aged 25–34 C
Foreign-born population D
Success of foreign-born population B
Diversity of population C
Evidence of multilingualism B
Population with low income B
Gender equality B
Population density D
Travel to work by public transit, walking, cycling D
Travel time to libraries C
Travel time to museums D
Proportion of population employed in cultural occupations C
incidence of violent crime B
incidence of drug crime A

CiTy MAGnETS iiiBenchmarking the Attractiveness of 50 Canadian Cities
Find this report and other Conference Board research at www.e-library.ca 110
Guelph C
Economy B
GDP per capita B
GDP growth B
Workforce travelling outside the city for work B
Employment growth B
Unemployment rate B
Disposable income per capita C
Knowledge employment C
Full-time employment B
Education B
Population with a bachelor’s degree B
Population with an advanced degree B
number of elementary and secondary school teachers B
number of university professors and college instructors B
Environment B
Average maximum temperature B
Air quality advisory days C
Domestic water use A
Driving distance to work for solo commuters B
Health D
Hospital bed availability C
Access to general practitioners D
Access to specialist physicians D
Population employed in health care services D
Population employed in occupations supporting health care D
Housing C
income spent on mortgage B
income spent on rent C
Homes in need of major repair B
Innovation C
Proportion of population employed in natural and applied science occupations C
Graduates in engineering, math, and science C
Productivity level D
Productivity growth D
Proportion of population employed in computer and information systems occupations D
Society B
Population aged 25–34 B
Foreign-born population C
Success of foreign-born population B
Diversity of population B
Evidence of multilingualism D
Population with low income A
Gender equality A
Population density C
Travel to work by public transit, walking, cycling D
Travel time to libraries A
Travel time to museums A
Proportion of population employed in cultural occupations C
incidence of violent crime A
incidence of drug crime A

Find this report and other Conference Board research at www.e-library.ca 111
Appendix C | The Conference Board of Canada
Halifax B
Economy B
GDP per capita C
GDP growth B
Workforce travelling outside the city for work A
Employment growth C
Unemployment rate B
Disposable income per capita D
Knowledge employment C
Full-time employment A
Education C
Population with a bachelor’s degree B
Population with an advanced degree C
number of elementary and secondary school teachers C
number of university professors and college instructors C
Environment B
Average maximum temperature B
Air quality advisory days A
Domestic water use B
Driving distance to work for solo commuters B
Health B
Hospital bed availability C
Access to general practitioners C
Access to specialist physicians B
Population employed in health care services B
Population employed in occupations supporting health care A
Housing C
income spent on mortgage B
income spent on rent C
Homes in need of major repair C
Innovation C
Proportion of population employed in natural and applied science occupations C
Graduates in engineering, math, and science C
Productivity level D
Productivity growth C
Proportion of population employed in computer and information systems occupations C
Society C
Population aged 25–34 C
Foreign-born population D
Success of foreign-born population A
Diversity of population C
Evidence of multilingualism D
Population with low income B
Gender equality B
Population density D
Travel to work by public transit, walking, cycling C
Travel time to libraries C
Travel time to museums B
Proportion of population employed in cultural occupations C
incidence of violent crime B
incidence of drug crime B

CiTy MAGnETS iiiBenchmarking the Attractiveness of 50 Canadian Cities
Find this report and other Conference Board research at www.e-library.ca 112
Hamilton D
Economy C
GDP per capita D
GDP growth C
Workforce travelling outside the city for work B
Employment growth C
Unemployment rate C
Disposable income per capita D
Knowledge employment C
Full-time employment C
Education C
Population with a bachelor’s degree D
Population with an advanced degree C
number of elementary and secondary school teachers B
number of university professors and college instructors C
Environment B
Average maximum temperature B
Air quality advisory days C
Domestic water use B
Driving distance to work for solo commuters B
Health B
Hospital bed availability C
Access to general practitioners C
Access to specialist physicians C
Population employed in health care services B
Population employed in occupations supporting health care B
Housing C
income spent on mortgage B
income spent on rent C
Homes in need of major repair C
Innovation D
Proportion of population employed in natural and applied science occupations D
Graduates in engineering, math, and science D
Productivity level D
Productivity growth D
Proportion of population employed in computer and information systems occupations D
Society C
Population aged 25–34 C
Foreign-born population C
Success of foreign-born population C
Diversity of population B
Evidence of multilingualism C
Population with low income B
Gender equality B
Population density D
Travel to work by public transit, walking, cycling D
Travel time to libraries A
Travel time to museums A
Proportion of population employed in cultural occupations C
incidence of violent crime B
incidence of drug crime A

Find this report and other Conference Board research at www.e-library.ca 113
Appendix C | The Conference Board of Canada
Kelowna C
Economy C
GDP per capita C
GDP growth B
Workforce travelling outside the city for work A
Employment growth B
Unemployment rate B
Disposable income per capita C
Knowledge employment D
Full-time employment D
Education D
Population with a bachelor’s degree D
Population with an advanced degree D
number of elementary and secondary school teachers C
number of university professors and college instructors D
Environment A
Average maximum temperature B
Air quality advisory days A
Domestic water use B
Driving distance to work for solo commuters A
Health C
Hospital bed availability C
Access to general practitioners C
Access to specialist physicians C
Population employed in health care services A
Population employed in occupations supporting health care B
Housing D
income spent on mortgage C
income spent on rent D
Homes in need of major repair B
Innovation D
Proportion of population employed in natural and applied science occupations D
Graduates in engineering, math, and science D
Productivity level D
Productivity growth C
Proportion of population employed in computer and information systems occupations D
Society D
Population aged 25–34 C
Foreign-born population D
Success of foreign-born population C
Diversity of population B
Evidence of multilingualism D
Population with low income B
Gender equality B
Population density D
Travel to work by public transit, walking, cycling D
Travel time to libraries B
Travel time to museums A
Proportion of population employed in cultural occupations D
incidence of violent crime D
incidence of drug crime D

CiTy MAGnETS iiiBenchmarking the Attractiveness of 50 Canadian Cities
Find this report and other Conference Board research at www.e-library.ca 114
Kingston B
Economy B
GDP per capita C
GDP growth C
Workforce travelling outside the city for work A
Employment growth B
Unemployment rate C
Disposable income per capita C
Knowledge employment B
Full-time employment C
Education A
Population with a bachelor’s degree B
Population with an advanced degree B
number of elementary and secondary school teachers A
number of university professors and college instructors A
Environment B
Average maximum temperature B
Air quality advisory days B
Domestic water use B
Driving distance to work for solo commuters B
Health A
Hospital bed availability C
Access to general practitioners A
Access to specialist physicians A
Population employed in health care services A
Population employed in occupations supporting health care A
Housing C
income spent on mortgage B
income spent on rent D
Homes in need of major repair C
Innovation D
Proportion of population employed in natural and applied science occupations D
Graduates in engineering, math, and science C
Productivity level D
Productivity growth D
Proportion of population employed in computer and information systems occupations D
Society B
Population aged 25–34 C
Foreign-born population D
Success of foreign-born population B
Diversity of population B
Evidence of multilingualism D
Population with low income B
Gender equality B
Population density D
Travel to work by public transit, walking, cycling C
Travel time to libraries A
Travel time to museums A
Proportion of population employed in cultural occupations B
incidence of violent crime B
incidence of drug crime A
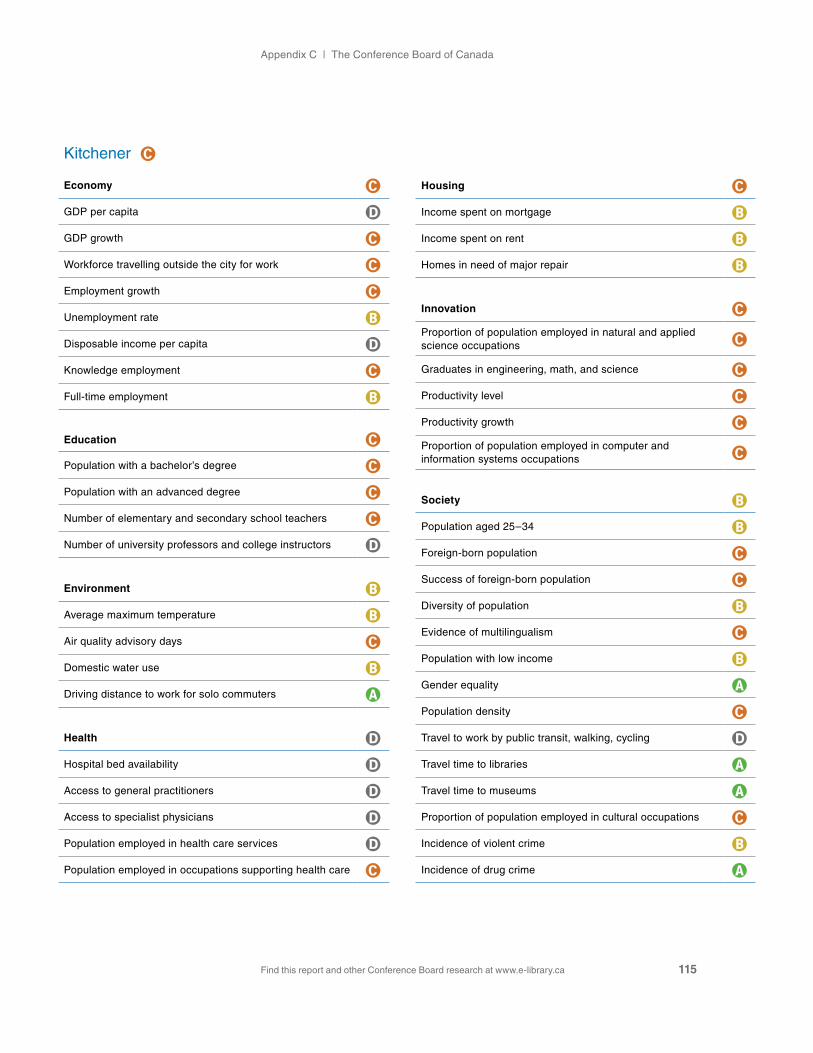
Find this report and other Conference Board research at www.e-library.ca 115
Appendix C | The Conference Board of Canada
Kitchener C
Economy C
GDP per capita D
GDP growth C
Workforce travelling outside the city for work C
Employment growth C
Unemployment rate B
Disposable income per capita D
Knowledge employment C
Full-time employment B
Education C
Population with a bachelor’s degree C
Population with an advanced degree C
number of elementary and secondary school teachers C
number of university professors and college instructors D
Environment B
Average maximum temperature B
Air quality advisory days C
Domestic water use B
Driving distance to work for solo commuters A
Health D
Hospital bed availability D
Access to general practitioners D
Access to specialist physicians D
Population employed in health care services D
Population employed in occupations supporting health care C
Housing C
income spent on mortgage B
income spent on rent B
Homes in need of major repair B
Innovation C
Proportion of population employed in natural and applied science occupations C
Graduates in engineering, math, and science C
Productivity level C
Productivity growth C
Proportion of population employed in computer and information systems occupations C
Society B
Population aged 25–34 B
Foreign-born population C
Success of foreign-born population C
Diversity of population B
Evidence of multilingualism C
Population with low income B
Gender equality A
Population density C
Travel to work by public transit, walking, cycling D
Travel time to libraries A
Travel time to museums A
Proportion of population employed in cultural occupations C
incidence of violent crime B
incidence of drug crime A

CiTy MAGnETS iiiBenchmarking the Attractiveness of 50 Canadian Cities
Find this report and other Conference Board research at www.e-library.ca 116
Laval C
Economy C
GDP per capita D
GDP growth B
Workforce travelling outside the city for work D
Employment growth B
Unemployment rate B
Disposable income per capita D
Knowledge employment C
Full-time employment C
Education D
Population with a bachelor’s degree C
Population with an advanced degree D
number of elementary and secondary school teachers C
number of university professors and college instructors D
Environment C
Average maximum temperature B
Air quality advisory days D
Domestic water use B
Driving distance to work for solo commuters C
Health D
Hospital bed availability D
Access to general practitioners D
Access to specialist physicians D
Population employed in health care services C
Population employed in occupations supporting health care C
Housing B
income spent on mortgage B
income spent on rent B
Homes in need of major repair B
Innovation C
Proportion of population employed in natural and applied science occupations C
Graduates in engineering, math, and science C
Productivity level D
Productivity growth C
Proportion of population employed in computer and information systems occupations C
Society B
Population aged 25–34 D
Foreign-born population C
Success of foreign-born population D
Diversity of population B
Evidence of multilingualism A
Population with low income B
Gender equality A
Population density C
Travel to work by public transit, walking, cycling C
Travel time to libraries A
Travel time to museums A
Proportion of population employed in cultural occupations D
incidence of violent crime B
incidence of drug crime A

Find this report and other Conference Board research at www.e-library.ca 117
Appendix C | The Conference Board of Canada
Lévis C
Economy B
GDP per capita D
GDP growth A
Workforce travelling outside the city for work C
Employment growth A
Unemployment rate A
Disposable income per capita D
Knowledge employment C
Full-time employment B
Education C
Population with a bachelor’s degree C
Population with an advanced degree D
number of elementary and secondary school teachers B
number of university professors and college instructors C
Environment B
Average maximum temperature D
Air quality advisory days A
Domestic water use B
Driving distance to work for solo commuters B
Health C
Hospital bed availability D
Access to general practitioners D
Access to specialist physicians C
Population employed in health care services A
Population employed in occupations supporting health care C
Housing A
income spent on mortgage A
income spent on rent A
Homes in need of major repair B
Innovation C
Proportion of population employed in natural and applied science occupations C
Graduates in engineering, math, and science D
Productivity level D
Productivity growth C
Proportion of population employed in computer and information systems occupations C
Society C
Population aged 25–34 C
Foreign-born population D
Success of foreign-born population D
Diversity of population D
Evidence of multilingualism C
Population with low income A
Gender equality A
Population density D
Travel to work by public transit, walking, cycling D
Travel time to libraries A
Travel time to museums A
Proportion of population employed in cultural occupations D
incidence of violent crime A
incidence of drug crime A

CiTy MAGnETS iiiBenchmarking the Attractiveness of 50 Canadian Cities
Find this report and other Conference Board research at www.e-library.ca 118
London C
Economy C
GDP per capita C
GDP growth C
Workforce travelling outside the city for work A
Employment growth C
Unemployment rate C
Disposable income per capita D
Knowledge employment C
Full-time employment C
Education C
Population with a bachelor’s degree C
Population with an advanced degree C
number of elementary and secondary school teachers B
number of university professors and college instructors C
Environment A
Average maximum temperature B
Air quality advisory days C
Domestic water use A
Driving distance to work for solo commuters A
Health B
Hospital bed availability C
Access to general practitioners B
Access to specialist physicians B
Population employed in health care services B
Population employed in occupations supporting health care C
Housing C
income spent on mortgage B
income spent on rent C
Homes in need of major repair B
Innovation D
Proportion of population employed in natural and applied science occupations D
Graduates in engineering, math, and science D
Productivity level D
Productivity growth D
Proportion of population employed in computer and information systems occupations D
Society B
Population aged 25–34 C
Foreign-born population C
Success of foreign-born population C
Diversity of population B
Evidence of multilingualism D
Population with low income B
Gender equality B
Population density D
Travel to work by public transit, walking, cycling C
Travel time to libraries A
Travel time to museums A
Proportion of population employed in cultural occupations C
incidence of violent crime B
incidence of drug crime A

Find this report and other Conference Board research at www.e-library.ca 119
Appendix C | The Conference Board of Canada
Longueuil C
Economy C
GDP per capita D
GDP growth B
Workforce travelling outside the city for work D
Employment growth B
Unemployment rate B
Disposable income per capita D
Knowledge employment D
Full-time employment C
Education D
Population with a bachelor’s degree D
Population with an advanced degree D
number of elementary and secondary school teachers C
number of university professors and college instructors D
Environment C
Average maximum temperature C
Air quality advisory days B
Domestic water use C
Driving distance to work for solo commuters C
Health D
Hospital bed availability D
Access to general practitioners D
Access to specialist physicians D
Population employed in health care services C
Population employed in occupations supporting health care B
Housing B
income spent on mortgage A
income spent on rent B
Homes in need of major repair C
Innovation C
Proportion of population employed in natural and applied science occupations C
Graduates in engineering, math, and science D
Productivity level D
Productivity growth B
Proportion of population employed in computer and information systems occupations C
Society B
Population aged 25–34 C
Foreign-born population D
Success of foreign-born population D
Diversity of population C
Evidence of multilingualism B
Population with low income C
Gender equality A
Population density C
Travel to work by public transit, walking, cycling B
Travel time to libraries A
Travel time to museums A
Proportion of population employed in cultural occupations C
incidence of violent crime A
incidence of drug crime A

CiTy MAGnETS iiiBenchmarking the Attractiveness of 50 Canadian Cities
Find this report and other Conference Board research at www.e-library.ca 120
Markham B
Economy C
GDP per capita C
GDP growth C
Workforce travelling outside the city for work D
Employment growth C
Unemployment rate B
Disposable income per capita C
Knowledge employment A
Full-time employment B
Education C
Population with a bachelor’s degree A
Population with an advanced degree B
number of elementary and secondary school teachers C
number of university professors and college instructors D
Environment C
Average maximum temperature B
Air quality advisory days C
Domestic water use A
Driving distance to work for solo commuters C
Health D
Hospital bed availability D
Access to general practitioners C
Access to specialist physicians D
Population employed in health care services D
Population employed in occupations supporting health care D
Housing B
income spent on mortgage B
income spent on rent C
Homes in need of major repair A
Innovation A
Proportion of population employed in natural and applied science occupations C
Graduates in engineering, math, and science A
Productivity level C
Productivity growth C
Proportion of population employed in computer and information systems occupations A
Society A
Population aged 25–34 C
Foreign-born population A
Success of foreign-born population C
Diversity of population A
Evidence of multilingualism A
Population with low income B
Gender equality B
Population density C
Travel to work by public transit, walking, cycling C
Travel time to libraries A
Travel time to museums A
Proportion of population employed in cultural occupations C
incidence of violent crime A
incidence of drug crime A

Find this report and other Conference Board research at www.e-library.ca 121
Appendix C | The Conference Board of Canada
Mississauga B
Economy B
GDP per capita B
GDP growth B
Workforce travelling outside the city for work C
Employment growth B
Unemployment rate C
Disposable income per capita C
Knowledge employment C
Full-time employment B
Education C
Population with a bachelor’s degree B
Population with an advanced degree B
number of elementary and secondary school teachers D
number of university professors and college instructors D
Environment C
Average maximum temperature B
Air quality advisory days C
Domestic water use B
Driving distance to work for solo commuters D
Health D
Hospital bed availability D
Access to general practitioners D
Access to specialist physicians D
Population employed in health care services D
Population employed in occupations supporting health care D
Housing C
income spent on mortgage C
income spent on rent C
Homes in need of major repair B
Innovation B
Proportion of population employed in natural and applied science occupations C
Graduates in engineering, math, and science B
Productivity level C
Productivity growth C
Proportion of population employed in computer and information systems occupations B
Society B
Population aged 25–34 C
Foreign-born population A
Success of foreign-born population D
Diversity of population A
Evidence of multilingualism B
Population with low income B
Gender equality B
Population density C
Travel to work by public transit, walking, cycling C
Travel time to libraries A
Travel time to museums A
Proportion of population employed in cultural occupations C
incidence of violent crime A
incidence of drug crime A

CiTy MAGnETS iiiBenchmarking the Attractiveness of 50 Canadian Cities
Find this report and other Conference Board research at www.e-library.ca 122
Moncton C
Economy B
GDP per capita A
GDP growth B
Workforce travelling outside the city for work A
Employment growth B
Unemployment rate B
Disposable income per capita D
Knowledge employment D
Full-time employment B
Education C
Population with a bachelor’s degree C
Population with an advanced degree D
number of elementary and secondary school teachers B
number of university professors and college instructors D
Environment A
Average maximum temperature C
Air quality advisory days A
Domestic water use A
Driving distance to work for solo commuters A
Health B
Hospital bed availability A
Access to general practitioners C
Access to specialist physicians C
Population employed in health care services B
Population employed in occupations supporting health care B
Housing C
income spent on mortgage B
income spent on rent C
Homes in need of major repair C
Innovation D
Proportion of population employed in natural and applied science occupations D
Graduates in engineering, math, and science D
Productivity level D
Productivity growth D
Proportion of population employed in computer and information systems occupations C
Society C
Population aged 25–34 B
Foreign-born population D
Success of foreign-born population D
Diversity of population D
Evidence of multilingualism B
Population with low income C
Gender equality A
Population density D
Travel to work by public transit, walking, cycling D
Travel time to libraries B
Travel time to museums A
Proportion of population employed in cultural occupations D
incidence of violent crime C
incidence of drug crime A

Find this report and other Conference Board research at www.e-library.ca 123
Appendix C | The Conference Board of Canada
Montréal C
Economy C
GDP per capita B
GDP growth C
Workforce travelling outside the city for work A
Employment growth C
Unemployment rate C
Disposable income per capita D
Knowledge employment B
Full-time employment D
Education B
Population with a bachelor’s degree B
Population with an advanced degree B
number of elementary and secondary school teachers C
number of university professors and college instructors C
Environment D
Average maximum temperature B
Air quality advisory days D
Domestic water use C
Driving distance to work for solo commuters D
Health C
Hospital bed availability D
Access to general practitioners C
Access to specialist physicians C
Population employed in health care services C
Population employed in occupations supporting health care C
Housing C
income spent on mortgage B
income spent on rent B
Homes in need of major repair D
Innovation C
Proportion of population employed in natural and applied science occupations C
Graduates in engineering, math, and science C
Productivity level D
Productivity growth C
Proportion of population employed in computer and information systems occupations C
Society A
Population aged 25–34 B
Foreign-born population B
Success of foreign-born population D
Diversity of population A
Evidence of multilingualism A
Population with low income D
Gender equality A
Population density A
Travel to work by public transit, walking, cycling A
Travel time to libraries A
Travel time to museums A
Proportion of population employed in cultural occupations A
incidence of violent crime B
incidence of drug crime A
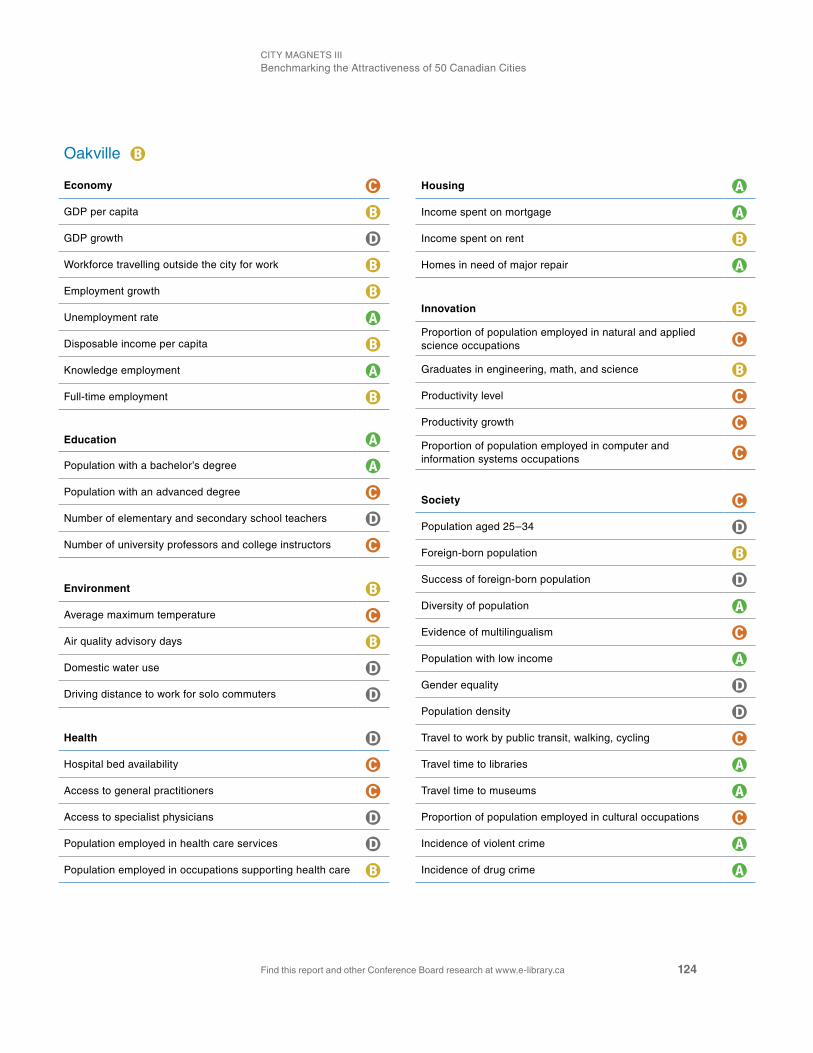
CiTy MAGnETS iiiBenchmarking the Attractiveness of 50 Canadian Cities
Find this report and other Conference Board research at www.e-library.ca 124
Oakville B
Economy C
GDP per capita B
GDP growth D
Workforce travelling outside the city for work B
Employment growth B
Unemployment rate A
Disposable income per capita B
Knowledge employment A
Full-time employment B
Education A
Population with a bachelor’s degree A
Population with an advanced degree C
number of elementary and secondary school teachers D
number of university professors and college instructors C
Environment B
Average maximum temperature C
Air quality advisory days B
Domestic water use D
Driving distance to work for solo commuters D
Health D
Hospital bed availability C
Access to general practitioners C
Access to specialist physicians D
Population employed in health care services D
Population employed in occupations supporting health care B
Housing A
income spent on mortgage A
income spent on rent B
Homes in need of major repair A
Innovation B
Proportion of population employed in natural and applied science occupations C
Graduates in engineering, math, and science B
Productivity level C
Productivity growth C
Proportion of population employed in computer and information systems occupations C
Society C
Population aged 25–34 D
Foreign-born population B
Success of foreign-born population D
Diversity of population A
Evidence of multilingualism C
Population with low income A
Gender equality D
Population density D
Travel to work by public transit, walking, cycling C
Travel time to libraries A
Travel time to museums A
Proportion of population employed in cultural occupations C
incidence of violent crime A
incidence of drug crime A

Find this report and other Conference Board research at www.e-library.ca 125
Appendix C | The Conference Board of Canada
Oshawa D
Economy D
GDP per capita D
GDP growth D
Workforce travelling outside the city for work C
Employment growth D
Unemployment rate D
Disposable income per capita D
Knowledge employment D
Full-time employment B
Education D
Population with a bachelor’s degree D
Population with an advanced degree D
number of elementary and secondary school teachers B
number of university professors and college instructors D
Environment B
Average maximum temperature B
Air quality advisory days C
Domestic water use B
Driving distance to work for solo commuters A
Health D
Hospital bed availability C
Access to general practitioners D
Access to specialist physicians D
Population employed in health care services C
Population employed in occupations supporting health care B
Housing D
income spent on mortgage C
income spent on rent C
Homes in need of major repair C
Innovation D
Proportion of population employed in natural and applied science occupations D
Graduates in engineering, math, and science D
Productivity level D
Productivity growth D
Proportion of population employed in computer and information systems occupations D
Society C
Population aged 25–34 C
Foreign-born population D
Success of foreign-born population B
Diversity of population B
Evidence of multilingualism D
Population with low income B
Gender equality A
Population density D
Travel to work by public transit, walking, cycling D
Travel time to libraries A
Travel time to museums A
Proportion of population employed in cultural occupations D
incidence of violent crime A
incidence of drug crime B

CiTy MAGnETS iiiBenchmarking the Attractiveness of 50 Canadian Cities
Find this report and other Conference Board research at www.e-library.ca 126
Ottawa A
Economy A
GDP per capita B
GDP growth B
Workforce travelling outside the city for work A
Employment growth B
Unemployment rate B
Disposable income per capita B
Knowledge employment A
Full-time employment A
Education B
Population with a bachelor’s degree A
Population with an advanced degree A
number of elementary and secondary school teachers C
number of university professors and college instructors C
Environment B
Average maximum temperature C
Air quality advisory days A
Domestic water use A
Driving distance to work for solo commuters D
Health C
Hospital bed availability D
Access to general practitioners C
Access to specialist physicians C
Population employed in health care services C
Population employed in occupations supporting health care C
Housing B
income spent on mortgage A
income spent on rent B
Homes in need of major repair C
Innovation B
Proportion of population employed in natural and applied science occupations B
Graduates in engineering, math, and science B
Productivity level C
Productivity growth D
Proportion of population employed in computer and information systems occupations A
Society A
Population aged 25–34 C
Foreign-born population C
Success of foreign-born population C
Diversity of population A
Evidence of multilingualism B
Population with low income A
Gender equality B
Population density D
Travel to work by public transit, walking, cycling B
Travel time to libraries A
Travel time to museums A
Proportion of population employed in cultural occupations A
incidence of violent crime A
incidence of drug crime A
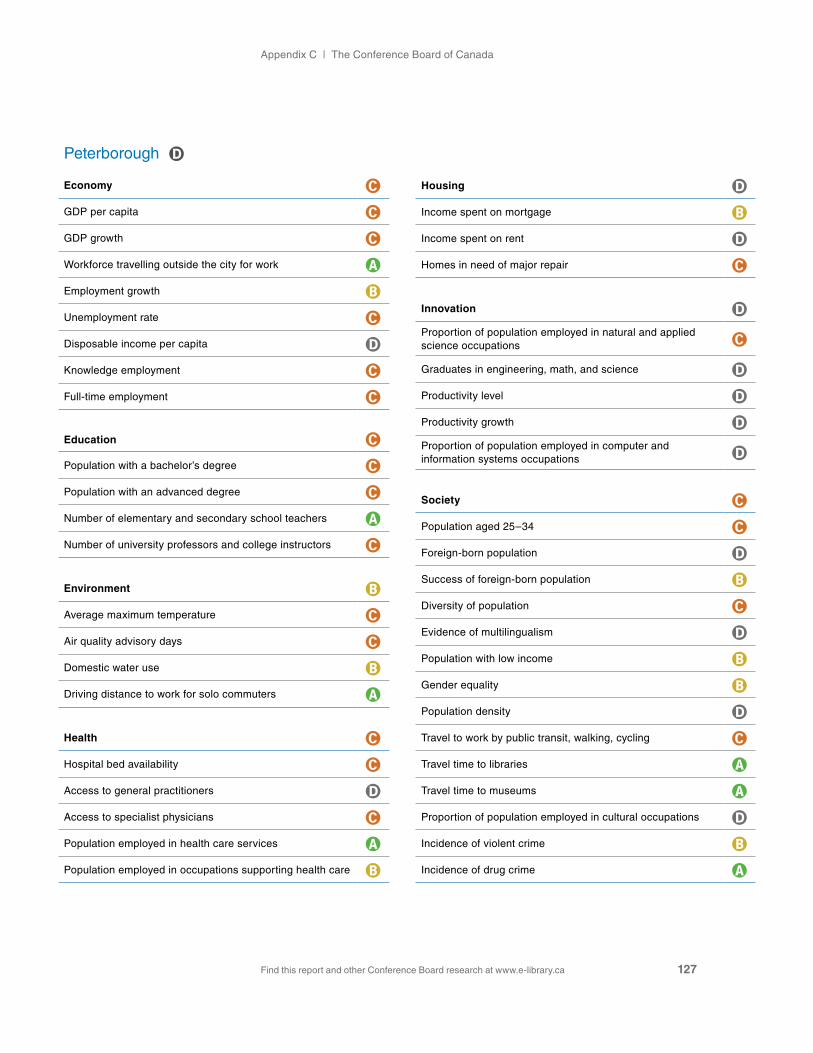
Find this report and other Conference Board research at www.e-library.ca 127
Appendix C | The Conference Board of Canada
Peterborough D
Economy C
GDP per capita C
GDP growth C
Workforce travelling outside the city for work A
Employment growth B
Unemployment rate C
Disposable income per capita D
Knowledge employment C
Full-time employment C
Education C
Population with a bachelor’s degree C
Population with an advanced degree C
number of elementary and secondary school teachers A
number of university professors and college instructors C
Environment B
Average maximum temperature C
Air quality advisory days C
Domestic water use B
Driving distance to work for solo commuters A
Health C
Hospital bed availability C
Access to general practitioners D
Access to specialist physicians C
Population employed in health care services A
Population employed in occupations supporting health care B
Housing D
income spent on mortgage B
income spent on rent D
Homes in need of major repair C
Innovation D
Proportion of population employed in natural and applied science occupations C
Graduates in engineering, math, and science D
Productivity level D
Productivity growth D
Proportion of population employed in computer and information systems occupations D
Society C
Population aged 25–34 C
Foreign-born population D
Success of foreign-born population B
Diversity of population C
Evidence of multilingualism D
Population with low income B
Gender equality B
Population density D
Travel to work by public transit, walking, cycling C
Travel time to libraries A
Travel time to museums A
Proportion of population employed in cultural occupations D
incidence of violent crime B
incidence of drug crime A

CiTy MAGnETS iiiBenchmarking the Attractiveness of 50 Canadian Cities
Find this report and other Conference Board research at www.e-library.ca 128
Québec City B
Economy B
GDP per capita C
GDP growth B
Workforce travelling outside the city for work A
Employment growth B
Unemployment rate A
Disposable income per capita D
Knowledge employment B
Full-time employment C
Education C
Population with a bachelor’s degree C
Population with an advanced degree C
number of elementary and secondary school teachers B
number of university professors and college instructors C
Environment C
Average maximum temperature D
Air quality advisory days B
Domestic water use B
Driving distance to work for solo commuters B
Health B
Hospital bed availability D
Access to general practitioners C
Access to specialist physicians B
Population employed in health care services B
Population employed in occupations supporting health care A
Housing A
income spent on mortgage A
income spent on rent B
Homes in need of major repair B
Innovation C
Proportion of population employed in natural and applied science occupations C
Graduates in engineering, math, and science D
Productivity level D
Productivity growth C
Proportion of population employed in computer and information systems occupations C
Society C
Population aged 25–34 B
Foreign-born population D
Success of foreign-born population D
Diversity of population D
Evidence of multilingualism C
Population with low income B
Gender equality A
Population density D
Travel to work by public transit, walking, cycling C
Travel time to libraries A
Travel time to museums A
Proportion of population employed in cultural occupations C
incidence of violent crime A
incidence of drug crime A

Find this report and other Conference Board research at www.e-library.ca 129
Appendix C | The Conference Board of Canada
Richmond B
Economy C
GDP per capita B
GDP growth B
Workforce travelling outside the city for work C
Employment growth C
Unemployment rate B
Disposable income per capita D
Knowledge employment C
Full-time employment D
Education C
Population with a bachelor’s degree B
Population with an advanced degree C
number of elementary and secondary school teachers D
number of university professors and college instructors D
Environment B
Average maximum temperature A
Air quality advisory days A
Domestic water use C
Driving distance to work for solo commuters C
Health D
Hospital bed availability D
Access to general practitioners D
Access to specialist physicians D
Population employed in health care services D
Population employed in occupations supporting health care D
Housing D
income spent on mortgage D
income spent on rent D
Homes in need of major repair C
Innovation B
Proportion of population employed in natural and applied science occupations C
Graduates in engineering, math, and science B
Productivity level C
Productivity growth B
Proportion of population employed in computer and information systems occupations C
Society B
Population aged 25–34 C
Foreign-born population A
Success of foreign-born population D
Diversity of population B
Evidence of multilingualism A
Population with low income D
Gender equality B
Population density C
Travel to work by public transit, walking, cycling C
Travel time to libraries A
Travel time to museums A
Proportion of population employed in cultural occupations C
incidence of violent crime A
incidence of drug crime C

CiTy MAGnETS iiiBenchmarking the Attractiveness of 50 Canadian Cities
Find this report and other Conference Board research at www.e-library.ca 130
Richmond Hill C
Economy B
GDP per capita D
GDP growth A
Workforce travelling outside the city for work D
Employment growth A
Unemployment rate B
Disposable income per capita C
Knowledge employment A
Full-time employment A
Education B
Population with a bachelor’s degree A
Population with an advanced degree A
number of elementary and secondary school teachers B
number of university professors and college instructors D
Environment B
Average maximum temperature B
Air quality advisory days C
Domestic water use A
Driving distance to work for solo commuters C
Health D
Hospital bed availability D
Access to general practitioners C
Access to specialist physicians D
Population employed in health care services D
Population employed in occupations supporting health care D
Housing B
income spent on mortgage C
income spent on rent C
Homes in need of major repair A
Innovation A
Proportion of population employed in natural and applied science occupations B
Graduates in engineering, math, and science A
Productivity level C
Productivity growth D
Proportion of population employed in computer and information systems occupations A
Society A
Population aged 25–34 D
Foreign-born population A
Success of foreign-born population D
Diversity of population A
Evidence of multilingualism A
Population with low income B
Gender equality B
Population density C
Travel to work by public transit, walking, cycling C
Travel time to libraries A
Travel time to museums A
Proportion of population employed in cultural occupations C
incidence of violent crime A
incidence of drug crime A

Find this report and other Conference Board research at www.e-library.ca 131
Appendix C | The Conference Board of Canada
Regina A
Economy A
GDP per capita B
GDP growth A
Workforce travelling outside the city for work A
Employment growth A
Unemployment rate A
Disposable income per capita C
Knowledge employment C
Full-time employment B
Education C
Population with a bachelor’s degree C
Population with an advanced degree D
number of elementary and secondary school teachers B
number of university professors and college instructors D
Environment A
Average maximum temperature D
Air quality advisory days A
Domestic water use A
Driving distance to work for solo commuters A
Health C
Hospital bed availability C
Access to general practitioners C
Access to specialist physicians D
Population employed in health care services B
Population employed in occupations supporting health care C
Housing C
income spent on mortgage A
income spent on rent C
Homes in need of major repair D
Innovation B
Proportion of population employed in natural and applied science occupations D
Graduates in engineering, math, and science D
Productivity level C
Productivity growth A
Proportion of population employed in computer and information systems occupations C
Society C
Population aged 25–34 B
Foreign-born population D
Success of foreign-born population C
Diversity of population C
Evidence of multilingualism D
Population with low income B
Gender equality B
Population density D
Travel to work by public transit, walking, cycling D
Travel time to libraries A
Travel time to museums A
Proportion of population employed in cultural occupations C
incidence of violent crime C
incidence of drug crime B

CiTy MAGnETS iiiBenchmarking the Attractiveness of 50 Canadian Cities
Find this report and other Conference Board research at www.e-library.ca 132
Saguenay C
Economy B
GDP per capita D
GDP growth B
Workforce travelling outside the city for work A
Employment growth B
Unemployment rate B
Disposable income per capita D
Knowledge employment D
Full-time employment C
Education D
Population with a bachelor’s degree D
Population with an advanced degree D
number of elementary and secondary school teachers B
number of university professors and college instructors C
Environment C
Average maximum temperature D
Air quality advisory days A
Domestic water use D
Driving distance to work for solo commuters A
Health C
Hospital bed availability D
Access to general practitioners D
Access to specialist physicians C
Population employed in health care services B
Population employed in occupations supporting health care B
Housing A
income spent on mortgage A
income spent on rent A
Homes in need of major repair B
Innovation D
Proportion of population employed in natural and applied science occupations C
Graduates in engineering, math, and science D
Productivity level D
Productivity growth C
Proportion of population employed in computer and information systems occupations D
Society D
Population aged 25–34 C
Foreign-born population D
Success of foreign-born population A
Diversity of population D
Evidence of multilingualism D
Population with low income B
Gender equality B
Population density D
Travel to work by public transit, walking, cycling D
Travel time to libraries B
Travel time to museums A
Proportion of population employed in cultural occupations D
incidence of violent crime B
incidence of drug crime A

Find this report and other Conference Board research at www.e-library.ca 133
Appendix C | The Conference Board of Canada
Saint John D
Economy B
GDP per capita B
GDP growth B
Workforce travelling outside the city for work A
Employment growth B
Unemployment rate C
Disposable income per capita D
Knowledge employment D
Full-time employment A
Education D
Population with a bachelor’s degree D
Population with an advanced degree D
number of elementary and secondary school teachers C
number of university professors and college instructors D
Environment C
Average maximum temperature C
Air quality advisory days A
Domestic water use D
Driving distance to work for solo commuters C
Health B
Hospital bed availability B
Access to general practitioners C
Access to specialist physicians D
Population employed in health care services A
Population employed in occupations supporting health care B
Housing B
income spent on mortgage B
income spent on rent D
Homes in need of major repair C
Innovation C
Proportion of population employed in natural and applied science occupations D
Graduates in engineering, math, and science D
Productivity level C
Productivity growth C
Proportion of population employed in computer and information systems occupations D
Society C
Population aged 25–34 D
Foreign-born population B
Success of foreign-born population D
Diversity of population D
Evidence of multilingualism D
Population with low income A
Gender equality D
Population density D
Travel to work by public transit, walking, cycling B
Travel time to libraries A
Travel time to museums D
Proportion of population employed in cultural occupations D
incidence of violent crime B
incidence of drug crime B

CiTy MAGnETS iiiBenchmarking the Attractiveness of 50 Canadian Cities
Find this report and other Conference Board research at www.e-library.ca 134
Saskatoon B
Economy A
GDP per capita C
GDP growth A
Workforce travelling outside the city for work A
Employment growth A
Unemployment rate A
Disposable income per capita C
Knowledge employment C
Full-time employment C
Education C
Population with a bachelor’s degree C
Population with an advanced degree C
number of elementary and secondary school teachers C
number of university professors and college instructors C
Environment A
Average maximum temperature D
Air quality advisory days A
Domestic water use B
Driving distance to work for solo commuters A
Health B
Hospital bed availability C
Access to general practitioners B
Access to specialist physicians B
Population employed in health care services A
Population employed in occupations supporting health care C
Housing C
income spent on mortgage A
income spent on rent C
Homes in need of major repair C
Innovation C
Proportion of population employed in natural and applied science occupations C
Graduates in engineering, math, and science C
Productivity level D
Productivity growth A
Proportion of population employed in computer and information systems occupations D
Society C
Population aged 25–34 B
Foreign-born population D
Success of foreign-born population C
Diversity of population B
Evidence of multilingualism D
Population with low income B
Gender equality B
Population density D
Travel to work by public transit, walking, cycling D
Travel time to libraries A
Travel time to museums A
Proportion of population employed in cultural occupations C
incidence of violent crime C
incidence of drug crime A

Find this report and other Conference Board research at www.e-library.ca 135
Appendix C | The Conference Board of Canada
Sherbrooke D
Economy C
GDP per capita D
GDP growth B
Workforce travelling outside the city for work A
Employment growth B
Unemployment rate B
Disposable income per capita D
Knowledge employment C
Full-time employment D
Education C
Population with a bachelor’s degree C
Population with an advanced degree C
number of elementary and secondary school teachers A
number of university professors and college instructors B
Environment A
Average maximum temperature D
Air quality advisory days A
Domestic water use A
Driving distance to work for solo commuters A
Health B
Hospital bed availability D
Access to general practitioners B
Access to specialist physicians A
Population employed in health care services A
Population employed in occupations supporting health care B
Housing B
income spent on mortgage A
income spent on rent B
Homes in need of major repair B
Innovation D
Proportion of population employed in natural and applied science occupations C
Graduates in engineering, math, and science D
Productivity level D
Productivity growth D
Proportion of population employed in computer and information systems occupations D
Society C
Population aged 25–34 C
Foreign-born population D
Success of foreign-born population D
Diversity of population D
Evidence of multilingualism B
Population with low income C
Gender equality A
Population density D
Travel to work by public transit, walking, cycling D
Travel time to libraries C
Travel time to museums A
Proportion of population employed in cultural occupations C
incidence of violent crime A
incidence of drug crime A

CiTy MAGnETS iiiBenchmarking the Attractiveness of 50 Canadian Cities
Find this report and other Conference Board research at www.e-library.ca 136
St. Catharines D
Economy D
GDP per capita D
GDP growth D
Workforce travelling outside the city for work B
Employment growth D
Unemployment rate C
Disposable income per capita D
Knowledge employment D
Full-time employment C
Education C
Population with a bachelor’s degree D
Population with an advanced degree D
number of elementary and secondary school teachers B
number of university professors and college instructors D
Environment A
Average maximum temperature A
Air quality advisory days C
Domestic water use B
Driving distance to work for solo commuters A
Health C
Hospital bed availability B
Access to general practitioners D
Access to specialist physicians D
Population employed in health care services C
Population employed in occupations supporting health care B
Housing C
income spent on mortgage B
income spent on rent C
Homes in need of major repair C
Innovation D
Proportion of population employed in natural and applied science occupations D
Graduates in engineering, math, and science D
Productivity level D
Productivity growth D
Proportion of population employed in computer and information systems occupations D
Society B
Population aged 25–34 D
Foreign-born population C
Success of foreign-born population B
Diversity of population B
Evidence of multilingualism D
Population with low income B
Gender equality B
Population density C
Travel to work by public transit, walking, cycling D
Travel time to libraries A
Travel time to museums A
Proportion of population employed in cultural occupations C
incidence of violent crime A
incidence of drug crime A

Find this report and other Conference Board research at www.e-library.ca 137
Appendix C | The Conference Board of Canada
St. John’s A
Economy A
GDP per capita A
GDP growth B
Workforce travelling outside the city for work A
Employment growth B
Unemployment rate B
Disposable income per capita C
Knowledge employment B
Full-time employment A
Education C
Population with a bachelor’s degree B
Population with an advanced degree B
number of elementary and secondary school teachers C
number of university professors and college instructors C
Environment A
Average maximum temperature C
Air quality advisory days A
Domestic water use A
Driving distance to work for solo commuters B
Health A
Hospital bed availability B
Access to general practitioners B
Access to specialist physicians A
Population employed in health care services A
Population employed in occupations supporting health care C
Housing B
income spent on mortgage A
income spent on rent B
Homes in need of major repair C
Innovation C
Proportion of population employed in natural and applied science occupations B
Graduates in engineering, math, and science C
Productivity level C
Productivity growth C
Proportion of population employed in computer and information systems occupations D
Society C
Population aged 25–34 B
Foreign-born population D
Success of foreign-born population A
Diversity of population D
Evidence of multilingualism D
Population with low income C
Gender equality B
Population density D
Travel to work by public transit, walking, cycling D
Travel time to libraries A
Travel time to museums A
Proportion of population employed in cultural occupations C
incidence of violent crime C
incidence of drug crime B

CiTy MAGnETS iiiBenchmarking the Attractiveness of 50 Canadian Cities
Find this report and other Conference Board research at www.e-library.ca 138
Surrey C
Economy C
GDP per capita D
GDP growth A
Workforce travelling outside the city for work C
Employment growth A
Unemployment rate B
Disposable income per capita D
Knowledge employment D
Full-time employment D
Education D
Population with a bachelor’s degree C
Population with an advanced degree C
number of elementary and secondary school teachers D
number of university professors and college instructors D
Environment A
Average maximum temperature A
Air quality advisory days A
Domestic water use C
Driving distance to work for solo commuters B
Health D
Hospital bed availability D
Access to general practitioners D
Access to specialist physicians D
Population employed in health care services B
Population employed in occupations supporting health care B
Housing B
income spent on mortgage D
income spent on rent A
Homes in need of major repair B
Innovation C
Proportion of population employed in natural and applied science occupations D
Graduates in engineering, math, and science D
Productivity level C
Productivity growth C
Proportion of population employed in computer and information systems occupations D
Society C
Population aged 25–34 C
Foreign-born population B
Success of foreign-born population D
Diversity of population A
Evidence of multilingualism B
Population with low income B
Gender equality B
Population density C
Travel to work by public transit, walking, cycling D
Travel time to libraries A
Travel time to museums A
Proportion of population employed in cultural occupations D
incidence of violent crime C
incidence of drug crime B

Find this report and other Conference Board research at www.e-library.ca 139
Appendix C | The Conference Board of Canada
Thunder Bay B
Economy C
GDP per capita C
GDP growth D
Workforce travelling outside the city for work A
Employment growth C
Unemployment rate B
Disposable income per capita D
Knowledge employment D
Full-time employment C
Education C
Population with a bachelor’s degree D
Population with an advanced degree D
number of elementary and secondary school teachers B
number of university professors and college instructors C
Environment B
Average maximum temperature D
Air quality advisory days A
Domestic water use B
Driving distance to work for solo commuters A
Health B
Hospital bed availability B
Access to general practitioners C
Access to specialist physicians C
Population employed in health care services A
Population employed in occupations supporting health care B
Housing B
income spent on mortgage A
income spent on rent B
Homes in need of major repair D
Innovation D
Proportion of population employed in natural and applied science occupations C
Graduates in engineering, math, and science D
Productivity level D
Productivity growth D
Proportion of population employed in computer and information systems occupations D
Society D
Population aged 25–34 C
Foreign-born population D
Success of foreign-born population A
Diversity of population B
Evidence of multilingualism D
Population with low income B
Gender equality A
Population density D
Travel to work by public transit, walking, cycling D
Travel time to libraries D
Travel time to museums B
Proportion of population employed in cultural occupations D
incidence of violent crime C
incidence of drug crime A
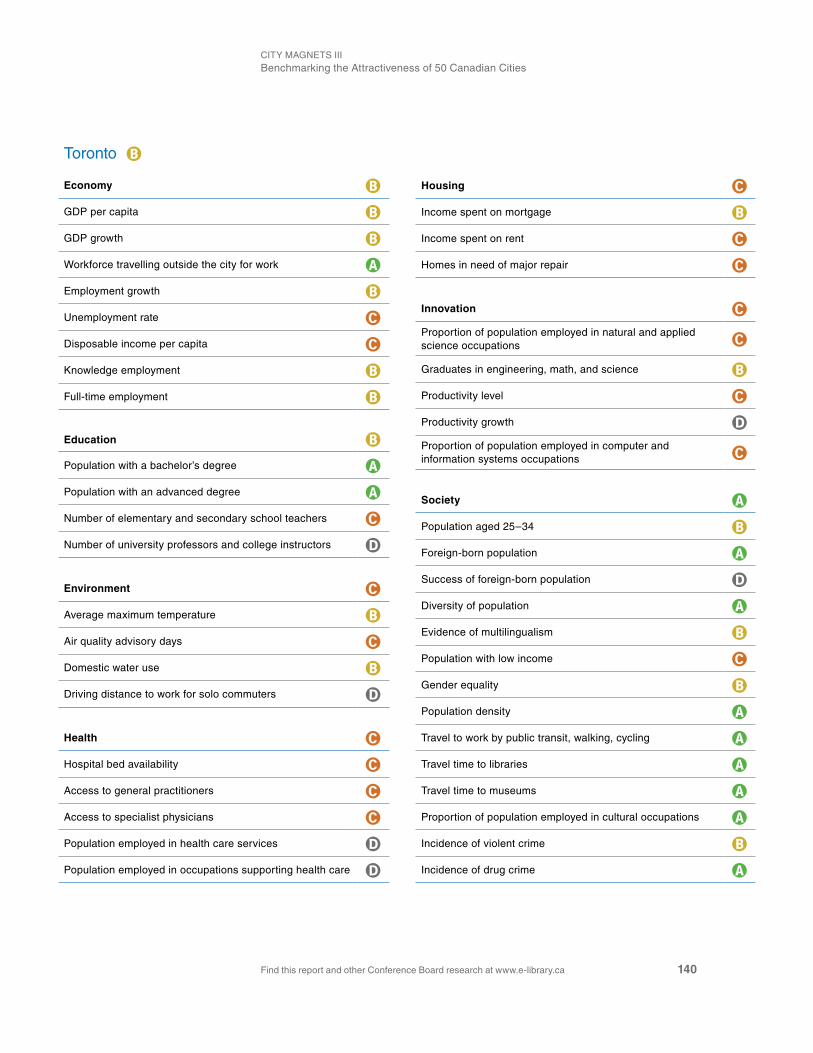
CiTy MAGnETS iiiBenchmarking the Attractiveness of 50 Canadian Cities
Find this report and other Conference Board research at www.e-library.ca 140
Toronto B
Economy B
GDP per capita B
GDP growth B
Workforce travelling outside the city for work A
Employment growth B
Unemployment rate C
Disposable income per capita C
Knowledge employment B
Full-time employment B
Education B
Population with a bachelor’s degree A
Population with an advanced degree A
number of elementary and secondary school teachers C
number of university professors and college instructors D
Environment C
Average maximum temperature B
Air quality advisory days C
Domestic water use B
Driving distance to work for solo commuters D
Health C
Hospital bed availability C
Access to general practitioners C
Access to specialist physicians C
Population employed in health care services D
Population employed in occupations supporting health care D
Housing C
income spent on mortgage B
income spent on rent C
Homes in need of major repair C
Innovation C
Proportion of population employed in natural and applied science occupations C
Graduates in engineering, math, and science B
Productivity level C
Productivity growth D
Proportion of population employed in computer and information systems occupations C
Society A
Population aged 25–34 B
Foreign-born population A
Success of foreign-born population D
Diversity of population A
Evidence of multilingualism B
Population with low income C
Gender equality B
Population density A
Travel to work by public transit, walking, cycling A
Travel time to libraries A
Travel time to museums A
Proportion of population employed in cultural occupations A
incidence of violent crime B
incidence of drug crime A

Find this report and other Conference Board research at www.e-library.ca 141
Appendix C | The Conference Board of Canada
Trois-Rivières D
Economy C
GDP per capita D
GDP growth B
Workforce travelling outside the city for work A
Employment growth B
Unemployment rate B
Disposable income per capita D
Knowledge employment D
Full-time employment D
Education C
Population with a bachelor’s degree D
Population with an advanced degree D
number of elementary and secondary school teachers B
number of university professors and college instructors C
Environment B
Average maximum temperature C
Air quality advisory days B
Domestic water use B
Driving distance to work for solo commuters A
Health C
Hospital bed availability C
Access to general practitioners D
Access to specialist physicians D
Population employed in health care services B
Population employed in occupations supporting health care A
Housing B
income spent on mortgage A
income spent on rent B
Homes in need of major repair C
Innovation D
Proportion of population employed in natural and applied science occupations C
Graduates in engineering, math, and science D
Productivity level D
Productivity growth C
Proportion of population employed in computer and information systems occupations D
Society D
Population aged 25–34 C
Foreign-born population D
Success of foreign-born population C
Diversity of population D
Evidence of multilingualism C
Population with low income C
Gender equality B
Population density D
Travel to work by public transit, walking, cycling D
Travel time to libraries A
Travel time to museums A
Proportion of population employed in cultural occupations D
incidence of violent crime A
incidence of drug crime C

CiTy MAGnETS iiiBenchmarking the Attractiveness of 50 Canadian Cities
Find this report and other Conference Board research at www.e-library.ca 142
Vancouver A
Economy B
GDP per capita B
GDP growth B
Workforce travelling outside the city for work B
Employment growth B
Unemployment rate B
Disposable income per capita C
Knowledge employment A
Full-time employment D
Education B
Population with a bachelor’s degree A
Population with an advanced degree A
number of elementary and secondary school teachers B
number of university professors and college instructors C
Environment A
Average maximum temperature A
Air quality advisory days A
Domestic water use C
Driving distance to work for solo commuters B
Health B
Hospital bed availability C
Access to general practitioners B
Access to specialist physicians A
Population employed in health care services C
Population employed in occupations supporting health care D
Housing D
income spent on mortgage C
income spent on rent C
Homes in need of major repair D
Innovation B
Proportion of population employed in natural and applied science occupations C
Graduates in engineering, math, and science B
Productivity level C
Productivity growth C
Proportion of population employed in computer and information systems occupations C
Society A
Population aged 25–34 A
Foreign-born population B
Success of foreign-born population C
Diversity of population A
Evidence of multilingualism B
Population with low income C
Gender equality B
Population density A
Travel to work by public transit, walking, cycling A
Travel time to libraries A
Travel time to museums A
Proportion of population employed in cultural occupations A
incidence of violent crime C
incidence of drug crime B

Find this report and other Conference Board research at www.e-library.ca 143
Appendix C | The Conference Board of Canada
Vaughan C
Economy B
GDP per capita C
GDP growth B
Workforce travelling outside the city for work D
Employment growth B
Unemployment rate B
Disposable income per capita C
Knowledge employment B
Full-time employment A
Education C
Population with a bachelor’s degree B
Population with an advanced degree B
number of elementary and secondary school teachers B
number of university professors and college instructors D
Environment C
Average maximum temperature B
Air quality advisory days C
Domestic water use B
Driving distance to work for solo commuters D
Health D
Hospital bed availability D
Access to general practitioners C
Access to specialist physicians D
Population employed in health care services D
Population employed in occupations supporting health care D
Housing B
income spent on mortgage C
income spent on rent C
Homes in need of major repair A
Innovation B
Proportion of population employed in natural and applied science occupations C
Graduates in engineering, math, and science B
Productivity level C
Productivity growth C
Proportion of population employed in computer and information systems occupations C
Society B
Population aged 25–34 C
Foreign-born population A
Success of foreign-born population C
Diversity of population A
Evidence of multilingualism A
Population with low income A
Gender equality C
Population density D
Travel to work by public transit, walking, cycling D
Travel time to libraries A
Travel time to museums A
Proportion of population employed in cultural occupations D
incidence of violent crime A
incidence of drug crime A

CiTy MAGnETS iiiBenchmarking the Attractiveness of 50 Canadian Cities
Find this report and other Conference Board research at www.e-library.ca 144
Victoria B
Economy B
GDP per capita A
GDP growth C
Workforce travelling outside the city for work B
Employment growth C
Unemployment rate B
Disposable income per capita D
Knowledge employment B
Full-time employment D
Education B
Population with a bachelor’s degree A
Population with an advanced degree B
number of elementary and secondary school teachers B
number of university professors and college instructors C
Environment A
Average maximum temperature A
Air quality advisory days A
Domestic water use C
Driving distance to work for solo commuters A
Health B
Hospital bed availability A
Access to general practitioners C
Access to specialist physicians C
Population employed in health care services A
Population employed in occupations supporting health care B
Housing D
income spent on mortgage C
income spent on rent D
Homes in need of major repair C
Innovation C
Proportion of population employed in natural and applied science occupations C
Graduates in engineering, math, and science C
Productivity level D
Productivity growth C
Proportion of population employed in computer and information systems occupations C
Society B
Population aged 25–34 A
Foreign-born population C
Success of foreign-born population B
Diversity of population B
Evidence of multilingualism D
Population with low income C
Gender equality A
Population density A
Travel to work by public transit, walking, cycling A
Travel time to libraries A
Travel time to museums A
Proportion of population employed in cultural occupations A
incidence of violent crime D
incidence of drug crime D

Find this report and other Conference Board research at www.e-library.ca 145
Appendix C | The Conference Board of Canada
Waterloo A
Economy A
GDP per capita A
GDP growth A
Workforce travelling outside the city for work C
Employment growth A
Unemployment rate B
Disposable income per capita B
Knowledge employment A
Full-time employment B
Education A
Population with a bachelor’s degree A
Population with an advanced degree A
number of elementary and secondary school teachers A
number of university professors and college instructors A
Environment B
Average maximum temperature B
Air quality advisory days C
Domestic water use A
Driving distance to work for solo commuters B
Health D
Hospital bed availability D
Access to general practitioners C
Access to specialist physicians D
Population employed in health care services D
Population employed in occupations supporting health care D
Housing A
income spent on mortgage A
income spent on rent C
Homes in need of major repair A
Innovation A
Proportion of population employed in natural and applied science occupations B
Graduates in engineering, math, and science A
Productivity level C
Productivity growth C
Proportion of population employed in computer and information systems occupations A
Society B
Population aged 25–34 C
Foreign-born population C
Success of foreign-born population C
Diversity of population A
Evidence of multilingualism C
Population with low income A
Gender equality C
Population density C
Travel to work by public transit, walking, cycling D
Travel time to libraries A
Travel time to museums A
Proportion of population employed in cultural occupations C
incidence of violent crime B
incidence of drug crime A

CiTy MAGnETS iiiBenchmarking the Attractiveness of 50 Canadian Cities
Find this report and other Conference Board research at www.e-library.ca 146
Windsor D
Economy D
GDP per capita C
GDP growth D
Workforce travelling outside the city for work A
Employment growth D
Unemployment rate D
Disposable income per capita D
Knowledge employment D
Full-time employment C
Education D
Population with a bachelor’s degree C
Population with an advanced degree C
number of elementary and secondary school teachers C
number of university professors and college instructors D
Environment B
Average maximum temperature A
Air quality advisory days D
Domestic water use B
Driving distance to work for solo commuters B
Health C
Hospital bed availability C
Access to general practitioners D
Access to specialist physicians D
Population employed in health care services C
Population employed in occupations supporting health care B
Housing C
income spent on mortgage B
income spent on rent C
Homes in need of major repair C
Innovation D
Proportion of population employed in natural and applied science occupations D
Graduates in engineering, math, and science D
Productivity level D
Productivity growth D
Proportion of population employed in computer and information systems occupations D
Society B
Population aged 25–34 C
Foreign-born population C
Success of foreign-born population B
Diversity of population A
Evidence of multilingualism C
Population with low income D
Gender equality B
Population density C
Travel to work by public transit, walking, cycling D
Travel time to libraries A
Travel time to museums A
Proportion of population employed in cultural occupations C
incidence of violent crime B
incidence of drug crime A

Find this report and other Conference Board research at www.e-library.ca 147
Appendix C | The Conference Board of Canada
Winnipeg B
Economy B
GDP per capita C
GDP growth B
Workforce travelling outside the city for work A
Employment growth B
Unemployment rate A
Disposable income per capita D
Knowledge employment C
Full-time employment B
Education C
Population with a bachelor’s degree C
Population with an advanced degree C
number of elementary and secondary school teachers C
number of university professors and college instructors D
Environment B
Average maximum temperature D
Air quality advisory days A
Domestic water use A
Driving distance to work for solo commuters B
Health C
Hospital bed availability C
Access to general practitioners D
Access to specialist physicians B
Population employed in health care services B
Population employed in occupations supporting health care B
Housing C
income spent on mortgage A
income spent on rent B
Homes in need of major repair D
Innovation C
Proportion of population employed in natural and applied science occupations C
Graduates in engineering, math, and science D
Productivity level D
Productivity growth B
Proportion of population employed in computer and information systems occupations D
Society B
Population aged 25–34 C
Foreign-born population C
Success of foreign-born population C
Diversity of population B
Evidence of multilingualism C
Population with low income B
Gender equality B
Population density C
Travel to work by public transit, walking, cycling C
Travel time to libraries A
Travel time to museums A
Proportion of population employed in cultural occupations C
incidence of violent crime C
incidence of drug crime A

conferenceboard.ca
The MoreEnlightened Way to Make Business Decisions.If your organization, program, or project requires expertise in economic
or organizational performance or public policy, talk to us fi rst. You’ll
fi nd the expertise and knowledge you need to make more enlightened
decisions with The Conference Board of Canada.
ServicesExecutive NetworksExchange ideas and make new contacts on strategic issues
e-LibraryAccess to in-depth insights … when you need them most
The Niagara InstituteDevelop leaders of the future through interactive and engaging leadership development programs
The Directors CollegeCanada’s university-accredited corporate director development program
Custom ResearchTap into our research expertise to address your specific issues
Customized SolutionsHelp your organization meet challenges and sustain performance
e-DataStay on top of major economic trends
Conferences, Seminars, Webinars, and WorkshopsLearn from best-practice organizations and industry experts

About The Conference Board of Canada
We are:
• The foremost independent, not-for-profit, applied research organization in Canada.
• Objective and non-partisan. We do not lobby for specific interests.• Funded exclusively through the fees we charge for services to the
private and public sectors.• Experts in running conferences but also at conducting, publishing,
and disseminating research; helping people network; developing individual leadership skills; and building organizational capacity.
• Specialists in economic trends, as well as organizational performance and public policy issues.
• Not a government department or agency, although we are often hired to provide services for all levels of government.
• Independent from, but affiliated with, The Conference Board, Inc. of New York, which serves nearly 2,000 companies in 60 nations and has offices in Brussels and Hong Kong.

Insights. Understanding. Impact.
255 Smyth Road, Ottawa On
K1H 8M7 Canada
Tel. 613-526-3280
Fax 613-526-4857
inquiries 1-866-711-2262
conferenceboard.ca
PUBLiCATiOn 6441
E-COPy: $675