city gas distribution in india - a virtual conference
TRANSCRIPT

City Gas Distribution in India - A Virtual Conference
Session: Key Trends, Developments And Post-Covid-19 Outlook
India Infrastructure
January 21, 2021

Mr. Prashant VasishtVice President and Co-Head, Corporate RatingsICRA Limited
Speaker
Agenda
01 02
0504
03
06
Trends Impact of Covid-19
OutlookKey Issues and
Challenges
3
Performance of
Incumbents during
Covid-19
Opportunities for CGD
Companies
City Gas Distribution: Trends
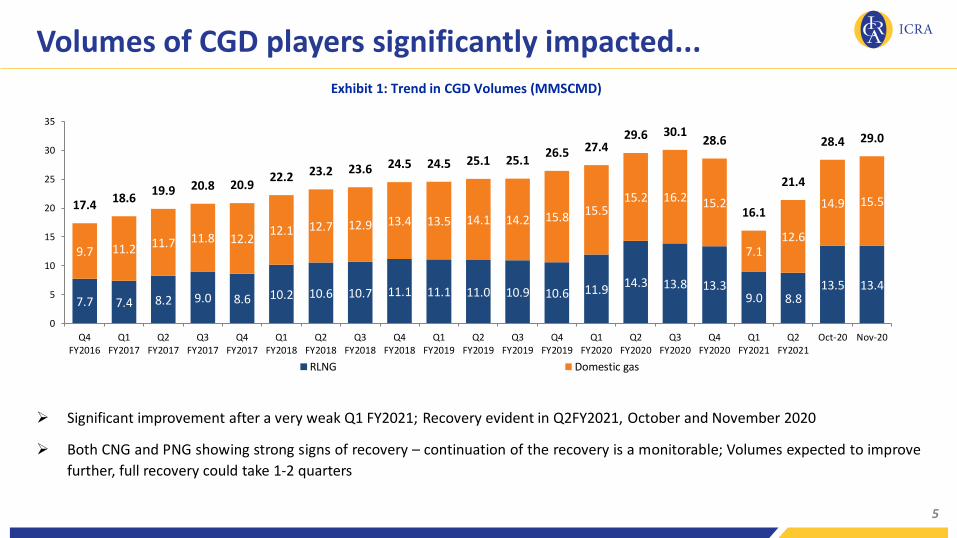
Volumes of CGD players significantly impacted...
➢ Significant improvement after a very weak Q1 FY2021; Recovery evident in Q2FY2021, October and November 2020
➢ Both CNG and PNG showing strong signs of recovery – continuation of the recovery is a monitorable; Volumes expected to improve
further, full recovery could take 1-2 quarters
5
Exhibit 1: Trend in CGD Volumes (MMSCMD)
7.7 7.4 8.2 9.0 8.6 10.2 10.6 10.7 11.1 11.1 11.0 10.9 10.6 11.914.3 13.8 13.3
9.0 8.813.5 13.4
9.7 11.2 11.7 11.8 12.212.1 12.7 12.9 13.4 13.5 14.1 14.2 15.8 15.5
15.2 16.2 15.2
7.112.6
14.9 15.517.418.6
19.9 20.8 20.922.2 23.2 23.6 24.5 24.5 25.1 25.1
26.5 27.429.6 30.1
28.6
16.1
21.4
28.4 29.0
0
5
10
15
20
25
30
35
Q4FY2016
Q1FY2017
Q2FY2017
Q3FY2017
Q4FY2017
Q1FY2018
Q2FY2018
Q3FY2018
Q4FY2018
Q1FY2019
Q2FY2019
Q3FY2019
Q4FY2019
Q1FY2020
Q2FY2020
Q3FY2020
Q4FY2020
Q1FY2021
Q2FY2021
Oct-20 Nov-20
RLNG Domestic gas
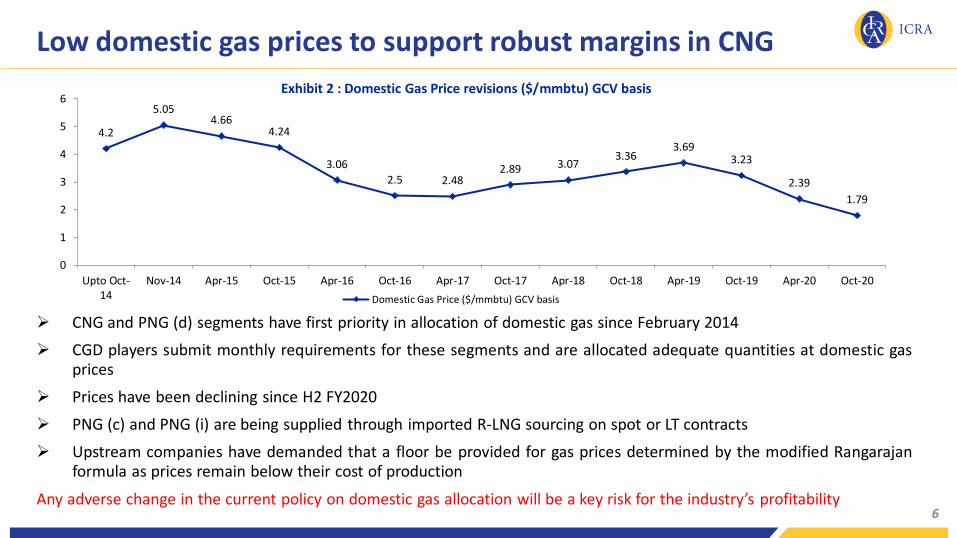
Low domestic gas prices to support robust margins in CNG
➢ CNG and PNG (d) segments have first priority in allocation of domestic gas since February 2014
➢ CGD players submit monthly requirements for these segments and are allocated adequate quantities at domestic gasprices
➢ Prices have been declining since H2 FY2020
➢ PNG (c) and PNG (i) are being supplied through imported R-LNG sourcing on spot or LT contracts
➢ Upstream companies have demanded that a floor be provided for gas prices determined by the modified Rangarajanformula as prices remain below their cost of production
Any adverse change in the current policy on domestic gas allocation will be a key risk for the industry’s profitability6
Exhibit 2 : Domestic Gas Price revisions ($/mmbtu) GCV basis
4.2
5.054.66
4.24
3.06
2.5 2.482.89 3.07
3.363.69
3.23
2.39
1.79
0
1
2
3
4
5
6
Upto Oct-14
Nov-14 Apr-15 Oct-15 Apr-16 Oct-16 Apr-17 Oct-17 Apr-18 Oct-18 Apr-19 Oct-19 Apr-20 Oct-20
Domestic Gas Price ($/mmbtu) GCV basis

CNG and PNG (d) cost competitive
7
Traditional Fuels City Gas
City Gas
cheaper on
energy terms
by
Fuel Selling Unit Selling
Price
Gross
Calorific
Value (GCV)
GCV Unit Energy Cost
(Rs/million
Kcal)
Fuel Selling
Price
Selling
Unit
Energy Cost
(Rs/million
Kcal)^
MS Rs./litre 85.0 8419 Kcal/litre 10091 CNG 42.70 Rs./kg 3389 66%HSD Rs./litre 75.1 9036 Kcal/litre 8315 CNG 42.70 Rs./Kg 3389 59%Auto LPG Rs./litre 46.6 10800 Kcal/kg 7987 CNG 42.70 Rs./Kg 3389 58%Sub. LPG Rs./Cylinder 694 10800 Kcal/Kg 4525 PNG (d) 27.50 Rs./m3 2957 35%
Un-sub. LPG Rs./Cylinder 694 10800 Kcal/Kg 4525 PNG (d) 27.50 Rs./m3 2957 35%
Bulk LPG Rs./Kg 71.0 10800 Kcal/Kg 6574 PNG © 42.01 Rs./m3 4517 31%LDO Rs./litre 36.6 8800 Kcal/litre 4156 PNG (I) 34.37 Rs./m3 3696 11%
Furnace Oil Rs./kg 32.1 10440 Kcal/kg 3072 PNG (I) 34.37 Rs./m3 3696 -20%
Source: Prices from websites of IOC and BPCL at Delhi, ICRA analysis; Prices as on January 19, 2021Note: (d): domestic, (I): industrial, ©: commercial. ̂ GCV of gas assumed at 9300 Kcal/m3.
Exhibit 3: Energy cost comparison with traditional fuels
CNG and PNG (d) segments highly competitive due to domestic allocation; especially CNG…
PNG (i) to continue to face pressure due to non-competitiveness against liquid fuels
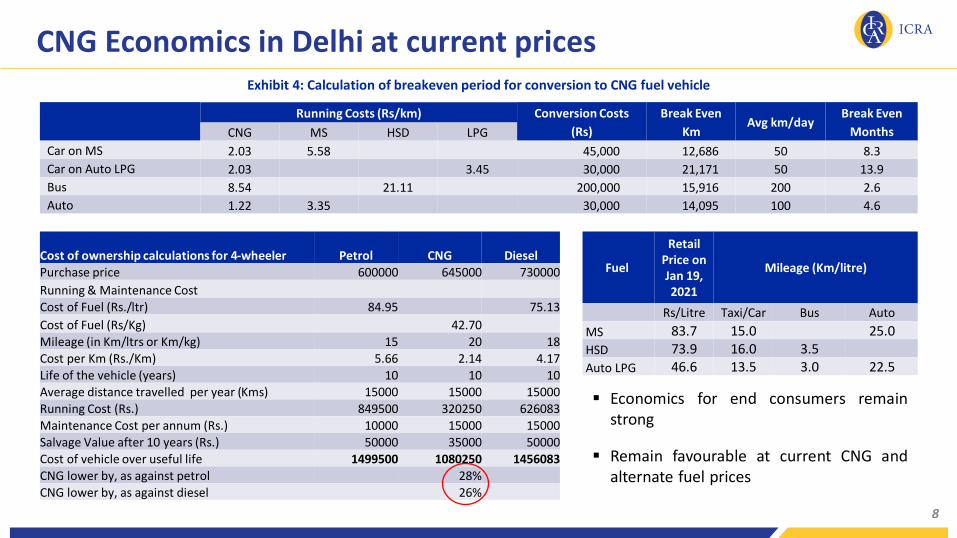
CNG Economics in Delhi at current prices
8
Cost of ownership calculations for 4-wheeler Petrol CNG DieselPurchase price 600000 645000 730000
Running & Maintenance Cost
Cost of Fuel (Rs./ltr) 84.95 75.13
Cost of Fuel (Rs/Kg) 42.70Mileage (in Km/ltrs or Km/kg) 15 20 18
Cost per Km (Rs./Km) 5.66 2.14 4.17
Life of the vehicle (years) 10 10 10Average distance travelled per year (Kms) 15000 15000 15000Running Cost (Rs.) 849500 320250 626083
Maintenance Cost per annum (Rs.) 10000 15000 15000Salvage Value after 10 years (Rs.) 50000 35000 50000Cost of vehicle over useful life 1499500 1080250 1456083
CNG lower by, as against petrol 28%CNG lower by, as against diesel 26%
▪ Economics for end consumers remainstrong
▪ Remain favourable at current CNG andalternate fuel prices
Fuel
Retail Price on Jan 19, 2021
Mileage (Km/litre)
Rs/Litre Taxi/Car Bus Auto
MS 83.7 15.0 25.0
HSD 73.9 16.0 3.5
Auto LPG 46.6 13.5 3.0 22.5
Running Costs (Rs/km) Conversion Costs
(Rs)
Break Even
KmAvg km/day
Break Even
MonthsCNG MS HSD LPG
Car on MS 2.03 5.58 45,000 12,686 50 8.3
Car on Auto LPG 2.03 3.45 30,000 21,171 50 13.9
Bus 8.54 21.11 200,000 15,916 200 2.6
Auto 1.22 3.35 30,000 14,095 100 4.6
Exhibit 4: Calculation of breakeven period for conversion to CNG fuel vehicle
Impact of Covid-19

Impact of covid-19 pandemic on gas sector
➢ Indian LNG demand saw surge due to collapse in spot prices
➢ Challenges for aggregators to market term LNG volumes given the price differential over spotLNG; moreover inventory losses on LNG were witnessed
➢ Demand from CGD and industrial sector had declined sharply since lockdown in March; now
recovering
➢ LNG re-gasifiers had declared force majeure and deferred supplies; while earlier capacity
utilisations had dipped to 55-60% levels, major terminals are now operating at 95-100% volumes
compared to pre-Covid levels
➢ Transmission lines capacity utilization had declined due to 30-40% lower volumes; however with
easing of lockdowns now operating at 95-100% volumes as compared to pre-Covid-19 levels
➢ Consumption of gas is now at almost pre-Covid levels
➢ Delays in project execution owing to restrictions on movement of men and material furtherdragged by 2nd and 3rd waves in some areas and social distancing rules

Segment wise impact on CGD companies
• Significant impact on sale to public/private transport due to lockdowns
• Recovery has been V-shaped; Volumes near about 90%+ of earlier levels
• Conversion/cost advantages continue to remain strongCNG
• Significant impact continues and volumes seeing recovery as industries resume
• Volumes could take few more months to reach earlier levels
• Significant fall in liquid fuels and coal prices are further dampenersPNG (I)
• Mostly sales concentrated in cities – largely Restaurants & Hotels
• Over 70% volumes lost due to curbs
• All volumes lost may not recover; customer behavioral changes – less dine out
• Relatively small in overall mix
PNG (C)
• Volumes increased due to more at home dining
• Volumes limited <10% of total for any playerPNG (D)

Other challenges; New projects could face delays...
• Delayed realization of receivables from industrial PNG players; Increased short term funding requirements
• Vendors and contractors facing liquidity issues and need capital to work on construction sites
• Existing companies with low regulatory pressure could curtail capex
• Projects in new GAs could face heightened challenges:-• Project cost increase; Achieving financial closure could be prolonged (esp for new entrants)
• Statutory Clearances have got delayed
• Equipment orders delayed; Renegotiations could be a reality
• Labor availability severely impacted – laying pipeline, last mile of domestic connections, new CNG stations, etc.
• Force majeure approvals from PNGRB may not be adequate
• Possible impact on long term demand/prospects is the larger concern – especially new projects
• Post covid challenges with management of labor/strict distancing rules

Force Majeure relief to CGD companies
• On Nov 5, PNGRB allowed extension to 41 CGD companies setting up projects in 185 GAs to complete MWP
• PNGRB has considered 69 days as the centrally imposed lockdown period and 60 days as the restoration period
• Most of the 185 entities have received the basic extension of 129 days only, 38 entities have received extensions ranging from 136-251 days largely at locations that had longer state enforced lockdowns
• Considering strict penalties that can be imposed for delay in executing the MWP, fairly limited and case by case extensions will ensure that players are not complacent
13

New Open Access Regulations – November 2020
• On November 27, 2020, the PNGRB has released a final regulation for determination of transportation ratefor City Gas distribution.
• The regulations have kept most aspects of the access code unchanged, except clarifying further on openaccess. The PNGRB has clarified that the existing CNG stations of franchise/dealers (including OMC’sCNG/LCNG stations) will not be considered as third-party shipper for the purpose of allowing access.
• While any additional capacity expansion at existing premise will also not be considered as third-party, settingup of CNG compressor at a new liquid fuel pumps will be considered as third-party. Major CGD players –Indraprastha Gas and Mahanagar Gas have a significant portion (>50%) of their CNG stations on OMCnetworks, thus, this regulation significantly lessens the risk of third-party competition and margincontraction for them.
• The risk of third-party marketing would continue to remain for large industrial PNG markets catered to byplayers like Gujarat Gas in Gujarat given the price sensitive and large market as well the access to multiplegas sources in the vicinity. However, the impact would be limited as only a maximum of ~20% of customercan shift to third-party.
• CGD companies filed litigations against the said regulations at draft stage itself as it would hurt the prospectsof the authorized players and allow third parties to select and takeaway profitable segments.
14

Unified Tariff Regime implemented with pooled tariff approach
• To reduce distance-based tariff dislocation in
natural gas pricing, PNGRB implemented UTR
• Tariff policy based on the pooling of the
approved tariffs for the pipelines forming the
national gas grid
• Pipeline network divided in two zones; Zone-1 as
first 300 KM from injection point and everything
thereafter falls in Zone-2
• Zone-1 tariff to be 40% of Zone-2
• Transmission tariff for majority of the players
utilizing single pipeline whether in Zone- 1 or
Zone-2 to witness increase in the transportation
costs
• Consumers located in Zone-2 and receiving gas
which flows through multiple pipelines to benefit
with tariff expected to moderate by around 40% 15
Pipeline Name Pipeline Operator Current Tariff, Rs. /mmbtu*
Unified Tariff, Rs.
/mmbtu*Zone-1 Zone-2
Integrated Hazira Vijaipur Jagdishpur
Pipeline
GAIL (India) Limited
19.83, 36.86, 45.38, 49.64 26.75 66.87
Dahej-Uran Dabhol Panvel NG Pipeline 29.55, 39.85 26.75 66.87
Dahej-Vijaipur (DVPL)-Vijaipur Dadri
(GREP) (Capacity augmentation)26.75 66.87
Jagdishpur-Bokaro-Haldia-Dhamra NG
Pipeline63.46 26.75 66.87
Dadri-Bawana-Nangal NG Pipeline 14.04, 14.06 26.75 66.87
Chainsa-Jhajjjar-Hissar NG Pipeline 7.85 26.75 66.87
Dabhol-Bangalore NG pipeline 45.37, 45.41, 45.44 26.75 66.87
Dadri Panipat NG PipelineIndian Oil Corporation
Limited16.46 26.75 66.87
East-West PipelinePipeline Infrastructure
Limited65.50, 75.33, 78.65, 79.77, 80.15 26.75 66.87
GSPL's High Pressure Gujarat Gas GridGujarat State Petronet
Limited33.15, 34.84, 34.86 26.75 66.87
Shahdol-PhulpurReliance Gas Pipelines
limited96.33 26.75 66.87
Mehsana-Bhatinda GSPL India Gasnet
Limited
0.90, 41.39 26.75 66.87
Bhatinda-Jammu-Srinagar NA 26.75 66.87
Mallavaram-Bhopal-Bhilwara-VijaipurGSPL India Transco
LimitedNA 26.75 66.87

Pollution map
16

Mandatory switch to PNG by industrial units in Delhi
Could spark a trend across several other states grappling with high levels of airpollution
• On December 22, 2020, the Ministry of Environment, Forest and Climate Change, identifiedabout 1,644 industrial units spread across 50 industrial areas in Delhi to switch over to PNGowing to the high levels of pollution. Additionally, Delhi Pollution Control Committee,Indraprastha Gas Limited and Delhi government were also asked to work in close coordinationto target the completion of switch over to PNG by January 31, 2021.
• The directive by the Ministry would provide a boost to the industrial volumes of incumbent IGL.
• Additionally, with several cities in Northern India featuring among the top 20 most pollutedcities globally, such as Jodhpur, Jind, Gurugram, Agra, Ghaziabad, Lucknow and Varanasi otherstate pollution control boards may follow suit which would benefit the incumbent CGD entitiesin these cities
• In October 2017, Supreme Court had banned use of pet coke and furnace oil in NCR to controlpollution levels. The court had also directed Governments of Rajasthan, Haryana and UttarPradesh. However, compliance by consumers was slow
17

Performance of incumbents during Covid-19

Industry Response to Pandemic
➢ The Ministry of Home Affairs notified natural gas supply as an essential service whichcontinued to operate within the lockdown
➢ CGD entities were able to receive gas supplies and maintained the supply of gas to alltypes of consumers
➢ CNG sales were down 70-80% in early days of the lockdown owing to which operatorsrationalized services by closing upto 2/3rd of company owned company operatedoutlets
➢ Project activities stopped owing to lockdown and migration of labour; startedgradually with the easing of lockdowns
➢ Companies individually and collectively approached PNGRB for extension of timelinesin meeting MWP
➢ Companies increased prices in some GAs
19
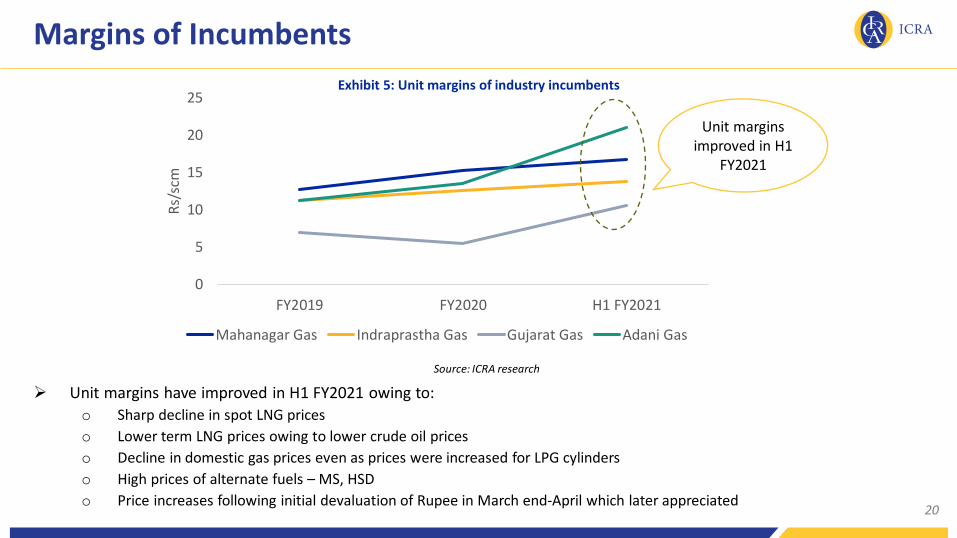
Margins of Incumbents
➢ Unit margins have improved in H1 FY2021 owing to:
o Sharp decline in spot LNG prices
o Lower term LNG prices owing to lower crude oil prices
o Decline in domestic gas prices even as prices were increased for LPG cylinders
o High prices of alternate fuels – MS, HSD
o Price increases following initial devaluation of Rupee in March end-April which later appreciated
Source: ICRA research
20
0
5
10
15
20
25
FY2019 FY2020 H1 FY2021
Rs/
scm
Mahanagar Gas Indraprastha Gas Gujarat Gas Adani Gas
Unit margins improved in H1
FY2021
Exhibit 5: Unit margins of industry incumbents
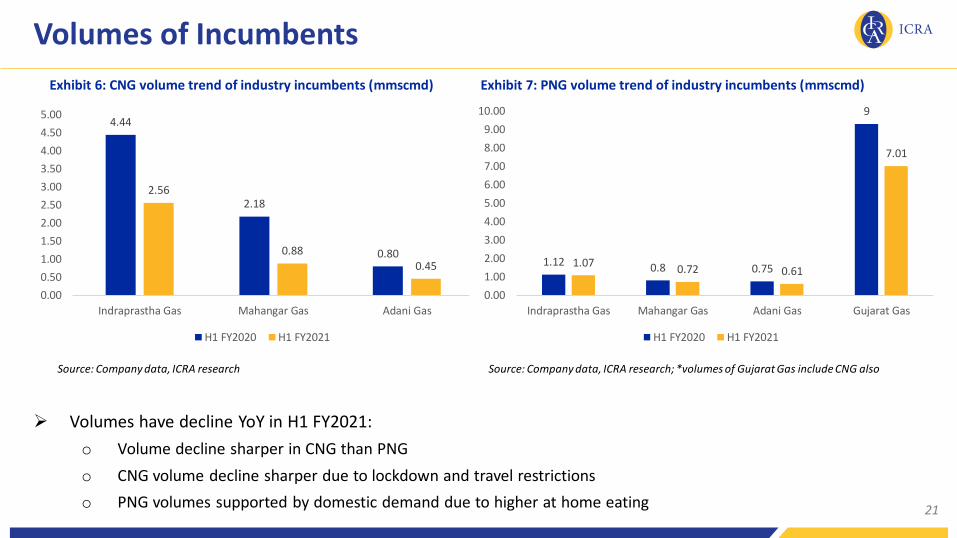
Volumes of Incumbents
Source: Company data, ICRA research Source: Company data, ICRA research; *volumes of Gujarat Gas include CNG also
21
Exhibit 6: CNG volume trend of industry incumbents (mmscmd) Exhibit 7: PNG volume trend of industry incumbents (mmscmd)
4.44
2.18
0.80
2.56
0.88
0.45
0.00
0.50
1.00
1.50
2.00
2.50
3.00
3.50
4.00
4.50
5.00
Indraprastha Gas Mahangar Gas Adani Gas
H1 FY2020 H1 FY2021
1.12 0.8 0.75
9
1.070.72 0.61
7.01
0.00
1.00
2.00
3.00
4.00
5.00
6.00
7.00
8.00
9.00
10.00
Indraprastha Gas Mahangar Gas Adani Gas Gujarat Gas
H1 FY2020 H1 FY2021
➢ Volumes have decline YoY in H1 FY2021:
o Volume decline sharper in CNG than PNG
o CNG volume decline sharper due to lockdown and travel restrictions
o PNG volumes supported by domestic demand due to higher at home eating
EBITDA of Incumbents
Source: ICRA research
22
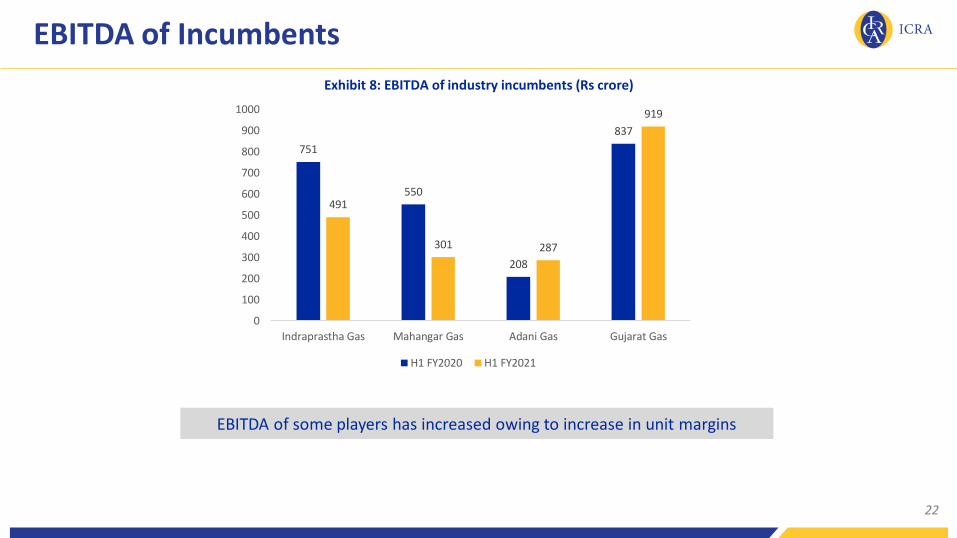
Exhibit 8: EBITDA of industry incumbents (Rs crore)
751
550
208
837
491
301 287
919
0
100
200
300
400
500
600
700
800
900
1000
Indraprastha Gas Mahangar Gas Adani Gas Gujarat Gas
H1 FY2020 H1 FY2021
EBITDA of some players has increased owing to increase in unit margins

Key Issues and Challenges

Key Issues and Challenges
➢ Anemic pace of approvals
➢ Despite recommendations by PNGRB states yet to provide regulatory push such
as lower road tax on CNG/LNG vehicles, single window clearance for approvals
etc
➢ Delays and disruption caused due to Covid-19 in project execution
➢ Shortage of skilled manpower
➢ Overbooked contractors and suppliers
➢ Different VAT rates across states
➢ Competition from electric vehicles especially for state transport bus segment
24

Small scale LNG
25
➢ Laying pipelines remains a long-drawn processowing to multiple approvals
➢ More economical/less capex to deploy SSLNGfor locations that are distant from trunkpipelines
➢ Coverage of several charge areas in GAs withintimelines may not be possible owing tostretched contractors due to large number ofprojects being executed within the country
➢ Attractiveness of LNG and CNG as a fuel vis-à-vis HSD especially for commercial vehicles
➢ Current low spot prices of LNG make forattractive economics against alternate fuelsand SSLNG may enable rapid seeding ofmarket

Opportunities for CGD companies
International Gas Prices
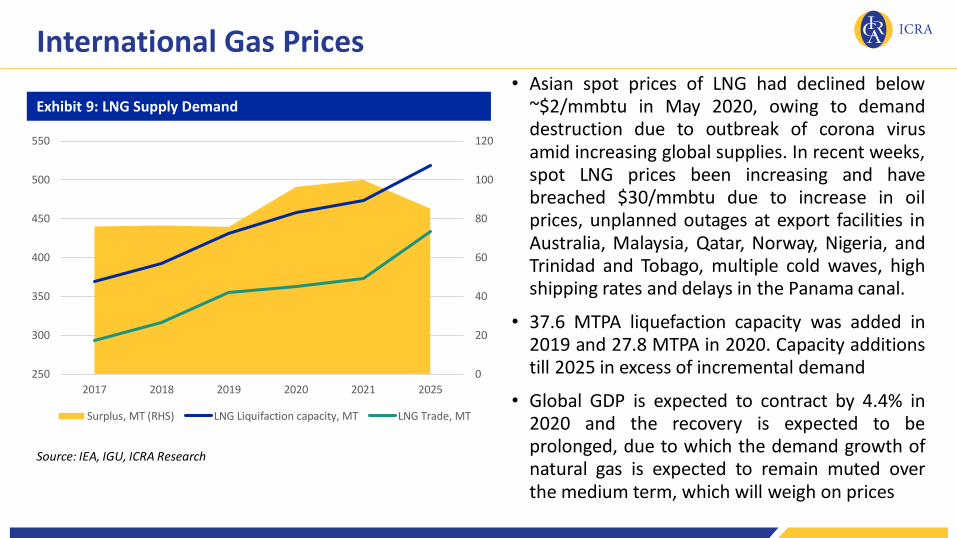
Exhibit 9: LNG Supply Demand
• Asian spot prices of LNG had declined below~$2/mmbtu in May 2020, owing to demanddestruction due to outbreak of corona virusamid increasing global supplies. In recent weeks,spot LNG prices been increasing and havebreached $30/mmbtu due to increase in oilprices, unplanned outages at export facilities inAustralia, Malaysia, Qatar, Norway, Nigeria, andTrinidad and Tobago, multiple cold waves, highshipping rates and delays in the Panama canal.
• 37.6 MTPA liquefaction capacity was added in2019 and 27.8 MTPA in 2020. Capacity additionstill 2025 in excess of incremental demand
• Global GDP is expected to contract by 4.4% in2020 and the recovery is expected to beprolonged, due to which the demand growth ofnatural gas is expected to remain muted overthe medium term, which will weigh on prices
Source: IEA, IGU, ICRA Research
0
20
40
60
80
100
120
250
300
350
400
450
500
550
2017 2018 2019 2020 2021 2025
Surplus, MT (RHS) LNG Liquifaction capacity, MT LNG Trade, MT

International Gas Prices
Exhibit 10: Crude and Gas Price Trend
Source: IEA, IGU, ICRA Research
0
10
20
30
40
50
60
70
80
90
0.00
4.00
8.00
12.00
16.00
Dec
-18
Jan
-19
Feb
-19
Mar
-19
Ap
r-1
9
May
-19
Jun
-19
Jul-
19
Au
g-1
9
Sep
-19
Oct
-19
No
v-1
9
Dec
-19
Jan
-20
Feb
-20
Mar
-20
Ap
r-2
0
May
-20
Jun
-20
Jul-
20
Au
g-2
0
Sep
-20
Oct
-20
No
v-2
0
Dec
-20
$/b
bl
$/m
mb
tu
Japan LNG Import Price Henry Hub Price UK NBP
Japan Spot prices Brent (on RHS)
• Consumers are switching to
alternate fuels wherever
possible
• PNG (I) will be most affected;
shift to FO, LSHS, LPG,
Propane, Coal will happen
• More importantly PNG (I)
margins could get compressed
significantly or turn negative
• Some minor impact in PNG (C)
as well
• CGD companies have increased
offtake of long-term volumes
• Prices are expected to
significantly decline by March

LNG driven CVs➢ Setting up of new LNG stations – 1000 planned over next 3
years at every 200-300 km along the golden quadrilateral
➢ Enabling regulatory amendments have been made for
manufacture of LNG vehicles and setting up of LNG stations
➢ PNGRB has allowed setting up of LNG stations by any entity
even one that is not authorized in a GA
➢ Commissioning of new LNG Terminals a key enabler of
growth
➢ Transporters yet to adopt LNG vehicles owing to lack of
refueling stations
➢ Network of stations still 2-4 years away post which
adoption will be possible
➢ Higher initial capital investment though ownership cost
over lifetime of the vehicle may be lower

Economics of LNG vs HSD Commercial Vehicle
30
Exhibit 11: Payback Period for LNG vs HSD Commercial Vehicle
HSD LNG
Initial Cost Rs 40 lakh Rs 53 lakh
Maintainance Cost Rs 50000 Rs 60000
Distance Travelled per year (km)
1,00,000 1,00,000
Mileage 3.3 km/liter 4 km/kg
Cost of Fuel Rs 75.1/liter* Rs 60/kg (Rs 42.7/kg CNG)*
Payback Period 1.8 years
Source: ICRA research, * HSD and CNG price in Delhi as on Jan 19, 2021
China’s Experience:
➢ At the end of 2018 about 3.5 lakh CV on LNG ofwhich 2/3rd were Heavy Duty Trucks andremaining were buses and coaches
➢ Sales of LNG trucks jumped 500% in 2017 owingto improved discount of LNG vs HSD as well asmove to Euro-VI emission norms
Preferred Fuel for Heavy Trucks:
➢ Higher energy density similar to HSD so higherdistance for refueling and lower fuel tankvolume
➢ Higher fuel injection pressure required in thecylinder which is more efficient for LNG thanCNG
Outlook
31

Ramp up in new GAs to drive CGD demand growth
32
PNG(I) volumes witnessing gradual recovery with pick-
up in industrial activity
CNG demand expected to increase driven by
favourable economics and preference for personal
mobility
PNG(D) consumption to increase with aggressive roll-out to meet targets
PNG(C) volumes to remain muted due to curbs
Ramp-up in new GAs as the initial infrastructure
building phase nears completion
1 2 3 4 5

Outlook
➢ Despite the current run-up, spot LNG prices expected to remain low over the
medium term which should spur demand.
➢ Several CGD projects at the cusp of increasing offtake substantially after 2-2.5 years
of setting up of network
➢ LCNG stations an increasingly viable option for servicing off grid locations especially
faced with Covid-19 delays and overbooked contractors
➢ Incumbents aggressively undertaking capex to make up for lost time
➢ A lower tax incidence on CNG, LNG vis-à-vis MS, HSD remains an advantage
➢ New tariff regulations would aid the economics of CGD entities for GAs distant from
the west coast due to lower pipeline tariff especially for PNG(I and C) segments
33

Thank You!

Contact Details
Prashant Vasisht
Vice President and Co-Head Corporate Ratings
+91-9818316222
© Copyright, 2021 ICRA Limited. All Rights Reserved.
All information contained herein has been obtained by ICRA from sources believed by it to be accurate and reliable. Although reasonable care has
been taken to ensure that the information herein is true, such information is provided 'as is' without any warranty of any kind, and ICRA in particular,
makes no representation or warranty, express or implied, as to the accuracy, timeliness or completeness of any such information. Also, ICRA or any of
its group companies, while publishing or otherwise disseminating other reports may have presented data, analyses and/or opinions that may be
inconsistent with the data, analyses and/or opinions in this publication. All information contained herein must be construed solely as statements of
opinion, and ICRA shall not be liable for any losses incurred by users from any use of this publication or its contents.