city development plan - guntur municipal corporation · guntur municipal corporation ... 3.5...
TRANSCRIPT
Guntur Municipal Corporation
CITY DEVELOPMENT PLAN
for
INTEGRATED HOUSING AND
SLUM DEVELOPMENT PROGRAM
(IHSDP) &
URBAN INFRASTRUCTURE DEVELOPMENT SCHEME FOR
SMALL & MEDIUM TOWNS
(UIDSSMT)
APRIL 2006

INDEX
Item Description Page number
Chapter 1 Introduction
1.1 Brief Profile of City 1
1.2 objectives of cdp 1
1.3 scope of city development plan 2
1.4 Structure of the Report 2
Chapter 2 CDP framework & process
2.1 approach to cdp 3
2.2 Process 4
2.3 key steps 4
Chapter 3 City Assessment - Existing situation & Gap Analy sis
3.1 Demography 5
3.1.1 Population growth and Trend 5
3.1.2 Growth rate 6
3.1.3 Projections 7
3.1.4 Population Density 7
3.1.5 Spatial Profile 7
3.2 Economic base 9
3.3 Financial profile 10
3.4 Infrastructure 12
3.4.1 Traffic, Transportation and Roads 12
3.4.2 Water Supply 14
3.4.3 Waste water disposal 16
3.4.4 Sanitation 17
3.4.5 Solid waste 18
3.4.6 Lighting 19
3.5 Community requirements 19
3.5.1 Education 19
3.5.2 Health care 20
3.5.3 Parks, play grounds & Recreation 21
3.5.4 Greenery 21

3.5.5 Markets and Commercial centers 22
3.6 Physical and Environmental aspects 22
3.7 Natural Environmental Features 25
3.8 Common Grievances from the citizens 28
3.9 Institutional weaknesses 28
Chapter 4 VISION 30
4.1 Developing a vision for the City 31
4.2 Gaps identified 33
4.2.1 WATER SUPPLY: 33
4.2.2 WASTE WATER DISPOSAL 34
4.2.3 SANITATION 34
4.2.4 SOLID WASTE MANAGEMENT 35
4.2.5 STREET LIGHTING 35
4.2.6 EDUCATION 36
4.2.7 HEALTH CARE 36
4.2.8 PARKS, PLAY GROUNDS & RECREATION 36
4.2.9 GREENARY 37
4.2.10 MARKETS AND COMMERCIAL CENTERS 37
4.3 Institutional Reforms 38
Chapter 5 URBAN POOR – Basic services to Urban Poor 41
5.1 Assessment of existing condition 41
5.2 Ongoing reforms 42
5.3 Gap analysis 42
5.4 Housing to the Urban Poor 43
Chapter 6 City Investment Plan & Financing Strategies 44
6.1 Proposals for Slum Development- IHSDP 45
6.1.1 Admissible Components 46
6.1.2 Summary of proposals under IHSDP 47
6.1.3 Financing Pattern 47
6.1.4 Sector wise Proposals under IHSDP 48
6.2 Proposals for UIDSSMT 51 6.2.1 Components Proposed 52
6.2.2 Summary of proposals under UIDSSMT 53
6.2.3 Financing Pattern 53
6.2.4 Sector wise Proposals under UIDSSMT 54

LIST OF TABLES
Table number Table Title Page
number
TABLE 3.1.1 Population Trend in Guntur Municipal Corporation 5
TABLE 3.1.2 Composition of Growth 6
TABLE 3.1.3 Access of the slum dwellers to basic services 6
TABLE 3.2.1 Economic base, occupational distribution, 2001 9
TABLE 3.3.1 Municipal Revenue Income 10
TABLE 3.3.2 Municipal Revenue Expenditure 10
TABLE 3.3.3 Municipal Capital Receipts 10
TABLE 3.3.4 Finances of city level water supply 11
TABLE 3.4.1 Distribution of Road Net Work 13
TABLE 3.4.2 Category wise drainage lengths 17
TABLE 3.4.3 Soild waste Collection & Transportation Machinery
available 18
TABLE 3.5.1 Category wise number of schools 19
TABLE 3.5.2 Distribution of teachers and students 20
TABLE 3.6.1 Environment service 22
TABLE 3.6.2 Land Supply (Hectares) 22
TABLE 3.6.3 Land use break up 23
TABLE 3.6.4 Institutional Responsibility 24
TABLE 3.6.5 Role of the private sector in urban Infrastructure provision 25
TABLE 4.1.1 Vision and Goals 31
TABLE 5.1 STATISTICS OF INFRASTRUTURE IN SLUMS 41
TABLE 5.2 Out come of the schemes meant for urban poor 42
TABLE 5.3 Assessment of infrastructure to be provided 43
TABLE 6.1.1 SUMMARY OF PROPOSALS UNDER IHSDP 47
TABLE 6.1.2 WATER SUPLY PROPOSALS UNDER IHSDP 48
TABLE 6.1.3 ROADS PROPOSALS UNDER IHSDP 48
TABLE 6.1.4 DRAINS PROPOSALS UNDER IHSDP 48
TABLE 6.1.5 STREET LGHTS PROPOSALS UNDER IHSDP 49
TABLE 6.1.6 COMMUNITY TOILETS PROPOSALS UNDER IHSDP 49
TABLE 6.1.7 INDEPENDENT SEWERAGE SYSTEM PROPOSALS UNDER IHSDP 49

TABLE 6.1.8 SCHOOL INFRASTRUTUE PROPOSALS UNDER IHSDP 50
TABLE 6.1.9 HOUSING PROPOSALS UNDER IHSDP 50
TABLE 6.2.1 SUMMARY OF PROPOSALS UNDER UIDSSMT 53
TABLE 6.2.2 WATER SUPPLY PROPOSALS UNDER UIDSSMT 54
TABLE 6.2.3 TRAFFIC, TRANSPORTATION ROADS PROPOSALS UNDER
UIDSSMT 55
TABLE 6.2.4 SEWERAGE SYSTEM PROPOSALS UNDER UIDSSMT 55
TABLE 6.2.5 STORM WATER DRAINS PROPOSALS UNDER UIDSSMT 56
TABLE 6.2.6 SOLID WASTE MANAGEMENT PROPOSALS UNDER UIDSSMT 56
TABLE 6.2.7 STREET LIGHTS PROPOSALS UNDER UIDSSMT 56
TABLE 6.2.8 SANITATION PROPOSALS UNDER UIDSSMT 57
TABLE 6.2.9 EDUCATION INFRASTRUCTURE PROPOSALS UNDER UIDSSMT 57
TABLE 6.2.10 HEALTH CARE PROPOSALS UNDER UIDSSMT 57
TABLE 6.2.11 PARKS & PLAY GROUNDS PROPOSALS UNDER UIDSSMT 58
TABLE 6.2.12 GREENARY PROPOSALS UNDER UIDSSMT 58
TABLE 6.2.13 MARKETS & COMMERCIAL CENTERS PROPOSALS UNDER
UIDSSMT 59

Chapter
1 INTRODUCTIONINTRODUCTIONINTRODUCTIONINTRODUCTION
1.1 BRIEF PROFILE OF CITY
Guntur, the birth place of Tikkana, the person who wrote a good part of Mahabharata, is one of the few cities of South India which carved a glorious and enviable place for itself in the history of India. Particularly its role in the national movement was unparallel. Great leaders like Unnava Laxminarayana, Desabhakta Konda Venkatappaiah, Vavilala Gopalakrishnaiah , to name a few, made this town not only centre for selfless sacrifice but also abode of cultural and political revival. Very few cities in India could claim such a heritage. But, though painful, it has to be admitted that it could not sustain the same vigor and glory for long.
The rapid urbanization had its adverse affects on this town. The sixth decade of the last century saw, the sudden growth of Tobacco Industry, and consequent raise in the number of migrants form even far off villages. It was basically the case of Pull Factor. The rise of Chilly Industry, Cotton Industry etc., unabatedly contributed to the migration. The nature of this human inflow had been such that, practically every part of the city witnessed the growth of illegal settlements with out basic facilities. The fact that 133 slums exist in the city speaks volumes about the stress on the meager resources of the urban administration. The gap between the financial and personnel resources and the growing aspirations of the subjects has been continuously on rise.

1.2 OBJECTIVES OF CDP
The main objectives of the CDP is to have a planned growth of the city in the desired direction and to project Guntur as the “City of Opportunity” guided by a shared vision for city’s development. The CDP would comprise of sectoral plans for the identified sectors for a horizon period of 20 years outlining policy framework and investment interventions to achieve the vision of Guntur.
1.3 SCOPE OF CITY DEVELOPMENT PLAN
The CDP outlines the strategic policy and investment interventions to achieve the vision of Guntur including formulation of sectoral plans for the identified sectors. The scope of work is to
� Assess the existing situation with regards to demographic and economic growth, infrastructure services, municipal finances, etc.
� Identify the gaps in service delivery
� Outline the issues faced by the City’s poor
� Prepare a vision and sectoral strategic framework outlining the goals, strategies, interventions/projects to achieve the vision and
� Formulate a city investment plan with appropriate financing strategies and an implementation action plan.
In addition, the CDP would also focus on the reforms to be carried out at the state and local level in consonance with the vision and strategic plan outlined to sustain the planned interventions.
1.4 STRUCTURE OF THE REPORT
The report is structured into seven chapters viz.:
Chapter 1- Introduction describes the brief profile of Guntur, objectives and scope of City Development Plan.
Chapter 2- provides the CDP framework and the process involving key steps
Chapter 3 - City Assessment describing briefly the existing situation with regards to key elements of city development. It describes the demographic and economic characteristics of Guntur including status of infrastructure provision, environmental aspects, institutional arrangements and the development challenges. This section also lists

out key issues facing each of the elements listed above and presents the current gaps in service levels.
Chapter 4 - Vision & Sectoral Strategic Framework describing the vision and sectoral goals and strategies. The reform agenda is also outlined in this chapter.
Chapter 5- on Basic Services to Urban Poor describes the socio-economic characteristics of urban poor and the challenges facing the urban poverty.
Chapter 6- City Investment Plan and Financing Strategies describes the city investment plan with a prioritisation and phasing of investments along with the financing options.

Chapter
2 CDP FRAMEWORK & PROCCDP FRAMEWORK & PROCCDP FRAMEWORK & PROCCDP FRAMEWORK & PROCESSESSESSESS
2.1 APPROACH TO CDP
The preparation of a City Development Plan (CDP) is undertaken by the Guntur Municipal Corporation (GMC) as per the guidelines of IHSDP. The CDP is conceptualised considering the position occupied by Guntur as a strategic destination for various activities and initiatives planned by central and state governments and to guide the planning and investment decisions in future. The CDP took the inputs from various participatory meetings with stake holders held for the purpose and various the studies in addition to the Zonal Master Plan by the VGTMUDA. The CDP envisages development of a sustainable and balanced Guntur for converging into a favourable destination for new economy enterprises.
In order to have planned growth of the city in the desired direction and to project Guntur as the City of Oppurtunity, the CDP prepared sectoral plans for the identified sectors for a horizon period of 20 years and also outlined the strategic policy and investment interventions to achieve the vision of Guntur. The CDP presents the city development issues, deficiency analysis and a management framework outlining strategies and guidelines for future growth. The approach for the preparation of CDP majorly comprises of an appraisal of existing situation based on inputs from various stakeholders that have a role in provision of city infrastructure and influence city development patterns.
The plan provides a distinctive thrust for introducing enabling rather than restrictive regulatory mechanisms through realistic planning and management interventions within the overall regulatory and institutional framework. The development proposals are being designed within the context of the Zonal Master Plan for Guntur (2020). A development implementation action plan comprising of implementation schedule, role of stakeholders, regulations and institutional strengthening mechanisms are formulated, with special emphasis on institutionalising the monitoring mechanisms.
2.2 PROCESS
The entire exercise was carried out through stakeholder participation at various stages. A core group headed by the Commissioner was formed to manage and drive the process and to look into different elements of urban functions. The CDP - considered as an inter-sectoral exercise - takes into account the existing situation including assessing the current status of municipal services, it’s fiscal status, operational and management procedures. The CDP also took into consideration the works and plans of other Government and Quasi- Government agencies contributing towards the growth and development of the city. The CDP also identified performance-monitoring/ sustainability indicators to assist the Council to review the progress of the CDP on an annual basis and to enable them in setting the agenda for the future.
2.3 KEY STEPS
The City Development Plan (CDP) is a collective effort of all Planning Partners and Key Stakeholders involved in the City’s development explicitly setting the agenda for development in terms of growth policy and directions and means of achieving them. The CDP is a forward looking consensus program for the City, for a 20-year horizon, comprising of the following tasks:
1. Visioning Exercise 2. Situation Analysis 3. Formulation of Goals & Strategies 4. Capital Investment Plan & Project Scheduling 5. Generation of Financial & Operating Plan 6. Stakeholder Workshop 7. Presentation and Approval by the Council along with Draft
MoA 8. Action & Operating Plan indicating the policy and reform
measures for improved service provision and delivery.
Chapter
3 CITY ASSESSMENTCITY ASSESSMENTCITY ASSESSMENTCITY ASSESSMENT
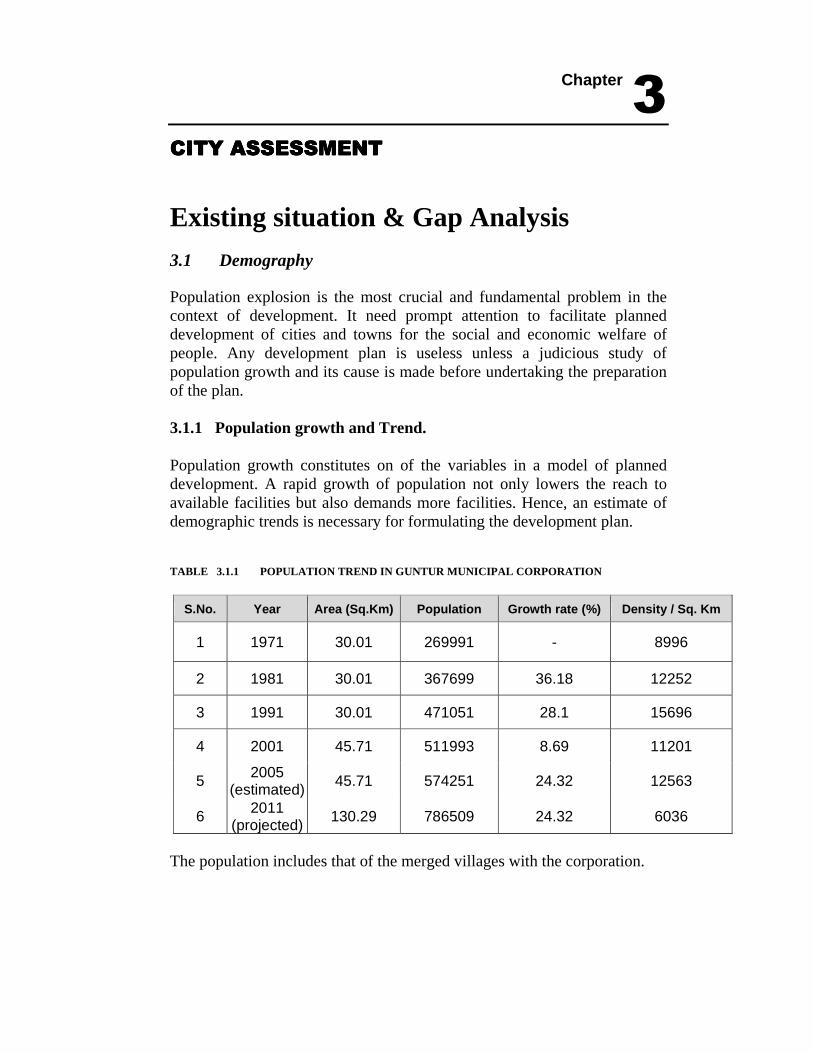
Existing situation & Gap Analysis 3.1 Demography Population explosion is the most crucial and fundamental problem in the context of development. It need prompt attention to facilitate planned development of cities and towns for the social and economic welfare of people. Any development plan is useless unless a judicious study of population growth and its cause is made before undertaking the preparation of the plan. 3.1.1 Population growth and Trend. Population growth constitutes on of the variables in a model of planned development. A rapid growth of population not only lowers the reach to available facilities but also demands more facilities. Hence, an estimate of demographic trends is necessary for formulating the development plan. TABLE 3.1.1 POPULATION TREND IN GUNTUR MUNICIPAL CORPORATION
S.No. Year Area (Sq.Km) Population Growth rate (%) Density / Sq. Km
1 1971 30.01 269991 - 8996
2 1981 30.01 367699 36.18 12252
3 1991 30.01 471051 28.1 15696
4 2001 45.71 511993 8.69 11201
5 2005 (estimated)
45.71 574251 24.32 12563
6 2011 (projected)
130.29 786509 24.32 6036
The population includes that of the merged villages with the corporation.

TABLE 3.1.2 COMPOSITION OF GROWTH
Population increase during Composition
Year 1981-91 % of total 1991-2001 % of total
Natural increase 88039 24.94% 83239 17.67%
In – migration 15313 4.17% -42297 -8.97%
Total Increase 103352 29.11% 40942 8.70%
Source - Zonal Development plan 2006 by VGTMUDA
TABLE 3.1.3 ACCESS OF THE SLUM DWELLERS TO BASIC SERVICES
Percentage of slum dwellers having access to Year Number of slum
dwellers Water supply Drainage system Waste service collection
1991 1,76,480 30% 16% 70%
2001 1,91,815 37% 24% 90%
2005 (estimated) 2,15,140 75% 50% 100%
3.1.2 Growth rate The growth rate during the last four dacades is instrumental in assessing any population projections, since the demographic development of the city has took place during this period. The average growth rate registered during the last four decades was 24.32. According to 2001 census, the Guntur City has a population of 5,11,993. The Guntur Urban Agglomeration accommodated nearly 1 lakh Population.
Population trend in GMC
1971 1981 1991 20010
100000
200000
300000
400000
500000
600000
Y ear

3.1.3 Projections By applying the average growth rate of 24.32 the present population i.e. for the year 2006 is assessed as 5,74,251. The projected population for 2011 is assessed as 636509. The Guntur Urban Agglomeration also accommodates nearly 1 lakh Population. Guntur city receives an average of About 1 lakh floating population daily. 3.1.4 Population Density The city is divided into 52 electoral Wards covering a total area of 45.71 Sq.Km. Average population density of the town is 11,201 Persons/Sq. Km. As of 2001. The 25th ward scores the highest density of 55,806 persons/Sq.Km, and 20th, 21st, 35th, 36th wards also have high densities when compared to other wards. 3.1.5 Spatial Profile Residential Use : Seetharam nagar, Thimma reddy Nagar, Vinobha Nagar, Anandapet, Nehru Nagar, Buchaiah Thota, Vidya Nagar, Chandramouli Nagar, Sreenivasarao Thota, Venugopal Nagar, A.T. Agraharam, Cobaldpet, Laxmipuram, Syamala Nagar, Bank Colony, Venkataramana Colony, Nalla Cheruvu, Gandhi Nagar, etc. are localities under residential use. Commercial Areas:
The major commercial areas are located in the western part of the city. This area consists of numerous wholesale and retail commercial activities catering to the city and its hinterland. The commercial use includes shopping, banking,
Decadal w ise Density
8996
12252
15696
11201
0
5000
10000
15000
20000
Densit y / Sq. Km
1971 200119811991
Gro wt h rat e in GM C
0
5
10
15
20
25
30
35
40
Y ear1971 1981 1991 2001
institutions, warehouses, markets, cinema theatres and the like. The commercial units of recent origin located in the northern and southern parts along Mangalagiri road, Sreenivasarao thota and Chuttugunta. The “Old Guntur” area on the east is congested from the ever-increasing inflow of traders necessitating redevelopment of the commercial and shopping activities in this area. All the commercial activities are situated in Old Guntur, Kothapet, Brodipet, Arundelpet, Patnam Bazar, Bus Stand, Collectorate road, Station road, Naaz Center, Vidya Nagar, Laxmipuram, Vegetable Market, Fruit Market, retail and wholesale commercial activities are located in Patnam Bazaar and Old Guntur near the Municipal Office.
Industrial Use
Guntur has served as a marketing and distribution center for agricultural produce for a long time. Thus, the earliest industries of this city have been processing units of rice, pulses, oil seeds and the like. Consequently, there have been no large-scale industries in the region. Planned development of industries was envisaged in the five-year plans and these are being established of late. Being an important commercial center for tobacco, chillies and cotton, numerous cold storages plants have been constructed for their storage. Small-scale industries and agro-based industries like rice mills, oil mills are located in the residential areas of the city and along some main roads. To encourage industrial developments, industrial area has been notified (Auto Nagar) within the city limits. Public and Semi Public This category of land includes all the educational and health institutions, government Offices, Municipal offices, offices of the other local authorities and other public institution like temples, churches and mosques. Most of these are found in Collectorate road, Chuttu Gunta, Nagaram Palem and Kothapet, as Guntur is an important junction in the rail network, railway offices occupy a large area within the town. Institutional Guntur is an important educational center with a number of arts colleges, institutes of technical education, and a medical and dental college. There are many residential colleges to cater to the needs of the students up to intermediate level of education. Guntur Municipal Corporation maintains 86 primary schools, 18 upper primary schools and 10 high schools. Regarding health care, there is a Government General Hospital, 3 Ayurvedhic dispensaries, 3 Unani dispensaries and 2 Homeopathic dispensaries besides about 250 private hospital and nursing homes offering specialized care. Guntur Municipal Corporation constructed 9 Urban Health

Centers in slum areas in 2001 to provide medical facilities to the economically weaker sections. 3.2 Economic base TABLE 3.2.1 Economic base, occupational distribution, 2001 Occupation category Number of workers
(lakh) % of total
Main Workers 160741 31.40%
Agriculture 2052 0.40%
Agriculture labour 7024 1.37%
House hold Industries 5929 1.15%
Other workers 145736 28.46%
Marginal Workers 17864 3.49%
Non-Workers 333388 65.12%
Total 511993 100.00%
Source - Zonal Development plan 2006 by VGTMUDA
Total number of notified poor settlements being served : 143 # Total population of the above poor settlements : 1,91,815 Total BPL population of the above poor settlements : 1,04,733
% of BPL population being served by the off site project proposal : 53.35%

3.3 Financial profile TABLE 3.3.1 Municipal Revenue Income
Revenue account receipts (Rs in lakhs) Year
Tax Non –Tax Transfers including grants
Total
2001/ 02 1293.15 1858.46 528.18 3679.79
2002/ 03 2080.80 1334.06 571.27 3986.13
2003/ 04 2163.15 831.90 687.92 4612.97
2004/ 05 3111.89 2127.91 692.97 5932.77
TABLE 3.3.2 Municipal Revenue Expenditure
Revenue account expenditure (Rs in lakhs)
Year Establishment (wages and
salaries)
Operation and
maintenance
Interest payment Others Total
2001/ 02 1005.57 1149.95 123.53 908.41 3187.46
2002/ 03 1058.28 1197.65 206.33 1359.18 3821.44
2003/ 04 1138.58 1152.80 206.58 695.73 3193.69
2004/ 05 1179.90 567.93 211.98 712.50 2781.55
TABLE 3.3.3 Municipal Capital Receipts
Capital Receipts (Rs in lakhs) State Government (Rs in
lakhs) Year
Loans Grants
Financing institutions
Market Total
2001/ 02 149.20 1353.72 0.00 0.00 1502.92
2002/ 03 239.25 1355.42 15.26 0.00 1633.44
2003/ 04 440.76 1801.28 538.63 0.00 1924.50
2004/ 05 111.00 1441.41 558.70 0.00 1479.41
TABLE 3.3.4 Finances of city level water supply

Year Expenditure (Rs in lakhs) Income (Rs in lakhs)
2001/ 02 375.24 451.24
2002/ 03 414.26 486.14
2003/ 04 537.43 442.72
2004/ 05 644.76 479.03
(NOTE: 1999-2000 REVISED BUDGET ESTIMATES AND 2000-2001 BUDGET ESTIMATES AS APPROVED BY CORPORATION)
RECEIPT OVER THE YEARS
2066.802640.53
3285.30
5215.00
7410.00
11154
0.00
2000.00
4000.00
6000.00
8000.00
10000.00
12000.00
1995-96 1996-97 1997-98 1998-99 1999-2000 2000-2001
years
(Rs
In L
akhs
)

3.4 Infrastructure 3.4.1 Traffic, Transportation and Roads Highway traffic Guntur is connected with NH5 from Chennai to Kolkatta through the city. The city is also connected by network of State highways and District roads. Though NH is bypassed in the Eastern side, the traffic which had to go in the direction of Chilakaluripet, Narasaraopet, Amaravathi, Achampet passes through the heart of the city. Thus the outflow and inflow of heavy vehicular traffic contribution is more. The city is not having any other ring road for this traffic. Further the city is expanding adjoining the NH’s and SH’s which result in more congestion and accidents on the highways. Road junctions in the city The major intersections like Lodge center junction, Municipal T B Junction, Chandana Bros Junction and Naaz Center Junction have to be improved even for the existing traffic volume. Redesigning and improving the islands required to be carried out in order to avoid the turning problems at some of the intersections.
Road Marking The following road markings, which will guide and control the traffic and improve road safety to a considerable extend, are suggested for Guntur City.
• Centerline marking on all radial roads having minimum two-lane width
• At all intersections, the stop lines and directional arrows are to be painted with white paint.
• Zebra crossing to a width of 3.0 meters (White and Black strips with 50 cm Band) are to be painted at predominant pedestrian crossings.
Traffic Signs
Pedestrian crossing signboards are to be erected at all the locations where zebra crossings are marked. But stop sign boards may be erected at all the bus stops inside the town. Information signboards may be erected at the intersections to provide route directions.
Central Median
Some of the roads in Guntur are provided with medians, but the dimensions of the medians to be checked with the standards according to the type of the road. Some of the main roads are not having the medians, and those roads have to be provided with medians from AC College to Municipal TB and Amaravathi Road. Parking
Considerable demand for parking of vehicles opposite to the areas of business is found. In order to ease the traffic flow, parking operations are to be regulated. The open space in front of the shops should be paved and on street parking lot, facility to be provided and parking lots are to be duly painted. A nominal parking fee may be collected in order to ensure orderly parking and also to discourage idle parking at the busy locations. Footpath At present, there are very less number of raised and paved footpaths to protect the pedestrian from vehicular traffic. Even on the busy roads, only earthen shoulders are provided. This not only creates traffic congestion but also exposes pedestrian to accidents. It is suggested to provide 1.5 to 2.0m wide raised and paved footpaths on either side in stretches of the important roads. Traffic Education A study of traffic movement on roads within Guntur city has indicated that significant improvements could be made by imparting traffic education to the road users, especially tow wheeler riders and pedestrians. Adequate traffic education with enhanced traffic enforcement by deploying sufficient manpower at busy location will go a long way in improving the traffic situation in Guntur city. Traffic Park for education children may be developed in Guntur City. Roads improvements All the arterial, sub arterial roads and collector streets are to be widened as the traffic volume has surpassed the capacity even for the existing traffic. Distribution of Road Net Work:
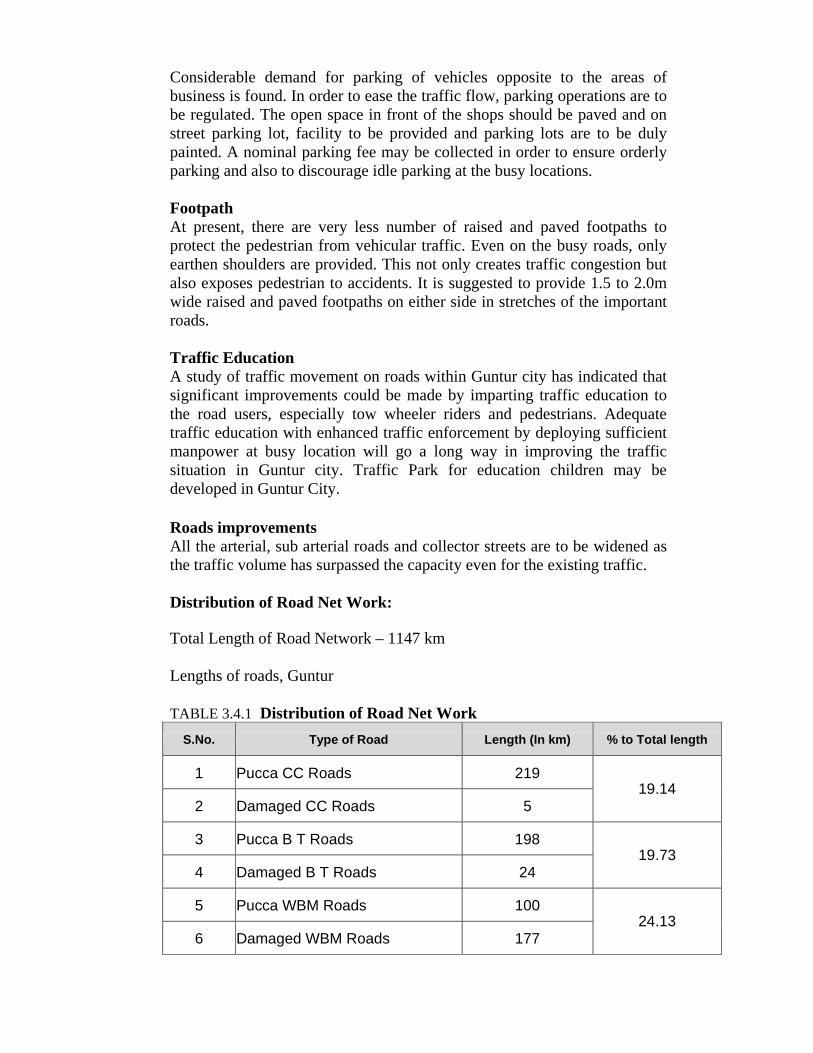
Total Length of Road Network – 1147 km
Lengths of roads, Guntur TABLE 3.4.1 Distribution of Road Net Work
S.No. Type of Road Length (In km) % to Total length
1 Pucca CC Roads 219
2 Damaged CC Roads 5 19.14
3 Pucca B T Roads 198
4 Damaged B T Roads 24 19.73
5 Pucca WBM Roads 100
6 Damaged WBM Roads 177 24.13

7 Mud Roads 425 37.00
Total 1147 100.00
Problems & issues
• Insufficient width of main roads • Lack of signals in important junctions • High percentage of kutcha roads • High percentage of damaged roads
3.4.2 Water Supply
Present installed capacity : 122.82 MLD
Present supply : 73.27 MLD
Transmission losses : 25 % (estimated)
Water made available for distribution : 54.95 MLD
Per capita supply : 96 LPCD
Pro Rata supply as per standards : 135 LPCD
Number of service reservoirs : 25 #
Total storage capacity of all ELSRs : 27000 KL
Number of bore wells : 1146
Number of open wells : 110
Number of House service connections : 45000
Number of public taps : 3200
Total power charges paid on pumping units : Rs 28.00 lakhs per month Sources
S No
Source and location of raw water drawal
Max Drawal capacity Dependency

1
Guntur Channel
Drawal at Takkellapadu raw water pump house
Distance 4 km from city
45.50 MLD another
45.50 MLD to be commissioned
Dependable for 9 months in the year. During 3 months of summer,
water to be pumped from Mangalagiri Pump house.
2
Kommamuru Canal
Drawal at Sangam Jagarlamudi Raw water
pump house
Distance 14 km from city
27.27 MLD Dependable for 11 months in the
year. During 1 month canal closure, storage capacity is available.
3
Infiltration galleries
at Vengalaya palem
Distance 3 km from city
4.55 MLD
Dependable only during non summer period. During summer
drawal comes down to very meager quantity.
Total 122.82 MLD
Treatment facilities
S No Treatment plant location Capacity Year of installation
Condition
1 Takkellapadu 45.50 MLD 1989 Good
2 Sangam Jagarlamudi 27.27 MLD 1956 & 1975 Good
3 Takkellapadu 45.50 MLD 2006 To be commissioned
Total 118.27 MLD
Water Coverage The entire city population is being supplied potable water. But the distribution net work is available for only 88 % of the city area. The pucca distribution lines are available for only 611 KM length (80% of total). Semi pucca distribution lines are available for 53 km length (8% of total) The uncovered area of about 12% of the cit area is being supplied water through tankers. The distribution network is not covered in the peripheral part of the city i.e. newly extending localities, mostly slums. The per capita supply of 127 LPCD can be calculated as per the present installed supply of 73.27 MLD and the present estimated population of

574251. But the exorbitant UFW of about 25% in transmission only is bringing down the per capita supply to 96 LPCD. The consumers are being supplied water at 1hour in a day at daily supply basis. Problems & issues
• The high percentage of UFW in transmission • Lack of summer storage facility and dependence on irrigation canals
for source • Though the capacity of ELSRs seems to be sufficient, most of the
ELSRs do no fill twice a day • High expenditure towards power charges on multiple stage pumping • Non coverage of distribution system on the peripheral areas. • Lack of scientifically designed distribution system • Crude methods while making water connections thus damaging the
distribution network • High level of illegal connections
3.4.3 Waste water disposal Under Ground Drainage Under ground drainage system is covered partially in the city. Area covered under sewerage net work : 6.73 sq km Area not covered under sewerage net work : 38.98 sq km Houses connected to sewerage net work : 13414 % of houses connected to sewerage net work : 13% Total length of sewerage net work : 87 km The existing sewerage system could cover only 22 % of the city area and 32% of population. The sewage transmitted daily is about 10.50 MLD though the net work though the installed capacity of the sewage treatment plant is 34 MLD. The sewage treatment plant existing at Suddapalli Donka (eastern part of the city) has become almost defunct. The effluent standards after this plant are not as per standards and this plant is to be revamped immediately. Waste water generated daily : 10.50 MLD Disposal (under ground sewerage) capacity : 34 .00 MLD (defunct) Present operating capacity : nil Open drains

Most of the waste water disposal is being done through open drains. In the absence of sewerage system in most parts of the city, the sanitation is being maintained through individual septic tanks and open drains. The length of available sewerage system is only 87 KM as against the total drainage net work of 1276 KM length. TABLE 3.4.2 Category wise drainage lengths
S No Category of drain Length in km % of total
1 UGD –pucca 44.30 2.90
2 UGD- semi pucca 42.65 2.80
3 Open drain – pucca 838.04 55.70
4 Open drain – semi pucca 350.76 23.30
5 No drains 228.11 15.30
Total 1503.86 100.00
The total 1190 KM length open drain system is to be strengthened. Already a length of 839 KM length of open drains is made pucca. The balance 351 KM drains have to be channelised apart from strengthening several major out fall drains running through the city. Problems & Issues 1. Insufficient coverage by Under Ground Sewerage System 2. Inadequate Drainage System. 3. Environmental Degradation since the discharge from toilets and
septic tanks are let into the storm water drains, which also carry the sewage through length and breadth of the city and finally discharge into the Peekalavagu in the southwest and Suddapalli Donka in the eastern part of the city. Flow of such polluted sewage in the open drains cause environmental degrading particularly in the developed area of the city.
4. High percentage (39%) Kutcha Drains 3.4.4 Sanitation Problems & Issues
• Lack of sanitary facilities in slums • Maintenance deficiency at public toilets • Insufficient number of toilets at public gathering places • Open defecation along the roads causing nuisance

• Lack of space in slum dwellings for implementing low cost sanitation scheme
• Failure of leach pits as a result of percolation problems due soil type in Guntur
3.4.5 Solid waste Waste generation daily : 350 MT Bio degradable : 220 MT 63 % Recyclable : 20 MT 6 % Inert : 110 MT 31 % Collection daily : 310 MT Methods of collection :
Street sweeping, cleaning of drains, collection of waste from dust bins, transport through tricycles & deposition of waste in the community Concrete bins and metal dumper bins. Further transportation of garbage through tractors and dumper placers to the dumping yards located at about 6km from city. TABLE 3.4.3 Solid waste Collection & Transportation Machinery available
Vehicle Number available
Average capacity (tonnes)
Number of trips /day Total
capacity
Community concrete bins 600 0.3 to 0.6 - -
Community metal bins 120 2 - -
Wheel barrows 150 - - -
Tricycles 250 0.2 3 -
Truck/ tractor 35 2.5 3 262.50
Dumper placer 6 4 2 48
Total 1161 310.50
Problems & Issues
• Lack of scientific disposal of garbage • Recycling process though initiated, could not take off effectively. • Segregation at source is not gaining momentum in the absence of
proper recycling of segregated waste

• Inadequate machinery and man power resulting in ineffective collection and disposal of garbage
• Inadequate number of dust bins in residential localities resulting in waste from houses is thrown on roads.
• Only 89% of solid waste is lifted per day. 3.4.6 Lighting Existing street lights Street lights fitted with 4’ tube lights - 10938 ,, with 70W SV lamps - 587 ,, with 150W SV lamps - 861 ,, with 125W MV lamps - 828
,, with 250W MV lamps - 537 ,, with 150W MH lamps - 60 ,, with 250W MH lamps - 108 ,, with 400W MH lamps - 52 High mast lights - 25
Average power bill on street lighting - Rs 25.00 lakhs per month Problems & Issues
• Lack of street lights along internal roads and some main roads especially in fringe areas
• Low voltage due to over load on transformers • Lack of high mast lights at road junctions • Low power consumption efficiency • Delay in replacement of fused bulbs due to inadequate machinery • Absence of energy audit on street lights
3.5 Community requirements 3.5.1 Education TABLE 3.5.1 Category wise number of schools
Ownership Primary school Upper primary school
High school
Municipal Corporation schools 86 18 10
Aided schools 23 15 15

Un aided schools 5 5 -
Total 114 38 25
TABLE 3.5.2 Distribution of teachers and students
Teaching staff Primary school Upper
primary school High school
Teachers working 344 96 186
Student – teacher ratio 32:1 51:1 20:1
Infrastructure Schools running in rented buildings/ in dilapidated condition Elementary schools : 19 nos 22% U P schools : 12 nos 67% Schools having pucca roof buildings Elementary schools : 40 nos 46% U P schools : 10 nos 56% Schools having drinking water facility Elementary schools : 59 nos 68% U P schools : 13 nos 56% Schools having toilet facility Elementary schools : 44 nos 51% U P schools : 13 nos 56% Problems and issues
• Only 57% of school buildings are structurally good • Most primary schools are not having play grounds • Shortage of teachers in UP schools • 19 elementary schools out of 86 are running in rented buildings
3.5.2 Health care Major Hospitals available for general public Government General Hospital St Josephs Convent Hospital Railway Hospital (meant exclusively for railways)

250 private hospitals/ nursing homes Health care by Municipal Corporation Urban health centers - 9 Municipal Dispensaries - 5 Problems and Issues
• Improper facilities in existing health centers • Lack of govt. run intermediate hospitals in the city • Lack of new equipment in existing health centers •
3.5.3 Parks, play grounds & Recreation Public parks available - 19 nos - 73.49 acres Play grounds available - 4 nos - 18.00 acres Cinema theatres - 30 nos Auditoriums - 4 nos Swimming pool - 1 no. Problems and Issues
• Lack of sufficient play grounds • Lack of proper seating facilities even in existing parks • Inadequate maintenance of municipal parks • Improper facilities in existing health centers • Inadequate recreation facilities like cinema theatres, auditoriums,
clubs • Shabby maintenance of cinema theatres
3.5.4 Greenery Roads medians available for development of greenery Collectorate road (Municipal TB to Stambhala garuvu) Bus stand road (Municipal Corporation office to Bus stand) Koritepadu road (Sankar vilas center to Gujjana gulla) Parks with greenery provision Gandhi park opp Municipal Market Manasa sarovaram on NH bypass road Problems and Issues

• Water bodies available being unused for development of peripheral
greenery • Absence of local body owned nursery
3.5.5 Markets and Commercial centers Number of major Municipal shopping complexes - 26 nos Number of small Municipal shopping complexes - 34 nos Major market complexes - 3 nos Problems and Issues
• Inadequate facilities in the market complexes • Inadequate market complexes to the needs of the city • Dilapidated condition of the market complexes
3.6 Physical and Environmental aspects
TABLE 3.6.1 Environment service
Environment service Quality
Air Suspended particulate matter of 148.90 ug/cum
against Indian standard of 140.00 ug/cum
Water Moderately turbid in the absence of pre-settling
tanks / SS Tanks
Waste water Effluent standards not upto mark due to defunct
Sewage treatment plant
Solid waste Open dumping causing nuisance instead of
scientific disposal
TABLE 3.6.2 Land Supply (Hectares)
Year Developed land
(Hectares)
Undeveloped and under developed land under use
(Hectares)
2001/ 02 4047.19 1324.85

TABLE 3.6.3 Land use break up
Category Area % to developed area % to total area
Developed Components
Residential 1170.80 28.93 21.79
Mixed Residential 45.44 1.12 0.85
Un-occupied Residential 1214.23 30.00 22.60
Commercial 279.69 6.91 5.21
Industrial 133.58 3.30 2.49
Public & Semi Public 231.85 5.73 4.32
Educational 128.50 3.18 2.39
Recreational 47.84 1.18 0.89
Roads 781.56 19.31 14.55
Railway 13.70 0.34 0.26
Sub Total 4047.19 100.00 75.35
Un-Developed Components
Agricultural Area 1266.57 95.60 23.58
Water Bodies 48.75 3.68 0.91
Burial Grounds 9.53 0.72 0.18
Sub Total 1324.85 100.00 24.67
Grand Total 5372.04 200.00 100.00
TABLE 3.6.4 Institutional Responsibility

Urban Infrastructure Planning and design Construction Operation & Maintenance
Water supply
Guntur Municipal Corporation &
Public Health Engg Department
Guntur Municipal Corporation &
Public Health Engg Department
Guntur Municipal Corporation
Sewerage
Guntur Municipal Corporation &
Public Health Engg Department
Guntur Municipal Corporation &
Public Health Engg Department
Guntur Municipal Corporation
Storm water drainage
Guntur Municipal Corporation &
Public Health Engg Department
Guntur Municipal Corporation
Guntur Municipal Corporation
Solid waste disposal Guntur Municipal
Corporation Guntur Municipal
Corporation Guntur Municipal
Corporation
Municipal roads (Including flyovers)
Guntur Municipal Corporation
Guntur Municipal Corporation
Guntur Municipal Corporation
Street lighting Guntur Municipal
Corporation Guntur Municipal
Corporation Guntur Municipal
Corporation
TABLE 3.6.5 Role of the private sector in urban Infrastructure provision Urban Infrastructure Role of the Private sector (specify)

Water supply
a) Investigation, Design & estimation through Consultancy
b) Execution of works through contracts c) O & M, if permitted, through maintenance contracts
Sewerage
a) Investigation, Design & estimation through Consultancy
b) Execution of works through contracts c) O & M, if permitted, through maintenance contracts
Storm water drainage
a) Investigation, Design & estimation through Consultancy
b) Execution of works through contracts
Solid waste disposal
a) Investigation, Design & estimation through Consultancy
b) Execution of works through contracts c) O & M, if permitted, through maintenance contracts d) Conversion of solid waste into fuel by BOOT process
Municipal roads (Including flyovers)
a) Investigation, Design & estimation through Consultancy
b) Execution of works through contracts
Street lighting
a) Investigation, Design & estimation through Consultancy
b) Execution of works through contracts c) O & M, if permitted, through maintenance contracts
3.7 Natural Environmental Features: WATER QUALITY: Guntur Town primarily gets its water supply from two surface sources (Takkellapadu and S.J. Mudi) and one ground water cum surface water source ( Vengalayapalem).The coverage of first two sources is about 90% and the third source coverage is only 10%. The total population covered by piped water supply is about 80% and the rest of the population is covered by water transportation and ground water. The ground water available in 70% of the area is not fit for human consumption because of high salinity . The average per capita supply level at present is about 96 LPCD. AIR QUALITY:
The total number of vehicles in Guntur town are 5900 nos. and of late the air pollution levels have increased enormously causing great public health hazard. The main factors for increase in air pollution levels are due to number of old vehicles which do not conform to the emission standards prescribed and also due to proximity of the mirch yards which are causing air pollution by releasing pungent gases. In addition to the above, there are number of tobacco grading ,threshing and processing plants very close to habitations which are polluting the air quality. There are number of brick kilns in old Guntur area (towards Nandivelugu road) which are not conforming to the emission standards prescribed by MoE & F, GoI thereby deteriorating the quality of air in the surrounding areas. The air quality has deteriorated on the Nandivelugu and Ponnuru roads side because of ineffective and inefficient functioning of the STP. The BOD of the effluent is about 60 PPM and is being directly used by many farmers for growing grass in a large extent there by deteriorating the air and soil qualities. Towards the west of the town, i.e., towards NRT road and Madras rd. , there are number of cold storage plants which release large amount of CFS's there by contributing to Ozone depletion and attendant risks in environmental degradation FLOODING: The Guntur town has a general topography of around +45.00 m on N-W side to around +17.00m on S-E side. many areas on the southern and eastern sides gets flooded/inundated during medium to high intensity rains. there are about five major out fall drains namely; Peekalavagu , Nandivelugu drain, Suddapalli donka drain, Budampadu drain and Kankaragunta drain. All the above drains cross the nh5 bye pass at different chainages and if all these are properly desilted and maintained with proper cross sections , most of the flood discharge can be taken care of. ENVIRONMENTAL IMPACTS OF EXISTING INFRASTRUCTURE: SANITATION: Around 60% of the population are covered by UGD system and the remaining 40% population are covered with septic tanks.

Even in places where UGD is covered, open defecation is being noticed because of people bye passing the system and leaving the night soil directly in to the open drains. This has become one of the most vulnerable aspects particularly in rainy season as many water supply lines cross open drains at many places. In places where septic tanks coverage is there , night soil disposal has become the biggest problem. normally the evacuation of the tank starts in the night and the night soil will be dumped near the road margins or in open drains again causing public hazard. SOLID WASTE MANAGEMENT: In Guntur town almost around 350 MT. of garbage is being produced and the present disposal of the majority of the garbage is conveying and dumping in the specified places.
The present system of transportation is mainly through tractors . major dumping sites are situated on the Nandivelugu and Etukuru rd. sides. These are presently causing public health hazard by obnoxious odours, fly nuisance and leachate causing water pollution. Presently there is no system of segregating the biomedical wastes.
Also, GMC has finalized with m/s Shriram Energy, Chennai to set up an MSW pellatisation plant in Etukuru road dumping yard which will start construction of plant from Dec.2001 and once this plant is commissioned around 150 mt of biodegradable garbage will be utilized by the plant. GMC strictly enforces the ban on pigmented carry bags less than 20 microns as per the norms of MOE &F , GOI. GMC is also implementing the green act which stipulates minimum number of trees in each house hold if there is open site or certain min. number of ornamental/indoor plants in flower pots where there is no space like commercial and shopping complexes.
3.8 Common Grievances from the citizens
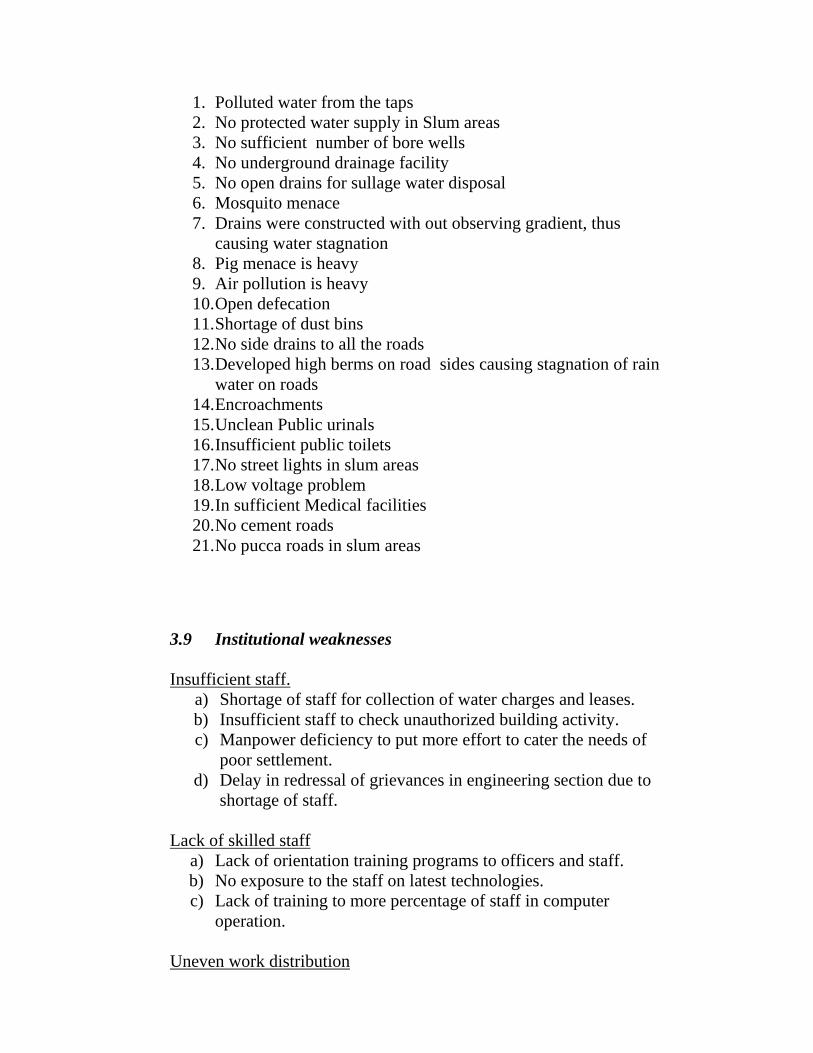
1. Polluted water from the taps 2. No protected water supply in Slum areas 3. No sufficient number of bore wells 4. No underground drainage facility 5. No open drains for sullage water disposal 6. Mosquito menace 7. Drains were constructed with out observing gradient, thus
causing water stagnation 8. Pig menace is heavy 9. Air pollution is heavy 10. Open defecation 11. Shortage of dust bins 12. No side drains to all the roads 13. Developed high berms on road sides causing stagnation of rain
water on roads 14. Encroachments 15. Unclean Public urinals 16. Insufficient public toilets 17. No street lights in slum areas 18. Low voltage problem 19. In sufficient Medical facilities 20. No cement roads 21. No pucca roads in slum areas
3.9 Institutional weaknesses Insufficient staff.
a) Shortage of staff for collection of water charges and leases. b) Insufficient staff to check unauthorized building activity. c) Manpower deficiency to put more effort to cater the needs of
poor settlement. d) Delay in redressal of grievances in engineering section due to
shortage of staff. Lack of skilled staff
a) Lack of orientation training programs to officers and staff. b) No exposure to the staff on latest technologies. c) Lack of training to more percentage of staff in computer
operation. Uneven work distribution

a) Multi faceted activities without a time- table and un-organised
working system. b) Unorganised working system. c) Uneven distribution of workload to Bill collectors
Improper Accounting system
a) Unsettled D.C.B. in Revenue Section. b) Unsettled ADR. c) Unsettled Annual Accounts.
Under utilization of MIS systems
a) Partial Computerization. b) Lack of awareness on MIS systems c) No initiative to create data base on inventory and services.
Infrastructural drawbacks
a) Frequent leakages on water supply lines. b) Age-old infrastructure network viz., water supply lines, and
drainage lines. c) Un planned open drains.
Others
a) Non-availability of latest equipment to Engineering section for check measurements and recording qualitative data, and to P.H.Section for food sampling activities.
b) Inadequate accommodations. c) Poor record maintenance. d) Corporators are not conversant with rules, procedures and
system. e) Pendency of taxes in litigation. f) Heavy expenditure on electricity charges.

Chapter
4 VISIONVISIONVISIONVISION
THE VISION
To make GUNTUR, an akshaya city which can
welcome any new comer who wish to settle down or to
visit, at any point of time, with all the facilities and
services, after fulfilling all the needs of the natives.
Thus GUNTUR can be said a ‘city of opportunity’
which can provide - abode & employment, water &
sanitation, roads & recreation, health & education for
every one with reserve resources at any point of time.

4.1 Developing a vision for the City TABLE 4.1.1 Vision and Goals
Year Vision and Goals
2010 2015 2020
Sectoral Agenda Water supply a) Source b) Transmission c) Storage d) Distribution net work
100% coverage of distribution system a) Stabilisation of canal for the ultimate requirements b) Minimising Transmission UFW c) Completion of additional 5 ELSRs d) 100% coverage of distribution system
Achieving per capita as per standards a) Provision of Summer storage tank b) Minimising cost of transmission c) Achieving 100% Zonal reservoirs concept. d) Minimising the distribution losses
Achieving 24X7 WS for all areas a) Exploring and providing the alternate source for 24x7 WS goal. b) Implementing the recommendations of Comprehensive studies c) -do- d) Providing meters to all connections.
Sewerage
Safe disposal of sewage generated at present.
Coverage of 100% area with sewerage system
100% sewerage system with proper treatment and revenue generation
Sanitation Stopping the menace of open defecation
100% coverage of all house holds with latrine facilities
100% coverage of all house holds with latrine facilities
Solid waste Management
100% segregation of garbage generated
Development of landfill sites and safe environment concept
Recycling the garbage and power production
Storm water drains 50% development of all outfall drains
100% channelisation of all outfall drains
100% coverage of all storm water drains
Urban Transport Implementation of short term proposals recommended in Zonal Development plan by VGTMUDA
Implementation of proposals recommended by the Comprehensive Traffic study team.
Development of ring roads and comprehensive proposals under Zonal Development plan and Comprehensive proposals
Heritage Evolving strategies for economically feasible eco-tourism projects and involving private sectors for conservation of heritage and tourism.
Study the impact and develop major tourism hub for the various heritage places in & around Guntur in a big way.
Development of Tourism as an industry.
Reform Agenda

Decentralization Comprehensive study of all activities of the GMC by an independent administrative consultant and evolving strategy and implementation of Administrative reforms
Land & Housing markets
Implementation of Zonal Master Plan recommendations of VGTMUDA
Transparency and accountability
Implementation of all Administrative reforms

4.2 Gaps identified
Infrastructure 4.2.1 WATER SUPPLY : Source : Dependence on Irrigation canals is causing ULB to switch between alternate sources, thus investing huge amounts in O&M and capital expenditure.
*Development of permanent, dependable perennial source exclusively for Drinking water for the city and for all surrounding and en route villages which can be economical involving less O&M. This source can either from Krishna River or from NS canals. Suitable source exploration can be done in Comprehensive Water Supply studies under APUSP. As the recommendations will be comprehensive and may involve huge investments, the project has to be taken up under central assistance or under HUDCO loan. If the proposal happens to be grounded earlier than expected, the provision of summer storage tank as proposed can be differed with, as the land cost around Guntur is prohibitively high.
Transmission : The existing transmission mains are the major contributors for the UFW in the form of leakages. Some of such transmission mains are a) 27” CI clear water pumping main from S J Mudi WTP to LLR & HLR b) 1200 mm RCC clear water transmission main from Takkellapadu WTP to Nehrunagar sump. c) 900 mm PSC raw water pumping main from Mangalagiri pump house to Takkellapadu. d) 800 mm PSC transmission main from Nehrunagar to HLR e) 600/450 mm RCC main from Manipuram to BR Stadium/ Nallacheruvu. Further the water is being transmitted from lowest altitude to the highest altitude through multistage pumping, thus involving huge amounts in power charges.
* A study is necessary on realistic LS and alignments of all the transmission mains and on possible alternatives, by an independent expert water supply consultant on how to minimize UFW, O&M, transmission costs. The comprehensive study by APUSP can include
the above aspect. The recommendations have to be implemented immediately.
Storage : The total storage capacity of all the ELSRs in the city is 29770 KL. The requirement for the projected population of 636509 is 43000 KL. The present water supply pumping to Guntur town is around 17 MGD (13 MGD from Takkellapadu and 4 MGD from S.J. Mudi) and the net quantity being supplied is around 12 MGD and the UFW as per preliminary analysis is around 29.5 %. There is large UFW in the 1200mm dia RCC P1 Cl transmission main which is being repaired more frequently. 4.2.2 WASTE WATER DISPOSAL: Proposals • Construction of new open drains over 228.11 km length along the
existing roads and streets. • Up-gradation of existing Kutcha drains (open drains) over 350.76 km
length along the existing roads and streets. • Construction of UGD for 150.91 km length along the main roads and
street in 26 wards. • Up-gradation of existing UGD for 42.64 km length, along the existing
roads and streets in 4 wards. • Construction of new treatment units at identified areas. • Apart from the open drains proposed in the internal roads,
channelisation of major outfall drains is a major task proposed in city development plan.
4.2.3 SANITATION: Proposals • Construction of public toilets at public gathering places and leasing out
O&M to private agencies • Construction of sufficient number of community toilets to avoid open
defecation and entrusting maintenance to the community groups • Providing internal sewer net works with independent treatment in the
poor settlements 4.2.4 SOLID WASTE MANAGEMENT:

strategies • Vermicomposting plants to be constructed effectively to manage
garbage, treatment is done in available open sites in each colony. This will reduce cost of SWM and rather “wealth from waste”.
• Door to door collection and segregation of waste at source point. • Community participation in promotion of vermi composting and
private participation in recycling of solid waste • Proper facilities and effective methodology in collection and
transportation of solid waste • Adopting technology intervention in SWM to generate more municipal
revenue Proposals • Decentralised vermi composting plants • Acquiring additional machinery for proper collection and
transportation. • Implementation of door to door collection system and segregation at
source • Development of land fill site • Inviting Public Private Partnerships in recycling and renewal of solid
waste. 4.2.5 STREET LIGHTING strategies • Providing adequate number of street poles and lights as per standards • Installation energy efficient light fixtures without reduction in lumens • Providing adequate machinery for O&M of street lights • Addressing Transco for provision of sufficient transformers • Planning and providing high masts where ever required Proposals • Conversion of all light fittings to energy efficient fixtures with the
technical guidance from IREDA and NEDCAP • Regular energy audit and energy saving tips by employing suitable HR • Exploring the feasibility and implementation of remote operation of
street lights

Community requirements 4.2.6 EDUCATION Strategies
• Providing adequate facilities in the schools such as play grounds, water supply, sanitary, electrical facilities.
• Sufficient number of teachers to be engaged as per student strength Proposals
• Construction of 21 UP schools by 2021 • Construction of 19 schools buildings for primary schools • Up gradation of 3 existing high schools with all facilities • Adding two more high schools by 2021
4.2.7 HEALTH CARE Strategies
• Providing sufficient number of intermediate hospitals at area level • Providing required facilities in existing and proposed hospitals
Proposals
• 1 General hospital • 18 intermediate hospitals phase wise • 31 health care centers phase wise • 1 veterinary hospital • 1 sisu sankshema hospital
4.2.8 PARKS, PLAY GROUNDS & RECREATION Strategies
• Providing adequate play grounds • Providing basic facilities in the parks • Proper maintenance of municipal recreation facilities • Enforcing maintenance code for private cinema theatres
Proposals
• 21 new parks in open spaces available • Up gradation of 13 existing parks and facilities • 22 community halls and libraries • 8 recreation clubs • 8 music, dance, drama centers • 8 meditation and spiritual centers • 2 Multiplex theatres under PPP • 1 theme park under PPP • 1 additional swimming & dive pool
4.2.9 GREENARY Strategies
• Developing more medians with greenery with involvement of private agencies
• Development water bodies with peripheral greenery • Encouraging Avenue plantation with public participation • Designation of specific open spaces as parks
Proposals
• Medians development in 7 major roads • 23 open spaces to be designated as parks • Development of Smrthivanam concept • Green belt along National & state highways • Development of water body fringes as green patches • Implementing massive plantation movement in seasons • Establishing municipal nursery
4.2.10 MARKETS AND COMMERCIAL CENTERS Strategies
• Decentralisation of Markets to make available to public with in reasonable distance & to ease traffic congestion
• Provision of commercial complexes with modern facilities • Improve municipal revenues by construction of additional shopping
complexes Proposals
• Construction of full pledged market complex in two town area • Conversion of existing market complex into modern complex • Conversion of old shopping complexes into multi faceted
commercial centers including multiplex theatres

• Construction of shopping complexes in the municipal vacant lands in the commercial zones
4.3 Institutional Reforms The most important aspect considered before implementation of any major scheme is Institutional Discipline in Financial matters and the Human Resource matters. Many reforms are under way and the Guntur Municipal Corporation is thriving in implementing these reforms and already could taste the fruits of these reforms. The mandatory reforms given for implementation of the IHSDP & UIDSSMT schemes are already at several stages of implementation. The reforms suggested for the implementation of IHSDP have been endorsed by the Corporation for implementation and these reforms are stipulated as below.
Mandatory Reforms :
Urban Local Body Reforms (at ULB Level) i) Adoption of modern, accrual-based double entry system of accounting in Urban Local Bodies. ii) Introduction of system of e-governance using IT applications like GIS and MIS for various services provided by ULBs. iii) Reform of property tax with GIS, so that it becomes major source of revenue for Urban Local Bodies (ULBs) and arrangements for its effective implementation so that collection efficiency reaches at least 85% within the Mission period. iv) Levy of reasonable user charges by ULBs/Parastatals with the objective that full cost of operation and maintenance is collected within the Mission period. However, cities/towns in North East and other special category States may recover at least 50% of operation and maintenance charges initially. These cities/towns should graduate to full O&M cost recovery in a phased manner. v) Internal earmarking within local body budgets for basic services to the urban poor.

vi) Provision of basic services to urban poor including security of tenure at affordable prices, improved housing, water supply, sanitation and ensuring delivery of other already existing universal services of the government for education, health and social security. State Level Reforms i) Implementation of decentralization measures as envisaged in Seventy Fourth Constitutional Amendment. States should ensure meaningful association/ engagement of ULBs in planning function of Parastatals as well as delivery of services to the citizens. ii) Rationalisation of Stamp Duty to bring it down to no more than 5% within the Mission period. iii) Enactment of community participation law to institutionalize citizen participation and introducing the concept of the Area Sabha in urban areas. iv) Assigning or associating elected ULBs into “city planning function” over a period of five years; transferring all special agencies that deliver civic services in urban areas and creating accountability platforms for all urban civic service providers in transition. OPTIONAL REFORMS i) Repeal of Urban Land Ceiling and Regulation Act. ii) Amendment of Rent Control Laws balancing the interest of landlords and tenants. iii) Enactment of Public Disclosure Law to ensure preparation of medium-term fiscal plan of ULBs and release of quarterly performance information to all stakeholders. iv) Revision of bye-laws to streamline the approval process for construction of buildings, development of sites, etc. v) Simplification of legal and procedural frameworks for conversion of agricultural land for non-agricultural purposes. vi) Introduction of Property Title Certification System in ULBs. vii) Earmarking at least 20-25% of developed land in all housing projects (both Public and Private Agencies) for EWS/LIG category with a system of cross subsidization. viii) Introduction of computerized process of registration of land and property.

ix) Revision of bye-laws to make rain water harvesting mandatory in all buildings to come up in future and for adoption of water conservation measures. x) Bye-laws on reuse of recycled water. xi) Administrative reforms, i.e., reduction in establishment by bringing out voluntary retirement schemes, non-filling up of posts falling vacant due to retirement etc., and achieving specified milestones in this regard. xii) Structural reforms xiii) Encouraging Public-Private partnership. NOTE: States/ULBs will be required to implement the Mandatory Reforms and Optional Reforms within the Mission period. The States/ULBs need to choose at least two Optional Reforms each year for implementation. The details of reforms which have already been implemented and/or proposed to be taken up should be included in the detailed project reports.

Chapter
5 URBAN POORURBAN POORURBAN POORURBAN POOR
Basic services to the Urban Poor : 5.1 Assessment of existing condition:
For the purpose assessment of the condition of urban poor, surveys have been conducted before the launching of APUSP program in notified slums as well as non notified slums. This survey was carried out on the parameters specific for assessing the Socio, Economic and Infrastructural aspects. The summary of the survey carried out in 109 notified slums and the 24 non- notified slums is as follows. TABLE 5.1 STATISTICS OF INFRASTRUTURE IN SLUMS
Parameter Notified slums
Non notified slums Total
Slums 109 24 133
Population 179653 12162 191815
BPL 96763 7970 104733
SC population 32550 2281 34831
ST population 6550 1646 8196
Water supply Population without own tap facility
137823
11800
120023
Storm Water Drains length of storm water drains needed Pucca drains existing Drains to be constructed
361048 mtr
91488 mtr
269560 mtr
48010 mtr
4973 mtr
43037 mtr
409058 mtr
96461 mtr
312597 mtr
Roads Total length of roads Pucca roads existing Pucca Roads to be laid
186522 mtr
26431 mtr
160091 mtr
24320 mtr
1835 mtr
22485 mtr
210842 mtr
28266 mtr
182576 mtr
Street lights

Total required existing to be provided
6326 nos
4386 nos
1940 nos
841 nos
399 nos
442 nos
7167 nos
4785 nos
2382 nos 5.2 Ongoing reforms :
Through the implementation of the APUSP scheme under DFID
Program some of the slums could be provided with the basic facilities. The selection of the slums is also been done through the scientific approach with the involvement of stakeholders. The survey of the existing scenario has been formulated into the matrix and the prioritization has been done based on the Poverty & Vulnerability condition and the Environmental Infrastructure deficiency aspects.
This APUSP scheme could be implemented in three stages so far and
a total 43 slums out of 143 slums could be provided with the basic facilities. The details of works carried out in the three stages of APUSP scheme are as under. TABLE 5.2 Out come of the schemes meant for urban poor
B MAPP C MAPP C MAPP 2nd cycle Total
Slums 12 13 12+6 43
Population 15549 14051 13942 43542
Water supply (population benefited)
15549 14051 13942 43542
Storm Water Drains
27108 mtr 29483 mtr 37954 mtr 94545 mtr
Roads
17596 mtr 17003 mtr 22519 mtr 57118 mtr
Street lights
- - - -
5.3 Gap analysis :
Even after due importance is given to provision of basic facilities in
the slums there is a lot to be done in this sector. The reason being the large number of slums in Guntur i.e. 143. This figure is huge when compared to many cities in AP.
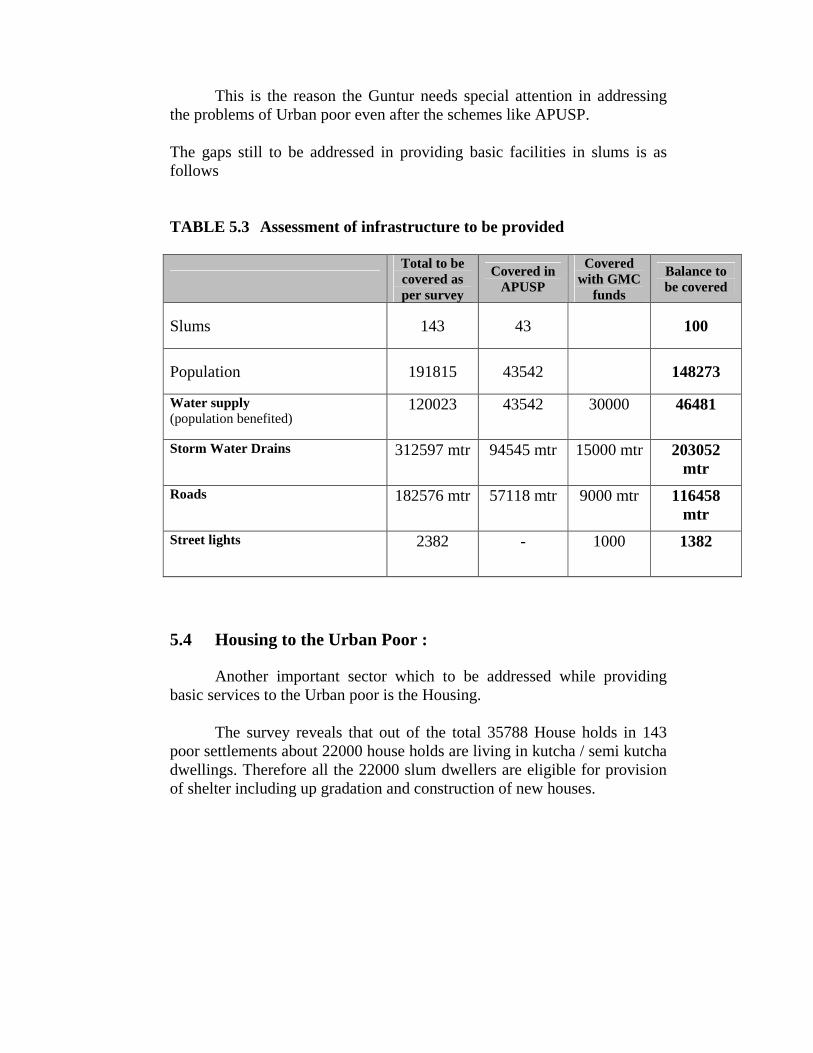
This is the reason the Guntur needs special attention in addressing
the problems of Urban poor even after the schemes like APUSP. The gaps still to be addressed in providing basic facilities in slums is as follows TABLE 5.3 Assessment of infrastructure to be provided
Total to be covered as per survey
Covered in APUSP
Covered with GMC
funds
Balance to be covered
Slums 143 43 100
Population 191815 43542 148273
Water supply (population benefited)
120023 43542 30000 46481
Storm Water Drains
312597 mtr 94545 mtr 15000 mtr 203052 mtr
Roads
182576 mtr 57118 mtr 9000 mtr 116458 mtr
Street lights
2382 - 1000 1382
5.4 Housing to the Urban Poor :
Another important sector which to be addressed while providing basic services to the Urban poor is the Housing.
The survey reveals that out of the total 35788 House holds in 143
poor settlements about 22000 house holds are living in kutcha / semi kutcha dwellings. Therefore all the 22000 slum dwellers are eligible for provision of shelter including up gradation and construction of new houses.

Chapter
6
City Investment Pan
&
Financing Strategies

6.1 Proposals for slum Development
Integrated Housing & Slum Development Program
(IHSDP)
Integrated Housing & Slum Development Program aims at
combining the existing schemes of VAMBAY and NSDP under the
new IHSDP Scheme for having an integrated approach in ameliorating
the conditions of the urban slum dwellers who do not possess adequate
shelter and reside in dilapidated conditions
The basic objective of the Scheme is to strive for holistic slum
development with a healthy and enabling urban environment by
providing adequate shelter and basic infrastructure facilities to the
slum dwellers of the identified urban areas.
The components for assistance under the scheme will include
all slum improvement/ up gradation/ relocation projects including up
gradation/ new construction of houses and infrastructural facilities,
like, water supply and sewerage.

6.1.1 Admissible Components
i) Provision of shelter including up gradation & construction of new houses. ii) Provision of community toilets. iii) Provision of physical amenities like water supply, storm water drains, community bath, widening and paving of existing lanes, sewers, community latrines, street lights, etc. iv) Community Infrastructure like provision of community centers to be used for pre-school education, non-formal education, adult education, recreational activities, etc. v) Community Primary Health Care Center Buildings can be provided. vi) Social Amenities like pre-school education, non-formal education, adult education, maternity, child health and Primary health care including immunization, etc. vii) Provision of Model Demonstration Projects. viii) Sites and Services/houses at affordable costs for EWS & LIG categories. ix) Slum improvement and rehabilitation projects. x) Land acquisition cost will not be financed Note: DPRs will have to be prepared by the implementing agencies for funding under IHSDP including specific project components, viz, health, education and social security.
However, the schemes of health, education and social security will be funded through convergence of schemes and dovetailing of budgetary provisions available under the programs of the respective sectors (Health, Human Resource Development, Social Justice and Empowerment and Labour, etc.), but will also be monitored by the Ministry of Urban Employment & Poverty Alleviation in so far as urban poor are concerned.
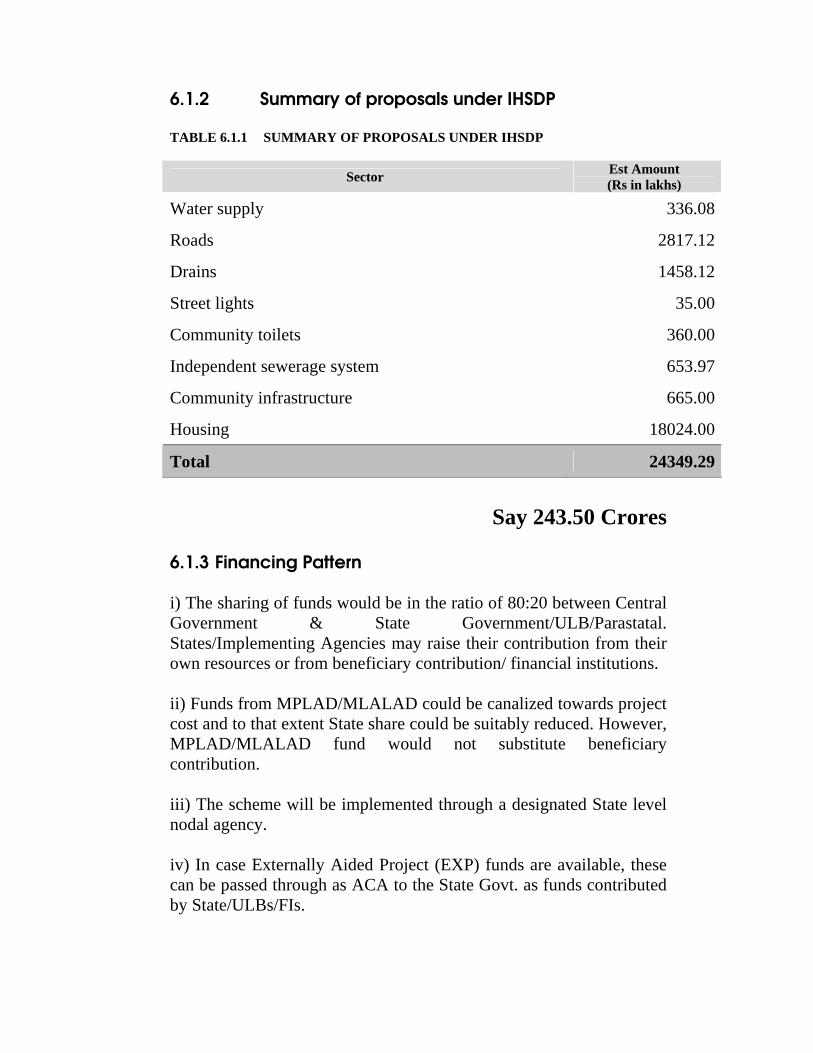
6.1.2 Summary of proposals under IHSDP TABLE 6.1.1 SUMMARY OF PROPOSALS UNDER IHSDP
Sector Est Amount (Rs in lakhs)
Water supply 336.08
Roads 2817.12
Drains 1458.12
Street lights 35.00
Community toilets 360.00
Independent sewerage system 653.97
Community infrastructure 665.00
Housing 18024.00
Total 24349.29
Say 243.50 Crores
6.1.3 Financing Pattern i) The sharing of funds would be in the ratio of 80:20 between Central Government & State Government/ULB/Parastatal. States/Implementing Agencies may raise their contribution from their own resources or from beneficiary contribution/ financial institutions. ii) Funds from MPLAD/MLALAD could be canalized towards project cost and to that extent State share could be suitably reduced. However, MPLAD/MLALAD fund would not substitute beneficiary contribution. iii) The scheme will be implemented through a designated State level nodal agency. iv) In case Externally Aided Project (EXP) funds are available, these can be passed through as ACA to the State Govt. as funds contributed by State/ULBs/FIs.

6.1.4 Sector wise Proposals under IHSDP Water supply : Rs 336.08 lakhs TABLE 6.1.2 WATER SUPLY PROPOSALS UNDER IHSDP
Description of proposal Quantity rate Est Amount Rs in lakhs
Distribution net work 68990 rmt Rs 400/ rmt 275.96
Making connections under Rs1200 per tap scheme
10020 nos Rs 600/ each 60.12
Total 336.08 Roads : Rs 2817.12 lakhs TABLE 6.1.3 ROADS PROPOSALS UNDER IHSDP
Description of proposal Quantity rate Est Amount Rs in lakhs
Laying of pucca roads 116460 rmt Rs 2200/ rmt 2562.12
Providing approach roads 8500 rmt Rs 3000/ rmt 255.00
Total 2817.12 Drains : Rs 1458.12 lakhs TABLE 6.1.4 DRAINS PROPOSALS UNDER IHSDP
Description of proposal Quantity rate Est Amount Rs in lakhs
Construction of pucca drains 221020 rmt Rs 600/ rmt 1326.12
Construction of offsite out fall drains 11000 rmt Rs 1200/ rmt 132.00
Total 1458.12 Street lights : Rs 35.00 lakhs
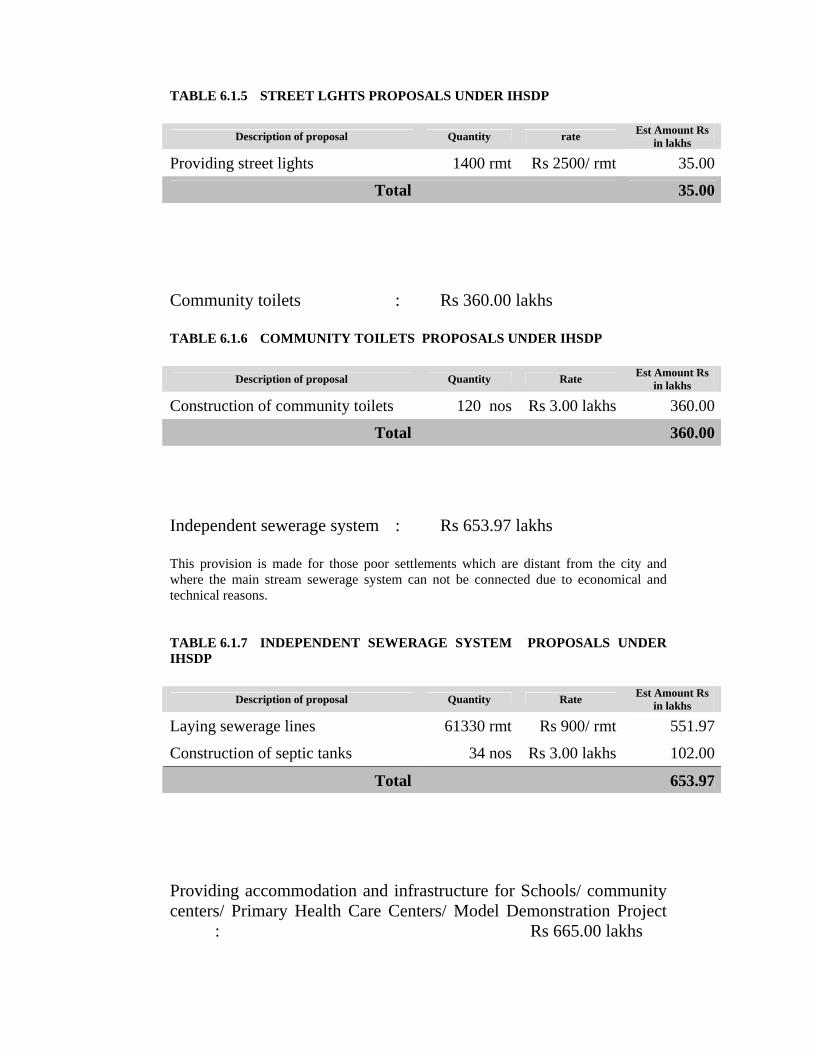
TABLE 6.1.5 STREET LGHTS PROPOSALS UNDER IHSDP
Description of proposal Quantity rate Est Amount Rs in lakhs
Providing street lights 1400 rmt Rs 2500/ rmt 35.00
Total 35.00 Community toilets : Rs 360.00 lakhs TABLE 6.1.6 COMMUNITY TOILETS PROPOSALS UNDER IHSDP
Description of proposal Quantity Rate Est Amount Rs in lakhs
Construction of community toilets 120 nos Rs 3.00 lakhs 360.00
Total 360.00 Independent sewerage system : Rs 653.97 lakhs This provision is made for those poor settlements which are distant from the city and where the main stream sewerage system can not be connected due to economical and technical reasons. TABLE 6.1.7 INDEPENDENT SEWERAGE SYSTEM PROPOSALS UNDER IHSDP
Description of proposal Quantity Rate Est Amount Rs in lakhs
Laying sewerage lines 61330 rmt Rs 900/ rmt 551.97
Construction of septic tanks 34 nos Rs 3.00 lakhs 102.00
Total 653.97 Providing accommodation and infrastructure for Schools/ community centers/ Primary Health Care Centers/ Model Demonstration Project : Rs 665.00 lakhs

TABLE 6.1.8 SCHOOL INFRASTRUTUE PROPOSALS UNDER IHSDP
Description of proposal Quantity Rate Est Amount Rs in lakhs
Construction of building 133 nos Rs 4.00 lakhs 532.00
Providing relevant infrastructure 133 nos Rs 1.00 lakhs 133.00
Total 665.00
Housing : Rs 18024.00 lakhs TABLE 6.1.9 HOUSING PROPOSALS UNDER IHSDP
Description of proposal Quantity Rate Est Amount Rs in lakhs
Number of houses proposed 22530 rmt Rs 0.80 lakhs 18024.00
Total 18024.00

6.2 Proposals for Integrated Development of City Infrastructure
Urban Infrastructure Development Scheme for Small & Medium Towns
(UIDSSMT)
Urban Infrastructure Development Scheme for Small & Medium Towns (UIDSSMT) is a convergence
scheme for the existing IDSSMT with extended features towards providing urban infrastructure in all sectors for
overall integrated development of the city.
The components proposed for assistance under this scheme
include all developmental activities in all sectors dealt by the
Municipal Corporation. The proposals are made to be implemented in
a phased manner to suit the Financing pattern. This enables reviewing
the out come of implementation and further improvising the proposals.
6.2.1 Components Proposed
i) Water supply – achieving self sufficiency as envisaged in the
Vision and to over come the draw backs in the existing system.
ii) Traffic & Transportation - implementing Traffic
management measures and Traffic engineering measures for easing out congestion for the ultimate population requirements
iii) Waste water disposal -
Sewerage system - Coverage of entire city with under ground drainage scheme and safe disposal of effluents with proper treatment Storm water drains - Coverage of entire city with storm water drains to avoid inundation and stagnation of water causing unhygienic conditions.
iv) Sanitation - Providing sanitation facility to all the citizens
as well as floating population to improve the sanitation look of the city
v) Solid waste management - implementation of effective
collection, transportation, disposal of garbage and implementing methods of recycling to attract revenue.
vi) Street lighting - Provision of effective avenue illumination
with appropriate energy savings initiatives and cost cutting methods in O&M.
vii) Education - Construction of new school building and
strengthening of existing one. Providing sanitation, water supply and electricity facilities.
viii) Health care - Provision of health care centers with
infrastructure as per the requirements of ultimate population.
ix) Parks, play grounds and recreation centers - Development of open spaces into parks, up gradation of existing parks, provision of community halls, recreational clubs, music dance drama centers, meditation and spiritual centers.
x) Markets, commercial centers - Construction of modern commercial complexes in heart of the city, markets with approach to all parts of the city, Multiplex complexes etc.
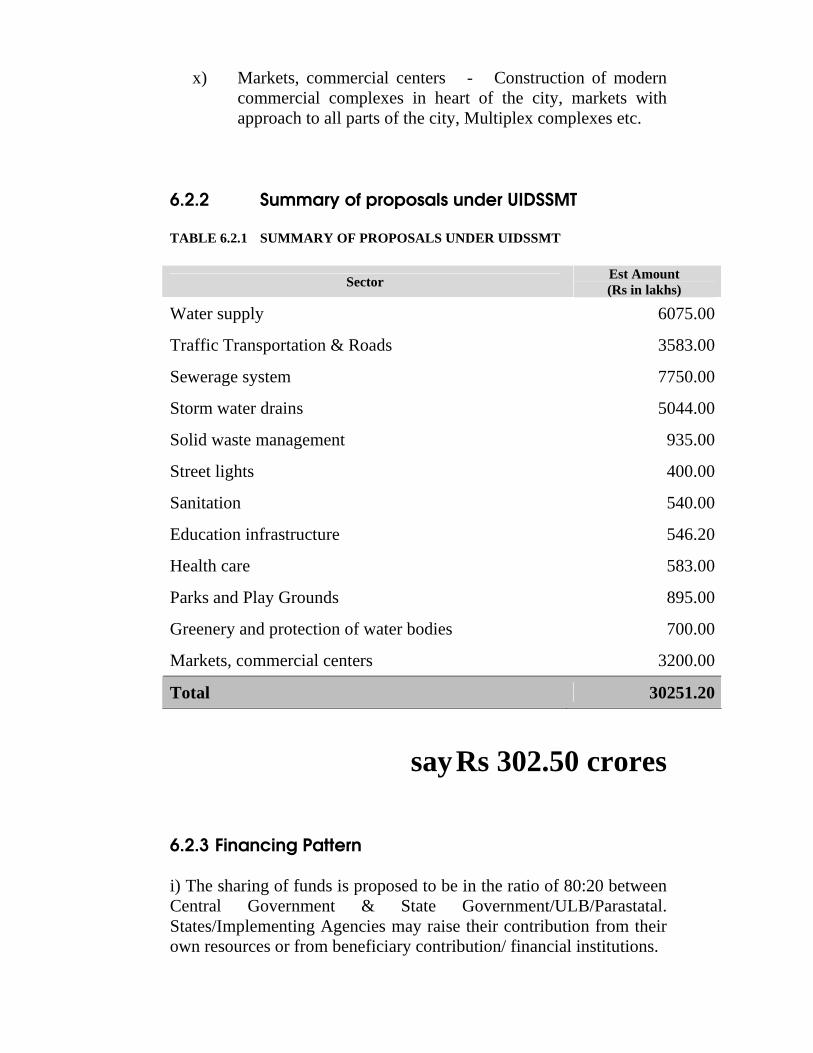
6.2.2 Summary of proposals under UIDSSMT TABLE 6.2.1 SUMMARY OF PROPOSALS UNDER UIDSSMT
Sector Est Amount (Rs in lakhs)
Water supply 6075.00
Traffic Transportation & Roads 3583.00
Sewerage system 7750.00
Storm water drains 5044.00
Solid waste management 935.00
Street lights 400.00
Sanitation 540.00
Education infrastructure 546.20
Health care 583.00
Parks and Play Grounds 895.00
Greenery and protection of water bodies 700.00
Markets, commercial centers 3200.00
Total 30251.20
say Rs 302.50 crores
6.2.3 Financing Pattern i) The sharing of funds is proposed to be in the ratio of 80:20 between Central Government & State Government/ULB/Parastatal. States/Implementing Agencies may raise their contribution from their own resources or from beneficiary contribution/ financial institutions.

ii) The phasing of implementation of the scheme is short term & immediate needs in all sectors : 50% by 2010 Medium term proposals for prospective population requirements in all sectors : 30% by 2015 Long term proposals for ultimate population requirements in all sectors : 20% by 2020 6.2.4 Sector wise Proposals under UIDSSMT Water supply : Rs 6075.00 lakhs TABLE 6.2.2 WATER SUPPLY PROPOSALS UNDER UIDSSMT
Description of proposal Est Amount Rs in lakhs
Redesigning of distribution system to avoid low pressure in all reservoir zones as short term proposal
200.00
Construction of ELSR at 5 locations i.e SVN Colony, NGO Colony, RTC Colony, IPD Colony and Amaravathi Road with necessary pumping stations and transmission mains
750.00
Providing W.S. distribution feeders to peripheral parts of the city
150.00
Extension of distribution lines in unserved areas 250.00
To provide cement lining and bunding to the Guntur Channel which assures uninterrupted source during summer also
600.00
Construction of Summer storage tank or exploring other alternate perennial source
2200.00
Replacement of Booster Pump sets at various locations including ancillary electrical and civil works
70.00
Improvements to SS Tank (1824 ML) at SJ Mudi like Deepeneing, Strengthening of Bunds, Revetment/Lining, Fencing etc.
400.00
Refurbishing of 27" CI Pumping Main from SJ Mudi to Guntur (2.00 Km)
350.00
Providing flow meters at all strategic points to check UFW 75.00

Providing consumer meters to all connections as part of implementation of 24 x 7 water supply
400.00
Providing water quality monitoring laboratories at WTPs and chlorination plants at all reservoir premises
30.00
Construction of additional storage facilities like sumps and ELSRs as part implementation of 24 x 7 water supply
600.00
Total 6075.00 Traffic, Transportation & Roads : Rs 3583.00 lakhs TABLE 6.2.3 TRAFFIC, TRANSPORTATION ROADS PROPOSALS UNDER UIDSSMT
Description of proposal Est Amount Rs in lakhs
Major roads widening and improvement 535.00
Improvement of road junctions 243.00
Strengthening of existing CC & BT roads 1905.00
Providing Road markings, Traffic signs, Central median, parking, Footpath
250.00
Development of new link roads 650.00
Total 3583.00 Sewerage system : Rs 7750.00 lakhs TABLE 6.2.4 SEWERAGE SYSTEM PROPOSALS UNDER UIDSSMT
Description of proposal Est Amount Rs in lakhs
Coverage of sewerage system for block 3 area of the city with separate treatment plant
6400.00
Strengthening existing sewerage system 650.00
Renovation of existing sewage treatment plant at Suddapalli donka
700.00
Total 7750.00 Storm water drains : Rs 5044.00 lakhs TABLE 6.2.5 STORM WATER DRAINS PROPOSALS UNDER UIDSSMT
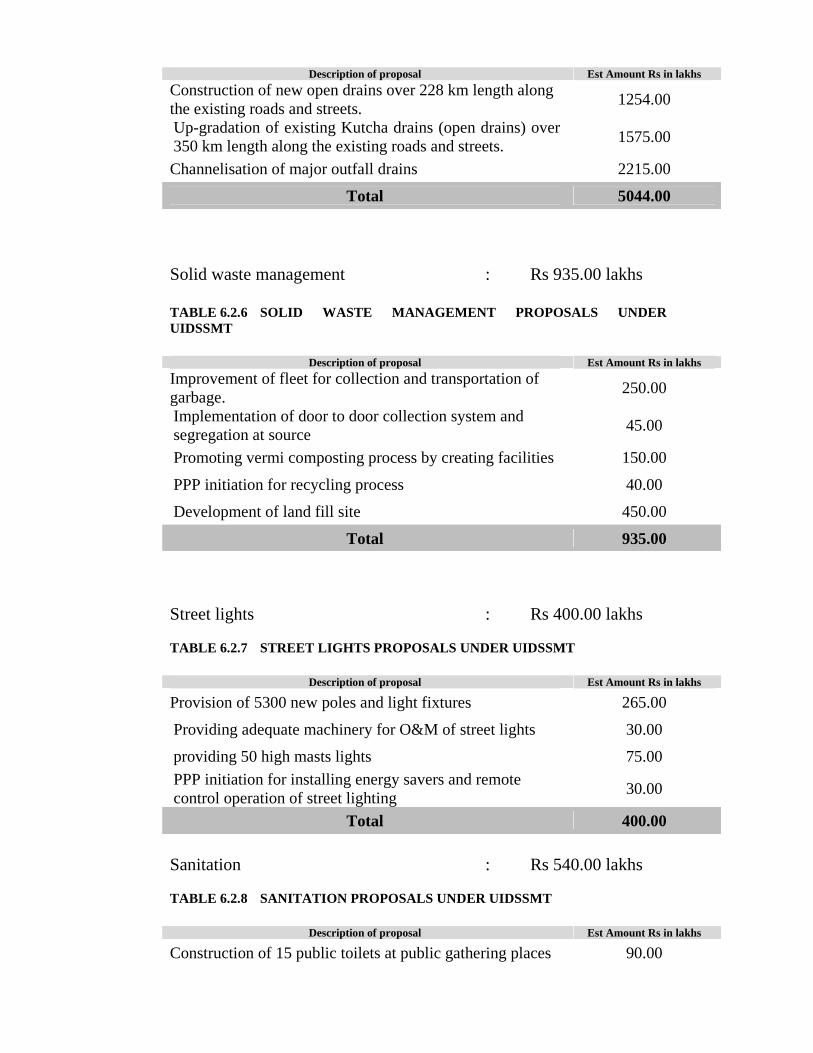
Description of proposal Est Amount Rs in lakhs
Construction of new open drains over 228 km length along the existing roads and streets.
1254.00
Up-gradation of existing Kutcha drains (open drains) over 350 km length along the existing roads and streets.
1575.00
Channelisation of major outfall drains 2215.00
Total 5044.00 Solid waste management : Rs 935.00 lakhs TABLE 6.2.6 SOLID WASTE MANAGEMENT PROPOSALS UNDER UIDSSMT
Description of proposal Est Amount Rs in lakhs
Improvement of fleet for collection and transportation of garbage.
250.00
Implementation of door to door collection system and segregation at source
45.00
Promoting vermi composting process by creating facilities 150.00
PPP initiation for recycling process 40.00
Development of land fill site 450.00
Total 935.00 Street lights : Rs 400.00 lakhs TABLE 6.2.7 STREET LIGHTS PROPOSALS UNDER UIDSSMT
Description of proposal Est Amount Rs in lakhs
Provision of 5300 new poles and light fixtures 265.00
Providing adequate machinery for O&M of street lights 30.00
providing 50 high masts lights 75.00
PPP initiation for installing energy savers and remote control operation of street lighting
30.00
Total 400.00
Sanitation : Rs 540.00 lakhs TABLE 6.2.8 SANITATION PROPOSALS UNDER UIDSSMT
Description of proposal Est Amount Rs in lakhs
Construction of 15 public toilets at public gathering places 90.00

Construction 150 community toilets to avoid open defecation
450.00
Total 540.00
Education infrastructure : Rs 546.20 lakhs TABLE 6.2.9 EDUCATION INFRASTRUCTURE PROPOSALS UNDER UIDSSMT
Description of proposal Est Amount Rs in lakhs
Construction of 21 UP schools 168.00
Construction of 19 schools buildings for primary schools 76.00
Up gradation of 3 existing high schools with all facilities 60.00
Construction of two new high schools 100.00
Providing water supply facilities in 31 schools 6.20
Providing sanitation facilities 50 schools 25.00
Providing electrical facilities in 73 schools 22.00
Providing play equipment in all schools 89.00
Total 546.20
Health care : Rs 583.00 lakhs TABLE 6.2.10 HEALTH CARE PROPOSALS UNDER UIDSSMT
Description of proposal Est Amount Rs in lakhs
Provision of one General Hospital 200.00
Provision of 18 intermediate hospitals 162.00
Provision of 31 health care centers 186.00
Provision of 1 veterinary hospital 20.00
Provision of 1 sisu sankshema hospital 15.00
Total 583.00 Parks and Play Grounds : Rs 895.00 lakhs TABLE 6.2.11 PARKS & PLAY GROUNDS PROPOSALS UNDER UIDSSMT
Description of proposal Est Amount Rs in lakhs

up gradation of 13 existing parks 52.00
provision of 22 community halls 198.00
Provision of 8 recreational clubs 80.00
Provision of 8 music dance drama centers 80.00
Development of theme park 50.00
Provision of 8 meditation and spiritual centers 40.00
Provision of one swimming and dive pool 80.00
Provision of 21 new parks 315.00
Total 895.00
Greenery and protection of water bodies : Rs 700.00 lakhs TABLE 6.2.12 GREENARY PROPOSALS UNDER UIDSSMT
Description of proposal Est Amount Rs in lakhs
Medians development in 7 major roads 175.00
Development of Smrthivanam concept 100.00
Green belt along National & state highways 60.00
Development of 8 water body fringes as green patches 240.00
Implementing massive plantation movement in seasons 60.00
Provision of 8 meditation and spiritual centers 40.00
Establishing municipal nursery 25.00
Total 700.00
Markets, commercial centers : Rs 3200.00 lakhs TABLE 6.2.13 MARKETS & COMMERCIAL CENTERS PROPOSALS UNDER UIDSSMT
Description of proposal Est Amount Rs in lakhs
Construction of additional full pledged market complex in two town
700.00
Conversion of existing market complex into modern complex
700.00
Conversion of old shopping complexes into multi faceted commercial centers including multiplex theatres
1000.00
Construction of shopping complexes in the municipal vacant lands in the commercial zones
800.00
Total 3200.00 *****THE END*****