city college high school to college pipeline summary
TRANSCRIPT

City College High School to College Pipeline Summary Report
City College
High School to College Pipeline
Summary Report 2014/15 - 2018/19
Prepared by: SDCCD Office of Institutional Research and Planning
December 2019

City College High School to College Pipeline Summary Report
Table of Contents
Population of Interest ................................................................................................................................................................................. 3 Placement: Transition to Multiple Measures ............................................................................................................................................. 5 Overall Highlight of the Findings ................................................................................................................................................................. 6 Focus of Analysis I: Entering the Community College Pipeline from High School Feeders ........................................................................9
College Participation Rates of High School Graduates ..................................................................................................................... 9 2014/15-2018/19 Top 10 Capture Rates for City College..................................................................................................................10
Focus of Analysis II: College Preparedness and Placement ..................................................................................................................... 12 High School GPA of College-Enrolled High School Graduates......................................................................................................... 13 Reading Placement .......................................................................................................................................................................... 14 Writing Placement ........................................................................................................................................................................... 15 ELAC (ESOL/ESL) Placement ............................................................................................................................................................. 16 Math Placement .............................................................................................................................................................................. 17
Focus of Analysis III: Student Characteristics and Enrollments Patterns ................................................................................................18 Student Characteristics ................................................................................................................................................................... 19 Units Attempted/Earned ................................................................................................................................................................. 22 Persistence ...................................................................................................................................................................................... 23
Focus of Analysis IV: Student Outcomes ..................................................................................................................................................24 English Retention and Success Rates in the First Term ................................................................................................................... 25 Math Retention and Success Rates ................................................................................................................................................. 27 Math Associate Level Retention and Success Rates ....................................................................................................................... 28 Math Basic Skills Level Retention and Success Rates ..................................................................................................................... 29 Completion of Transfer-Level Math and English in first year ......................................................................................................... 30
Appendices ................................................................................................................................................................................................ 31
2SDCCD Office of Institutional Research and Planning

City College High School to College Pipeline Summary Report
Introduction The annual High School to College Pipeline Report provides a longitudinal overview of incoming first-time to college high school graduates. The report is part of a larger initiative to provide the colleges and the District with information for integrating plans and strategies that support student completion and enrollment management. The report is intended to inform college and District decision-making, instructional and services planning, outreach, and marketing.
The High School to College Pipeline Report series comprises four reports: 1) All Colleges, 2) City College/ECC, 3) Mesa College, and 4) Miramar College. Each report contains four sections that focus on enrollment patterns and placement as high school graduates enter college for the first time. The first section (Focus of Analysis I) focuses on students' entry into an SDCCD college, and is reported as high school-to-college graduate participation and concurrent student participation rates. Student high school GPA, and reading, writing, ELAC (ESOL/ESL), and math placements are detailed in the second section (Focus of Analysis II); student characteristics and college enrollment patterns are detailed in the third section (Focus of Analysis III); and finally, English and Math success rates are detailed in the fourth section (Focus of Analysis IV). In most instances, benchmark information is provided as a point of comparison, such as three-year or five-year averages and/or percentage change.
Population of Interest First-time to college high school graduates are students who reported completion from a high school prior to enrolling at an SDCCD college for the first time. Specifically, unless otherwise noted, this population comprises the following parameters:
First-time to college students are defined as any first-time student who enrolled at an SDCCD college.Excluded from this definition are students concurrently enrolled in a four-year university, degree holders, andstudents currently enrolled in high school. Additionally, for this study, students attending adult school areexcluded.
High school graduates are defined in this study as having received a certification of California high schoolproficiency, a G.E.D./high school certificate, or a high school diploma (including a foreign high school diploma).
Students enrolled at an SDCCD college either in the year following high school completion or within four yearsof high school completion.
3SDCCD Office of Institutional Research and Planning

City College High School to College Pipeline Summary Report
Definitions
1. Enrollment: The number of seats enrolled, or duplicated headcount. Drops, never attends, cancelled, and tutoring classes are excluded.
2. Headcount: The individual count of students, or unduplicated headcount. Drops, never attends, and cancelled classes are excluded.
3. Persistence Rate – Term and Annual: The percentage of census enrolled students in a fall term whoenrolled in at least one course in the subsequent spring term (term persistence) or fall terms (annualpersistence) and were officially enrolled at a census (SDSU and UCSD-only students and sections areexcluded. Intersession, tutoring, in-service, and cancelled classes are excluded).
4. Retention (Completion) Rate: The percentage of students who complete a course with a grade of A,B, C, D, F, P, NP, I or RD out of official census enrollments. Tutoring and cancelled classes are excluded.
5. Successful Course Completion Rate: The percentage of students who complete a course with a gradeof A, B, C, or P out of official census enrollments. Tutoring, non-credit, and cancelled classes areexcluded.
6. Capture Rates: The percent of previous year high school graduates that enroll at an SDCCDinstitution.
4SDCCD Office of Institutional Research and Planning

City College High School to College Pipeline Summary Report
Placement: Transition to Multiple Measures
In October 2017, Assembly Bill (AB) 705 was signed to take effect on January 1, 2018. AB 705 requires California Community Colleges to maximize the probability that students will enter and complete transfer-level coursework in mathematics and English within one year of beginning their program of study. English as a second language students have a three year period to complete transfer-level mathematics and English in their programs of study.
Although colleges are prohibited from compelling a student to take a pre-requisite course unless they are highly unlikely to succeed, AB 705 enhances the use of multiple measures assessment for course placement. This puts an emphasis on using prior history, such as the use of high school GPA, as a placement measure. The intent of the law, along with the foundational research behind the legislation, puts a focus on improving throughput of students through transfer-level mathematics and English sequences, which tend to work as gatekeepers to program and transfer completion.
Colleges were given until Fall 2019 to implement their new placement measures and to become AB 705 compliant. Each SDCCD college developed placement rules based on high school GPA for students with GPAs within 10 years, with Placement Assistant options for all students. Curricula were developed to offer support for students with cumulative high school GPAs lower than 2.6.
City College implemented Multiple Measures placement in the Fall of 2019. The data reflected in this report will not include any data on these new placements.
Figure 1 of the Appendix illustrates the placement sequences in English and math.
5SDCCD Office of Institutional Research and Planning
City College High School to College Pipeline Summary Report
Overall Highlight of the Findings
Participation Rates In 2018/19, 11% of the 2017/18 SDCCD high school
feeder graduates and 5% of the 2017/18 non‐SDCCDhigh school feeder graduates entered City College inthe year following high school completion. These arein line with the five‐year averages of 12% and 5%,respectively.
Concurrent high school seniors, who were bothenrolled at City College and attended a District feederhigh school in 2017/18, continued their SDCCDenrollment the following year as college‐only studentsat a rate of 18%, lower than the five‐year average of21% for all first‐time to SDCCD high school graduates.
2018/19 City College top 5 feeders of first‐time tocollege high school graduates by student count:
High School Name Student Count San Diego Ed Complex 113Hoover 75Lincoln 71Crawford Ed Complex 48Morse 39
Nearly half of City College first‐time to college highschool graduates in 2018/19 attended an SDCCDfeeder high school (49%).
Incoming Placement Rates Over three quarters of 2018/19 City College first‐time to
college high school graduates completed an assessmenttest in Reading, Writing, and Math (77%, 77%, and 78%,respectively).
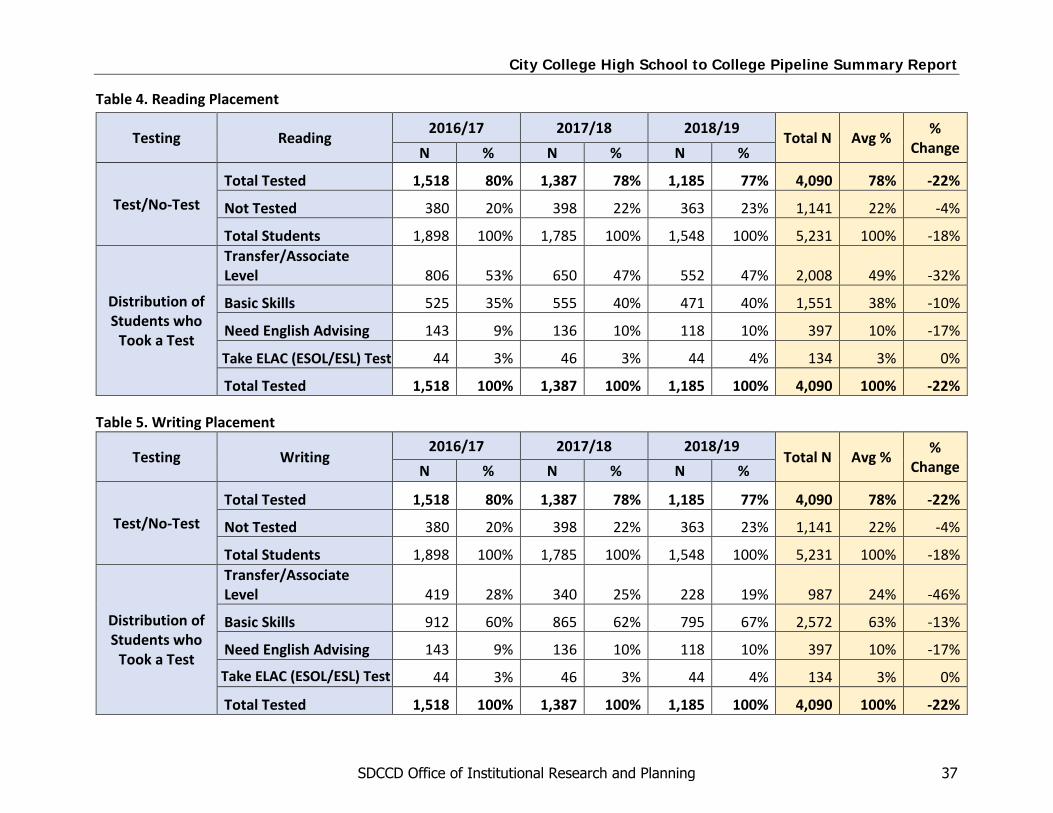
Nearly half (47%) of the 2018/19 City College first‐time tocollege high school graduates who completed anassessment test in reading placed at the transfer/associatelevel, lower than the three‐year average of 49%. Of thosewho completed a reading assessment in 2018/19, 40%placed at the basic skills level, which is slightly higher thanthe three‐year average of 38%.
In 2018/19, 19% of the City College first‐time to collegehigh school graduates who completed an assessment inwriting placed at the transfer/associate level (lower thanthe three‐year average of 24%) and 67% placed at thebasic skills level (higher than the three‐year average of63%).
Twenty‐four percent of the 2018/19 City College first‐timeto college high school graduates who completed anassessment test in math placed at the transfer/associatelevel (lower than the three‐year average of 28%) and 76%placed at the basic skills level (higher than the three‐yearaverage of 72%).
6SDCCD Office of Institutional Research and Planning
City College High School to College Pipeline Summary Report
Access/Profiles Demographics of 2018/19 City College first‐time to college
high school graduates as compared to the five‐yearaverage
53% Female (52% five‐year average) 70% Latinx and 10% White (68% and 11% five‐year
averages, respectively) 40% first generation (40% five‐year average) 4% DSPS (4% five‐year average)
There was an increase in self‐reported incoming highschool GPA as compared to previous years 44% of students in 2018/19 reported a GPA over
3.0 as compared to a 39% average over the pastfive years, while 53% of students reported anincoming high school GPA of between 2.0 and 3.0as compared to the 59% five‐year average.
Outcomes 57% of City College first‐time to college high school
graduates who were enrolled in school full time (12+ units)in 2018/19 successfully completed 12 or more of thoseunits, similar to the five‐year City College average of 56%.
71% of Fall 2017 City College first‐time to college highschool graduates persisted to the next spring and 52%persisted to fall of the next academic year (lower than thefive‐year averages of 73% and 54%, respectively).
In 2018‐19, City College first‐time to college high schoolgraduates completed English and Math courses in theirfirst term at higher rates than the comparison group of allother students enrolled in those courses.
87% of City College first‐time to college high schoolgraduates completed their transfer‐level Mathcourses, compared to 79% of the comparisongroup. In basic skills Math courses, these studentscompleted at a 91% rate, compared to 84% for thecomparison group.
93% of City College first‐time to college high schoolgraduates completed their transfer‐level Englishcourses, compared to 87% for the comparisongroup. In basic skills English courses, first‐time tocollege high school graduates completed at a 91%rate, compared to 81% for the comparison group.
In 2018‐19, City College first‐time to college high schoolgraduates succeeded in their English and Math courses intheir first term at higher rates than the comparison groupof all other students enrolled in those courses.
7SDCCD Office of Institutional Research and Planning

City College High School to College Pipeline Summary Report
51% of City College first‐time to college high schoolgraduates succeeded in their transfer‐level Mathcourses, compared to 42% for the comparisongroup. In basic skills Math courses, first‐time tocollege high school graduates succeeded at a 50%rate, compared to 37% for the comparison group.
75% of City College first‐time to college high schoolgraduates succeeded in their transfer‐level Englishcourses, compared to 69% for the comparisongroup. In basic skills English courses, first‐time tocollege high school graduates succeeded at a 74%rate, compared to 54% for the comparison group.
In 2018/19, 14% of first‐time to college high schoolgraduates from City College feeder high schools passedboth transfer‐level Math and transfer‐level English in theirfirst year, lower than the five‐year average of 20% fromCity College feeder high schools. This may be the result ofthe large increase in transfer‐level Math and Englishcourses being offered to students during their duallyenrolled high school years.
44% of first‐time college high school graduates from CityCollege feeder high schools who attempted both transfer‐level Math and English in their first year succeeded atboth.
8SDCCD Office of Institutional Research and Planning

City College High School to College Pipeline Summary Report
Focus of Analysis I: Entering the Community College Pipeline from High School Feeders
College Participation Rates of High School Graduates
The one-year SDCCD capture rate of 2017/18 high school graduates from the City College Service Area was 29%. This is lower than
the five-year average of 32% and the previous year’s capture rate of 33%.
Table 1 in the Appendix displays high school-to-college participation rates among first-time to college high school graduates from the City College Service Area who enrolled at an SDCCD college in the year following high school completion. When possible, high school-to-college participation rates are disaggregated by feeder and non-feeder high schools. College feeders are based on a combination of the zip codes within each college’s service area, as well as other college-specific outreach designations.
34% 33% 34% 33%29%
0%
5%
10%
15%
20%
25%
30%
35%
40%
45%
50%
14/15 Entrants 15/16 Entrants 16/17 Entrants 17/18 Entrants 18/19 Entrants
Capture Rates 2014/19- 2018/19
City Feeder Total
9SDCCD Office of Institutional Research and Planning

City College High School to College Pipeline Summary Report
2014/15-2018/19 Top 10 Capture Rates for City College Feeders
The top SDUSD high schools by capture rate are Lincoln (30%), San Diego Ed Complex (29%), Garfield (29%), Crawford Ed Complex (28%) and Hoover (28%). Southwest and Sweeetwater are not in SDUSD but still give City College a high proportion of their graduates (17% and 13%, respectively). As mentioned in the highlights, the top feeders by student count are San Diego Ed Complex (113), Hoover (75), Lincoln (71), Crawford (48), and Morse (39). Table 1 of the Appendix provides further detail.
13%
14%
17%
21%
26%
28%
28%
29%
29%
30%
0% 5% 10% 15% 20% 25% 30% 35%
Sweetwater*
Health Sciences
Southwest*
King-Chavez Comm High
Gompers Prep
Hoover
Crawford Ed Complex
Garfield
San Diego Ed Complex
Lincoln
Top 10 Capture Rates for City College Feeders
10SDCCD Office of Institutional Research and Planning

City College High School to College Pipeline Summary Report
Participation Rates of Concurrent Students Concurrent high school seniors, who were both enrolled at City College and attended a District feeder high school in 2017/18, continued their SDCCD enrollment in 2018/19 at an 18% participation rate. This is 8% lower than the previous year, and 3% lower than the five-year average of 21%.
14/15 Re-Enroll %
15/16 Re-Enroll %
16/17 Re-Enroll %
17/18 Re-Enroll %
18/19 Re-Enroll %
14/15-18/19
Re-Enroll Avg % District Feeder Total 18% 18% 22% 26% 18% 21% Non-Feeder Total 36% 58% 31% 26% 25% 30% Other/Unreported 0% 0% 0% 67% 0% --- Grand Total 9% 10% 13% 25% 19% 16%
Over the past five years, City College has increased the number of concurrently enrolled seniors by 535% (from 69 to 438). Table 2 of the Appendix displays the percentage of Miramar College concurrently enrolled high school seniors who enrolled at an SDCCD college in the year following graduation from high school. Results are disaggregated by feeder high schools and provide aggregate totals/averages for non-feeder high school students as a point of comparison.
69104
241 268
438
050
100150200250300350400450500
13/14 14/15 15/16 16/17 17/18
Volume of Concurrently Enrolled Students-City College
11SDCCD Office of Institutional Research and Planning

City College High School to College Pipeline Summary Report
Focus of Analysis II: College Preparedness and Placement
This section of the report looks at high school GPA and the placement levels of first-time to college high school graduates who applied to an SDCCD college within four years of high school completion. It is possible that a student can apply and take the placement test, but not register for classes. The placement information, therefore, may differ from enrollment information. Note that the English and Math placement sequences may change from year to year; therefore, data are represented by current placement level categories (see Figure 1 in the Course Sequences section). Additionally, students are categorized as ‘tested’ or ‘not tested’ based on the following parameters:
Total Tested – This group includes students who completed an assessment test or submitted their scores froma standardized test (e.g., SAT, ACT, EAP, EPT, and ELM).
Not Tested – This group includes students who did not complete an assessment test or were placed throughthe MMAP placement assistant. Additionally, this group includes students who received a placement levelfrom degree completion, transfer work, or course completion.
12SDCCD Office of Institutional Research and Planning

City College High School to College Pipeline Summary Report
High School GPA of College‐Enrolled High School Graduates
Incoming self‐reported GPA to City College has been rising the past 5 years and is currently at its highest point. Table 3 of the Appendix
shows the detail on the number of students and 5‐year changes.
0%2%
24%
35%
27%
12%
0%
5%
10%
15%
20%
25%
30%
35%
40%
0%
5%
10%
15%
20%
25%
30%
35%
40%
0.0‐1.5 1.6‐1.9 2.0‐2.5 2.6‐3.0 3.1‐3.5 Over 3.5
GPA Range ‐ City College
2014/15 2015/16 2016/17 2017/18 2018/19 5‐Yr Avg/Total
13SDCCD Office of Institutional Research and Planning

City College High School to College Pipeline Summary Report
Reading Placement Nearly half of 2018/19 City College first‐time to college high school graduates who took a reading test placed in the transfer/associate levels. Table 4 of the Appendix shows more detail in the last three years and the cohort totals.
78%
22%
0%
10%
20%
30%
40%
50%
60%
70%
80%
90%
Total Tested Not Tested
Reading ‐ Testing
2016/17 2017/18 2018/19 Avg %
49%
38%
10%
3%
0%
10%
20%
30%
40%
50%
60%
Transfer/AssociateLevel
Basic Skills Need EnglishAdvising
Take ELAC (ESOL/ESL) Test
Reading Placement for Students who Took a Test
2016/17 2017/18 2018/19 Avg %
14SDCCD Office of Institutional Research and Planning

City College High School to College Pipeline Summary Report
Writing Placement
2018/19 City College first‐time to college high school graduates who took a writing test were placed at transfer/associate level at the
lowest rate of the past 3 years. Table 5 in the Appendix shows more detail in the last three years and the cohort totals.
78%
22%
0%
10%
20%
30%
40%
50%
60%
70%
80%
90%
Total Tested Not Tested
Writing ‐ Testing
2016/17 2017/18 2018/19 Avg %
24%
63%
10%
3%
0%
10%
20%
30%
40%
50%
60%
70%
80%
Transfer/AssociateLevel
Basic Skills Need EnglishAdvising
Take ELAC (ESOL/ESL) Test
Writing Placement for Students who Took a Test
2016/17 2017/18 2018/19 Avg %
15SDCCD Office of Institutional Research and Planning

City College High School to College Pipeline Summary Report
ELAC (ESOL/ESL) Placement 2018/19 City College first‐time to college high school graduates who were tested needed English advising at the highest rate of the past 3 years. Table 6 of the Appendix shows more detail in the last three years and the cohort totals.
5%
95%
0%
20%
40%
60%
80%
100%
120%
Total Tested Not Tested
ELAC (ESOL/ESL) ‐ Testing
2016/17 2017/18 2018/19 Avg %
10%13%
7%
70%
0%
10%
20%
30%
40%
50%
60%
70%
80%
90%
Transfer/AssociateLevel
Basic Skills Need EnglishAdvising
Take ELAC (ESOL/ESL) Test
ELAC (ESOL/ESL) Placement for Students who Took a Test
2016/17 2017/18 2018/19 Avg %
16SDCCD Office of Institutional Research and Planning

City College High School to College Pipeline Summary Report
Math Placement 2018/19 City College first‐time to college high school graduates who were tested, placed at transfer‐level in Math at a lower rate than the previous two years. Table 7 in the Appendix shows more detail in the last three years and the cohort totals.
79%
21%
0%
10%
20%
30%
40%
50%
60%
70%
80%
90%
Total Tested Not Tested
Math ‐ Testing
2016/17 2017/18 2018/19 Avg %
18%10%
72%
0%
10%
20%
30%
40%
50%
60%
70%
80%
Transfer Level Associate Level Basic Skills
Math Placement for Students who Took a Test
2016/17 2017/18 2018/19 Avg %
17SDCCD Office of Institutional Research and Planning

City College High School to College Pipeline Summary Report
Focus of Analysis III: Student Characteristics and Enrollments Patterns This section describes different student characteristics and enrollment patterns among first-time to college high school graduates who enrolled at an SDCCD college within four years of high school completion. Headcount, gender, ethnicity, first generation to college, student educational goals, and DSPS status of the first-time to college high school graduates are measured between 2014/15 and 2018/19 (see Table 8). Note that the count of students is an unduplicated headcount. The number of units attempted (in rows) by the number of units earned (in columns) across the same five years are displayed among first-time to college high school graduates in Table 9. The longitudinal term and annual persistence of the Fall 2013 to Fall 2017 cohorts of first-time to college high school graduates is displayed in Table 10 of the Appendix.
18SDCCD Office of Institutional Research and Planning
City College High School to College Pipeline Summary Report
Student Characteristics
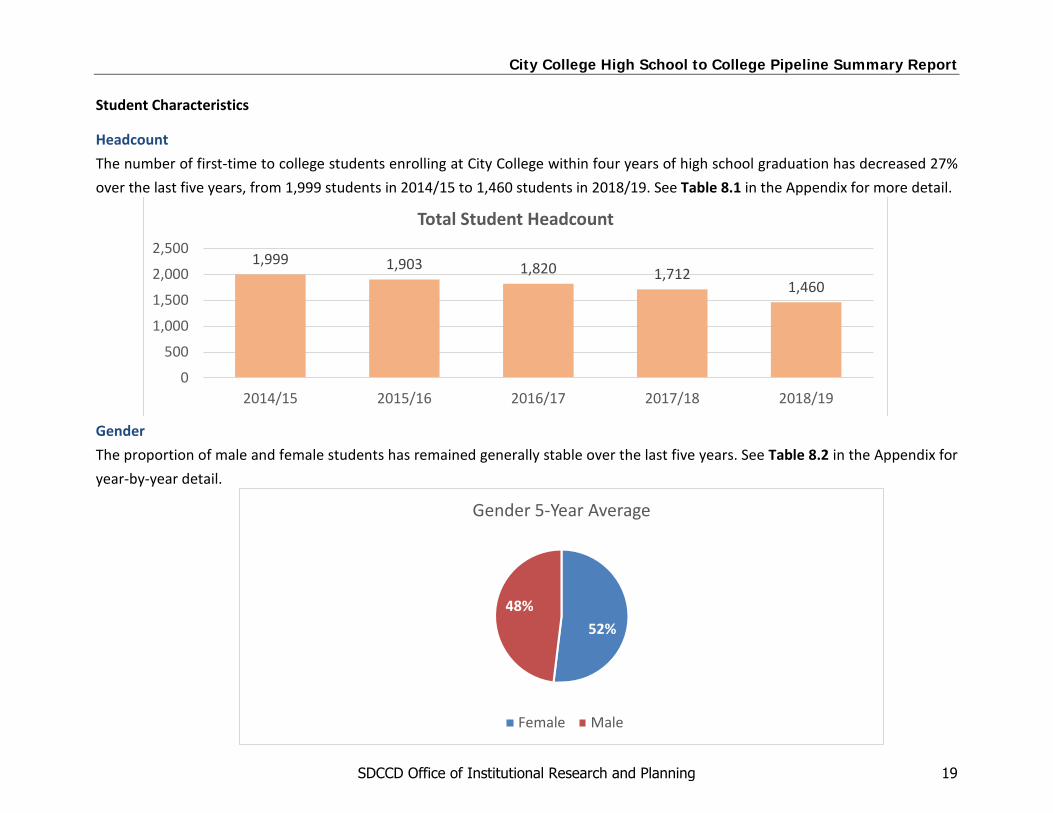
Headcount The number of first-time to college students enrolling at City College within four years of high school graduation has decreased 27% over the last five years, from 1,999 students in 2014/15 to 1,460 students in 2018/19. See Table 8.1 in the Appendix for more detail.
Gender The proportion of male and female students has remained generally stable over the last five years. See Table 8.2 in the Appendix for year-by-year detail.
1,999 1,903 1,820 1,7121,460
0
500
1,000
1,500
2,000
2,500
2014/15 2015/16 2016/17 2017/18 2018/19
Total Student Headcount
52%48%
Gender 5-Year Average
Female Male
19SDCCD Office of Institutional Research and Planning

City College High School to College Pipeline Summary Report
Ethnicity Latinx students make up 68% of 2018/19 first-time to college students who enroll at City College within four years of high school graduation. This is higher than the overall City College population, both over the last five1 fall terms (49%) and in Fall 2017 (51%).
See Table 8.3 in the Appendix for year-by-year detail.
First Generation 40% of first-time to college students who enroll at City College within four years of high school graduation identified as first generation. See Table 8.4 in the Appendix for year-by-year detail.
1 Data from Fall 2012 to Fall 2017 was the most recent available comparison data as of the production of this report (from Factbook 2018).
9%0% 4%
3%
68%
11%4%
1%
Ethnicity 5-Year Average
African American
American Indian
Asian/Pacific Islander
Filipino
Latinx
White
Other
Unreported
40%
60%
0% 10% 20% 30% 40% 50% 60% 70%
First Generation
Not First Generation
First Generation 5-Year Average
20SDCCD Office of Institutional Research and Planning

City College High School to College Pipeline Summary Report
Educational Goal 58% of first-time to college students who enroll at City College within four years of high school graduation indicated their educational goal is to complete a bachelor’s degree after completing an AA/AS degree. See Table 8.5 in the Appendix for year-by-year detail.
DSPS On average 4% of the students have received Disability Support Programs and Services at City College. Table 8.6 in the Appendix displays the figures by year and the 5-year average.
0%1%1%1%1%
2%6%
7%8%8%
16%50%
0% 10% 20% 30% 40% 50% 60%
HS Diploma/GED CertificateBasic Skills Improvement
Current Job/Career AdvancementEducational Development
Voc Cert/Degree w/out TransferCertificate/License Maintenance
AA/AS w/out TransferBA/BS w/out Completing AA/AS
4 Yr College StudentNew Career Preparation
UndecidedBA/BS after Completing AA/AS
Educational Goal 5-Year Average
21SDCCD Office of Institutional Research and Planning
City College High School to College Pipeline Summary Report
Units Attempted/Earned
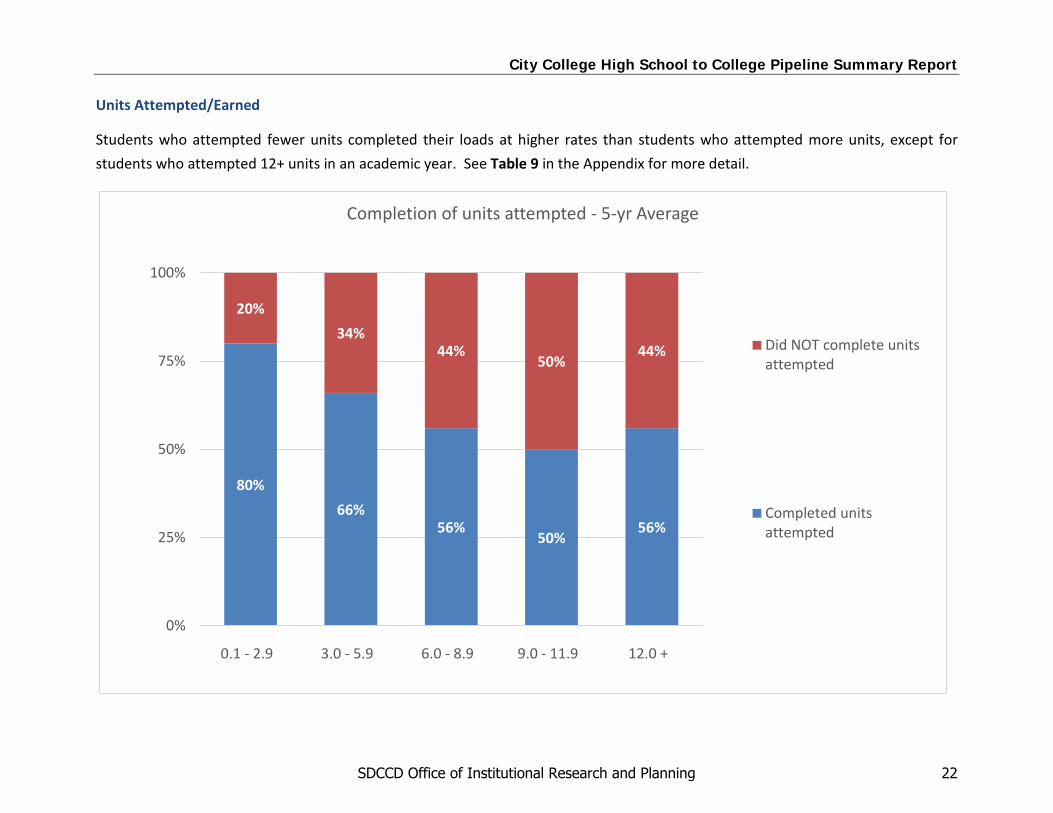
Students who attempted fewer units completed their loads at higher rates than students who attempted more units, except for students who attempted 12+ units in an academic year. See Table 9 in the Appendix for more detail.
80%66%
56%50%
56%
20%34%
44%50%
44%
0%
25%
50%
75%
100%
0.1 - 2.9 3.0 - 5.9 6.0 - 8.9 9.0 - 11.9 12.0 +
Completion of units attempted - 5-yr Average
Did NOT complete unitsattempted
Completed unitsattempted
22SDCCD Office of Institutional Research and Planning
City College High School to College Pipeline Summary Report
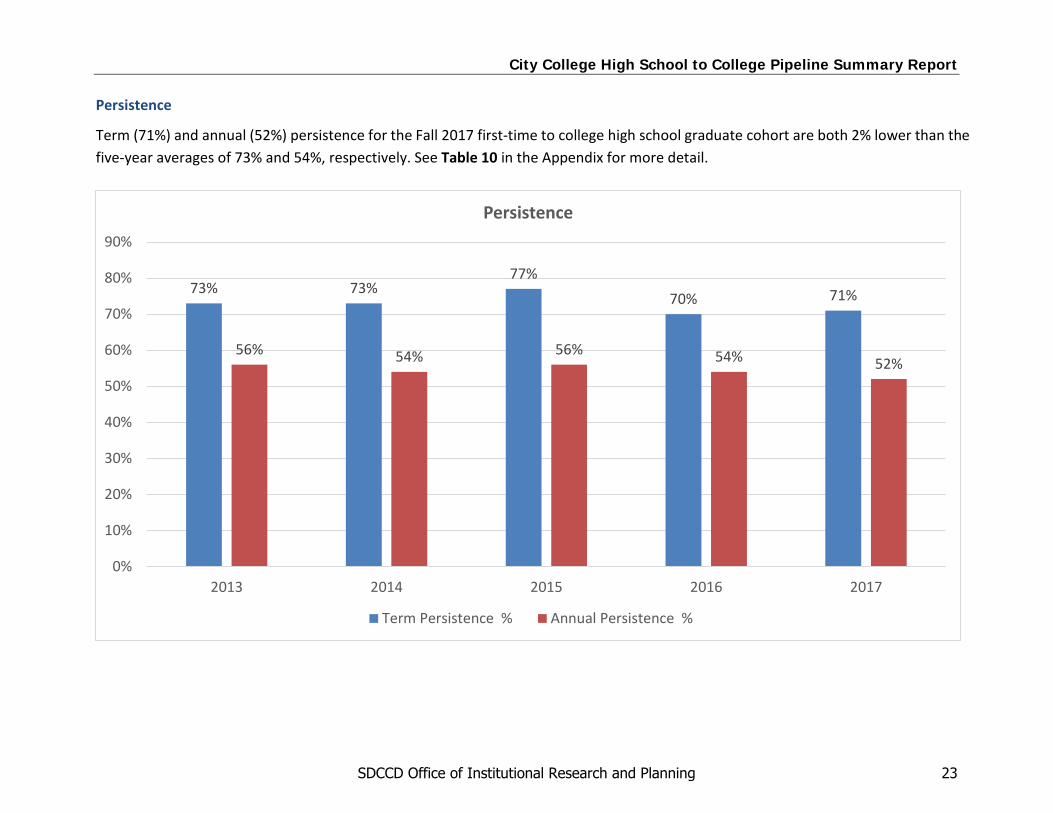
Persistence
Term (71%) and annual (52%) persistence for the Fall 2017 first-time to college high school graduate cohort are both 2% lower than the five-year averages of 73% and 54%, respectively. See Table 10 in the Appendix for more detail.
73% 73%77%
70% 71%
56% 54% 56% 54% 52%
0%
10%
20%
30%
40%
50%
60%
70%
80%
90%
2013 2014 2015 2016 2017
Persistence
Term Persistence % Annual Persistence %
23SDCCD Office of Institutional Research and Planning

City College High School to College Pipeline Summary Report
Focus of Analysis IV: Student Outcomes This section examines English and Math course outcomes of first-time to college high school graduates who enrolled at an SDCCD college within four years of high school completion (see Tables 11 and 12). Enrollments, retention rates, and successful course completion rates of first-time students who enrolled in an English or Math course as of census between 2014/15 and 2018/19 are reported. Data are represented by basic skills, associate, and transfer-level courses (see Figure 1 in the Placement Sequences section for specific courses in each level).
24SDCCD Office of Institutional Research and Planning
City College High School to College Pipeline Summary Report
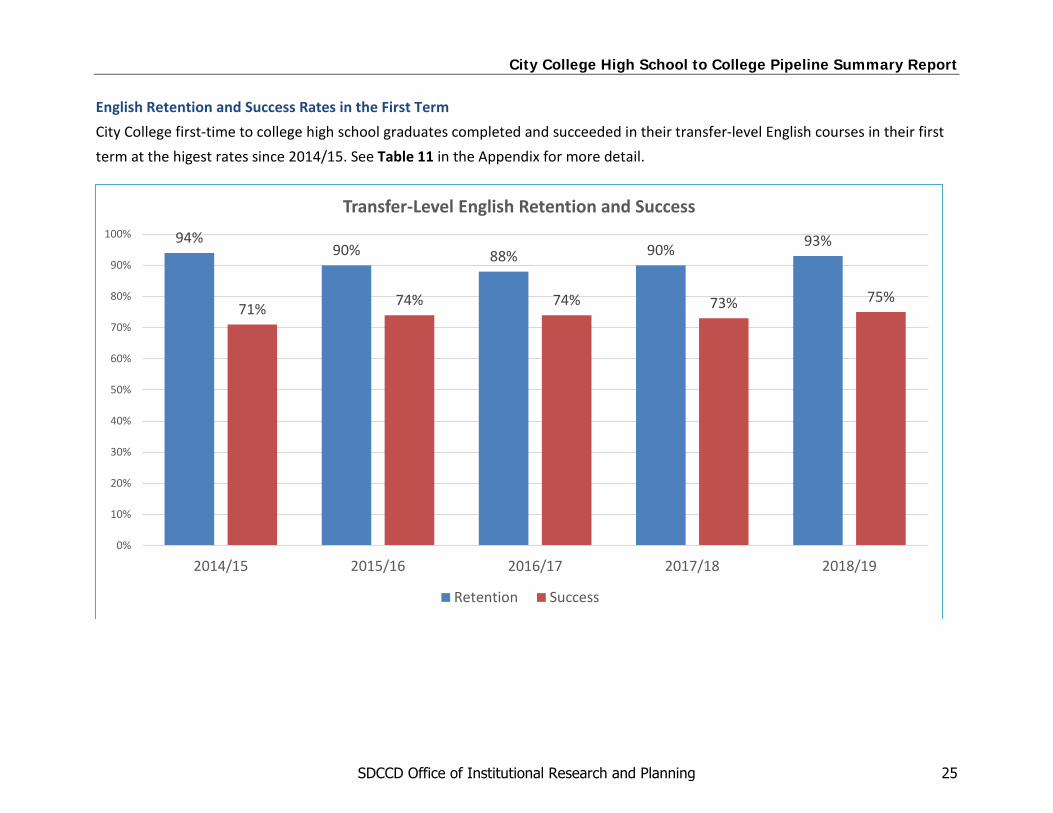
English Retention and Success Rates in the First Term City College first-time to college high school graduates completed and succeeded in their transfer-level English courses in their first term at the higest rates since 2014/15. See Table 11 in the Appendix for more detail.
94%90% 88% 90% 93%
71% 74% 74% 73% 75%
0%
10%
20%
30%
40%
50%
60%
70%
80%
90%
100%
2014/15 2015/16 2016/17 2017/18 2018/19
Transfer-Level English Retention and Success
Retention Success
25SDCCD Office of Institutional Research and Planning

City College High School to College Pipeline Summary Report
City College first-time to college high school graduates completed (91%) and succeeded (74%) in their basic skills English courses in their first term at rates similar to the five-year average of 91% and 75%, respectively. See Table 11 in the Appendix for more detail.
91% 91% 90%94% 91%
76% 76%72% 74% 74%
0%
10%
20%
30%
40%
50%
60%
70%
80%
90%
100%
2014/15 2015/16 2016/17 2017/18 2018/19
Basic Skills English Retention and Success
Retention Success
26SDCCD Office of Institutional Research and Planning

City College High School to College Pipeline Summary Report
Math Retention and Success Rates
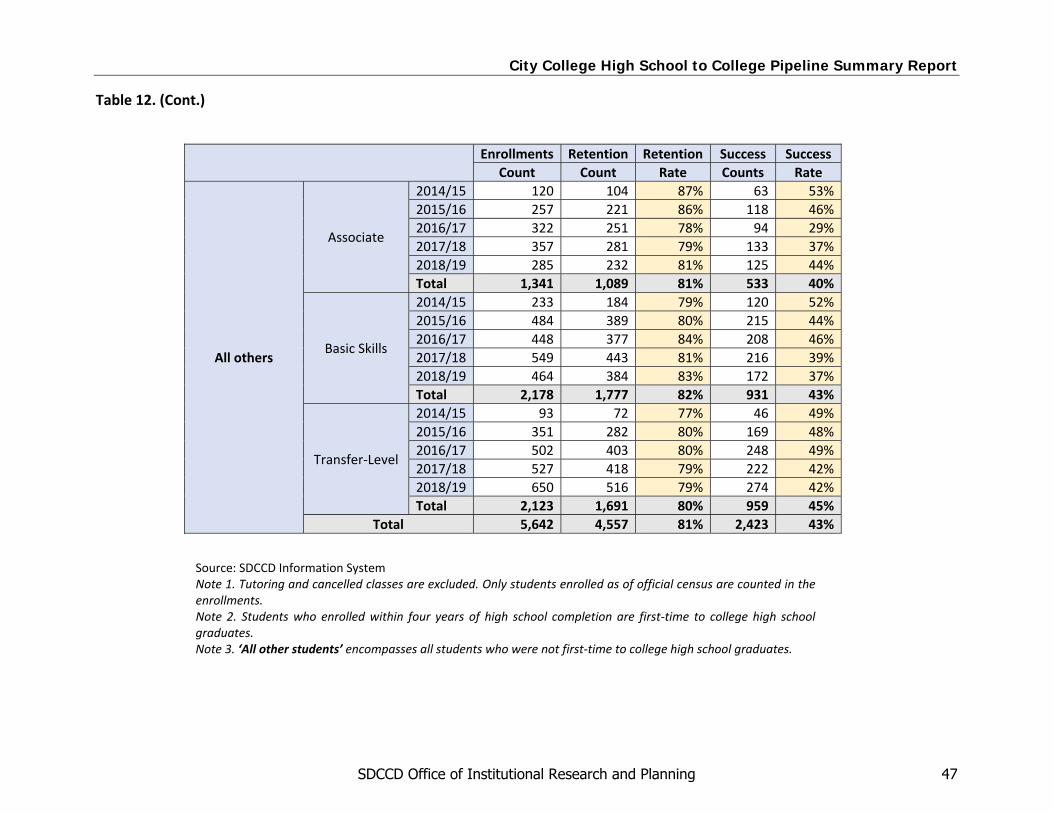
2018/19 City College first-time to college high school graduates succeeded (51%) in their transfer-level Math courses at the lowest rate in the past five years. Completion rate (87%) was above the five-year average of 85%. See Table 12 in the Appendix for more detail.
80% 82%88% 89% 87%
58%53%
57% 57%51%
0%
10%
20%
30%
40%
50%
60%
70%
80%
90%
100%
2014/15 2015/16 2016/17 2017/18 2018/19
Math Transfer-Level Retention and Success Rates
Retention Success
27SDCCD Office of Institutional Research and Planning

City College High School to College Pipeline Summary Report
Math Associate Level Retention and Success Rates
2018/19 City College first-time to college high school graduates completed (80%) and succeeded (38%) their associate level Math
courses at the lowest rates of the past five years. See Table 12 in the Appendix for more detail.
86% 89%85% 87%
80%
38%
55%
37%
52%
38%
0%
10%
20%
30%
40%
50%
60%
70%
80%
90%
100%
2014/15 2015/16 2016/17 2017/18 2018/19
Math Associate Level Retention and Success Rates
Retention Success
28SDCCD Office of Institutional Research and Planning

City College High School to College Pipeline Summary Report
Math Basic Skills Level Retention and Success Rates
2018/19 City College first-time to college high school graduates completed their basic skills Math courses at the highest rate of the
past five years, and succeeded in them at the lowest rate of the past five years. See Table 12 in the Appendix for more detail.
81%88% 87% 89% 91%
55% 57% 58%54%
50%
0%
10%
20%
30%
40%
50%
60%
70%
80%
90%
100%
2014/15 2015/16 2016/17 2017/18 2018/19
Math Basic Skills Level Retention and Success Rates
Retention Success
29SDCCD Office of Institutional Research and Planning

City College High School to College Pipeline Summary Report
Completion of transfer-level Math and English in first year
As mentioned in preface, AB705 has been put into law and intends to increase completion of transfer-level Math and transfer-level English in the first year. The following table displays the rate of completion of both transfer-level English and transfer-level Math in the first year for first-time to college high school graduates who graduated within the City College Service Area and then attended an SDCCD college. See Table 13 in the Appendix.
Passed Transfer-level English and Transfer-level
Math in first year
2014/15 2015/16 2016/17 2017/18 2018/19
Count Rate Count Rate Count Rate Count Rate Count Rate
Did not pass 221 77% 294 77% 267 77% 254 85% 262 86%
Passed 65 23% 87 23% 78 23% 45 15% 41 14%
Total 286 100% 381 100% 345 100% 299 100% 303 100%
30SDCCD Office of Institutional Research and Planning

City College High School to College Pipeline Summary Report
Appendices
Table 1
Table 2
Table 3
Table 4 Table 5 Table 6 Table 7 Table 8.1 Table 8.2 Table 8.3 Table 8.4 Table 8.5 Table 8.6 Table 9 Table 10 Table 11 Table 12 Table 13 Figure 1
Headcount and participation rates of high school graduates who enroll at an SDCCD credit college within one year of graduation Percentage of concurrent high school seniors who re-enroll the subsequent year as college-only students High school GPA of first-time to college high school graduates who enroll at a SDCCD credit college within four years of graduation Reading Placement Writing Placement ELAC (ESOL/ESL) Placement Math Placement Headcount Gender Ethnicity First Generation Educational Goal DSPS Units attempted vs. Units earned Term and annual persistence English Success and Retention rates by comparison groups Math Success and Retention rates by comparison groups First-Time students Completing Transfer-level English and Math in the first year English and Math sequence for City College
31SDCCD Office of Institutional Research and Planning

Table 1. Headcount and Participation rates of high school graduates who enroll at an SDCCD credit college within one year of graduation (City/ECC)
13/14 Grads
14/15 Grads
15/16 Grads
16/17 Grads
17/18 Grads
13/14-17/18 Grads
N N % N N % N N % N N % N N % Avg%Crawford Ed Complex 232 66 28% 195 55 28% 174 60 34% 208 58 28% 220 48 22% -5% -27% 28%Garfield 127 37 29% 107 24 22% 138 46 33% 117 26 22% 70 25 36% -45% -32% 29%Gompers Prep 89 33 37% 97 21 22% 122 31 25% 112 23 21% 139 32 23% 56% -3% 26%Health Sciences 135 27 20% 149 29 19% 151 9 6% 160 23 14% 153 15 10% 13% -44% 14%Hoover 344 90 26% 343 111 32% 318 101 32% 360 115 32% 410 75 18% 19% -17% 28%King-Chavez Comm High 95 14 15% 139 41 29% 110 29 26% 115 15 13% 120 25 21% 26% 79% 21%Lincoln 298 110 37% 285 83 29% 222 65 29% 228 64 28% 268 71 26% -10% -35% 30%Morse 377 52 14% 340 41 12% 387 51 13% 318 50 16% 339 39 12% -10% -25% 13%San Diego Ed Complex 393 123 31% 462 123 27% 422 122 29% 410 136 33% 423 113 27% 8% -8% 29%San Diego SCPA 144 9 6% 186 14 8% 197 12 6% 145 21 14% 171 17 10% 19% 89% 9%City Feeder Total 2,234 561 25% 2,303 542 24% 2,241 526 23% 2,173 531 24% 2,313 460 20% 4% -18% 23%Charter School of SD 441 48 11% 464 66 14% 587 62 11% 495 70 14% 246 38 15% -44% -21% 13%Clairemont 256 22 9% 210 21 10% 221 17 8% 203 19 9% 205 17 8% -20% -23% 9%High Tech Ed Complex 312 22 7% 329 20 6% 311 18 6% 341 24 7% 325 16 5% 4% -27% 6%Kearny Ed Complex 322 24 7% 309 17 6% 327 23 7% 264 21 8% 323 19 6% 0% -21% 7%La Jolla 338 12 4% 348 17 5% 352 16 5% 371 19 5% 350 14 4% 4% 17% 4%Madison 216 7 3% 214 14 7% 242 14 6% 246 11 4% 210 9 4% -3% 29% 5%Mark Twain 152 7 5% 156 6 4% 145 11 8% 186 16 9% 187 12 6% 23% 71% 6%Mission Bay 274 39 14% 237 31 13% 208 25 12% 213 25 12% 199 30 15% -27% -23% 13%Patrick Henry 523 24 5% 504 19 4% 523 19 4% 487 24 5% 500 19 4% -4% -21% 4%Point Loma 401 42 10% 426 39 9% 398 39 10% 395 39 10% 410 37 9% 2% -12% 10%Preuss School 88 9 10% 103 3 3% 132 10 8% 102 5 5% 94 7 7% 7% -22% 7%Mesa Feeder Total 3,323 256 8% 3,300 253 8% 3,446 254 7% 3,303 273 8% 3,049 218 7% -8% -15% 8%Mira Mesa 609 19 3% 581 19 3% 555 26 5% 514 32 6% 500 29 6% -18% 53% 5%Scripps Ranch 509 18 4% 517 11 2% 513 19 4% 485 18 4% 505 15 3% -1% -17% 3%Serra 408 29 7% 379 46 12% 372 39 10% 296 31 10% 359 36 10% -12% 24% 10%University City 409 30 7% 417 17 4% 397 30 8% 345 34 10% 432 25 6% 6% -17% 7%Miramar Feeder Total 1,935 96 5% 1,894 93 5% 1,837 114 6% 1,640 115 7% 1,796 105 6% -7% 9% 6%District Feeder Total 7,492 913 12% 7,497 888 12% 7,524 894 12% 7,116 919 13% 7,158 783 11% -4% -14% 12%
Note. Non-Feeder High Schools are continued on the next page
18/19 Entrants
% Change
14/15-18/19 Entrants
14/15 Entrants
15/16 Entrants
16/17 Entrants
17/18 Entrants
City
Fee
der
Mes
a Fe
eder
Mira
mar
Fe
eder
City College High School to College Pipeline Summary Report
32SDCCD Office of Institutional Research and Planning
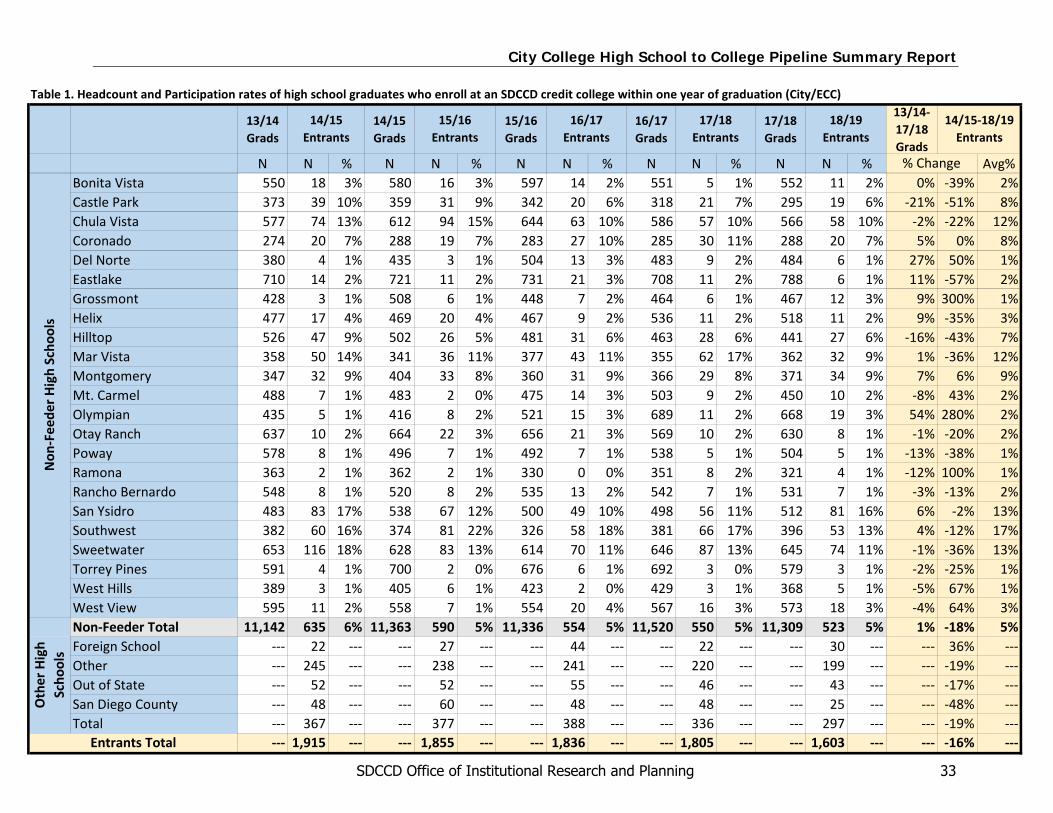
Table 1. Headcount and Participation rates of high school graduates who enroll at an SDCCD credit college within one year of graduation (City/ECC)
13/14 Grads
14/15 Grads
15/16 Grads
16/17 Grads
17/18 Grads
13/14-17/18 Grads
N N % N N % N N % N N % N N % Avg%Bonita Vista 550 18 3% 580 16 3% 597 14 2% 551 5 1% 552 11 2% 0% -39% 2%Castle Park 373 39 10% 359 31 9% 342 20 6% 318 21 7% 295 19 6% -21% -51% 8%Chula Vista 577 74 13% 612 94 15% 644 63 10% 586 57 10% 566 58 10% -2% -22% 12%Coronado 274 20 7% 288 19 7% 283 27 10% 285 30 11% 288 20 7% 5% 0% 8%Del Norte 380 4 1% 435 3 1% 504 13 3% 483 9 2% 484 6 1% 27% 50% 1%Eastlake 710 14 2% 721 11 2% 731 21 3% 708 11 2% 788 6 1% 11% -57% 2%Grossmont 428 3 1% 508 6 1% 448 7 2% 464 6 1% 467 12 3% 9% 300% 1%Helix 477 17 4% 469 20 4% 467 9 2% 536 11 2% 518 11 2% 9% -35% 3%Hilltop 526 47 9% 502 26 5% 481 31 6% 463 28 6% 441 27 6% -16% -43% 7%Mar Vista 358 50 14% 341 36 11% 377 43 11% 355 62 17% 362 32 9% 1% -36% 12%Montgomery 347 32 9% 404 33 8% 360 31 9% 366 29 8% 371 34 9% 7% 6% 9%Mt. Carmel 488 7 1% 483 2 0% 475 14 3% 503 9 2% 450 10 2% -8% 43% 2%Olympian 435 5 1% 416 8 2% 521 15 3% 689 11 2% 668 19 3% 54% 280% 2%Otay Ranch 637 10 2% 664 22 3% 656 21 3% 569 10 2% 630 8 1% -1% -20% 2%Poway 578 8 1% 496 7 1% 492 7 1% 538 5 1% 504 5 1% -13% -38% 1%Ramona 363 2 1% 362 2 1% 330 0 0% 351 8 2% 321 4 1% -12% 100% 1%Rancho Bernardo 548 8 1% 520 8 2% 535 13 2% 542 7 1% 531 7 1% -3% -13% 2%San Ysidro 483 83 17% 538 67 12% 500 49 10% 498 56 11% 512 81 16% 6% -2% 13%Southwest 382 60 16% 374 81 22% 326 58 18% 381 66 17% 396 53 13% 4% -12% 17%Sweetwater 653 116 18% 628 83 13% 614 70 11% 646 87 13% 645 74 11% -1% -36% 13%Torrey Pines 591 4 1% 700 2 0% 676 6 1% 692 3 0% 579 3 1% -2% -25% 1%West Hills 389 3 1% 405 6 1% 423 2 0% 429 3 1% 368 5 1% -5% 67% 1%West View 595 11 2% 558 7 1% 554 20 4% 567 16 3% 573 18 3% -4% 64% 3%Non-Feeder Total 11,142 635 6% 11,363 590 5% 11,336 554 5% 11,520 550 5% 11,309 523 5% 1% -18% 5%Foreign School --- 22 --- --- 27 --- --- 44 --- --- 22 --- --- 30 --- --- 36% ---Other --- 245 --- --- 238 --- --- 241 --- --- 220 --- --- 199 --- --- -19% ---Out of State --- 52 --- --- 52 --- --- 55 --- --- 46 --- --- 43 --- --- -17% ---San Diego County --- 48 --- --- 60 --- --- 48 --- --- 48 --- --- 25 --- --- -48% ---Total --- 367 --- --- 377 --- --- 388 --- --- 336 --- --- 297 --- --- -19% ---
--- 1,915 --- --- 1,855 --- --- 1,836 --- --- 1,805 --- --- 1,603 --- --- -16% ---Entrants Total
Non
-Fee
der H
igh
Scho
ols
Oth
er H
igh
Scho
ols
14/15 Entrants
15/16 Entrants
16/17 Entrants
17/18 Entrants
18/19 Entrants
14/15-18/19 Entrants
% Change
City College High School to College Pipeline Summary Report
33SDCCD Office of Institutional Research and Planning
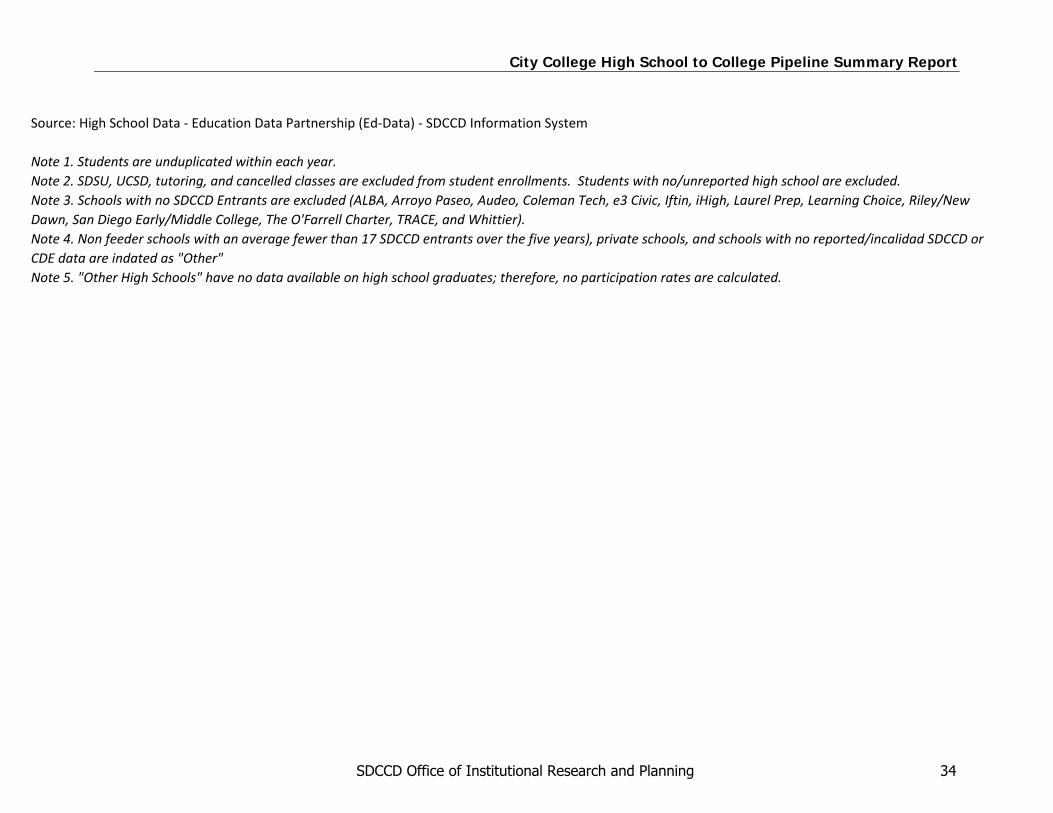
Source: High School Data - Education Data Partnership (Ed-Data) - SDCCD Information System
Note 1. Students are unduplicated within each year.Note 2. SDSU, UCSD, tutoring, and cancelled classes are excluded from student enrollments. Students with no/unreported high school are excluded.Note 3. Schools with no SDCCD Entrants are excluded (ALBA, Arroyo Paseo, Audeo, Coleman Tech, e3 Civic, Iftin, iHigh, Laurel Prep, Learning Choice, Riley/New Dawn, San Diego Early/Middle College, The O'Farrell Charter, TRACE, and Whittier).Note 4. Non feeder schools with an average fewer than 17 SDCCD entrants over the five years), private schools, and schools with no reported/incalidad SDCCD or CDE data are indated as "Other" Note 5. "Other High Schools" have no data available on high school graduates; therefore, no participation rates are calculated.
City College High School to College Pipeline Summary Report
34SDCCD Office of Institutional Research and Planning

Table 2. Percentage of City College concurrent high school seniors who re-enroll the subsequent year as college-only students
13/14 Seniors
(Concur)
14/15 Re-
Enroll
14/15 Re-
Enroll
14/15 Seniors
(Concur)
15/16 Re-
Enroll
15/16 Re-
Enroll
15/16 Seniors
(Concur)
16/17 Re-
Enroll 16/17
Re-Enroll
16/17 Seniors
(Concur)
17/18 Re-
Enroll
17/18 Re-
Enroll
17/18 Seniors
(Concur)
18/19 Re-
Enroll
18/19 Re-
Enroll
Concurrent % Change
13/14-17/18
Re-Enroll % Change
14/15-18/19
14/15-18/19
Re-Enroll Avg %
N N % N N % N N % N N % N N % % % %
District Feeder Total 55 10 18% 92 17 18% 198 44 22% 219 57 26% 376 68 18% 584% 580% 21%Non-Feeder Total 14 5 36% 12 7 58% 42 13 31% 46 12 26% 57 14 25% 307% 180% 30%Other/Unreported 0 0 0% 0 0 0% 1 0 0% 3 2 67% 5 0 0% --- --- ---Grand Total 69 15 22% 104 24 23% 241 57 24% 268 71 26% 438 82 19% 535% 447% 22%
Source: SDCCD Information SystemNote 1. The concurrent student cohort comprises all concurrent seniors at a District feeder or non-feeder who were also enrolled at City College/ECC. No exclusions limit the concurrent student cohort to AP students. Re-enrollment counts exclude students who continue City College/ECC enrollment as concurrent students.Note 2. Students are unduplicated within each year. SDSU, UCSD, tutoring, and cancelled classes are excluded.Note 3. Students with an unreported high school are indicated as "Other/Unreported".
City College High School to College Pipeline Summary Report
35SDCCD Office of Institutional Research and Planning

City College High School to College Pipeline Summary Report
Table 3. High school GPA of first-time to college high school graduates who enroll at City College within four years of graduation
GPA Range 2014/15 2015/16 2016/17 2017/18 2018/19 5-Yr Avg/Total
5-Yr % Change
0.0-1.5 0% 0% 0% 0% 1% 0% 100%
1.6-1.9 1% 1% 2% 1% 1% 2% -30%
2.0-2.5 24% 27% 23% 22% 20% 24% -37%
2.6-3.0 37% 34% 36% 35% 33% 35% -32%
3.1-3.5 26% 25% 27% 28% 29% 27% -17%
Over 3.5 11% 11% 13% 13% 15% 12% 4%
Total 100% 100% 100% 100% 100% 100% -25%
Reported GPA 1,764 1,708 1,591 1,540 1,323 7,926 -25%
Total of All Students 2,011 1,913 1,827 1,721 1,468 8,940 -27%
Source: SDCCD Information System Note 1. High school GPA is self-reported on students' college applications. On average, across five years, 11% of students did not report their GPA. Note 2. In cases where there are few students, the percentage distribution may be 0%; however, a percentage is still calculated. Note 3. Students who enrolled within four years of high school completion are first-time to college high school graduates.
36SDCCD Office of Institutional Research and Planning
City College High School to College Pipeline Summary Report
Table 4. Reading Placement
Testing Reading 2016/17 2017/18 2018/19 Total N Avg % % Change N % N % N %
Test/No-Test Total Tested 1,518 80% 1,387 78% 1,185 77% 4,090 78% -22%
Not Tested 380 20% 398 22% 363 23% 1,141 22% -4%
Total Students 1,898 100% 1,785 100% 1,548 100% 5,231 100% -18%
Distribution of Students who
Took a Test
Transfer/Associate Level 806 53% 650 47% 552 47% 2,008 49% -32%
Basic Skills 525 35% 555 40% 471 40% 1,551 38% -10%
Need English Advising 143 9% 136 10% 118 10% 397 10% -17%
Take ELAC (ESOL/ESL) Test 44 3% 46 3% 44 4% 134 3% 0%
Total Tested 1,518 100% 1,387 100% 1,185 100% 4,090 100% -22%
Table 5. Writing Placement
Testing Writing 2016/17 2017/18 2018/19
Total N Avg % % Change N % N % N %
Test/No-Test Total Tested 1,518 80% 1,387 78% 1,185 77% 4,090 78% -22%
Not Tested 380 20% 398 22% 363 23% 1,141 22% -4%
Total Students 1,898 100% 1,785 100% 1,548 100% 5,231 100% -18%
Distribution of Students who
Took a Test
Transfer/Associate Level 419 28% 340 25% 228 19% 987 24% -46%
Basic Skills 912 60% 865 62% 795 67% 2,572 63% -13%
Need English Advising 143 9% 136 10% 118 10% 397 10% -17%
Take ELAC (ESOL/ESL) Test 44 3% 46 3% 44 4% 134 3% 0%
Total Tested 1,518 100% 1,387 100% 1,185 100% 4,090 100% -22%
37SDCCD Office of Institutional Research and Planning

City College High School to College Pipeline Summary Report
Table 6. ELAC (ESOL/ESL) Placement
Testing ELAC (ESOL/ESL) 2016/17 2017/18 2018/19
Total N Avg % % Change N % N % N %
Test/No-Test Total Tested 99 5% 80 4% 82 5% 261 5% -17%
Not Tested 1,799 95% 1,705 96% 1,466 95% 4,970 95% -19%
Total Students 1,898 100% 1,785 100% 1,548 100% 5,231 100% -18%
Distribution of Students who
Took a Test
Level 40 13 13% 6 8% 6 7% 25 10% -54%
Level 30 12 12% 10 13% 11 13% 33 13% -8%
Level 20 7 7% 2 3% 10 12% 19 7% 43%
Level 19 67 68% 62 78% 55 67% 184 70% -18%
Total Tested 99 100% 80 100% 82 100% 261 100% -17%
Table 7. Math Placement
Testing Math 2016/17 2017/18 2018/19
Total N Avg % % Change N % N % N %
Test/No-Test Total Tested 1,533 81% 1,406 79% 1,213 78% 4,152 79% -21%
Not Tested 365 19% 379 21% 335 22% 1,079 21% -8%
Total Students 1,898 100% 1,785 100% 1,548 100% 5,231 100% -18%
Distribution of Students who
Took a Test
Transfer-Level 329 21% 230 16% 172 14% 731 18% -48%
Associate Level 168 11% 140 10% 120 10% 428 10% -29%
Basic Skills 1,036 68% 1,036 74% 921 76% 2,993 72% -11%
Total Tested 1,533 100% 1,406 100% 1,213 100% 4,152 100% -21%
38SDCCD Office of Institutional Research and Planning

City College High School to College Pipeline Summary Report
Table 8.1. Headcount
Headcount 2014/15 2015/16 2016/17 2017/18 2018/19 Total 5-Yr % Change
Total Student Headcount 1,999 1,903 1,820 1,712 1,460 8,894 -27%
Table 8.2. Gender
Gender 2014/15 2015/16 2016/17 2017/18 2018/19 5-Yr. Avg.
5-Yr % Change
Female 51% 55% 51% 52% 53% 52% -24%
Male 49% 45% 49% 48% 47% 48% -30%
Table 8.3. Ethnicity
Ethnicity 2014/15 2015/16 2016/17 2017/18 2018/19 5-Yr. Avg.
5-Yr % Change
African American 9% 10% 8% 9% 9% 9% -28%
American Indian 0% 0% 0% 0% 0% 0% -20%
Asian/Pacific Islander 4% 4% 4% 4% 4% 4% -22%
Filipino 2% 2% 3% 3% 3% 3% -16%
Latinx 68% 69% 68% 68% 70% 68% -25%
White 12% 11% 12% 11% 10% 11% -37%
Other 4% 4% 4% 3% 4% 4% -30%
Unreported 1% 1% 1% 1% 1% 1% -47%
39SDCCD Office of Institutional Research and Planning

City College High School to College Pipeline Summary Report
Table 8.4. First Generation
First Generation 2014/15 2015/16 2016/17 2017/18 2018/19 5-Yr. Avg.
5-Yr % Change
First Generation 40% 40% 39% 40% 40% 40% -28%
Not First Generation 60% 60% 61% 60% 60% 60% -26%
Table 8.5. Educational Goal
Educational Goal 2014/15 2015/16 2016/17 2017/18 2018/19 5-Yr. Avg.
5-Yr % Change
4 Yr College Student 8% 9% 8% 9% 7% 8% -33%
AA/AS w/out Transfer 7% 6% 6% 5% 6% 6% -36%
BA/BS after Completing AA/AS 49% 50% 50% 50% 50% 50% -25%
BA/BS w/out Completing AA/AS 6% 7% 7% 7% 7% 7% -21%
Basic Skills Improvement 1% 0% 0% 1% 1% 1% -31%
Certificate/License Maintenance 1% 2% 2% 2% 2% 2% 29%
Current Job/Career Advancement 1% 1% 1% 1% 1% 1% -9%
Educational Development 1% 0% 1% 1% 1% 1% -17%
HS Diploma/GED Certificate 0% 0% 1% 0% 0% 0% -20%
New Career Preparation 9% 8% 8% 7% 8% 8% -31%
Voc Cert/Degree w/out Transfer 1% 1% 1% 2% 2% 1% 33%
Undecided 17% 16% 16% 16% 15% 16% -34%
40SDCCD Office of Institutional Research and Planning

City College High School to College Pipeline Summary Report
Table 8.6 Disability Support Programs and Services (DSPS)
DSPS 2014/15 2015/16 2016/17 2017/18 2018/19 5-Yr Avg 5-Yr % Change
NOT 97% 96% 96% 96% 96% 96% -28%
DSPS 3% 4% 4% 4% 4% 4% -6%
41SDCCD Office of Institutional Research and Planning

City College High School to College Pipeline Summary Report
Table 9. Units attempted vs. Units earned
Uni
ts A
ttem
pted
Academic Year
Units Attempted
Units Earned 0 Units 0.1 - 2.9 3.0 - 5.9 6.0 - 8.9 9.0 - 11.9 12.0 +
2014/15
0.1 - 2.9 Units 29% 71% 3.0 - 5.9 Units 37% 3% 60% 6.0 - 8.9 Units 21% 3% 20% 56% 9.0 - 11.9 Units 14% 1% 13% 24% 49% 12.0 + Units 6% 1% 7% 14% 19% 53%
2015/16
0.1 - 2.9 Units 22% 78% 3.0 - 5.9 Units 28% 2% 70% 6.0 - 8.9 Units 20% 3% 23% 54% 9.0 - 11.9 Units 14% 0% 13% 20% 52% 12.0 + Units 8% 1% 8% 11% 16% 56%
2016/17
0.1 - 2.9 Units 31% 69% 3.0 - 5.9 Units 31% 0% 69% 6.0 - 8.9 Units 22% 1% 19% 57% 9.0 - 11.9 Units 17% 1% 14% 17% 51% 12.0 + Units 6% 1% 8% 11% 17% 57%
2017/18
0.1 - 2.9 Units 9% 91% 3.0 - 5.9 Units 30% 1% 69% 6.0 - 8.9 Units 21% 2% 21% 56% 9.0 - 11.9 Units 16% 2% 16% 18% 48% 12.0 + Units 6% 1% 7% 12% 15% 58%
2018/19
0.1 - 2.9 Units 16% 84% 3.0 - 5.9 Units 40% 0% 60% 6.0 - 8.9 Units 22% 0% 21% 57% 9.0 - 11.9 Units 18% 1% 13% 17% 52% 12.0 + Units 6% 1% 7% 12% 17% 57%
Five-Year Average --- 80% 66% 56% 50% 56% % Change 2014/15 to 2018/19 --- -22% -24% -36% -44% -5%
42SDCCD Office of Institutional Research and Planning

City College High School to College Pipeline Summary Report
Table 10. Term and annual persistence
Start Year Fall
Cohorts Term
Persistence Term
Persistence Annual
Persistence Annual
Persistence Count Count % Count %
2013 1,217 894 73% 676 56%
2014 1,341 975 73% 718 54%
2015 1,358 1,052 77% 757 56%
2016 1,296 912 70% 701 54%
2017 1,187 840 71% 614 52% Total/5-Year Avg 6,399 4,673 73% 3,466 54%
43SDCCD Office of Institutional Research and Planning

City College High School to College Pipeline Summary Report
Table 11. English course retention and success rates of first‐time to college graduates in their first term compared to all others
Enrollments Retention Retention Success Success
Count Count Rate Counts Rate
First‐time students who enrolled in
English in their first term
Basic Skills
2014/15 658 602 91% 499 76%
2015/16 731 663 91% 558 76%
2016/17 675 610 90% 486 72%
2017/18 581 544 94% 432 74%
2018/19 490 448 91% 361 74%
Total 3,135 2,867 91% 2,336 75%
Transfer‐Level
2014/15 122 115 94% 87 71%
2015/16 188 170 90% 140 74%
2016/17 208 183 88% 153 74%
2017/18 245 221 90% 180 73%
2018/19 369 342 93% 276 75%
Total 1,132 1,031 91% 836 74%Total 4,267 3,898 91% 3,172 74%
(Cont. next page)
44SDCCD Office of Institutional Research and Planning

City College High School to College Pipeline Summary Report
Table 11. (Cont.)
Enrollments Retention Retention Success Success
Count Count Rate Counts Rate
All Other students
Basic Skills
2014/15 346 303 88% 249 72%
2015/16 446 373 84% 301 67%
2016/17 363 298 82% 237 65%
2017/18 247 199 81% 151 61%
2018/19 165 133 81% 89 54%
Total 1,567 1,306 83% 1,027 66%
Transfer‐Level
2014/15 235 203 86% 153 65%
2015/16 720 648 90% 525 73%
2016/17 871 770 88% 621 71%
2017/18 1,044 902 86% 716 69%
2018/19 1,011 877 87% 697 69%
Total 3,881 3,400 88% 2,712 70%Total 5,448 4,706 86% 3,739 69%
Source: SDCCD Information SystemNote 1. Tutoring and cancelled classes are excluded. Only students enrolled as of official census are counted in the enrollments. Note 2. First‐time students who enrolled within four years of high school completion are first‐time to college high school graduates. Note 3. ‘All other students’ encompasses all students who were not first‐time to college high school graduates.
45SDCCD Office of Institutional Research and Planning

City College High School to College Pipeline Summary Report
Table 12. Math course retention and success rates of first‐time to college graduates in their first term compared to all others
Enrollments Retention Retention Success Success
Count Count Rate Counts Rate
First‐term students who
enrolled in Math in their first term
Associate
2014/15 78 67 86% 30 38%2015/16 97 86 89% 53 55%2016/17 103 88 85% 38 37%2017/18 93 81 87% 48 52%2018/19 108 86 80% 41 38%Total 479 408 85% 210 44%
Basic Skills
2014/15 469 382 81% 258 55%2015/16 539 475 88% 306 57%2016/17 482 420 87% 278 58%2017/18 536 479 89% 289 54%2018/19 474 431 91% 238 50%Total 2,500 2,187 87% 1,369 55%
Transfer‐Level
2014/15 116 93 80% 67 58%2015/16 126 103 82% 67 53%2016/17 120 105 88% 68 57%2017/18 116 103 89% 66 57%2018/19 104 90 87% 53 51%Total 582 494 85% 321 55%
Total 3,561 3,089 87% 1,900 53% (Cont. next page)
46SDCCD Office of Institutional Research and Planning
City College High School to College Pipeline Summary Report
Table 12. (Cont.)
Enrollments Retention Retention Success Success
Count Count Rate Counts Rate
All others
Associate
2014/15 120 104 87% 63 53%2015/16 257 221 86% 118 46%2016/17 322 251 78% 94 29%2017/18 357 281 79% 133 37%2018/19 285 232 81% 125 44%Total 1,341 1,089 81% 533 40%
Basic Skills
2014/15 233 184 79% 120 52%2015/16 484 389 80% 215 44%2016/17 448 377 84% 208 46%2017/18 549 443 81% 216 39%2018/19 464 384 83% 172 37%Total 2,178 1,777 82% 931 43%
Transfer‐Level
2014/15 93 72 77% 46 49%2015/16 351 282 80% 169 48%2016/17 502 403 80% 248 49%2017/18 527 418 79% 222 42%2018/19 650 516 79% 274 42%Total 2,123 1,691 80% 959 45%
Total 5,642 4,557 81% 2,423 43%
Source: SDCCD Information SystemNote 1. Tutoring and cancelled classes are excluded. Only students enrolled as of official census are counted in the enrollments. Note 2. Students who enrolled within four years of high school completion are first‐time to college high school graduates. Note 3. ‘All other students’ encompasses all students who were not first‐time to college high school graduates.
47SDCCD Office of Institutional Research and Planning

City College High School to College Pipeline Summary Report
Table 13. Completion of transfer-level Math and English in first year by students who attended high school in the City service area
Passed Transfer‐level English and Transfer‐level
Math in first year
2014/15 2015/16 2016/17 2017/18 2018/19
Count Rate Count Rate Count Rate Count Rate Count Rate
Did not pass 221 77% 294 77% 267 77% 254 85% 262 86%
Passed 65 23% 87 23% 78 23% 45 15% 41 14%
Total 286 100% 381 100% 345 100% 299 100% 303 100%
48SDCCD Office of Institutional Research and Planning

Figure 1. English and Math sequence for City College
City College High School to College Pipeline Summary Report
49SDCCD Office of Institutional Research and Planning

MATH PATHWAYS—BY DISCIPLINEPathways may vary based upon intended major and transfer institution. For further guidance, please see a counselor.
ASSOCIATE DEGREE
HUMANITIES/SOCIAL & BEHAVIORAL SCIENCES
BIOLOGY NOTES• Strongly recommended that undecided students
see a counselor prior to selecting a math course.
• M30: Require students to enroll in Math course with an “X” or “E”, or MATH 96.
• M40: Advise students to enroll in Math course with an “X” (concurrent support lab).
• M50: Advise students to enroll in transferlevel Math.
• Course levels of 100 and above correspond to transfer level courses.
• MATH 96X: 5 lecture unit + 1 lab unit = 8 contact hours per week.
• MATH 57A/115/116X/119X: 3 lecture unit + 1 lab unit = 6 contact hours per week.
• MATH 59/109: 4 lecture unit + 1 lab unit = 7 contact hours per week.
• MATH 15’s: 1 lab unit = 3 contact hours per week.
OTHER(COMMUNICATION/ANALYTICAL
THINKING COURSES)
MATH 59EXPLORATIONS IN FOUNDATIONS
OF MATH (5)
M30/40
M30/40
MATH 96INT. ALGEBRA/GEOMETRY
(5)
M30/40
MATH 96INT. ALGEBRA/GEOMETRY
(5)
M30/40
MATH 57ABEGINNING ALGEBRA AND PRACTICAL
DESCRIPTIVE STATISTICS (4)
M30/40
OTHER DISCIPLINE SPECIFIC STATISTICS
PSYC 258, POLI 201, ETC.
M40/50
MATH 118MATH FOR LIBERAL ARTS
(3)
M40/50
MATH 116COLLEGE ALGEBRA
(3)
M40/50
MATH 116XCOLLEGE ALGEBRA + SUPPORT
(4)
M30/40
MATH 115GATEWAY TO EXPERIMENTAL
STATISTICS (4)
MATH 96XINT. ALGEBRA/GEOMETRY
+ SUPPORT (6)
MATH 96XINT. ALGEBRA/GEOMETRY
+ SUPPORT (6)
MATH 116COLLEGE ALGEBRA
(3)
M30/40
MATH 57ABEGINNING ALGEBRA AND PRACTICAL
DESCRIPTIVE STATISTICS (4)
M30/40
MATH 59EXPLORATIONS IN FOUNDATIONS
OF MATH (5)
M30/40
MATH 109EXPLORATIONS IN
MATHEMATICAL ANALYSIS (5)
OR
M40/50
MATH 116XCOLLEGE ALGEBRA + SUPPORT
(4)
M30/40
MATH 121APPLIED CALCULUS I
(3)
OR OR
MATH 122APPLIED CALCULUS II
(3)
MATH 104TRIGONOMETRY
(3)
MATH 141PRECALCULUS
(5)
MATH 96XINT. ALGEBRA/GEOMETRY
+ SUPPORT (6)
M30/40
MATH 96INT. ALGEBRA/GEOMETRY
(5)
M30/40
M50
MATH 150CALCULUS I
(5)
OR
OR
MATH 119INTRO TO STATISTICS
(3)
M40/50
MATH 119XINTRO TO STATISTICS +
SUPPORT (4)
M30/40
OR
STATWAY MATH EXPLORATION
City College High School to College Pipeline Summary Report
50SDCCD Office of Institutional Research and Planning

MATH PATHWAYS—BY DISCIPLINEPathways may vary based upon intended major and transfer institution. For further guidance, please see a counselor.
SCIENCE TECHNOLOGYENGINEERING MATH (STEM)
BUSINESS
ELEMENTARY EDUCATION
MATH 96INT. ALGEBRA/GEOMETRY
(5)
M30/40
MATH 119XINTRO. STATISTICS +
SUPPORT (4)
M30/40
MATH 119INTRO. STATISTICS
(3)
M40/50
MATH 96XINT. ALGEBRA/GEOMETRY
+ SUPPORT (6)
M30/40
OR
MATH 116COLLEGE ALGEBRA
(3)
M50
MATH 116XCOLLEGE ALGEBRA +
SUPPORT (4)
M30/40
OR
MATH 121APPLIED CALCULUS I
(3)
OR
*Corequisite: Completion orconcurrent enrollment in 210A
MATH 96INT. ALGEBRA/GEOMETRY
(5)
M30/40
MATH 96XINT. ALGEBRA/GEOMETRY
+ SUPPORT (6)
M30/40
OR
MATH 210ACONCEPTS OF ELEM. SCHOOL MATH I (3)
M40/50
MATH 212*CHILDREN’S MATHEMATICAL
THINKING (1)
MATH 210BCONCEPTS OF ELEM. SCHOOL MATH II (3)
MATH 96XINT. ALGEBRA/GEOMETRY
+ SUPPORT (6)
M30/40
MATH 96INT. ALGEBRA/GEOMETRY
(5)
M30/40
MATH 104TRIGONOMETRY
(3)
M50
OR
MATH 141PRECALCULUS
(5)
MATH 150CALCULUS I
(5)
MATH 151CALCULUS II
(4)
MATH 252CALCULUS III
(4)
MATH 255DIFFERENTIAL EQUATIONS
(3)
MATH 245DISCRETE MATH
(3)
MATH 254LINEAR ALGEBRA
(3)
&
City College High School to College Pipeline Summary Report
51SDCCD Office of Institutional Research and Planning

MATH 141PRECALCULUS
(5)
MATH PATHWAYS—COMPREHENSIVE CHART
BASIC SK
ILLS AN
DREFRESH
ER COU
RSESD
EGREE A
PPLICABLE
TRAN
SFER LEVEL
MATH 38PREALGEBRA
(4)
MATH 15E*TRIGONOMETRY REFRESHER
(1)
*Through challenge procedure
MATH 15A/B/C*/F*ALGEBRA/GEOMETRY REFRESHER COURSES
(1 EACH)
MATH 57ABEGINNING ALGEBRA AND PRACTICAL
DESCRIPTIVE STATISTICS (4)
M30/40
MATH 115GATEWAY TO EXPERIMENTAL
STATISTICS (4)
MATH 104TRIGONOMETRY
(3)
M50
MATH 119XINTRO. STATISTICS + SUPPORT
(4)
M30/40
MATH 210ACONCEPTS OF ELEM. SCHOOL
MATH I (3)
M40/50
MATH 107INTRO. TO SCI.
PROGRAMING (3)
M40/50
MATH 210BCONCEPTS OF ELEM. SCHOOL
MATH II (3)
MATH 116XCOLLEGE ALGEBRA + SUPPORT
(4)
M30/40 M40/50
MATH 119INTRO. STATISTICS
(3)
M40/50
MATH 118MATH FOR LIBERAL ARTS
(3)
M40/50
MATH 46ELEM. ALGEBRA/GEOMETRY
(5)
M30
MATH 59EXPLORATIONS IN
FOUNDATIONS OF MATH (5)
M30/40
MATH 109EXPLORATIONS IN
MATHEMATICAL ANALYSIS (5)
MATH 116COLLEGE ALGEBRA
(3)
MATH 121APPLIED CALCULUS I
(3)
MATH 212*CHILDREN’S MATHEMATICAL
THINKING (1)
M30
M30/40
MATH 96INT. ALGEBRA/GEOMETRY
(5)
M30/40
MATH 96XINT. ALGEBRA/GEOMETRY
+ SUPPORT (6)OR
M30/40
MATH 104TRIGONOMETRY
(3)
M50
MATH 116XCOLLEGE ALGEBRA + SUPPORT
(4)
*15C & 15F only: Through challenge procedure
*Corequisite: Completion or concurrent enrollment in 210A
Transition from non-STEM track to STEM track.
MATH 150CALCULUS I
(5)
MATH 151CALCULUS II
(4)
MATH 255DIFFERENTIAL EQUATIONS (3)
MATH 252CALCULUS III
(4)
MATH 254LINEAR ALGEBRA
(3)
MATH 245DISCRETE MATH
(3)&
MATH 122APPLIED CALCULUS II
(3)
OR
City College High School to College Pipeline Summary Report
52SDCCD Office of Institutional Research and Planning
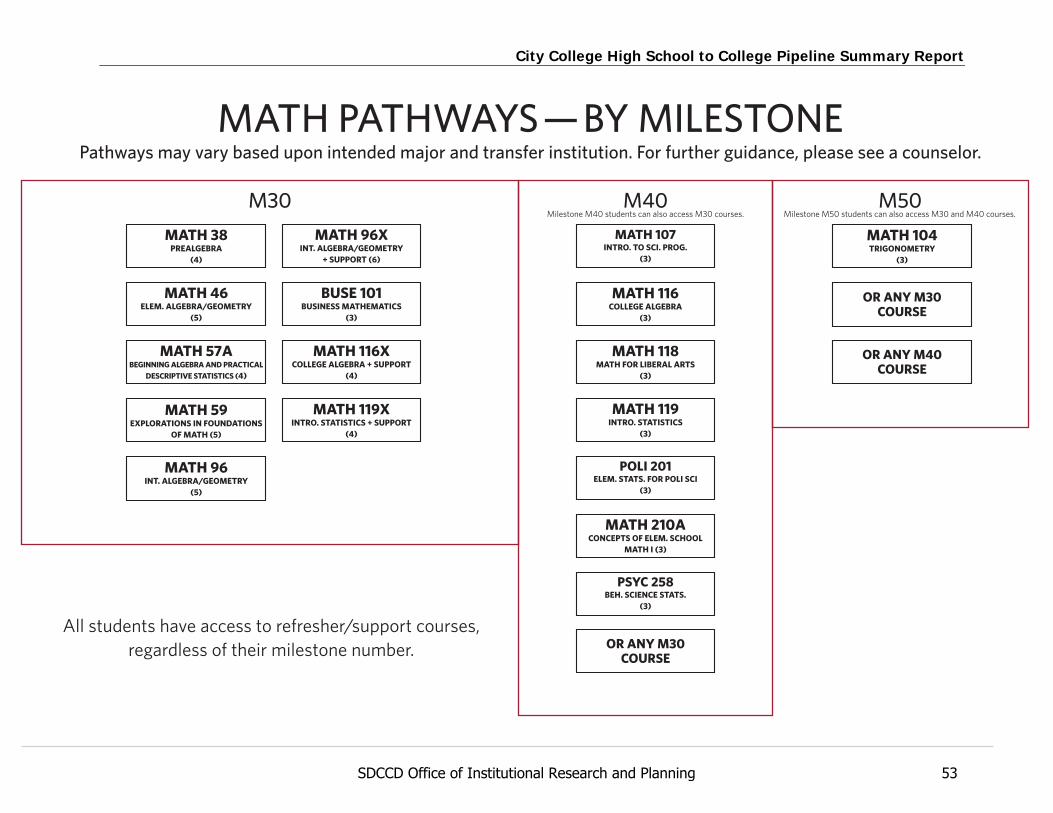
MATH PATHWAYS—BY MILESTONEPathways may vary based upon intended major and transfer institution. For further guidance, please see a counselor.
MATH 104TRIGONOMETRY
(3)
MATH 119INTRO. STATISTICS
(3)
MATH 116XCOLLEGE ALGEBRA + SUPPORT
(4)
MATH 119XINTRO. STATISTICS + SUPPORT
(4)
MATH 116COLLEGE ALGEBRA
(3)
MATH 118MATH FOR LIBERAL ARTS
(3)
MATH 57ABEGINNING ALGEBRA AND PRACTICAL
DESCRIPTIVE STATISTICS (4)
MATH 59EXPLORATIONS IN FOUNDATIONS
OF MATH (5)
OR ANY M30COURSE
OR ANY M30COURSE
OR ANY M40COURSE
MATH 210ACONCEPTS OF ELEM. SCHOOL
MATH I (3)
MATH 96XINT. ALGEBRA/GEOMETRY
+ SUPPORT (6)
MATH 96INT. ALGEBRA/GEOMETRY
(5)
MATH 107INTRO. TO SCI. PROG.
(3)
PSYC 258BEH. SCIENCE STATS.
(3)
POLI 201ELEM. STATS. FOR POLI SCI
(3)
MATH 38PREALGEBRA
(4)
MATH 46ELEM. ALGEBRA/GEOMETRY
(5)
BUSE 101BUSINESS MATHEMATICS
(3)
M30 M40 M50
All students have access to refresher/support courses, regardless of their milestone number.
Milestone M40 students can also access M30 courses. Milestone M50 students can also access M30 and M40 courses.
City College High School to College Pipeline Summary Report
53SDCCD Office of Institutional Research and Planning