citines - artelys | optimization solutions · users to optimize their energy strategy through...
TRANSCRIPT

CitInES
Design of a decision support tool for sustainable, reliable and cost-effective energy strategies in cities
and industrial complexes
Publishable summary
Start date of project: 01. October 2011 Duration: 30 months
This document reflects only the author’s views. The Community is not liable for any use that may be made of the information contained therein.
Project co-funded by the European Commission within the Seventh Framework Programme (2007-2013)
Dissemination Level
PU Public
Executive Summary
The overall objective of CitInES was to design and demonstrate a multi-scale multi-energy decision-making tool to optimize the energy efficiency of cities or large industrial complexes by enabling them to define sustainable, reliable and cost-effective long-term energy strategies. Demonstrations have taken place in two cities in Italy, Cesena and Bologna, and in one oil refinery in Turkey, Tupras.
Innovative energy system modelling and optimization algorithms have been designed to allow end-users to optimize their energy strategy through detailed simulations of local energy production, storage, transport, distribution and consumption, including demand side management and coordination functionalities enabled by smart grid technologies. All energy vectors (electricity, gas, heat...), usages (heating, air conditioning, lighting, transportation...) and sectors (residential, industrial, tertiary, urban infrastructure) are considered to draw a holistic map of the city/industry energy behavior.
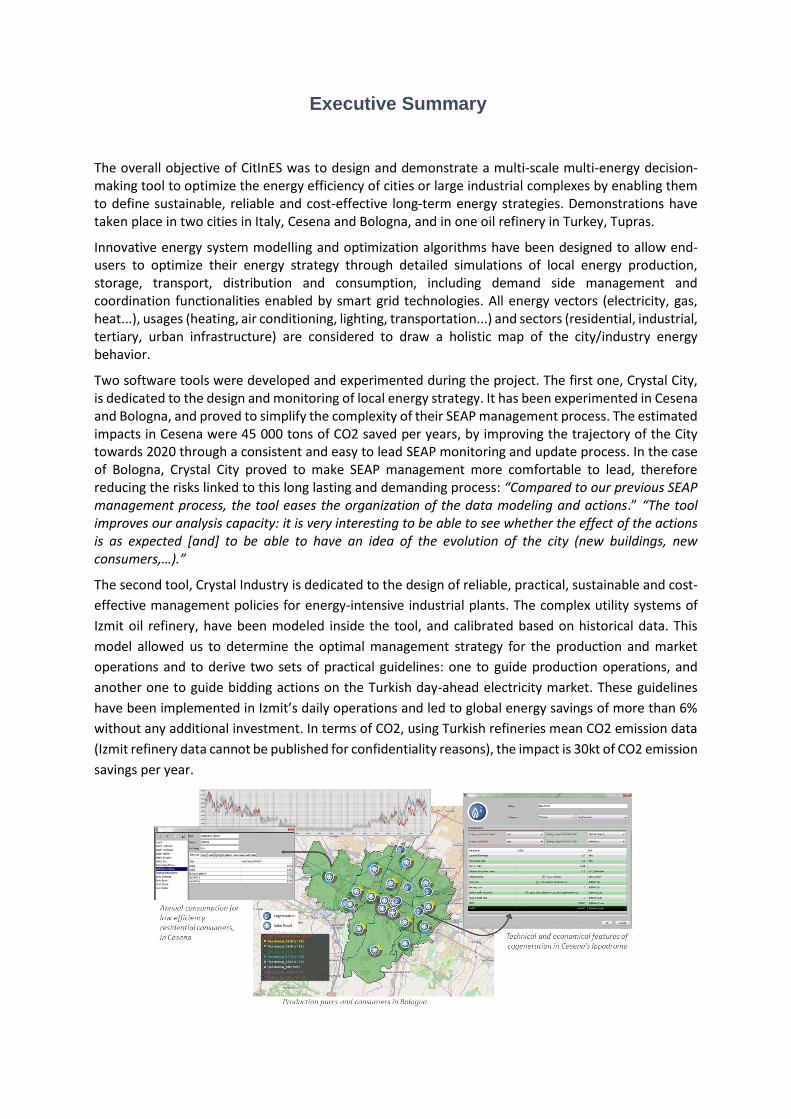
Two software tools were developed and experimented during the project. The first one, Crystal City, is dedicated to the design and monitoring of local energy strategy. It has been experimented in Cesena and Bologna, and proved to simplify the complexity of their SEAP management process. The estimated impacts in Cesena were 45 000 tons of CO2 saved per years, by improving the trajectory of the City towards 2020 through a consistent and easy to lead SEAP monitoring and update process. In the case of Bologna, Crystal City proved to make SEAP management more comfortable to lead, therefore reducing the risks linked to this long lasting and demanding process: “Compared to our previous SEAP management process, the tool eases the organization of the data modeling and actions.” “The tool improves our analysis capacity: it is very interesting to be able to see whether the effect of the actions is as expected [and] to be able to have an idea of the evolution of the city (new buildings, new consumers,…).”
The second tool, Crystal Industry is dedicated to the design of reliable, practical, sustainable and cost-
effective management policies for energy-intensive industrial plants. The complex utility systems of
Izmit oil refinery, have been modeled inside the tool, and calibrated based on historical data. This
model allowed us to determine the optimal management strategy for the production and market
operations and to derive two sets of practical guidelines: one to guide production operations, and
another one to guide bidding actions on the Turkish day-ahead electricity market. These guidelines
have been implemented in Izmit’s daily operations and led to global energy savings of more than 6%
without any additional investment. In terms of CO2, using Turkish refineries mean CO2 emission data
(Izmit refinery data cannot be published for confidentiality reasons), the impact is 30kt of CO2 emission
savings per year.
1 Project context and objectives
1.1 Context The European energy system is undergoing a major change. While cities concentrate 50% of the
population and 80% of CO2 emission, the 20-20-20 European objectives can be only reached by a
massive integration of renewable energy production and demand side management. Due to their
proximity with the end-consumers and to their unique ability to link energy issues with other
infrastructure or socio-economical subjects, local authorities’ role in this transition is essential. Under
the aegis of the Covenant of Mayors, thousands of cities throughout Europe committed to designing
and implementing a Sustainable Energy Action Plan (SEAP) to grasp the management of the energy
strategy on their territory and reduce their CO2 emission, integrate renewable energy and decrease
energy consumption.
But leading a SEAP is a long and demanding process that lasts for about ten years, involves very diverse
stakeholders and requires the municipality to master the rather new to them and complex subject of
energy investment planning. Many cities have designed their SEAP and start to implement actions. But
most of them do not have yet set up a monitoring process to follow action advancement. Hence, the
risk is high that implemented actions impact does not reach the objectives of the SEAP. Such a gap
between SEAP trajectory and SEAP objectives can come from many reasons: designed actions not
adapted to the local context or outside of the control of the municipality, temptation for cities to
communicate about high objectives without being able to implement them, lack of expertise and
means of local technical team…
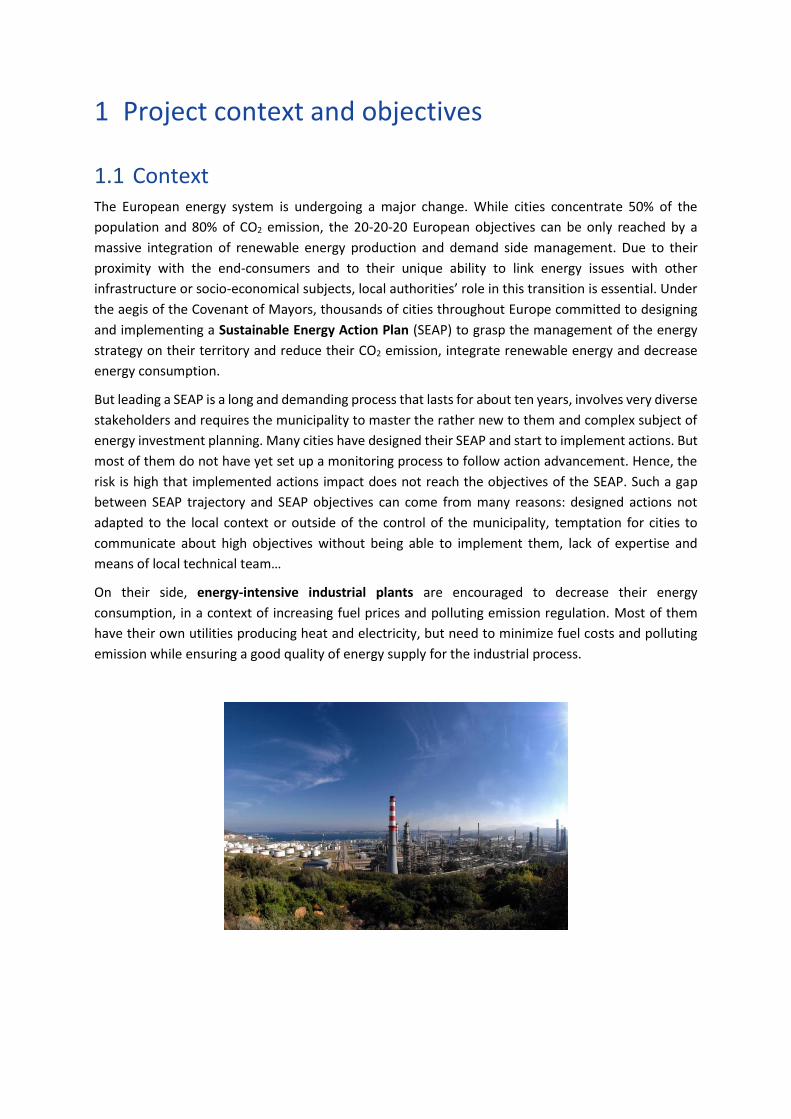
On their side, energy-intensive industrial plants are encouraged to decrease their energy
consumption, in a context of increasing fuel prices and polluting emission regulation. Most of them
have their own utilities producing heat and electricity, but need to minimize fuel costs and polluting
emission while ensuring a good quality of energy supply for the industrial process.

1.2 Objectives of the project Because of the complexity of the energy system and of the diversity of involved services and external stakeholders, municipalities and industries have difficulties to fully grasp their energy stakes.
The overall objective of CitInES was to design and develop two multi-scale multi-energy decision-support tools Crystal City and Crystal Industry to optimize the energy strategy of cities and large industrial complexes by enabling them to define sustainable, reliable and cost-effective long-term energy plans. Demonstrations of tools have taken place in two cities in Italy, Cesena and Bologna, and in one oil refinery in Turkey, Tupras.
Innovative energy system modelling and optimization algorithms have been designed to allow end-users to optimize their energy strategy through detailed simulations of local energy production, storage, transport, distribution and consumption, including demand side management and coordination functionalities enabled by smart grid technologies. All energy vectors (electricity, gas, heat...), end-uses (heating, air conditioning, lighting, transportation...) and sectors (residential, industrial, tertiary, urban infrastructure) have been considered to draw a holistic map of the city/industry energy behavior.
Finally, energy strategy analyses encompass advanced long-term risk analysis. As economic and technical situations are constantly evolving, a relevant energy strategy should be robust to different prospective scenarios. Hence, a diversified energy portfolio will allow city and industry authorities to react more efficiently to fuel price stresses and to decrease their exposition to a given energy solution.
Figure 1 – Scheme of the decision support tools developed within Citines (more details in §2).

1.3 Consortium
Coordinator ARTELYS is a SME specializing in optimization, decision-making and modelling. Relying on their high level of expertise in quantitative methods, the consultants (Masters and Ph.Ds specializing in applied mathematics, computer science and energy) deliver efficient solutions to complex business problems. They provide major French or European companies of the power industry with decision support software, as well as consulting and training services. Artelys is coordinator of the CitInES Project.
Laboratories INESC PORTO is a private non-profit association recognized as Public Interest Institution and appointed as Associated Laboratory by MCES. INESC-Porto has the following strategic areas of activity: Telecommunication and Multimedia; Power Systems; Manufacturing Systems Engineering; Communication and Information Systems; Optoelectronics and Electronic Systems; Innovation and Technology Transfer. In the Power Systems area, INESC Porto has participated in R&D projects under EU and Science, Technology Foundation contracts. The Austrian Institue of Technology AIT works in close collaboration with industry and customers from public institutions, striving to increase their added value through innovation and new technologies. The AIT is a highly-specialised R&D partner focusing on key infrastructure issues of the future. Its Energy Department covers the research areas « Energy for the built environment‟ and « Electric energy Infrastructure‟. ARMINES is a non-profit association from Paris, France, created in 1967, fostering R&D in methodologies and processes The whole group represents about 1500 researchers; the total budget is about 100 M€ and investment is about 50 M€ on an annual basis. ARMINES has proven its capabilities in managing, or participating to, projects such as the proposed one. The Centre for Applied Mathematics (CMA) of the Ecole des Mines de Paris is the research centre involved in the CitInEs proposal.
TAO (http://tao.lri.fr) is the mixed INRIA Saclay-CNRS-LRI, Université Paris-Sud research group interested in the interplay of Machine Learning (A for Apprentissage) and Optimization (O). The two pillars of TAO’s research are machine learning for cognitive systems and pattern analysis, statistical modelling, computational learning.
End users MUNICIPALITY OF CESENA (ITALY) is situated in Northern Italy within Emilia-Romagna Region, some 15km from the Adriatic coast. Together with Forlì it is the capital of the Forlì-Cesena district. The district has about 378,000 inhabitants in 30 municipalities. Cesena itself has a population of about 96,000 (2009). BOLOGNA, a city of nearly 400.000 inhabitants, is also home to one of the oldest universities in Europe (90.000 students). The Municipality plays a leading role in national environmental policies and has frequently received international acknowledgement for its achievements. Bologna is a founder member of ICLEI, International Council for Local Environmental Initiatives(1993) and adopted the Charter of European Cities and Towns Towards Sustainability in 1994.

ERVET The Emilia-Romagna Development Agency is the local development agency of the Emilia-Romagna region. It has the objective of promoting a sustainable economy, in line with regional planning and programming and the system of local authorities. Its work is aimed at guaranteeing operative technical support in the area of regional policies of economic, social and environmental development and promotion, to aid the processes of cooperation and partnership on a European scale.
TUPRAS is Turkey’s largest industrial enterprise, with 28.1 million ton crude processing capacity. Tüpraş has 4 refineries operating in 4 different cities with 4,151 employees. In addition, a 50,000 ton capacity petrochemical production facility, a majority stake (79,98 %) in shipping company DİTAŞ and 40% share ownership of petrol retailer Opet, create synergies and add value to the operations.
Private company SCHNEIDER is primarily focused on two specific businesses segments: Electrical Distribution and Automation & Control. At a time when electrical, automation and communication technologies are converging, this strong specialization enables the Group to occupy a leading international position on its four markets: Energy & Infrastructures, Industry, Buildings and Residential.

2 Main S&T results/foregrounds
Citines project allowed the consortium to develop two software platforms: Crystal City, dedicated to
the design and monitoring of local energy strategy, and Crystal Industry for the design of reliable,
practical, sustainable and cost-effective management policies for energy-intensive industrial plants.
2.1 Crystal City
2.1.1 Description of the functionalities
Crystal City is an innovative decision-support tool that is designed to help cities to conceive, monitor,
update and communicate about their SEAP.
2.1.1.1 A steering and follow up tool
Crystal City allows territories to gather and organize a large amount of data coming from many
different sectors, and to follow their evolution in time. It integrates results of project studies and
provides territories with a fine analysis allowing to coordinate all actions and reach environmental
targets.
Collect and standardize data
Being able to build a complete energy model integrated in a software tool necessitates a sufficient
level of inputs. The collection of data is a long but beneficial process, which allows to coordinate and
develop relationships between all actors involved with the energy sectors of one city. The tool Crystal
City offers an ergonomic and organized support to gather this data and a way to standardize and make
generic the data collection process.
As a result, territories have a clear analysis regarding their energy state and strategies, displayed
through a nice and user-friendly interface:
Figure 2: map view of the consumption in the municipality of Cesena

Figure 3: map view of the production of the municipality of Cesena
Integrate results of project studies
The tool Crystal City provides municipalities with analysis and follow-up of environmental projects.
Energy strategies are integrated into the software to assess their relevance, adaptability with the
territory, and evolution in time, as well as the effect of updates from actors in energy sectors.
Coordinate all actions to reach environmental targets
As it gathers all level of strategies representation and includes a multi-scenario analysis, the tool is able
to assess the interaction and coordination of energy actions. The municipality’s trajectories are thus
adapted and optimized to reach environmental targets.
2.1.1.2 A decision-support tool
Thanks to environmental, economic and technical evaluations, the tool Crystal City helps municipalities
to define their strategies.
Assess economic and environmental impacts of urban planning
As the tool integrates evolution of urban forms (new buildings, renovations, urban installations…),
municipalities have support to adapt and improve their trajectories taking into account evolutions
regarding urban planning.
Define a strategy to minimize polluting emissions at lower cost

The integration of financial data crossed with computation of polluting emissions allows to improve
the existing strategies towards easier to reach, because at lower costs, environmental targets of
municipalities.
The financial data includes:
- Carburant prices
- Feed-in tariffs
- Energy actions costs
- Consumers and producers bills
Handle vulnerability to fossil fuel cost variations
Through the management of long term data that integrates forecasted evolutions of financial data,
above all the variation of fuel costs, the tool provides municipalities with performing assessments to
handle this vulnerability.
Identify new cost-efficient energy actions
Thanks to the analysis of the energy system, the integration of its environmental, technical and
economic parameters, the tool Crystal City is able to identify other action-levers of municipalities. That
allows to set in place new environmental projects using the territory potentials as much as possible.
2.1.1.3 A collaborative tool
Through its ergonomic and user-friendly interface, Crystal City helps municipalities to communicate
with citizens and potential stakeholders around energy issues.
Interact with stakeholders
All results and analysis (map views, charts displaying indicators) can be published on a website.
Evolution of municipalities’ strategies and trajectories can thus be presented to stakeholders.
Therefore, the interaction between all sectors involved in energy is simplified and so the cities
evolution towards environmental targets is improved and become more efficient
Communicate about SEAP actions
In particular, the tool allows to communicate about the evolution in time of energy action plans. Based
on its multi-scenario analysis, results of environmental, economic and technical indicators, the tool
provides graphs and map views to visualize impacts of SEAP actions. All of those results can be
published directly in the municipalities’ websites.

Figure 4: Communication about SEAP action, example with the installation of solar panels
Receive citizen feedbacks
As with stakeholders, the interaction with citizens is as well simplified. The energy system of their city,
the actions in place and evolutions in time can be presented so that they get involved as much as
possible. Through this interaction, energy sectors can receive feedbacks from citizens and adapt the
way to lead environmental projects to be closer to them.
2.1.2 Innovative features
2.1.2.1 Complete and coherent energy model of the city
Through a multi-energy model integrating pollutant emissions, energy efficiency, energy bills for
citizens, Crystal City offers a fine and dynamic representation of the territories for the analysis of
energy systems, energy opportunities, and long-term environmental and economic impacts of
territorial projects.

Figure 5 – Bologna – Energy consumption view. Public buildings consumption is modeled explicitly
while residential, office and industry consumption are represented statistically
It gathers the following functionalities:
- Multi-energy (electricity, gas, heat, fuel…) system
- Multi-sector (urban planning, housing, transport, energy generation and network, public
services…) characteristics
- Modelling of the whole energy chain: energy generation, distribution, storage and end-use
- Explicit modelling of public buildings consumption and statistic modelling of other
consumption split by zone and type of consumer (houses and apartments by age of
construction, offices and industries by category…);
- Consumption split by type of end-use (heating, cooling, transport, electrical appliances…);
- Detailed simulation of each asset (physical or financial): technical and operational constraints,
greenhouse gases emissions, costs and gains
- Advanced modelling capacity for energy generation and networks (smart grids, electrical
vehicles, district heating…);
- Library of indicators to assess energy balance and actions progress
- Library of main existing energy technologies;
- Library of potential energy projects including financial characteristics
- Web publishing services to export GIS views with SEAP impacts on the municipality web site;
Consumption, production, cash flows and pollutant emissions can be simulated at hourly time steps,
integrating long term evolution of the main energy parameters. Crystal City also offers the possibility
to follow the Covenant of Mayor guidelines (yearly data for consumption and production without long
term exogenous data evolution).
With this comprehensive modeling Artelys Crystal City allows to consider structural changes in the local
energy system (heating network , demand management , massive renewable energy penetration…)
and the introduction of innovative solutions (smart grid, electric fleet,...).

Based on a multi-scenario analysis system including many indicators providing technical,
environmental and financial results, it offers full evaluation of local energy strategies and an ergonomic
visualization of this analysis.
2.1.2.2 Multi-level modeling
One major stake for modeling the energy system of the city is to handle jointly:
Specific representation of large energy consumer (houses in the picture below), producer or
specific network constraint. In particular public buildings, which may be individually monitored
in a SEAP can be represented specifically;
Statistical representation of distributed energy consumers and producers to model the whole
city with only aggregated data. According to available data and communication objectives, the
statistical repartition of consumers and producers can be detailed by district (pie charts in the
picture below) or with a finer spatial granularity.
Figure 6 – Cesena – Energy consumption view. Public buildings consumption is modeled explicitly while residential, office and industry consumption are represented statistically.

Figure 7 – Cesena - Production view. Local generation assets are represented explicitly.
Specific and distributed assets are simulated jointly, at a fine time granularity (for instance at an hourly
time step for a year of data) to minimize energy costs and polluting emissions.
Each energy asset is characterized by:
its model of energy production\consumption all over a year, on an hourly basis;
flexibility of this model (for demand side management or flexibility on production), plus technical and operational constraints;
Its cost model (purchase, operational and maintenance costs, flexibility costs...);
Its yield model for energy transformation and storage assets;
Its greenhouse gas rejections model.
Crystal City provides users with a detailed library of energy models (energy generation main
technologies, end-use supply equipment, transportation assets…).
For network modeling, advanced R&D work has been done to couple Crystal City model with detailed
network simulation tools (for electricity and district heating networks). The principle is as follows:

Given energy generation and consumption data, compute for some representative time steps
the power flow (for electricity network) or fluid & thermal simulation (for district heating)
Identify most congested links and integrate them explicitly in the aggregated model. Other
links are aggregated and modeled as a cluster with a global capacity and a loss model
Run the aggregated model on the whole time series.
Figure 8 - Detailed MV network and aggregated clusters
If the aggregated model includes flexible assets (energy storage, smart electrical vehicle charging,
demand responses, micro-cogeneration…), asset management is optimized and detailed simulations
are computed again with the new generation and consumption data.
Figure 9 – Interaction and management of the data between aggregated and detailed model
This process has been experimented for electrical vehicle smart charging, taking into account network
constraints. It has also been tested for district heating networks. More details on the methodology has
been published at the IEEE conference PowerTech: “A multi-scale optimization model to assess the
added value of a smart charging policy for electrical vehicles".
2.1.2.3 Advanced modeling for smart grids
The effects of smart grid in future power systems are expected to be ubiquitous all over the grid,
targeting the control of all eligible system components and processes. Thus, to access the impact of a
smart grid environment on city energy system, the modelling phase was developed considering the
goal of including all predictable control possibilities for all controllable system devices.
Modelling
This phase started with the implementation of models of energy systems assets: energy generation,
storage and distribution for heat, gas and electricity systems, as well as energy demand units for the
building sector (thermal energy demand and electrical energy demand), the transport sector, the
industrial sector and the sector of urban facilities (public lighting and water treatment)1.
In this modelling approach the system devices and their interactions are characterized under different
perspectives: physical, reliability, functional and economic. The result, after models parameterization,
assembling and integration in the main tool, is a comprehensive representation of the city energy
performance: technical (voltage profiles, power losses, etc.), economic (OPEX, CAPEX, etc.),
environment impact (CO2 emissions, use of renewables, etc.) and risk analysis (sensibility to fuel price
oscillations).
Although the main goal is models integration in global tool, some of the implemented may also be
used independently because of their potential applications outside the main program:
Tool for estimation of transports emissions – this application computes the expected CO2 and exhaust gases emissions as a function of vehicles distributions and types;
Tool for assessment of electrical energy consumption in buildings – provides the estimation of energy consumption as a function of the building characteristics (type, efficiency class, etc.).
These applications might also be used autonomously (for instance, in a web platform available to
citizens), contributing to improve citizens’ awareness on environment and efficiency questions.
All system devices and their interactions were implemented endeavouring models flexibility and
modularity. This way, the resultant global tool not only offers the possibility of exploiting all potential
of the simulation tool (such as combinations of states and operation conditions) but also permits easy
upgrades of existing modules or integration of new ones.
Impact of smart grid technologies on energy systems
1 Jessen Page, Daniele Basciotti, Olivier Pol, Nuno Fidalgo, Mário Couto, Rebecca Aron (Artelys), Alice Chiche, Laurent Fournié, , “A multi-energy modelling, simulation and optimisation environment for urban energy infrastructure planning”, 13th International Conference of the International Building Performance Simulation Association, Lyon, France, August 2013

A paradigmatic example of the implemented software potential is the simulation of the smart grid
impacts in power systems. The tool allows the evaluation of individual or combined impacts of current
issues such as storage, electric vehicles or DSM programs.
Considering that CitInES concerns energy strategies planning, further test studies were developed to
analyse the combination of smart grid impact with long-term network reinforcement. As a
consequence of natural load growth and the appearance of new urban zones, the power grid needs to
be occasionally upgraded. In the medium or long-term planning (10 to 30 years), the impact of system
exploitation, including smart grid policies, on network reinforcement needs should be accounted. Note
that different energy policies imply distinct system outputs (e.g. load peak diagram) and consequently,
distinct grid upgrade requirements. These later studies allow comparing the impact of alternative
energy strategies, integrating at the same time the costs of network reinforcements.
The software application also incorporates a network expansion module, able to appraise the network
components requirements for a new zone and the associated costs. In addition, this tool can monitor
the state of charge (of lines and transformers) and send alert signals in the case of reinforcement
necessity and suggest the most adequate (lines and transformers) upgrades. Two grid upgrade routines
were implemented: the first one is based on the assumption that network data is fully accessible; the
second one is based on common city data (inhabitant densities, dwelling size and specific heat
intensity) and public data on network infrastructure costs (e.g. cable costs, transformer costs, etc.).
The first approach is more accurate but requires data that is not always handy; the second
methodology has the advantage of being meaningful for city managers, as it uses more high-level data
and not technical specific data.
Several test cases were carried out to illustrate the platform potential, developed on purpose for the
project CitInES. The studies comprise the impact analysis of electric vehicle integration, demand side
management and energy storage, with and without smart grids. The results may be presented under
different perspectives: technical, economic, environment impact and reliability indicators.
Illustrative results
This section presents a few selected examples to illustrate the potential of the application in the long-
term impact assessment (e.g. 20 years) of smart grid applications in distribution networks. These test
cases concern the analysis of the isolated and combined effects of EV charging type, DSM and solar PV
microgeneration.
One of these studies2 analysed the impact of DSM actions and the effect of DSM controllable load in
the long-term grid upgrade investment costs. It was shown how the amount of DSM controllable load
influences the shape of the diagram and how it affects the long-term costs in grid reinforcement.
Another example3 concerns the test of a multi-level approach using multi-level modelling (see section
Erreur ! Source du renvoi introuvable.) of a typical MV network in order to optimize the EV charging
2 Mário Couto, José Nuno Fidalgo “Characterization of Smart Grids Impacts on Smart Cities Power Systems”, Energy for Sustainability Multidisciplinary Conference, EfS 2013, Coimbra, September, 2013 3 M. Chammas, A. Chiche, L. Fournié, J. Nuno Fidalgo, M. J. Couto, “A multi-scale optimization model to assess the benefits of a smart charging policy for electrical vehicles”, PowerTech 2013 conference, Grenoble France, June 2013

policy. A minimizing cost approach was set, modelling day-ahead markets, and taking into account
losses. This study showed interesting cost differences resulting from the different charging policies
(30% potential savings). Moreover, it demonstrates another angle of the models/application flexibility.
The last illustration example4 involves the simulation of combined effects of EV charging type, DSM
and solar PV microgeneration, and, at the same time, its impact on investments grid upgrade costs.
This test was developed for long-term analysis and the system performance was characterized by both
technical and economic indexes. The main conclusion is that a long-term cost/benefit analysis should
always be completed for the assessment of the most adequate planning solutions; the integration of
SG implies to adapt the network reinforcement policy. Historically, the upgrade strategy was mainly to
reinforce the network when the peak load approaches its capacity. SG integration allows network
operators to smooth the load curve and postpone reinforcement, which may strengthen the illusion
that this strategy is suitable. Our results contradict this guiding principle, showing that, sometimes,
bringing forward the grid upgrade may be advantageous in the long term. Consequently,
reinforcement studies must be based on a global economic evaluation, reinforcement deferral versus
global SG cost (higher losses, cost of load shifting…), rather than a time static analysis 0.
Contributions to the state of the art and impacts of the project
The integrated multi-energy systems modelling is rather innovative, allowing a detailed representation
of systems components or a simplified (aggregated) version of networks if needed. Most of divulged
articles about smart cities use very simplified models.
The study of impact of smart grid technologies on energy systems represents a significant step beyond
the state of the art, as it will lead to assess the impact of ICT on generic multi-energy systems including
a large number of components.
The aggregation methodology is also an important advancement in complex systems modelling, as it
allows accurate although simplified systems representation. It will also allow optimizing the energy
infrastructures, for instance, in case of extension of existing distribution networks, to answer to new
energy usages local authorities may have to choose between network reinforcement, local production
and demand side management, or a combination of all.
Another original development was the implementation of a procedure for the estimation of network
expansion based on common city data (inhabitant densities, dwelling size and specific heat intensity)
and public data on network infrastructure costs (e.g. cable costs, transformer costs, etc.). In fact, power
system planners used to base their projections on load evolution studies and network characteristics.
4 J. Nuno Fidalgo, Mário Couto, Laurent Fournié, “The Worth of Network Upgrade Deferral with Smart Grids – Truism or Myth?”, IEEE Transactions on Smart Grid, February 2014. (submitted)

2.1.2.4 Long term scenarios for what-if scenarios
Through the management of corpus of long term hypothesis that integrate forecasted evolutions of
main variables such as end-use demands, CO2 content of electricity, or fuel prices, and the
management of multi-scenarios, the tool allows users to assess, compare and improve several
scenarios.
A scenario represents a possible state of the territory on a given date. It can be built:
Using real data for a past year (Monitoring of the real past state of the territory)
By transforming a reference scenario with energy actions, for a past or future year, in order
to assess the impact of future actions, or the impact of past actions based on a reference
scenario, all other things being equals.
This allows to assess the relevance of actions, their impacts on the territory and to adjust the
strategies.
This methodology offers an assessment of the territory:

- A scenario built with real data provides with an energy balance and thus reveals elements on
which the city can act to decrease polluting emissions: high consumption of a sector, solar
potentials, energy networks to be extended…
- A scenario built with energy plan actions allows to assess where the territory will stand if the
plan is achieved, and reveals how it can be improved: remaining potentials not used, urban
evolutions to be developed…
- A scenario built using current advancement of energy plan actions, or a projection of what
should be the territory if the rhythm of actions implementation stays the same allow to assess
where the city stands regarding its plan: on which action it should insist, where priorities
should be set… This allows to readjust the trajectory of the municipality in order to achieve
more easily targets with a set of actions reducing pollutant emissions at lower costs.
As a result, a new scenario can be built based on improvements of the energy plan illustrating the state
that the territory will achieve thanks to the adjustment of its trajectory.
2.2 Crystal Industry
2.2.1 Description of the functionalities
Crystal Industry is a decision-support software for industries that can be used to improve their energy
management strategies through a better utilization of their production/consumption assets and a
tighter integration with energy markets. In particular, it has been designed to support two different
type of studies that are described in details in the next two sections.
2.2.1.1 Management strategy study
For certain large industrial complexes, the internal power plants tend to be highly complex and are
operated under certain constraints, which may at first seem irrelevant for the purpose of a
management study. In reality, any technical, operational or safety rule that is not modeled in the
simulation tool (i.e. Crystal Industry) may lead to major interpretation mistakes when comparing
optimized strategies with historical/current strategies.
Thus, the study of management strategies must rely on a careful and detailed representation of the
following aspects of the energy systems:
local energy demand emerging from the refinery processes;
technical constraints of the energy assets;
operational constraints (such as safety/reserve) of the plant;
flowsheet structure representing the internal energy flows between assets.
The typical workflow of a management strategy study must be centered into such details which are
critical to the operators who will eventually use and apply the operational guidelines delivered as a
result of the study. This typical workflow is presented in the following figure.

Crystal Industry is at the center of the first four stages of the study workflow, the last stage being
outside of the scope of the current version of Crystal Industry (although it may become part of the
scope of the tool in future releases).
Stages 1 and 2 (“Model” and “Historical replay”) are performed in an iterative loop. The reconciliation
of historical data may highlight discrepancies between the theoretical model and the actual process
operations. In such case, the model is corrected, updated, or simply improved and the data
reconciliation step can be performed again. This process is executed until the results of the historical
replay are satisfactory.
The next stage (“Optimization”) consists in generating an “optimized” strategy. Once again, it is
possible that the results obtained at this stage highlight missing constraints in the model: as the
optimization process tries to make the most efficient use within the boundaries of the model, any
missing constraints is likely to be violated. In such case, the model is updated and the optimization
stage executed again, until the optimization result demonstrates operational potential.
The 4th stage (“Future strategy”) is also iterative but should not require making any modification to
the deliverables of the previous stages. Instead, the optimized strategy is re-interpreted in simpler and
more practical guidelines that can be used by field operators. The iterative process aim is to produce
guidelines that are as simple as possible while still guaranteeing an improvement from a
financial/environmental point of view.
In practice, such studies are outside of the scope of traditional consulting companies, which are highly
competent for working on the efficiency of one particular asset at a time or multiple assets on a
Model
• Local energy demand
• Energy production assets
Historical replay
• Integration of historical data (plant measures)
• Simulation of the current strategy (data reconciliation)
Optimization
• Computation of the ideal strategy
Future strategy
• Design and implementation of custom operational strategies
• Simulation and comparison with current/ideal strategies
Field application
• Implementation within the industrial operational process
• Experimentation feedbacks

stationary basis, but lack advanced computation tools to optimize the global asset management: these
type of studies are very complex, involve a large spectrum of numerical techniques (calibration,
reconciliation, optimization, and forecasting), and require large data usage.
The principal advantage of Crystal Industry is to provide a unified tool for addressing all stages of a
technical and economic management strategy study. Each stage of the study can be performed in a
both highly flexible and ergonomic way. Users of the tool do not need to be specialists of the underlying
numerical techniques.
For industrial plants, the outcome of an operational management study is the application of new
management rules by the operators, which will help improving the specific key performance indicators
considered during the study.
2.2.1.2 Investment study
In the case of investment projects, the workflow is simpler. A typical investment study workflow is
presented in the following figure.
Once again, Crystal Industry is at the center of the first 4 stages of the study workflow, the last stage
being outside of its scope.
Stages 3 and 4 (“Optimization” and “Future investments”) are used to valuate multiple asset portfolios,
including the current one. In order to make relevant comparisons between different investment
projects, this valuation is based on the computation of the optimal management strategy in each
investment scenario. The goal of stage 4 is to simulate and analyze the impact of multiple what-if
scenarios corresponding to different investment projects.
Model
• Local demand
• Production assets
Historical replay
• Integration of historical data (plant measurements)
• Data reconciliation / simulation of the current strategy
Optimization
• Computation of the economic value of the current asset portfolio
Future investments
• Definition of potential asset portfolio extensions / investments
• Simulation and comparison of investment projects RoI
Upgrading project
• Construction of new assets
• Post-construction feedbacks
In addition to supporting operational management studies, Crystal Industry also supports the workflow
of investment studies. The functionalities of Crystal Industry used for such studies are essentially the
same as for management studies, which makes it easy to switch from a study of the current
management rules to a plant investment study.
For industrial plants, the outcome is to make sound decisions when planning for new investment
projects by simulating their real impact in a cheaper, shorter and more practical way than field tests.
Thanks to Crystal Industry, investment decisions can take into account the detailed trade-offs between
cost, capacity, and flexibility. This can only be achieved by not only considering new assets but also
their impact on the overall energy system management and performance.
2.2.2 Innovative features
2.2.2.1 Detailed plant representation
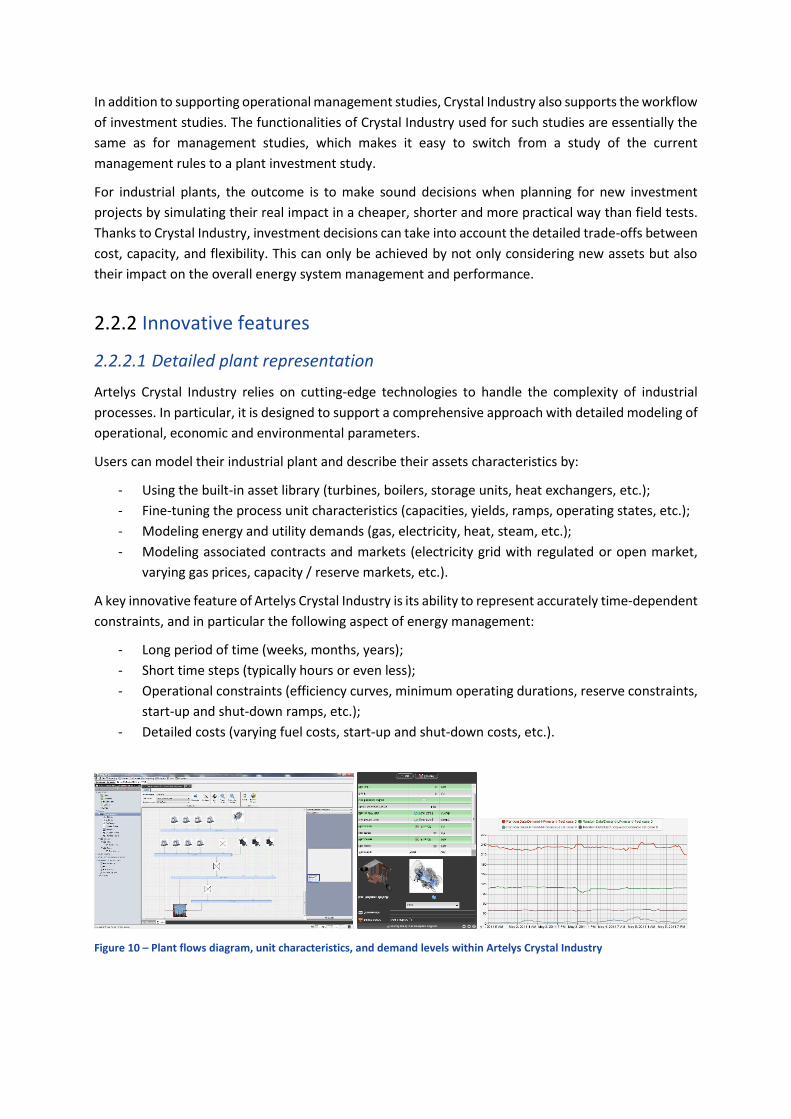
Artelys Crystal Industry relies on cutting-edge technologies to handle the complexity of industrial
processes. In particular, it is designed to support a comprehensive approach with detailed modeling of
operational, economic and environmental parameters.
Users can model their industrial plant and describe their assets characteristics by:
- Using the built-in asset library (turbines, boilers, storage units, heat exchangers, etc.);
- Fine-tuning the process unit characteristics (capacities, yields, ramps, operating states, etc.);
- Modeling energy and utility demands (gas, electricity, heat, steam, etc.);
- Modeling associated contracts and markets (electricity grid with regulated or open market,
varying gas prices, capacity / reserve markets, etc.).
A key innovative feature of Artelys Crystal Industry is its ability to represent accurately time-dependent
constraints, and in particular the following aspect of energy management:
- Long period of time (weeks, months, years);
- Short time steps (typically hours or even less);
- Operational constraints (efficiency curves, minimum operating durations, reserve constraints,
start-up and shut-down ramps, etc.);
- Detailed costs (varying fuel costs, start-up and shut-down costs, etc.).
Figure 10 – Plant flows diagram, unit characteristics, and demand levels within Artelys Crystal Industry

2.2.2.2 Powerful time-dependent optimization and simulation engine
Artelys Crystal Industry integrates a powerful and versatile optimization and simulation engine that
can easily generate production plans. It can be used in three different modes as detailed in the
following sections.
2.2.2.2.1 Historical replay
Artelys Crystal Industry has been tailored to handle and make optimal use of historical data. First, it is
possible to import easily historical production data. This grants the user the ability to visualize and
analyze past production strategies using all the standard data views of Artelys Crystal Industry.
Furthermore, it embeds an historical replay simulation mode that reconciles historical production
measures with the model of the utility plant under study (i.e. satisfying material balances, unit yields,
etc.) and generates partially missing data. It is also used to detect data inconsistencies and eliminate
or smooth measurement errors, as well as to validate the plant modeling by highlighting situations in
which historical production cannot be reproduced by the model itself.
Finally, it provides a reference production plan to be compared against optimized or custom generated
production plans.
This generic features can be applied to any plant model designed in Artelys Crystal Industry and only
requires the user to provide measurement data to run the replay.
Figure 11. Comparison of reconciled and measured productions
2.2.2.2.2 Optimization
The optimization engine of Artelys Crystal Industry produces detailed least-cost production plans over
a configurable time period (typically one year) using a configurable time granularity (e.g. one hour),

and for all assets of the plant. It uses multi-core architectures to handle stochastic parameters (through
scenario variations).
The comparison of optimized production strategies with historical replay can be used to highlight the
potential financial and environmental savings, as well as the sources of improvement.
2.2.2.2.3 Custom strategy simulation
Artelys Crystal Industry also allows user to define their own operational strategies for planning
computations. For example, this mode can be used to simulate:
- Price/spread threshold based strategies (activation of certain assets depending on external
price signals);
- Merit order policies (prioritizing between units depending on their respective efficiency);
- Strategies based on monthly budget of CO2 emissions, combustible usage, or unit activation
time in order to remain below annual limitations.
This particular simulation mode relies heavily on Artelys Crystal Industry’s optimization engine which
mean that the strategies to be simulated may only apply to certain aspects of the production, while
the rest of the plant remains optimized fully.
Using this features, plant decision-makers are able to select the best balance between operability and
efficiency.
2.2.2.3 Multi-context study workflow view
Artelys Crystal Industry contains a study workflow view which is the entry point for any actions on the
interface. It is used to gather and summarize all information corresponding to the various simulation
runs configured for the purpose of the study.
Figure 12 – Study workflow view. Visualization of the multiple simulation runs performed in a Crystal Industry study.

It is designed as a matrix view which allows to quickly visualize and organize many different
simulations, of different types (e.g. historical replay, optimization, custom strategies, asset portfolio
variations, etc.), simulated on different time periods (e.g. past or future periods, seasonal periods,
etc.).
Additionally, it is possible to compare results of multiple simulation contexts directly from within this
view, thus reducing analysis times.
Upon opening a context from this study workflow view, a standard Crystal Platform context view is
opened to let users edit the information stored in their contexts.
Figure 13 – Single context context view.
2.2.2.4 Highly configurable and user-friendly data views
Artelys Crystal Industry provides many advanced visualization tools for detailed and global analysis of
simulation input data and results. It enables thorough comprehension of all operational, financial, and
environmental aspects of the management strategies studied with the tool.
It provides custom production indicators such as supply cost over time, start-up count, fuel cost for a
specific unit, annual CO2 emissions, etc. A basic set of indicators are provided but the user may defined
his own indicator with no limitations.
All production indicators can be viewed through multiple type of views (time series view, bar chart, pie
chart, cumulative view, radar chart, etc.) using highly configurable view controls: data filters, time
filters, data colorings, design of the data view, synchronization of filters across all views, etc. The views
provided allow performing more detailed and faster analysis than any other available data visualization
tool.

Additionally, using simulation comparison views, it is straightforward to perform detailed comparison
of multiple management strategies and assess the economic and environmental impact of different
guidelines through various quantitative evaluations (CAPEX, OPEX, emissions, maintenance costs, risk
exposure, etc.). Assessment and comparison of investment scenario impacts are equally
straightforward.
Figure 14 - Gas turbine electricity production comparison view. Comparison of electricity production in multiple contexts, in particular measured historical production (red) and reconciled historical production (pink).
Figure 15 - Electricity production of two different assets obtained by applying

3 Use cases and impacts
This paragraph describes the three applications experimented during CitInES project (experimentation
of Crystal City in Cesena and Bologna, and experimentation of Crystal Industry for Tupras oil refinery)
and presents additional use cases.
3.1 Crystal City Cities which have signed the Covenant of Mayors must implement and follow a Sustainable Energy
Action Plan. Given the diversity of involved services, local authorities need tools and training to support
their decisions, have an overall view of the energy stakes and rationalize their SEAP management
process.
Municipality technicians need support in their understanding of the local energy system, in order to
reduce the risks of planning actions unsuitable for local reality and to ensure a smart update of the
SEAP when necessary. Either big or small, every municipality is faced with the difficulties of managing
such a long and demanding process and wishes to avoid excessive time and money expenditures.
The involvement of diverse stakeholders around SEAP and more globally about the issues linked to
energy, is another issue cities need to tackle.
3.1.1 Application to Cesena
Expectations and context
The main expectations for Cesena were to:
- consolidate the current SEAP of Cesena, by helping technicians to define new actions fully
adapted to the local context;
- improve the monitoring process for all actions of the SEAP;
- reinforce interdisciplinary work between the services of Cesena;
- build support from citizens.
The municipality of Cesena has joined the Covenant of Mayors in 2009, and its SEAP was officially
approved in 2011. The SEAP was built by the Environmental Department of the Municipality of Cesena,
with the support of two external consulting companies. The Environmental Department is responsible
for all phases planning, implementation and monitoring of the SEAP. They are supported in this task
by ENERGIE PER LA CITTA (the consulting company for energy services of the municipality).
Reinforcing the SEAP monitoring process and facilitating the interdisciplinary work between the
municipality’s services are the key expectations of Cesena.
The department of Protection of the Environment and Territory of the Municipality of CESENA,
together with ENERGIE PER LA CITTA and ERVET, have conducted an analysis of the context (the local
energy policy, the organizational framework, short-term plan and reference energy strategy, long-term

energy vision) to determine actors, decision making processes, user needs and tools. With a technical
working group, especially set up for this, the municipality has collected data from all their suppliers
and partners, HERA and ENEL in particular. The database has been filled with all available data, such
as consumption, technical and renewable potential ones:
- Characterization of the energy demand (types of housing, density, large consumers, transport,
aggregated load profiles-time series)
- Scenarios of local demand evolution (urban development, transportation…)
- Description of local energy production facilities and distribution networks
- Opportunities for energy generation from renewable energy source
- Tariffs and price structure of the national energy supply
- Description of available energy action plans (Sustainable Energy Action Plans -SEAP- for
European Covenant of Mayors signatories)
Experimentation
The first aim of the experimentation was to test and assess the Crystal City tool regarding the
previously identified expectations of the municipality of Cesena. It was also expected to bring
immediate added value to Cesena through a configured and directly usable software, as well as a
methodology regarding the assessment of the territory energy state and energy strategies up to 2020.
Finally, the experimentation aimed at measuring specifically what were the benefits for the city in
terms of CO2 emissions and increase in involvement of stakeholders, in order to estimate what the
replication to other cities could bring.
The experimentation took place in two phases: the configuration allowed to adapt the tool to the data
and use case of Cesena, before its use was experimented by the city.
The configuration of the tool, lead from June to October 2013, consisted in:
- Data collection on the energy state of the city in 2010 and 2012. The collected details related
to diverse dimensions of the energy system: macroeconomic factors; energy grids, production
and demand; geographical distribution of consumers, etc.
- Data collection on the characteristics of the city energy strategy plan (SEAP) and the actions
composing it
- Specification of a set of indicators useful to assess its impacts.
- Implementation of this data, actions models and indicators into the software
At the end of this phase, the configured software delivered to Cesena contained:
- A picture of the energy system in 2010, base year for the work lead during the
experimentation,
- A picture of the energy system in 2012, most recent complete year of which data could be
collected,
- A complete set of models of the SEAP actions of Cesena,
- The SEAP scenario built from energy actions,
- Indicators to assess these three energy states (2010, 2012, SEAP) and actions effectiveness.
The experimentation was led by Cesena, with the support of the consortium partners, and concluded
during a final workshop at the end of February 2014.
It consisted in:
- A monitoring phase during which action advancement data was collected and used to model
and assess the situation in 2012 according to SEAP advancement. The situation was then
projected in 2020 assuming a linear progression of actions implementation. This projection
gives an estimate of where the city would have stand in 2020 if no monitoring and updating of
the SEAP had been done.
- A SEAP update work. Actions effectiveness was analyzed based on the cost of the ton of CO2
emission avoided and an alternative 2020 scenario was elaborated. The alternative scenario
was based on the municipality’s knowledge of the territory, and therefore more adapted to
the local context. It was also selected to decrease the global costs of SEAP actions in order to
facilitate their implementation.
- A communication phase during which Cesena elaborated communication material regarding
the current energy state of the city and energy actions, aimed at citizens.
Another important outcome of the experimentation was the involvement of stakeholders in particular
the Multi-utilities that manage data for electricity and gas in the area (ENEL and HERA) and that have
been involved in the data collection for setting the tool and decision-makers (politicians). The results
of the tool were presented to Dr. Lia Montalti, the Councillor for the Environment, European Project
and the Energy Policies of the Municipality of Cesena that concluded that “the software is indeed very
effective to translate technical issues into graphs to show to the decision-makers”. An interview with
Dr. Gianni Gregorio, Project manager of CitInES and Executive of the Environment Sector was also
carried out. Furthermore, the study case of Municipality of Cesena was presented in the REAL CORP
Conference5 under the topic “Clever solutions for Smart Cities” to highlight CitInEs project to the rest
the community on Smart Cities.
The experimentation phase enabled the Municipality of Cesena to improve its ability to harness the
challenge of the SEAP’s implementation through an increase in its analysis capacity regarding the
energy situation of the territory as well as the relevance of actions for the local context.
“During the experimentation, we could see the SEAP in a different light.”
5 N. Pardo, R. Aron, C. Bénévent, S. Burioli, S. Morigi, “CitInEs Projec – Tool for the Sustainable Energy Action Plan for Cities”, REAL CORP 2014, Vienna Austria, May 2014

“The software is quite simple to read and the model is really detailed”
Thanks to the experimentation, the Municipality has concretely appraised the viability and the efficacy
of the SEAP.
The experimentation enabled to: analyze individual actions to evaluate their effectiveness in terms of
reduction of CO2 and in terms of cost-effectiveness; update Cesena’s SEAP and build an
alternative SEAP scenario closer to reality; investigate how to monitor the progress of the actions in
the future.
“The software did help us to understand where we stand compared to where we should be regarding
the SEAP advancement.”
3.1.2 Application to Bologna
Expectations and context
The main expectations for Bologna were:
- Use an advanced decision-support tool to implement and update the already in place SEAP
process.
- Improve their ability to represent their energy system for a deeper understanding of the
impact of actions as well as for dissemination purposes.
- Automatize the treatment of the numerous databases of bologna related to energy subjects
The City of Bologna signed the Covenant of Mayors in December 2008. The first version of the SEAP
was released in May 2012. A dedicated working group for the SEAP design was established involving
11 sectors and “Environment and Energy” handled a coordination role.
Based on a 2005 picture of the energy situation of the territory, an exhaustive list of actions already
implemented or to be implemented up to 2020 has been established. A very thorough monitoring
process, based on excel files, has been defined. The Environment and Energy sector of Bologna is
supported by Ervet and an external consulting company in the whole SEAP elaboration and monitoring
work.
Ensuring the maintenance of the energy database and of the SEAP process through time is the key
expectation of Bologna.
Experimentation
The first aim of the experimentation was to test and assess the Crystal City tool regarding the
previously identified expectations of the municipality of Bologna. This tool was expected to reduce the
risks and complexity of SEAP management by helping the city to improve and update its ongoing
process and to treat collected data for the assessment of the energy state of the territory.
The experimentation took place in three phases: the configuration allowed to adapt the tool to the
data and methodology of Bologna, before its use was experimented by the city.

The configuration of the tool, lead from June to December, consisted in:
- The configuration of a first model of the city energy system consisting in a snapshot of the
city’s situation in 2010, based on data provided by Bologna.
- The configuration of a second model more adapted to the modeling methodology used in the
current tools of SEAP design and monitoring. The new context consisted in a snapshot of the
city’s situation in 2005 and 2009, basis years for the SEAP, and a set of implemented energy
actions following the same methodology as the one of the city.
A first treatment of taxes data to provide information regarding energy balance was also
experimented.
The methodology used to follow the SEAP and the city energy balance was thus integrated into the
software to build a complete model of the energy state and SEAP process. Specific indicators to assess
the current situation, the advancement and impacts of the SEAP actions were also integrated.
Figure 16: Map view of the city of Bologna in the tool, representation on consumption, production and transportation
The last phase of experimentation, covering the main aspects of Bologna’s SEAP management process,
allowed to test the tool and city energy model through the monitoring of effective SEAP advancement
and CO2 assessment, the update of SEAP and energy balance and the experimentation of
communications features.
This last phase was mainly lead through a workshop during which Bologna confirmed the interest of
the Crystal City software as an advanced decision support software to:
- Improve cities trajectory up to 2020 by increasing their ability to fully master the stakes and
implementation of the SEAP.
- Improve SEAP process efficiency by rationalizing SEAP process, thus making it more
comfortable to lead.
- Increase the involvement of stakeholders through didactic representations of the local energy
system and of the actions.
“The model is very good regarding consumption, production and supply modeling. Compared to our
previous SEAP management process, the tool eases the organization of the data modeling [and]
actions.”
“The software is a good support to create “standard template” for exchange between services.”
“The tool improves our analysis capacity: it is very interesting to be able to see whether the effect of
the actions is as expected [and] to be able to have an idea of the evolution of the city (new buildings,
new consumers,…).”
The experimentation lead in Bologna proved the simplification of the SEAP management process
brought by the tool built in the CitInES project through the three benefits mentioned above. Crystal
City has the potential to make SEAP management more comfortable to lead, therefore reducing the
risks linked to this long lasting and demanding process. However, converting this risk reduction into a
quantitative estimation of CO2 emission savings is not direct.
3.1.3 Key benefits
Key benefits of Crystal City for SEAP management are:
Better evaluation of the city energy stakes
Easier interaction between services
Time saving for public reporting
Easier dialogue with private energy stakeholders
Strengthening support from citizens
Better monitoring through relevant indicators
Identification of new ways for a sustainable development
More globally, reduce the complexity of SEAP management
3.1.4 Other relevant use cases
Dissemination actions of CitInES results throughout Europe allowed the consortium to identify four
main use cases, which are presented below.
3.1.4.1 Crystal City for reducing SEAP management complexity
3000 cities have signed the Covenant of Mayors and 600 are now implementing their Sustainable
Energy Action Plan (SEAP). The methodology proposed by the Covenant of Mayor to set up and monitor
a SEAP is based on the following principles:

Involvement of all stakeholders (different municipality departments, elected representatives,
private stakeholders and citizens) through an interactive process.
Coordination of the SEAP by the Energy/Environment department. It is recommended to use
interns (Masters) for Baseline Emission Inventory and action monitoring.
Final energy consumption data collection for buildings, facilities & transportation (similar as
data collected for Bologna & Cesena within Citines)
Annual consumption data only, with mean CO2 content for electricity supply and district
heating (independently of energy usages)
Data model stored in Excel files
Evaluation of impacts based on best practices rather than cost/benefits analysis
Much flexibility in terms of BEI perimeter and actions impact evaluation methodology
Monitoring of BEI and action advancement every year (as much as possible)
This methodology main advantage is to simplify the process as much as possible, so that small or
medium size cities become able to implement their SEAP.
The process developed within Citines for Bologna & Cesena implements SEAP methodology, with
following additional functionalities:
Energy model: Crystal City defines a robust energy model with user-friendly functionalities to
import data, visualize and update the model. This guarantees that efforts realized to set up
the BEI will be perennial.
Monitoring action: Crystal City allows advanced users to define action monitoring
methodology (through the definition of indicators and the configuration of the methodology
to assess action impacts based on these indicators), so that other users can update action
advancement and assess the SEAP impacts based on this methodology.
Decision support: a database of actions with corresponding mean costs and impacts is
provided with Crystal City for what-if scenario analysis. This database is driven from reviews of
literature and other city experiences.
Communication: dashboards, comparison views, GIS visualization and web publishing
functionalities have been developed to facilitate the collaboration between services and the
presentation of the results to elected representative and city stakeholders.
3.1.4.2 Crystal City for the new generation of energy planning
The main advantage of the Covenant of Mayor methodology is its simplicity of implementation.
However, the drawback is that the evaluation of action impacts is rather qualitative (comparison with
best practices) and does not tell the whole story:
Annual consumption data & mean CO2 content approach are insufficient for a robust evaluation of
action impacts

According to the French Energy Agency, the CO2 content of electrical heating (180gCO2/kWh)
is five times higher than for a baseload usage (40gCO2/kWh).
Assessing new district heating costs requires to assess heating peak load, to size peak
generation, along with network pipes. Peak load is hard to assess without load profiles.
The development of load shifting and short term energy storage solutions requires
representing the intraday shape of the load in order to reach an assessment of their benefits.
The high penetration of intermittent electricity production, in some countries such as
Denmark, increases the interest of such solutions.
Network constraint modelling is often necessary
Network costs represent often a significant part of the budget for new energy infrastructure
(for instance, the cost for a 40MVA HV/MV substation is 2 to 10 M€ and district heating
network costs represent the main part of project cost for district heating)
The arbitration between gas, electricity and district heating for heating usages requires to take
into account existing network constraints and opportunities.
Taking into account the dynamic management of energy systems is key to assess the benefits of smart
grids technologies
Some equipment, like hybrid boilers (which can use either electricity or gas, depending on local
temperature or network state) can use different energy depending on current energy prices
and/or network states
Smart electrical vehicle charging is critical to limit energy supply costs and network
reinforcement linked to EV integration.
The arbitration between the different flexibility options (energy storage, demand response,
flexible generation…) requires advanced simulations.
Energy infrastructure decisions engage local authorities for tens of years and requires to run what-if
scenarios
Energy transition requires to shift from a OPEX to a CAPEX paradigm (from fuel costs to
renewable CAPEX costs)
Energy and CO2 low prices today do not encourage energy efficiency, but today decisions
define the city situation for 2020, with a context of increasing fuel prices.
Limiting city financial dependency to fuel prices will be key to control citizen energy bill
Thanks to modelling work realised in CitInES project, functionalities were integrated within Crystal City
to run quantitative cost/benefit analysis taking into account all previous points.
With the energy transition, large cities get the assignment to design the local energy strategy. In France
for instance, metropolis get increasing responsibility for the coordination of local energy actions. They
consequently need advanced decision support to arbitrate between new investments (e.g. gas heating
versus district heating, electrical transformer reinforcement versus improve local energy efficiency…)
and quantitative elements for negotiation with private companies (DSO, energy & equipment

providers…). As they are in charge of transport & urban planning, they are also eager to assess the
impact of new plans (electrical vehicle integration, new urban plans …) in terms of energy costs and
network reinforcement requirements.
Crystal City is particularly adapted for this use case.
3.1.4.3 Crystal City for the coordination of local energy policies
As they provide grants for implementing environmental projects, regional, national & supranational
authorities are willing to evaluate and control subsided project impacts. This is the case for instance in
Portugal & Denmark with local energy agencies, in France with regions and in Europe with the
European Commission.
The flexible methodology proposed by the Covenant of Mayor does not allow higher level decision-
makers to follow SEAP impacts and compare different situations. The methodology, data model and
data format are not homogeneous and large Excel files cannot be audited easily.
Within Citines, a coherent methodology has been developed to enable direct comparison between
projects (multi-sector, multi-energy but also between different cities). Moreover, the data base and
developed functionalities to analyze & compare projects make it easier for external entities to audit
and use the energy model. However, multi-user functionalities remain to be developed.
The typical use of Crystal City would be:
Primary work initiated by the supra authority in order to implement Crystal City energy model
within cities of its territory at a minimum price
Interaction with each city to build the energy model (based on approach described in §3.1.1)
Audit of the energy model by an independent authority
Exchange of aggregated data & results between cities and the supra authority
3.1.4.4 Dedicating Crystal City to energy performance contracts
One of cities main difficulty for the energy transition is collecting funds for investments: even if most
investments are profitable through energy savings in the long run, it is difficult for small or medium-
size cities to integrate these investments within their budget.
That is why energy performance contract appears to be a promising solution. The equipment vendor
or entrepreneur contractualizes with the local authority to guarantee levels of energy savings. That
allows the local authority to get interesting loans from banks as financial risks are limited. Schneider
Electric, for instance, is the first equipment vendor in France to have set up such an energy
performance contract with a city: http://www.schneider-electric.fr/documents/solutions-ts/energie-
infrastructures/SE_FicheDomen_051112.pdf
Offering such contracts requires to have robust estimation of energy action impacts. In particular,
following functionalities of Crystal City are well adapted for that:
Evaluation of local energy consumption by usage to assess impacts of specific energy efficiency
measures
Evaluation of combined impacts of actions portfolio: combining local energy production,
storage and energy efficiency can generate interesting opportunities

Financial risk assessment: what would be the cost to purchase energy if energy savings
requirements are not respected?
3.1.5 Synthesis
Use case SEAP monitoring New generation of energy planning
Coordination of local energy policies
Objectives Set up and monitor SEAP
Communication between technical services, with city representatives and citizens
Decision support for new investments
Quantitative elements for negotiation with private companies (DSO, energy & equipment providers…)
Simplify communication between cities and higher level authorities (regional, national or European) to control subsidy use and share best practices
Common expectations
Multi-energy multi-sector modelling (energy consumption & generation)
Public building explicit modelling
Integration of local energy studies within a global model for better long term vision
Expectations Default database
User friendly HMI
Advanced cost/benefit analysis
Power network constraints modelling
Prospective what-if scenarios
Interoperable data model
Open & reliable impact evaluation process
Multi-user functionalities
Local data needs
Building block description
Local generation data
Final energy yearly consumption
Transportation
Building block description
Local generation data
End-use energy consumption per usage & load profiles
Main energy networks characteristics
Transportation
Scenarios of city evolution (population, industries…)
Building block description
Local generation data
Final energy yearly consumption
Transportation
3.1.6 Impacts
The CO2 emissions gained in the case of Cesena is estimated at 45 000 tons of CO2 saved per years.
The methodology used to assess this impact on the case of Cesena is based both on:
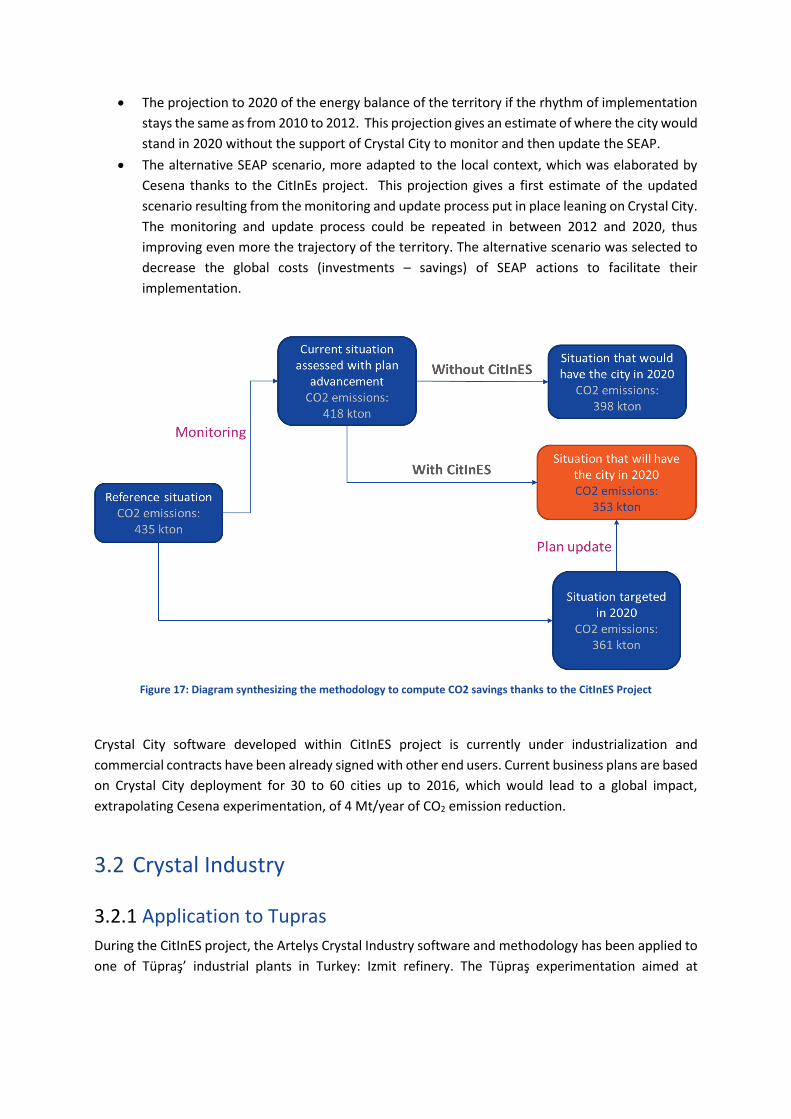
The projection to 2020 of the energy balance of the territory if the rhythm of implementation
stays the same as from 2010 to 2012. This projection gives an estimate of where the city would
stand in 2020 without the support of Crystal City to monitor and then update the SEAP.
The alternative SEAP scenario, more adapted to the local context, which was elaborated by
Cesena thanks to the CitInEs project. This projection gives a first estimate of the updated
scenario resulting from the monitoring and update process put in place leaning on Crystal City.
The monitoring and update process could be repeated in between 2012 and 2020, thus
improving even more the trajectory of the territory. The alternative scenario was selected to
decrease the global costs (investments – savings) of SEAP actions to facilitate their
implementation.
Figure 17: Diagram synthesizing the methodology to compute CO2 savings thanks to the CitInES Project
Crystal City software developed within CitInES project is currently under industrialization and
commercial contracts have been already signed with other end users. Current business plans are based
on Crystal City deployment for 30 to 60 cities up to 2016, which would lead to a global impact,
extrapolating Cesena experimentation, of 4 Mt/year of CO2 emission reduction.
3.2 Crystal Industry
3.2.1 Application to Tupras
During the CitInES project, the Artelys Crystal Industry software and methodology has been applied to
one of Tüpraş’ industrial plants in Turkey: Izmit refinery. The Tüpraş experimentation aimed at

improving the energy efficiency and reducing the environmental impact of the Izmit refinery, which
has a design processing capacity of 11 million tons of crude oil.
The Izmit refinery’s power systems produce electricity and steam (with four different types of pressure
levels) to provide utilities to the refining hydrocarbon treatment processes. With the recent connection
to the Turkish electricity grid, the refinery now has the opportunity to purchase and sell electricity from
and to the grid.
3.2.1.1 Methodology
The general methodology of the Tüpraş experimentation was composed of five main phases:
Knowledge and data transfer from Tüpraş to Artelys
o Workshop organized between Artelys and Tüpraş experts
o Description of the detailed characteristics of the energy assets
Calibration of asset models based on historical data
o Generation of a formal representation of the asset physical behavior and operational
constraints
Replay of historical strategy (data reconciliation)
o Generation of a modified historical management strategy that is consistent with the
calibrated mathematical representation
o Generation of an evaluation of historical costs
Optimization of management strategies / asset portfolios
o Generation of optimized and practical management strategies
o Generation of an evaluation of the optimal costs
o Generation of KPIs of various investments plans
Field experimentation
o Implementation of the new strategies
o Evaluation of actual gains obtained with the new strategies
Artelys Crystal Industry has been used to model the large-scale utility system of Izmit refinery with
complex technical/operational constraints:

9 sources of energy: natural gas, refinery gas, fuel oil, electricity, water, LP steam, MP steam,
HP steam, VHP steam;
more than 10 different units including boilers, steam turbines, gas turbines, and letdown
stations;
1-year time horizon, with 1 hour granularity;
Use of linear and piecewise-linear yield models;
Minimum/maximum capacities (varying over time and depending on the type of fuel used);
Minimum/maximum duration in ON/OFF states;
Safety reserve constraints;
Various constraints on combustible mixes for boilers.
Figure 18 - Focus on Izmit refinery power plant
3.2.1.2 Preliminary study
A preliminary study of the Izmit utility plant was initially performed. It consisted in building the power
plant model within Artelys Crystal Industry, importing historical data collected from Tüpraş, and
running many simulations to determine:
The potential gains from better optimized production plans
The leverages used to improve the plan efficiency
The optimal bidding strategy against the day-ahead electricity market
Simulation results showed an approximate 7% decrease in cost and polluting emissions was achievable
with no need for expensive investment projects or use of the electricity grid markets. Such gains are
solely obtained by the design of new practical asset management strategies that remain very simple
to implement in the field. Further simulations showed that savings of the same order of magnitude
can be obtained thanks to interactions with the electricity markets.
From these initial findings, Artelys consultants’ have developed a first draft of practical management
guidelines to be communicated to Tüpraş. These guidelines have been designed in order to capture
the most important sources of optimization in a form that can understood by the refinery operators in
charge of the utility control system. This lead to the creation of two production and bidding guidelines
under the form of Excel spreadsheets.

3.2.1.3 Design of management strategies
3.2.1.3.1 Bidding guideline
The bidding guideline was designed to help Tüpraş make bids on the Turkish day-ahead electricity. This
day-ahead bidding guideline is based on multiple inputs provided by the user. These include:
Fixed risk margins
o Bid price margin (Currency/MWh)
o Bid quantity margin (tons)
Fixed costs
o Natural gas cost (Currency/ton)
o Water cost (Currency/ton)
Fixed unit capacities
o Such capacities may change over time due to maintenance operations (for example)
Forecasted refinery demands, hourly and over one day for
o Electricity
o HP, MP, and LP steam
The forecast of the internal demand is the most critical input of the guideline. Indeed, if the refinery
bids too much sell capacity, and if the local demand happens to be too large, it may not possible to
satisfy both demands and the refinery will not meet its market engagements.
The main output of the bidding guideline is a bidding plan for the next day, which gives for each hours
of the day, the SELL or BUY bid quantity as well as the associated price bid. The bidding guidelines for
Izmit refinery integrates both BUY and SELL bids, and the user may apply certain margins on bid price
and quantities in order to account for the internal risk policy.
To use the spreadsheet, the bidding manager will each morning before noon:
- Update the refinery demand prevision for the next day and potentially update other bidding
parameters;
- Place the bids on the market.
At the end of the day, he will inform the operations manager whether the bids have been accepted
and will present a supply/delivery schedule for the electricity grid. This supply/delivery schedule shall
be reflected in the utility demand for the next day.
3.2.1.3.2 Production guideline
The production rules are too complex to be computed using formula or decision trees, but the decision
process can be represented from a given starting point taking into account the state of the system
(meaning which assets are running or not). From this starting point, he can use the guidelines to decide
on the changes to operate in response to demand variation.
The production guideline contains the following elements:
A set of refinery states
o For Izmit’s utility plants, 12 separate production states have identified
For each state,
o the list of active units:

for example: run 3 VHP boilers, 2 HP boilers, the gas turbine and 3 steam
turbines
o the list of min/max targets to be achieved within the state
for example: run the gas turbine at max capacity
o the list of control points
for example: use HP steam production from a HP boiler to control/follow the
refinery demand in HP steam (increase production if demand increases,
decrease production if demand decreases)
The possible transition between states
o Transitions are used by the refinery operators to cope with potential events that will
cause a change of production state
for example: the HP boiler control the HP steam demand reaches its maximum
capacity as it cannot control the demand, the refinery need to transit to a
new predetermined production state
The following figure shows an example of a production guideline state with neighboring states.
Figure 19. Production states and transitions
The production guideline has been implemented in an Excel spreadsheet which is used at all times to
monitor the refinery situation. The operators consider the specific worksheet corresponding to the
current operation state and consider the changes suggested when a given physical limitation is reached
due to a change in demands.
After executing the required operation modifications (change of controlling asset, putting an asset to
max or min production, starting up a new equipment, etc.), the operator can switch to the worksheet
corresponding to the new state and continue operations of the plant based on the worksheet control
guidelines.
3.2.1.4 Experimentation and evaluation of impacts
The proposed bidding and production guidelines were implemented by Izmit refinery from November
2013 to March 2014. The production data from this period was collected and used to evaluate actual
gains compared to previous production periods, during which the guidelines were not been used.
This showed that the refinery achieved roughly 4% of cost and CO2 emission savings using the
production guideline only. The study of the use of electricity markets and bidding guideline
demonstrated that an additional 2.2% reduction in the refinery energy supply costs was achieved.
Overall, the experimentation showed that it was possible at least half of the potential savings
demonstrated by the optimized production plans, for a total 6.2% in overall cost reduction.

Finally, a qualitative impact for the refinery is that it now has a defined strategy for using electricity
markets and benefiting from their recent connection to the Turkish grid.
3.2.2 Key benefits
Artelys Crystal Industry can be used in a wide range of industries such as oil & gas, metals & minerals,
mining, chemicals, paper, glass, cement, etc. It enables plant decision-makers to obtain the following
benefits:
Reduction of energy supply costs and environmental impact with accurate operational
planning
o Design of robust operational management policies to decreasing utility costs without
investment
o Evaluation of the flexibility of the current industrial system on energy markets
o Easy comparison of financial and environmental impacts of various management
strategies such as:
Price/spread threshold strategies
Merit order policies
Strategies based on pre-determined annual budgets of combustible usage,
CO2 emission, operating time per unit, etc.
Creation of adaptive strategies and improvement of returns on investment
o Design new strategies adapting to changes in regulation or economic environment
Utility prices variations
New emissions constraints
Capacity markets
o Computation of the accurate profitability and environmental impacts of investment
projects
New assets: traditional, cogeneration, storage, renewables, etc.
Connection to new sources of supply or sales: markets, bilateral contracts, use
of external steam provider, connection to urban heating network, etc.
Revamping of current assets: increase of capacity or efficiency, ability to
produce/consume new energies, etc.
In addition to such quantitative benefits, Artelys Crystal Industry can also help an organization
centralizing their data and plant models, as well as integrating a single versatile software solution to
support a wide range of tasks (contract valuation, operations management, long-term planning, etc.).
3.2.3 Other relevant use cases
3.2.3.1 Crystal Industry for the oil & gas, chemical & paper industries
The oil & gas (refining and petro-chemicals in particular), chemical and paper industry are massive
consumers of energy. More precisely, they are characterized by the fact that they frequently produce
their own utilities internally, and have multi-energy needs (gas, electricity, steam, heat, etc.) due to
the complexity of their industrial processes. Nowadays, cogeneration, or even tri-generation, assets
are used to produce multiple energies more efficiently, and production assets are therefore becoming

more and more interdependent: utility production plans must now be constructed globally and not on
a per-asset basis.
The goal of determining optimal production strategies has therefore become cumbersome due to the
complexity of the plant. And the production planning tasks are often handled manually by human
operators, often in real-time, using inappropriate tools.
Artelys Crystal Industry shall provide the required functionality to simplify the process of producing
production plans for large utility plants in the chemical & paper industry that are cost-effective and
reduce polluting emissions. This can be done through the design and validation through detailed
simulations of new asset management strategies. In particular, the joint optimization of multiple
production assets with their respective dynamics and operational constraints is the most important
features for reaching the above-mentioned goal.
Additionally, Artelys Crystal Industry can be used within this industry to:
- Evaluate the interest of electricity grid connection and design bidding strategies.
Although the internal demand tends to be continuous and should not always be controlled by
utility prices, it is still possible to make arbitrages between the electricity grid and the internal
production to select the optimal source of energy depending on the plant situation.
- Evaluate impacts of investment project by verifying the synergy between current and new
production assets.
Given a utility plant configuration, the optimal investments to be made are not always
intuitive. Only detailed simulations can help verify that.
3.2.3.2 Crystal Industry for the mining, metals and minerals industries
The mining, metals and minerals industries (such as steel, cement, or glass) tend to have simpler, yet
still important, energy needs. Electricity or gas/coal are the primary sources of energy and are used for
heating purposes mostly (within furnaces), or rocks processing (for the mining industry). Therefore,
the energy supplies are mostly handled through long-term contracts of energy markets, rather than
internal production. However, the demand process tends to be more flexible, and for plants that are
lacking sales opportunities, due to highly competitive international contexts, it is sometimes very
profitable to make use of the industrial flexibility to decrease energy supply costs.
Although industrial plants may be able to decrease their energy costs using energy markets, they need
to modify their standard management practices, and incorporate market dynamics in their daily
operations. The objective is to benefit from low electricity during off-load hours and sell their unused
capacities during peak hours.
Similarly to optimizing the utility plant production, Artelys Crystal Industry can be used to optimize the
core process production with respect to price fluctuations. Furthermore, it can be used to (re-)evaluate
long-term / bilateral contracts with external energy providers to find the optimal trade-off between
risk and profitability, while taking into account accurately their production flexibility.
3.2.3.3 Crystal Industry for district heating and cooling
District heating and cooling are often handled jointly with electricity supply by companies with
decentralized plants. Cogeneration or tri-generation assets are used extensively in such production
plants which are intrinsically multi-energy. These plants tend to be similar to refinery’s utility plant,
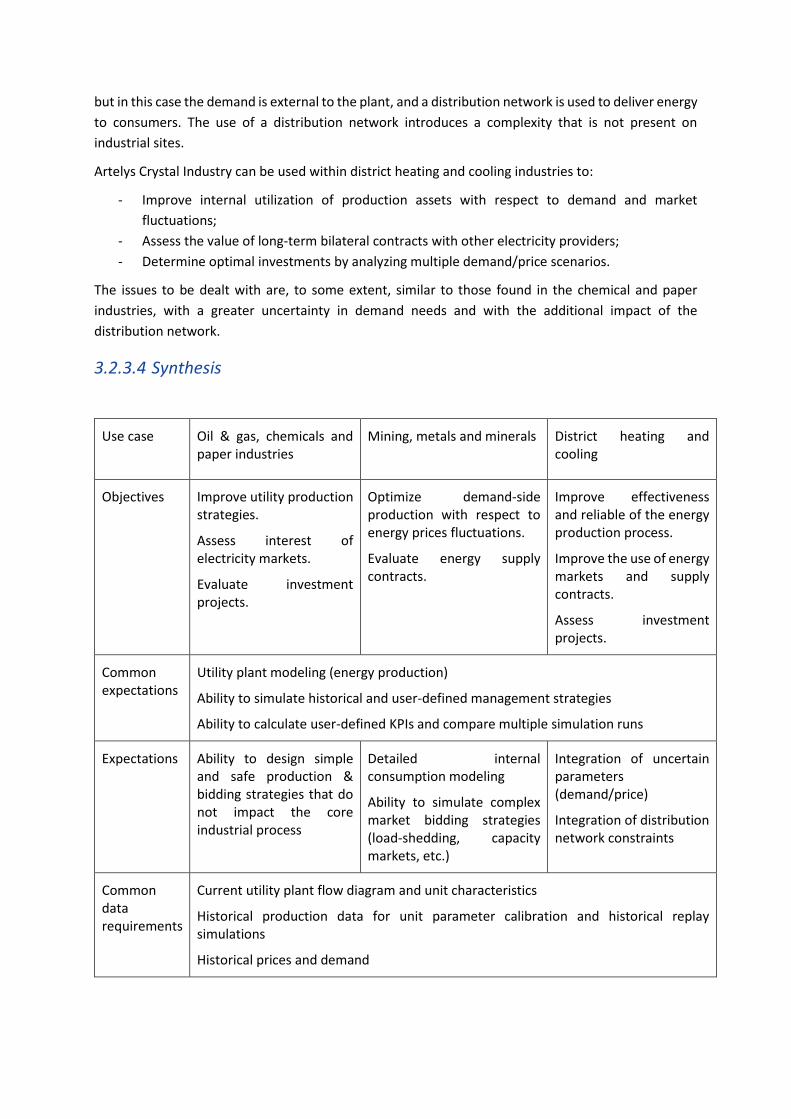
but in this case the demand is external to the plant, and a distribution network is used to deliver energy
to consumers. The use of a distribution network introduces a complexity that is not present on
industrial sites.
Artelys Crystal Industry can be used within district heating and cooling industries to:
- Improve internal utilization of production assets with respect to demand and market
fluctuations;
- Assess the value of long-term bilateral contracts with other electricity providers;
- Determine optimal investments by analyzing multiple demand/price scenarios.
The issues to be dealt with are, to some extent, similar to those found in the chemical and paper
industries, with a greater uncertainty in demand needs and with the additional impact of the
distribution network.
3.2.3.4 Synthesis
Use case Oil & gas, chemicals and paper industries
Mining, metals and minerals District heating and cooling
Objectives Improve utility production strategies.
Assess interest of electricity markets.
Evaluate investment projects.
Optimize demand-side production with respect to energy prices fluctuations.
Evaluate energy supply contracts.
Improve effectiveness and reliable of the energy production process.
Improve the use of energy markets and supply contracts.
Assess investment projects.
Common expectations
Utility plant modeling (energy production)
Ability to simulate historical and user-defined management strategies
Ability to calculate user-defined KPIs and compare multiple simulation runs
Expectations Ability to design simple and safe production & bidding strategies that do not impact the core industrial process
Detailed internal consumption modeling
Ability to simulate complex market bidding strategies (load-shedding, capacity markets, etc.)
Integration of uncertain parameters (demand/price)
Integration of distribution network constraints
Common data requirements
Current utility plant flow diagram and unit characteristics
Historical production data for unit parameter calibration and historical replay simulations
Historical prices and demand

Description of operational constraints (safety reserve constraints, operability requirements, etc.)
Data requirements
Internal demand loads (historical or forecasted)
Physical and operational characteristics of consumption assets
Historical data for uncertain parameters and endogenous parameters (temperature, sunlight, etc.)
3.2.4 Impacts
In the case of Tupras, the post-implementation simulation results show that the production guideline
has led to a 4% cost and CO2 emissions savings (explained by reduced combustible consumption)
without any additional investment, while the bidding guideline has led to an additional 2.2% cost
reduction. Using Turkish refineries mean CO2 emission data (Izmit refinery data cannot be published
for confidentiality reasons), the impact of CitInES project is 20-30kt of CO2 per year.
Crystal Industry software developed within CitInES project is currently under industrialization and
commercial contracts have been already signed with other end users. Current business plans are based
on Crystal Industry deployment for 12 industries per year in 2016, which would lead to a global impact
of 1 Mt/year of CO2 emission reduction and 3M€/year of energy savings.

4 Contacts
Web site: www.citines.com
For all questions on Citines project, contact mail: [email protected]
Partner main contacts:
Technical coordinator: Laurent Fournié, Artelys
Administrative coordinator: Caroline Dulaurent, Artelys
Cesena: Sofia Burioli
Bologna: Francesco Tutino
Tupras (administrative contact) : Funda Çetin
Tupras (technical contact) : Fırat Uzman
INESC: Nuno Fidalgo
Mines: Edi Assoumou
AIT: Nicolas Pardo Garcia
INRIA: Olivier Teytaud
ERVET: Guido Croce
Schneider Electric : Vincent Mazauric