cities in bad shape: urban geometry in india - igc · cities in bad shape: urban geometry in india...
TRANSCRIPT

Cities in Bad Shape: Urban Geometry in India
Mariflavia HarariDiscussant: Melanie Morten (Stanford)
May 21, 2015
Commuting around the world
Discussion Paper1 8 1 3 a
13
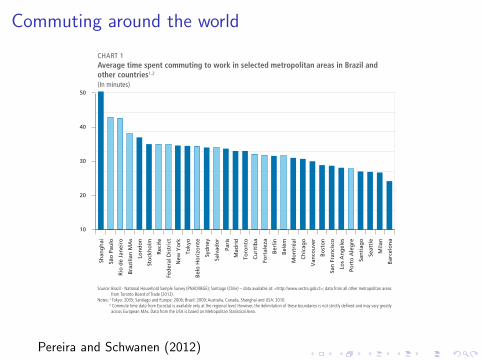
Commute Time in Brazil (1992-2009)
Chart 1 shows the average commute times (one-way trip) in Brazilian metropolitan areas plus the Federal District (FD) and compares them to other selected metropolitan areas around the world with over 2 million inhabitants. In general, commute times tend to be relatively long in Brazilian MAs, especially when their population size is taken into account.
CHART 1 Average time spent commuting to work in selected metropolitan areas in Brazil and other countries¹,²(In minutes)
10
20
30
40
50Sh
angh
ai
São
Paul
o
Rio
de J
anei
ro
Braz
ilian
MA
s
Lond
on
Stoc
khol
m
Reci
fe
Fede
ral D
istr
ict
New
Yor
k
Toky
o
Belo
Hor
izon
te
Sydn
ey
Salv
ador
Pari
s
Mad
rid
Toro
nto
Curi
tiba
Fort
alez
a
Berl
in
Belé
m
Mon
tréa
l
Chic
ago
Van
couv
er
Bost
on
San
Fran
cisc
o
Los
Ang
eles
Port
o A
legr
e
Sant
iago
Seat
tle
Mila
n
Barc
elon
a
Source: Brazil - National Household Sample Survey (PNAD/IBGE); Santiago (Chile) – data available at: <http://www.sectra.gob.cl>; data from all other metropolitan areas from Toronto Board of Trade (2012).
Notes: 1 Tokyo: 2005; Santiago and Europe: 2006; Brazil: 2009; Australia, Canada, Shanghai and USA: 2010.² Commute time data from Eurostat is available only at the regional level. However, the delimitation of these boundaries is not strictly defined and may vary greatly across European MAs. Data from the USA is based on Metropolitan Statistical Area.
5 COMPARING METROPOLITAN AREAS
In order to analyze how commute times have changed over the last two decades in Brazil, Chart 2 depicts the average time people spent commuting to work in the country and its largest metropolitan areas plus the Federal District (FD) between 1992 and 2009. Chart 2A draws attention to the stark differences between metropolitan areas (MAs) and non-metropolitan areas. In the year 2009, for instance, the average
Pereira and Schwanen (2012)

This paper
I Thinks about spatial equilibrium across cities
I Each city is a bundle of (homogenous):I WagesI AmenitiesI Rents
I Capture city size as an urban amenityI Commuting time
I Instrument for city size with Saiz (2010) -style instruments

Results consistent with city size being a negative amenity
I Predictions of model to a worsening in city shape, S (noagglomeration/congestion effects):
I Population decreases ( dNdS < 0) negative
I Wage indeterminate (depend on consumption/productionamenities) ( dw
dS ≥ / ≤ 0) positive
I Housing prices fall ( dpHdS < 0) negative, insig
I Suggestive evidence commuting mattersI Mitigated by road densityI Worsened by height restrictions
I Magnitude largeI 1 std dev. is 360 metres each way / 225km extra per yearI Implied cost is 5% of incomeI At walking speed, can get half way thereI Driving (including car costs): one quarter way there


Population density
Yellow high (30,000-150,000 people/sq. km)
http://www.urbanobservatory.org/


Commute times within a city differ
Discussion Paper1 8 1 3 a
19
Commute Time in Brazil (1992-2009)
CHART 5Commute time length among the 1st and 10th income deciles¹ – Brazilian metropolitan areas (2008-2009)²
5A – Average time lenght (In minutes)
5B – Share of commutes who travel to work for longer than one hour (one-way trip)(In %)
20 30 40 50
São Paulo
Rio de Janeiro
RMs
Distrito Federal
Belo Horizonte
Curitiba
Salvador
Fortaleza
Belém
Recife
Porto Alegre
0 10 20 30
São Paulo
Rio de Janeiro
MAs
Belo Horizonte
Federal District
Curitiba
Salvador
Fortaleza
Belém
Recife
Porto Alegre
Richest decile Average Poorest decile
Source: National Household Sample Survey (PNAD/IBGE).Notes:¹ Per-capita household income deciles.
² 2-year average.
Chart 5 also shows that this commute time gap between rich and poor is much larger in some metropolitan areas and almost non-existent in others. In Salvador, Recife Fortaleza and Belem, for instance, the commute time gap between rich and poor people is rather small despite the often markedly different capacities in terms of residential relocation and public transport dependence among the richest and poorest commuters. On the other hand, in the metropolitan areas of Belo Horizonte, Curitiba and in the Federal District journey-to-work trips are respectively 40%, 61% and 75% longer amongst the poorest decile compared to the richest one. From a research perspective, these observations reveal the need for future studies into the extent to which these commute time gaps between rich and poor can be explained as a result of spatial segregation and neighborhood accessibility in Brazilian MAs. Curitiba, for example, is a remarkable case that should be the object of further investigation. Despite Curitiba’s
Pereira and Schwanen (2012)

Is the most interesting variation across cities?
I Monocentric models capture the within-city rent gradientI e.g. Saiz (2010), allow for cost t for distance dI More general: Ahlfeldt et al. (2014)
I Yields housing supply equationI Derive average rent for the city based on the within-city rentI This will be a function of t, geo indicators.
I Are migrants getting the average housing?I Rent control- but further out?
I Should have rich within as well as across city predictions

Concluding thoughts
I City shape as an amenityI Affects commuting within the cityI Also possibly.... sanitation, electricity, trade
I Model focuses on between-city arbitrage, but should have richimplications for within-city
I Gradient of rent to commuting distanceI Can we benchmark these commuting costs with e.g. migration
costs between place?
I And: are developing countries different than developedcountries?
I Desmet et al. (2015) find income and population density lesscorrelated in low income places
I Other barriers to internal mobility/commuting within city

References
Ahlfeldt, G., Redding, S. J., Sturm, D., and Wolf, N. (2014). Theeconomics of density: Evidence from the Berlin Wall. pages1–45.
Desmet, K., Nagy, D. K., and Rossi-hansberg, E. (2015). TheGeography of Development : Evaluating Migration Restrictionsand Coastal Flooding. pages 1–54.
Pereira, R. H. M. and Schwanen, T. (2012). Commute Time inBrazil , 1992-2009 : Differences Between Metropolitan Areas ,By Income Levels and Gender. pages 1992–2009.
Saiz, A. (2010). The Geographic Determinants of Housing Supply.Quarterly Journal of Economics, 125(3):1253–1296.