cite track presentation
TRANSCRIPT
Correlation of ScholarlyNetworks and Social Networks
Amir Razmjou
Complex Networks CSE5656
Overview
• Motivation• Dataset• Network Definition• Time Window• Related Works• General Metrics and Observations• Case studies (in terms of micro-level to
community structures).• On coauthorship and “co-category” network.• Discussion

Introduction
• Our Motivation– Talking to Dr. Menezes about impact of social media on
citation networks.
• Conventional Metrics– Long time to accumulate– Available only in proprietary databases– Journal impact factor has been criticized for not being
transparent– Applicable to scientific community, not, for example,
impact on or dissemination among knowledge users, policy makers, patients, and the general public
– questionnaires applied to publications have been suggested to measure the “social impact factor”
Dataset
• Data Collection started on 9/7/2014.
• Used Search API instead of Stream API.
• Windows Azure
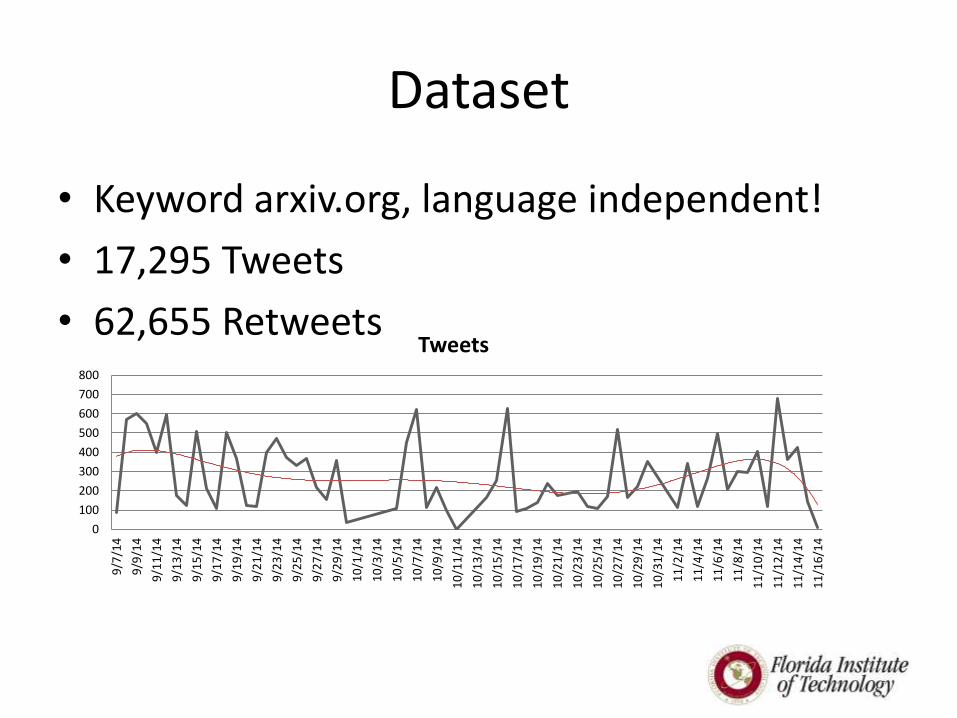
Dataset
• Keyword arxiv.org, language independent!
• 17,295 Tweets
• 62,655 Retweets
0
100
200
300
400
500
600
700
800
9/7
/14
9/9
/14
9/1
1/1
4
9/1
3/1
4
9/1
5/1
4
9/1
7/1
4
9/1
9/1
4
9/2
1/1
4
9/2
3/1
4
9/2
5/1
4
9/2
7/1
4
9/2
9/1
4
10
/1/1
4
10
/3/1
4
10
/5/1
4
10
/7/1
4
10
/9/1
4
10
/11
/14
10
/13
/14
10
/15
/14
10
/17
/14
10
/19
/14
10
/21
/14
10
/23
/14
10
/25
/14
10
/27
/14
10
/29
/14
10
/31
/14
11
/2/1
4
11
/4/1
4
11
/6/1
4
11
/8/1
4
11
/10
/14
11
/12
/14
11
/14
/14
11
/16
/14
Tweets
DatasetSearch API
• You can still collect the missing tweets after ~10 hours.
• Normalized data.
• Search API returns up to 100 tweets per search and allows 720 requests per hour giving us a max of 72,000 tweets per hour.
• Streaming API has maxed out at around 3,000 tweets a minute, delivers a maximum flow of 180,000 tweets per hour.
• 72,000 is ways larger since search doesn’t count retweets.
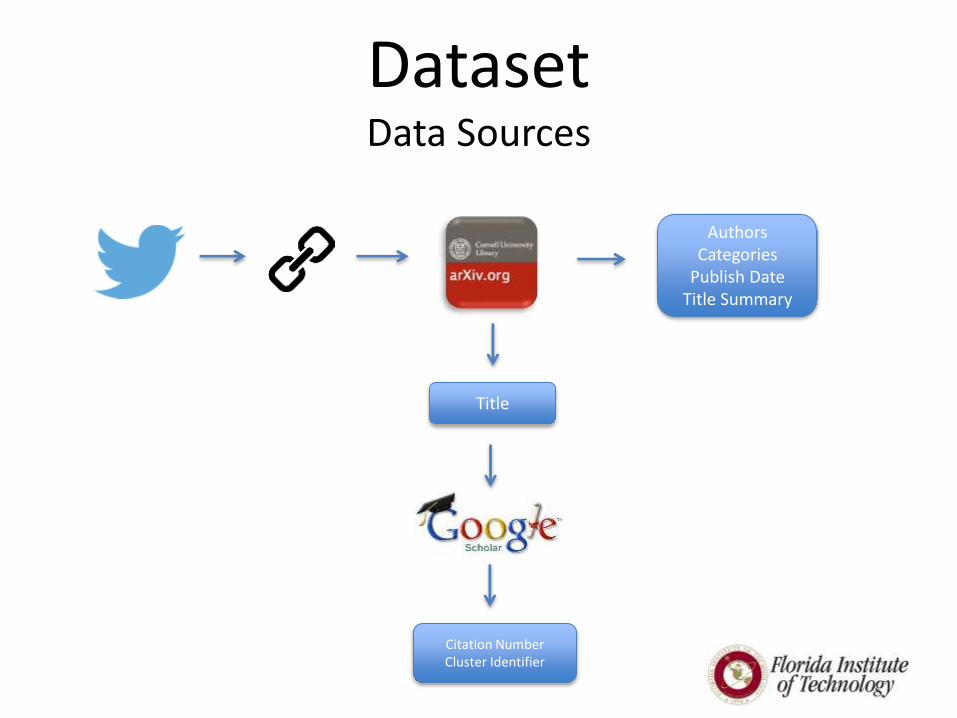
DatasetData Sources
AuthorsCategories
Publish DateTitle Summary
Title
Citation NumberCluster Identifier

DatasetChallenges
• Challenges: shortened URLS
– Some of URL shorteners redirect by http
– Some by JavaScript!!!
– Some expanded by Tweeter.
• Bots
• Google Scholar, Rate Limit
• No language dependency
Network Definition
Network Definition
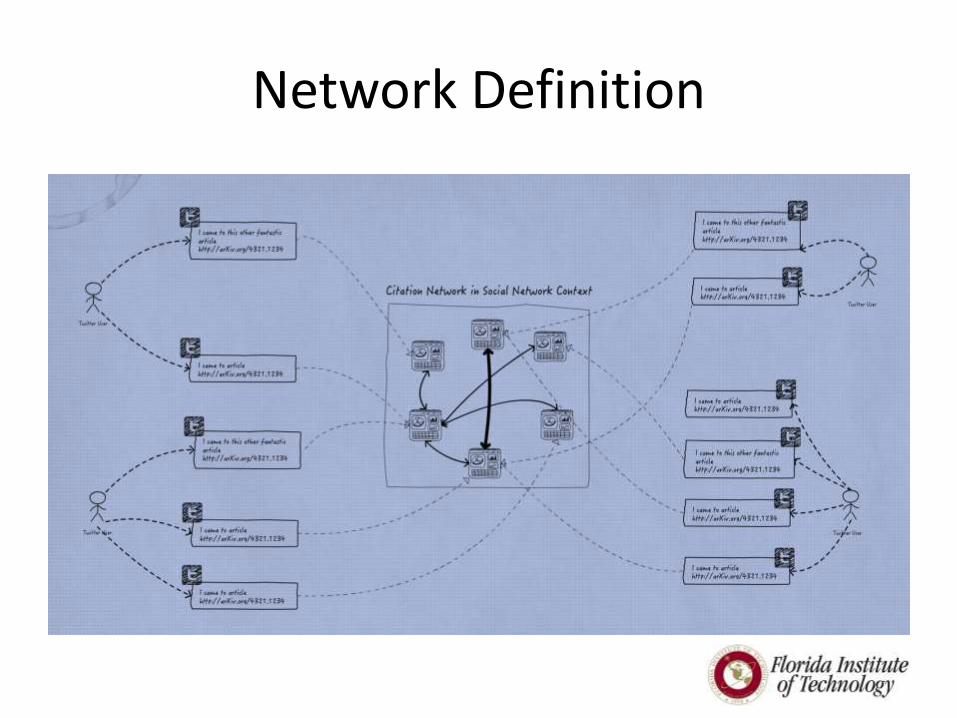
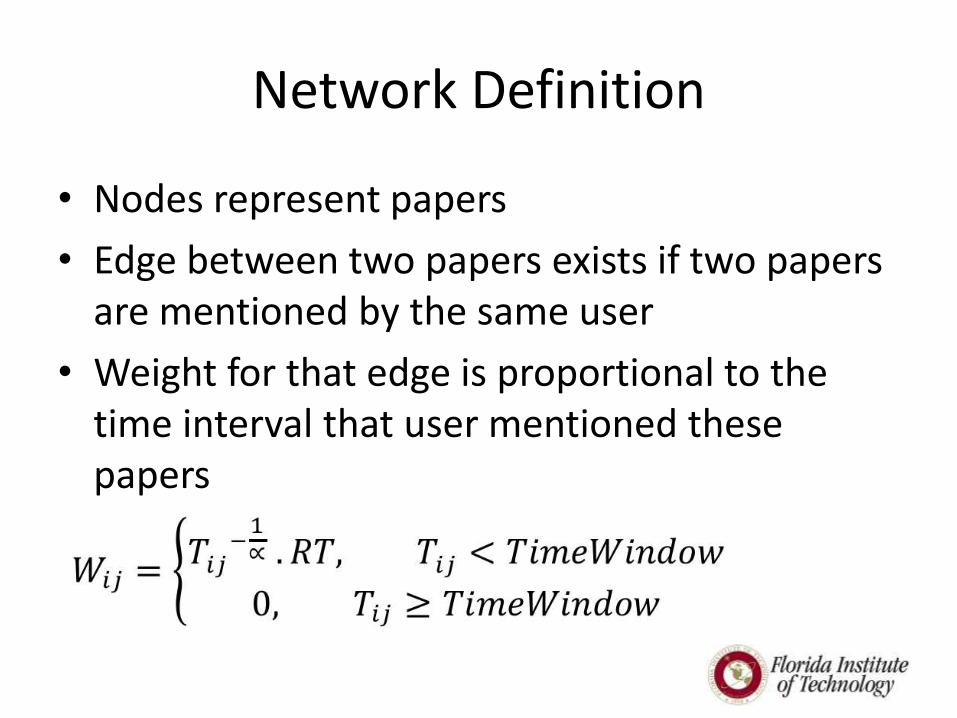
• Nodes represent papers
• Edge between two papers exists if two papers are mentioned by the same user
• Weight for that edge is proportional to the time interval that user mentioned these papers
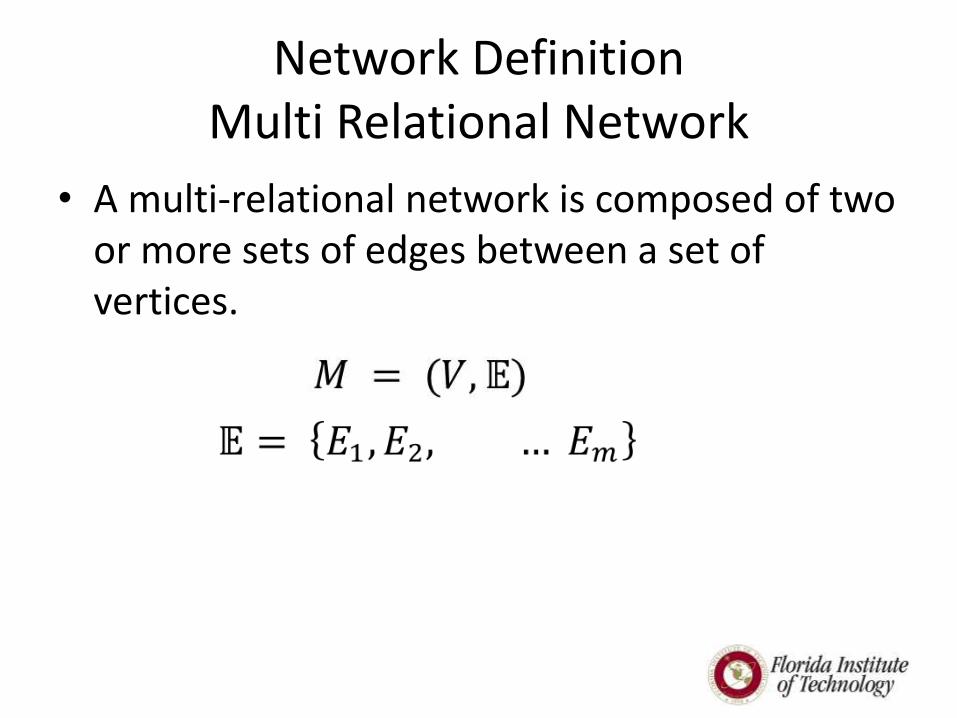
Network DefinitionMulti Relational Network
• A multi-relational network is composed of two or more sets of edges between a set of vertices.
Time Window
• How? For each edge the time interval between two tweets calculated and the difference added as a new property to edges.
• Cliques are not that bad.• Consider that five articles are tweeted by the
same person in 5 minutes they are all interrelated.
• Consider that a user tweeted an article and next month he tweeted another article.
Time Window
• Cliques might be good, data skewness is bad!
• Consider the fact that in social networks people are with diverse level of interest.
• Professor A might tweet articles every 5 hours while student B might merely Tweets article once a month.
• Time Window must be variable size and that size must be dependent on level of user activity.

Related Works
• Eysenbach, G. (2011). Can tweets predict citations? Metrics of social impact based on Twitter and correlation with traditional metrics of scientific impact. Journal of medical Internet research, 13(4).
• JMIR Journal Medial Internet Research• The Pearson correlations between tweetations and citations were
moderate and statistically significant, with correlation coefficients ranging from .42 to .72 for the log-transformed Google Scholar citations.
• Top-cited articles can be predicted from top-tweeted articles with 93% specificity and 75% sensitivity.
• Altmetrics– Viewed– Discussed– Saved– Linked– Recommended

General Metrics and Observations
• Power Law
-50
0
50
100
150
200
250
300
350
1 6
11
16
21
26
31
36
41
46
51
56
61
66
71
76
81
86
91
96
10
1
10
6
11
1
11
6
12
3
12
9
13
5
14
6
15
4
17
0
18
1
21
1
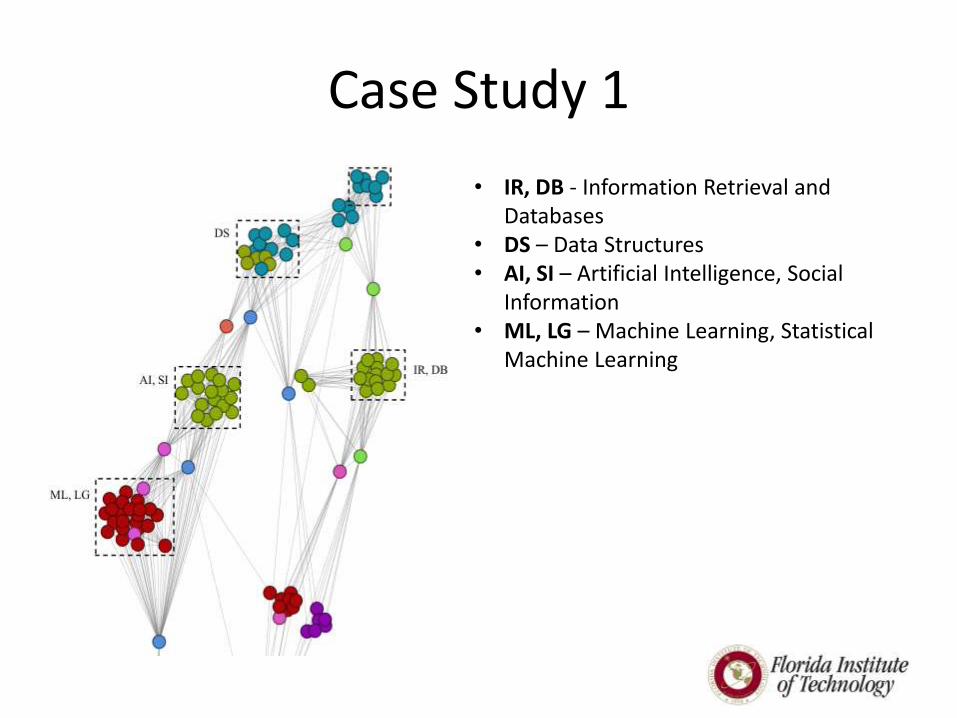
Case Study 1
• IR, DB - Information Retrieval and Databases
• DS – Data Structures• AI, SI – Artificial Intelligence, Social
Information• ML, LG – Machine Learning, Statistical
Machine Learning

Case Study 2
• The marked paper “The Limitations of Standardized Science Tests as Benchmarks for Artificial Intelligence Research: Position Paper”
• The citation number of 1512• Betweenness of ~8.2 and• RT number of larger than 100 indicate that
multi-disciplinary papers is only well-standing among citation network but shows a great appreciation from social network users.
• Another interesting founding is that degree numbers of all bridge nodes, in terms of the number of communities they connect together, are identical and equal to two.
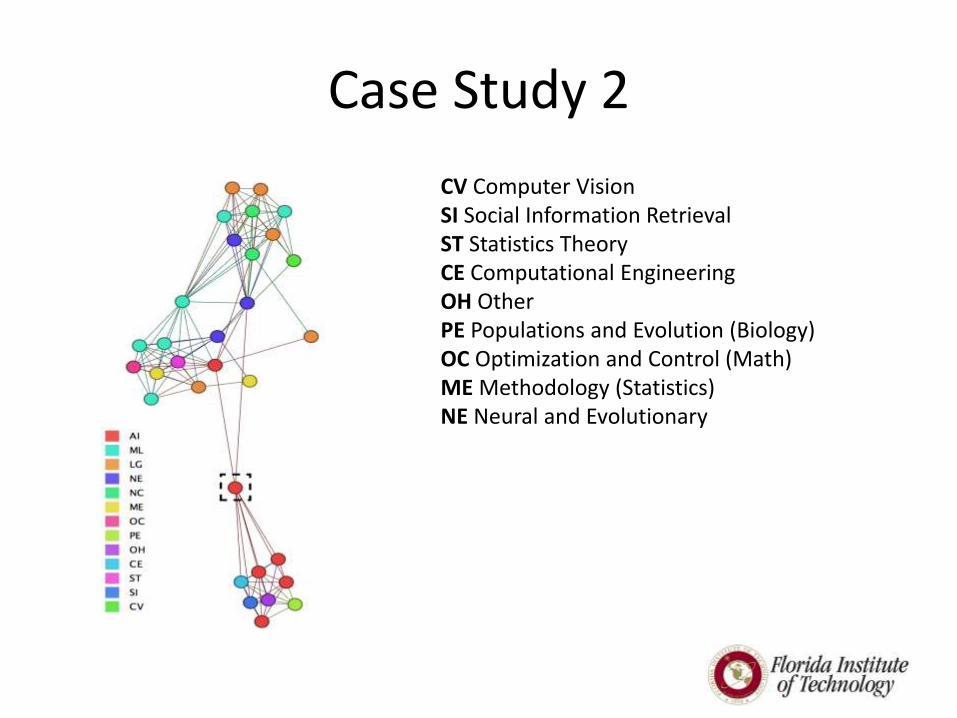
Case Study 2
CV Computer VisionSI Social Information RetrievalST Statistics TheoryCE Computational EngineeringOH Other PE Populations and Evolution (Biology)OC Optimization and Control (Math)ME Methodology (Statistics)NE Neural and Evolutionary
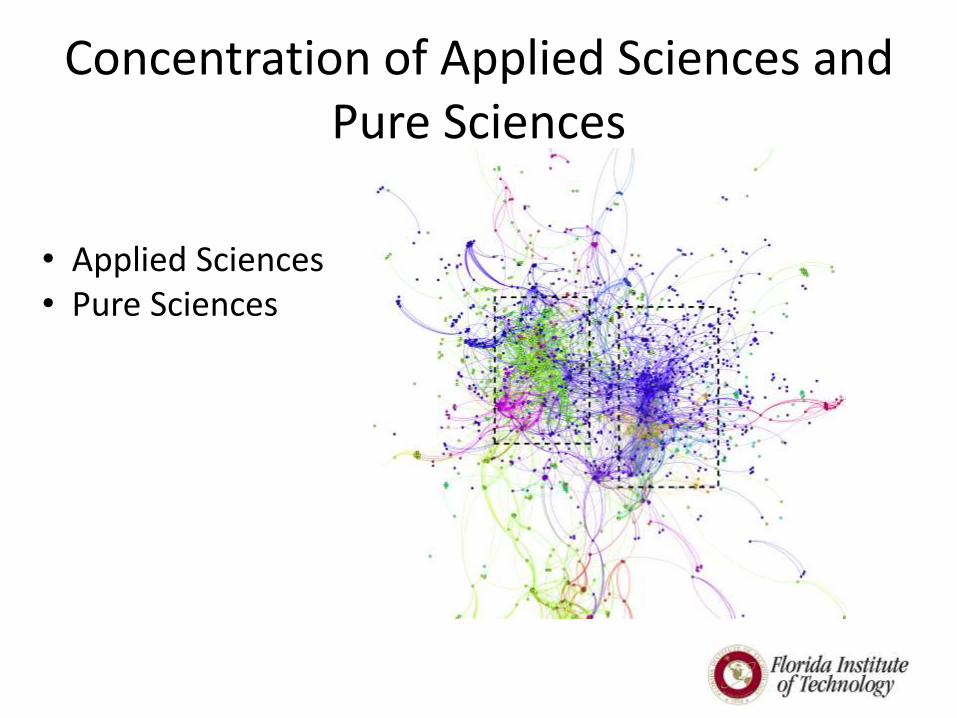
Concentration of Applied Sciences and Pure Sciences
• Applied Sciences• Pure Sciences
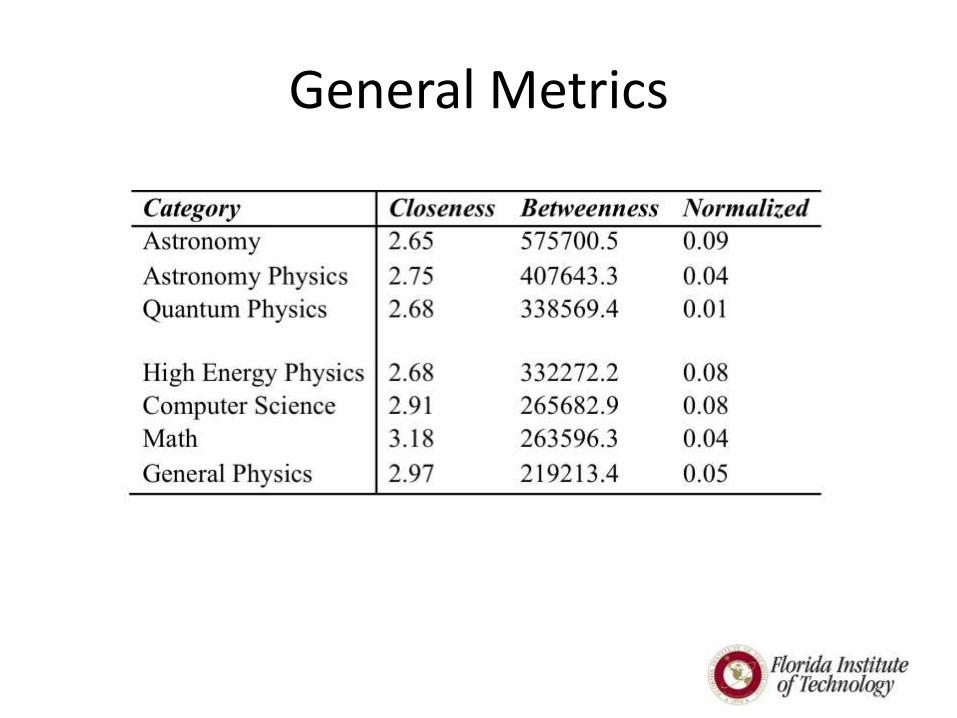
General Metrics
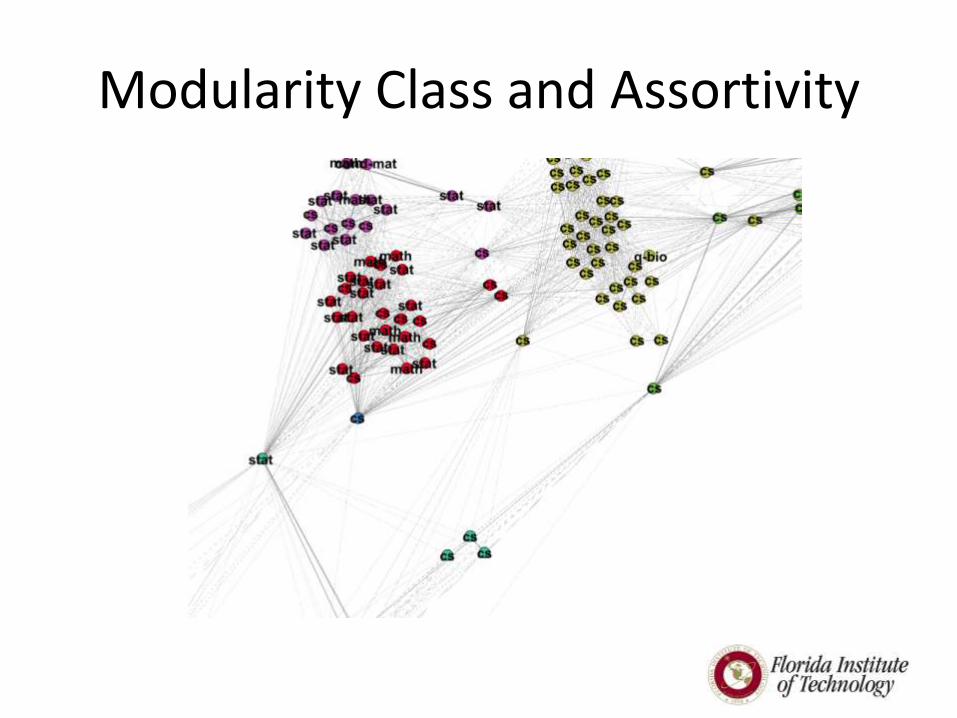
Modularity Class and Assortivity
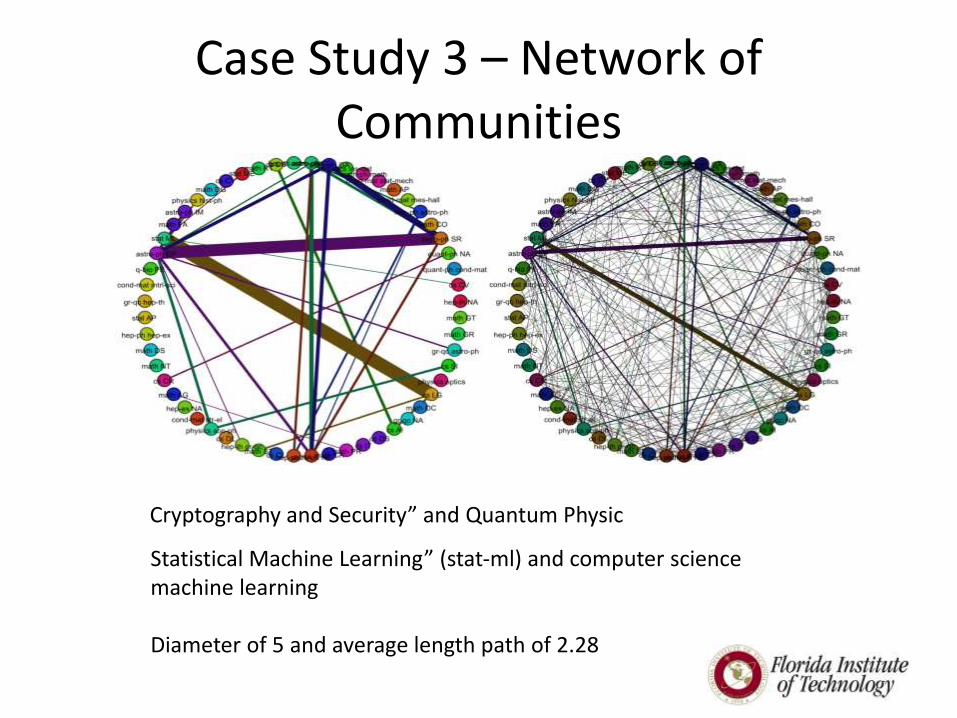
Case Study 3 – Network of Communities
Cryptography and Security” and Quantum Physic
Statistical Machine Learning” (stat-ml) and computer science machine learning
Diameter of 5 and average length path of 2.28
Other Set of Edges
• Co-author– Too sparse
– Used arxiv authors to construct network
– Must more level of co-authors taken into account
Co-topical
Use categories to construct
Too Dense.
Areas to Improve
• Multiplex Networks to predict trends in science.
• Normalized Time Window
• More Data
• Integration of scholarly networks with other networks from other domains.
• Dynamic Network Construction.
• Use of other social medias CiteUlike or Mendeley.
Improvisation on Gephi
Acknowledgments
• Dr. Ronaldo Menzes
• All classmates.
• Dr. Andrea Scharnhorst Royal Netherlands Academy of Arts and Sciences

Conclusion
• Citation Number of Tweets are heterogeneous metrics.
• Co-authorship and co-topical metrics are heterogeneous as well.
• Predict emergence of new fields can be fascinating for research institute to make right investments into research topics that a potential for them can be foreseen.
• Social scholarly networks can be a dynamic variation of conventional scholarly networks.
• Multi-disciplinary papers are most mentioned in both in terms of social activity in social network.
References
• Eysenbach, G. (2011). Can tweets predict citations? Metrics of social impact based on Twitter and correlation with traditional metrics of scientific impact. Journal of medical Internet research, 13(4).
• Leihan Zhang and (2014). Who creates trends in online social media: The crowd or opinion leaders?. CoRR, abs/1409.0210.
• Yan, E., & Ding, Y. (2012). Scholarly network similarities: How bibliographic coupling networks, citation networks, cocitation networks, topical networks, coauthorship networks, and coword networks relate to each other. Journal of the American Society for Information Science and Technology, 63(7), 1313-1326.
• Yan, E., & Ding, Y. (2012). Scholarly network similarities: How bibliographic coupling networks, citation networks, cocitation networks, topical networks, coauthorship networks, and coword networks relate to each other. Journal of the American Society for Information Science and Technology, 63(7), 1313-1326.
• Newman, M. E. (2003). The structure and function of complex networks. SIAM review, 45(2), 167-256.
• Cai, D., Shao, Z., He, X., Yan, X., & Han, J. (2005). Community mining from multi-relational networks. In Knowledge Discovery in Databases: PKDD 2005 (pp. 445-452). Springer Berlin Heidelberg.
Questions