citation analysis and mapping of nanoscience and ... analysis and...biotechnical faculty, university...
TRANSCRIPT

1 Scientometrics (2016) Volume 106, Issue 2, pp 563-581
Citation analysis and mapping of nanoscience and
nanotechnology: identifying the scope and interdisciplinarity of
research Karmen Stopar, Damjana Drobne, Klemen Eler, Tomaz Bartol
Biotechnical Faculty, University of Ljubljana, Jamnikarjeva 101, Ljubljana, Slovenia 1
Abstract
Diversification and fragmentation of scientific exploration brings an increasing need for integration, for example through interdisciplinary research. The field of nanoscience and nanotechnology appears to exhibit strong interdisciplinary characteristics. Our objective was to explore the structure of the field and ascertain how different research areas within this field reflect interdisciplinarity through citation patterns. The complex relations between the citing and cited articles were examined through schematic visualization. Examination of WOS categories assigned to journals shows the scatter of nano studies across a wide range of research topics. We identified four distinctive groups of categories each showing some detectable shared characteristics. Three alternative measures of similarity were employed to delineate these groups. These distinct groups enabled us to assess interdisciplinarity within the groups and relationships between the groups. Some measurable levels of interdisciplinarity exist in all groups. However, one of the groups indicated that certain categories of both citing as well as cited articles aggregate mostly in the framework of physics, chemistry, and materials. This may suggest that the nanosciences show characteristics of a distinct discipline. The similarity in citing articles is most evident inside the respective groups, though, some subgroups within larger groups are also related to each other through the similarity of cited articles.
Key words: nanoscience; interdisciplinarity; mapping of science; cross-citation network; subject categories
Introduction
Scientific disciplines are becoming increasingly diversified. New specialty areas are emerging which engender smaller fields of scientific activity. Yet, while areas of study are becoming more specialized, there also appears to be an increasing amount of "communication" among various fields thus connecting professionals from different research backgrounds. Terms such as interdisciplinarity, multidisciplinarity, and transdisciplinarity are habitually turning up. These terms are often used synonymously, describing an increasing level of interaction between disciplines. One of the fields which is believed to exhibit strong interdisciplinary characteristics is the field of nanoscience and nanotechnology.
Nanoscience and nanotechnology draw their theoretical and methodological approaches from different disciplines. It is therefore frequently discussed whether this is a homogeneous field of science and respective technologies, or just a compendium of different traditional disciplinary subfields which also tackle researach on nasoscale. Some of the early studies, for
1 Self-archived authors' version of the paper with corrections made in the course of the peer review process: Stopar, K., Drobne, D., Eler, K., & Bartol, T. (2016). Citation analysis and mapping of nanoscience and nanotechnology: identifying the scope and interdisciplinarity of research. Scientometrics, 106(2), 563–581. doi:10.1007/s11192-015-1797-x The final published version is available at: http://link.springer.com/article/10.1007%2Fs11192-015-1797-x

2 Scientometrics (2016) Volume 106, Issue 2, pp 563-581
example by Meyer and Persson (1998), identified nanotechnology as more interdisciplinary than other sciences. The concept of the "convergence in the nanoscale" which integrates different sciences and technologies into one field (Roco, 2002) is often mentioned as one of the key characteristics of this field. More recent studies (e.g. Porter and Youtie, 2009) reveal no particular patterns and degrees of interdisciplinarity in nanoscale research. It is highly integrative, however, no more so than other sciences. As pointed out by Schummer (2004), on the basis of co-author analysis, the nanoscience and nanotechnology is rather a "free mixture of traditional disciplines, for example chemistry or physics, which interrelate only weakly". Several different sub-fields of nano-physics, nano-chemistry, nano-electrical engineering, etc., are quite unrelated. Similarly, based on the analysis of European patents, Igami and Okazaki (2007) concluded that nanotechnology is a "set of technologies on the nanometre scale and not a specific technological field". Bassecoulard et al. (2007) classified nanotechnological papers into thematic clusters and found a moderate degree of multidisciplinarity. The analysis of Rafols and Meyer (2007) examined cognitive as well as social dimension (affiliation, researcher's background) of five bionano-technological projects which show a high degree of interdisciplinarity in the case of cognitive point of view (citation) and very weak in the case of affiliation and researcher's background.
Among the first who used bibliometric approach for the investigation of the field of nanoscience were Braun et al. (1997). Although interdisciplinarity has been studied using different research attributes (see e.g. Morillo et al., 2001; Bordons et al., 2004 or Wagner et al., 2011), Porter and Rafols (2009) pointed out that "indicators of interdisciplinarity should be based on the content of the research outcomes rather than on membership of the team, affiliations, or collaborations". A key aspect of the so-called "interdisciplinary research" is the process under which a group or individuals "integrates information, techniques, concepts, and/or theories from two or more disciplines or bodies of specialized knowledge" (Committee on Facilitating Interdisciplinary Research, 2004). Instead of interdisciplinarity, Rafols and Meyer (2010) thus prefer to use the label cognitive diversity which relates to disciplines, specialties, technologies or research fronts. While addressing interdisciplinarity modern bibliometric analysis frequently lacks convincing well-defined "statistical analogues" (Van Leeuwen and Tijssen, 2000).
A comprehensive review of different approaches in measuring interdisciplinarity was offered by Wagner et al. (2011) but as was pointed out, there had been no agreement on a single best approach or indicator. To achieve such an agreement some important issues relating to interdisciplinarity still need to be explored in further research, for example the impact of different levels of aggregation and appropriate selection of different types of units of analysis, measures or normalization. Among the approaches for assessing interdisciplinarity many are based on various applications of spatial distances between the observed items. Spatial distance as an evaluation tool has been employed also in some recent studies which examine interdisciplinary in nanosciences (e.g. Porter and Youtie, 2009; Leydesdorff, 2008; Rafols and Meyer, 2010). According to this methodology, science is presented as a network of interconnected items. Analysis can be conducted on the level of different bibliographic elements. Measuring similarity (relatedness) between various information elements is considered as one of the main approaches in bibliometric analysis. In addition to the use of simple measures as the raw frequency (count), a variety of relative or normalized measures for relatedness of various bibliometric elements are also used. However, little has been written about the suitability of different similarity measures (Klavans and Boyack, 2006). As there is still no universally accepted best similarity measure, some authors compare different alternatives in order to determine possible differences (e.g. Boyack et al., 2005). Salton's cosine is considered as one of the most common measures of similarity (e.g. Van Eck and Waltman, 2009), or even the best overall measure (Klavans and Boyack, 2006). It has also been employed in some nanoscience-related bibliometric studies (Leydesdorff and

3 Scientometrics (2016) Volume 106, Issue 2, pp 563-581
Zhou, 2007; Leydesdorff and Rafols, 2009; Rafols and Mayer, 2010). Relations between various information elements under analysis are determined in a direct way, for example, when a journal or certain subject category cites other journal or category in a matrix of cross-citations (e.g. Zhang et al. 2010; Janssens et al., 2009) or in a non-direct way, when we are looking for the simultaneous occurrence (co-occurrence) of certain elements in the same metadata field, for example in the case of the analysis of co-citation (e.g. Moya-Anegon et al., 2004), bibliographic coupling (e.g. Rafols and Meyer, 2010) or co-author analysis (e.g. Schummer, 2004). To determine interdisciplinarity, some other types of spatial approaches have also been proposed, such as the measure of diversity or the measure of centrality of the specific parts of the network. Leydesdorff and Zhou (2007) used "betweenness centrality" at the journal level in order to measure interdisciplinarity in nanosciences. The concept of diversity has also been used as a measure of interdisciplinarity by Stirling, (2007), Porter and Rafols (2009), Rafols and Meyer (2010), Porter and Youtie (2009), and Leydesdorf and Rafols (2011). The framework of diversity proposed by Rao (1982) and Stirling (1994, 2007), unlike some other indexes (cited and assessed by Stirling, 2007), captures in one index multiple dimensions (variety, balance and disparity) which need to be examined together.
Similarity between the items is measured for various purposes of visualization. To provide a better insight into the relations between individual subject areas or their aggregates, graphical representations are employed. Presentation of information in two or three dimensions becomes more imaginable and relationships more easily visible. As noted by Moya-Anegon et al. (2004) visualization is a process through which the complex data are transformed to the visual messages that are easier to understand. Noyons (2001) described that kind of maps as "landscape of science, where the items in the maps refer to themes and topics in the mapped field" and wherein more related items are positioned closer to each other. In bibliometric analysis, clustering as well as various graph-based mapping methods have been used for the purposes of data reduction and graphical presentation. There is still no universally accepted best grouping of bibliometric data (Porter and Rafols, 2009). However, hierarchical classification is sometimes presented as the most appropriate if we try to delimit the optimal number of groups. Janssens et al. (2009) found this technique as the most frequent in science mapping. Among ordination methods employed for the purposes of reducing dimensions and generating measures of similarity in nanofield, principal component analysis (PCA) or factor analysis (FA) was used by Leydesdorff and Rafols (2009), Rafols and Meyer (2010), Porter and Rafols (2009 and Porter and Youtie (2009).
The main objective of this work is to ascertain whether the field of nanoscience represents
only one well defined single major field of science (group of associated categories as defined by the Web of Science) in terms of shared citation patterns (references) or it can perhaps be divided into several distinct groups where each group possesses some distinguishing characteristics which differentiate each particular group from other possible groups. We wish to identify and explore such groups. We believe that there exists one principal (core) nanogroup which contains mostly chemical as well as physical aspects of nanoresearch. Besides this group, however, there might exist other groups which also show strong emphasis on nanoresearch but place some noticeable prominence on other aspects which are central to each of the groups.
Focusing on the delineation of groups, we aim to ascertain interdisciplinarity in each group. Each of the groups draws references from hundreds, even thousands, of different journals associated with dozens of WOS categories. In addition, we believe that there also exist some special connections, in terms of the similarity of cited articles (references), between the different groups. We asume that these connections are reflected in some narrower research areas within each of the groups. Certain narrower groups of categories in one major

4 Scientometrics (2016) Volume 106, Issue 2, pp 563-581
group show some similar characteristics in citation patterns as certain narrower groups of categories in the other major groups.
The outline of the study follows the subsequent steps: 1) Establishing relations in the entire dataset of citing articles, based on the similarity of references (cited articles) in these citing articles; 2) Aggregation of categories (pertaining to the citing articles) into groups by cluster analysis and verification of groups with Detrended Correspondence Analysis; 3) Assessment of interdisciplinarity in the groups with Rao-Stirling diversity index and permuted matrix.
Materials and methods
Data for our analysis were retrieved from the Web of Science Core Collection (Thomson Reuters) and the respective Citation Indexes (SCI-expanded, SSCI, and A&HCI). We set up several operational databases for the purposes of configuration and assessment of experimental data. Evaluation of data, statistical analysis and construction of citation maps was managed by a bibliometric tool Bibexcel (Persson, 2010), software for statistical computing and graphics R (R Development Core Team, 2012) and program for network analysis Pajek (Batagelj and Mrvar, 2012).
In order to chart the scope of the field of nanoscience and nanotechnology which defined the selection of relevant publications we first examined the existing scientometric outlines. As there is no universally accepted and standardized definition of the field of nanoscience, among different search strategies used for the delineation of the field of nanoscience, we examined the methodologies by Noyons et al. (2003), Warris (2004), Mogoutov and Kahane (2007), Porter et al. (2008), Grieneisen and Zhang (2011) and Maghrebi et al. (2011). The results of selected methodologies are summarized in Figure 1.
Fig. 1 Number of articles per publication year in database WOS, according to a respective search query Whereas all search methodologies include the right-hand truncated "nano" (nano*), they vary to some extent in their inclusion of other possibly relevant terms. The different methodologies thus return different numbers of articles. A significant share of relevant documents would already be retrieved by employing the truncated "nano" (Braun et al., 1997; Bartol and Stopar, 2015). Given the many existing methodologies there was no need to offer yet another search strategy. We decided to employ the methodology by Maghrebi et al. (2011) which gives greater weight to search accuracy (precision) in contrast to Porter who favours good recall
0
20000
40000
60000
80000
100000
120000
140000
19
90
19
91
19
92
19
93
19
94
19
95
19
96
19
97
19
98
19
99
20
00
20
01
20
02
20
03
20
04
20
05
20
06
20
07
20
08
20
09
20
10
20
11
20
12
No
. a
rtic
les
Warris
Porter
Maghrebi
nano*

5 Scientometrics (2016) Volume 106, Issue 2, pp 563-581
over precision (Porter et al., 2008). Thus, we identified in the WOS some 95,000 documents published in 2011. For the purposes of citation analysis, journal names of both citing and cited articles were extracted from the retrieved records. We first transposed journal names and abbreviations of journal names (in the case of references) into the corresponding WOS categories. For the purposes of this transformation we developped two decoders. First we unified different forms of each abreviated journal title. Thereafter, we replaced journal names with corresponding categories.
The citing articles were dispersed across as many as 205 different categories. Because a few isolated articles and respective categories were clearly not related to nanoscience even though they had been retrieved with the query we excluded these categories. We also removed categories (citing articles) with insignificant frequencies (less than 5) while still preserving most (99.8 %) data. Further experimentation was thus conducted on 174 categories which account for the majority of all records. Filtered matrix was used as the base for further analysis which comprised 174 x 207 fields (citing x cited categories).
For the purposes of normalization we prepared a cross-citation matrix (category-category) based on citing and cited articles. We employed three different indexes of similarity/dissimilarity: Salton's cosine similarity index (eq.1), Euclidean distance, and Manhattan distance (eq. 2, 3). All measures provide values between zero and one. High values of the cosine indicate strong relatedness between two subject categories (high similarity). In contrast, in case of dissimilarity indexes (Euclidian, Manhattan) high values denote weak relatedness. For each of the three different aggregated category-category matrixes we computed similarities or dissimilarities in the citation patterns between each pair of citing categories (x and y, which are described with k variables - cited categories). Equations which we used are defined as follows:
( )
( )( )( )1
2 21 1
ki ii
k ki ii i
x y
x y
=
= =
∑
∑ ∑
( )2
1k
i iix y
=−∑
1k
i iix y
=−∑ … (1, 2, 3)
Due to the complexity of the data, we arranged the data into groups in order to establish some possible new structures. For the purposes of visualisation we combined distance and graph-based method. With the Ward’s method of clustering we determined the optimal number of clusters (on a dendrogram).
As ordination (gradient) analysis is complementary to clustering analysis, we furthermore supplemented the results with Detrended Correspondence Analysis (DCA) as one of the ordination techniques (Hill and Gauch, 1980) which transforms numerical information from the matrix into a graphical display. It is especially suitable for data analysis with numerous objects and variables, characterized by large variability (Ter Braak, 1986). Objects which are characterized with multiple variables are ordered in such a way that similar objects are closer to each other. The analysis was prepared on the basis of pre-defined groups of categories which we obtained by clustering with the three selected dimensions of similarity. This was performed using the package 'vegan' within the R environment (Oksanen et al., 2015).
Another measure which we applied in our work for the purposes of investigating interdisciplinarity was the measure of diversity whereby we analyzed the heterogeneity in citations. We employed Rao-Stirling diversity index (Rao, 1982; Stirling, 1994, 2007). It covers various components, which need to be examined together. These components are represented as 'variety', 'balance' and 'disparity' and describe: the number of cited disciplines, distribution of citations across disciplines and mutual similarity (disimilarity) of categories.

6 Scientometrics (2016) Volume 106, Issue 2, pp 563-581
We calculated diversity using the folowing equation (Eq. 4; Stirling, 2007):
,ij i j
ij i j
D d p p
≠
= ⋅ ⋅∑ ... (4)
1ij ijd s= − ... (5)
The values pi and pj denote proportional representation of elements i and j; these are references which are defined by a certain category, dij is the degree of difference (disparity) and is derived from Salton's cosine similarity sij (eq. 5). The values range between zero and one. The value is zero (0) when an article cites only articles (journals) from the same subject category. The value is close to one (1) if an article cites articles from a high range of different categories.
To ascertain some other relationships and connections between categories or category groups we additionaly visualized our dataset with permutation matrix (de Nooy et al., 2011). A permutation matrix is a square matrix obtained from the same size identity matrix by permutation (sorting, reordering) of vertices. In order to conduct this procedure we used network analysis package Pajek (Batagelj and Mrvar, 2012). Cosine was used for normalization, corrected Euclidean distance for a similarity measure and Ward's method for clustering purposes. Results
Our query retrieved more than 95,000 articles (records - citing articles) containing altogether more than 3 million citations (references - cited articles). We assigned WOS categories from the respective journals to both citing as well as cited articles. 174 citing categories were identified. These articles cited references from 207 different categories. The most frequent categories of citing articles are presented in Fig. 2. The fields of physics, chemistry, and materials are represented the most frequently. Some categories occur only rarely. The generic nano category Nanoscience & Nanotechnology comes in fifth place.
Fig. 2 The most frequent WOS subject categories with which are classified journals of citing articles
29.5 %
21.2 %
19.7 %
17.1 %
16.6 %
12.3 %
6.3 %
4.4 %
4.0 %
4.0 %
3.9 %
3.8 %
3.3 %
3.2 %
2.9 %
0 5000 10000 15000 20000 25000 30000 35000
Materials Science, Multidisciplinary
Chemistry, Physical
Physics, Applied
Chemistry, Multidisciplinary
Nanoscience & Nanotechnology
Physics, Condensed Matter
Polymer Science
Electrochemistry
Engineering, Chemical
Chemistry, Analytical
Optics
Physics, Multidisciplinary
Physics, Atomic, Molecular & Chemical
Engineering, Electrical & Electronic
Metallurgy & Metallurgical Engineering

7 Scientometrics (2016) Volume 106, Issue 2, pp 563-581
Establishing relations in the entire dataset, based on the similarity of cited articles Figure 3 represents the entire set of data based on the relatedness of citing articles (174 citing categories). This relatedness is expressed through the similarity of cited articles (references). The categories are represented with circles (nodes or vertices) - the circle-size depending on the number of citing articles pertaining to a particular category. The closer they are, the greater the similarity in citing. Lines represent ties between pairs of categories in the network. Both proximity and width of lines indicate the similarity in cited articles. Labels denote the scope of the most frequent categories (for example: Chemistry for categories Chemistry,
multidisciplinary; Chemistry, Analitical etc.) The figure was prepared on the basis of cross-citation matrix. Salton's cosine index was used as a measure of similarity.
Legend: circles: categories / circle size: number of citing articles / lines: ties between pairs of categories / line position/width: similarity in cited articles / labels: the scope of the most frequent categories
Fig. 3 Similarity map (Salton's cosine) for the WOS categories (Pajek, algorithm Kamada-Kawai) As Figure 3 represents the entire set of data it does not offer an efficient visualisation of possible major relations between categories. For example, the category Nanoscience &
Nanotechnology is most strongly related to Materials Science, Multidisciplinary (Salton's cosine index: 0.99). Some other highly related categories are: Chemistry, Physical (0.97), Chemistry, Multidisciplinary (0.96), Physics, Applied (0.96), and Physics, Condensed Matter (0.95). Thus, in order to better present the relations we aggregated the categories into groups based on the similarity of citing patterns.

8 Scientometrics (2016) Volume 106, Issue 2, pp 563-581
Aggregation of categories into groups Determination of groups with cluster analysis
In the previous step, only the most general relations between the categories have been identified. In the next stage, we identified further distinctive characteristics, for example, groups of categories which form some unique clusters and are thus more related to each other than to other categories outside the clusters. By way of cluster analysis (Ward's method) we employed three alternative measures of similarity (Salton's cosine similarity index, Euclidean distance, and Manhattan distance) in order to identify distinctive major research domains which show some shared characteristics. We aimed to identify these domains because the field of nanoscience is very complex. Proper aggregation into smaller groups can serve as a basis for a better insight into this field. Clustering is carried out on the principles of similarity between items. Categories are grouped in such a way that those in the same group are more similar to each other than to those in other groups. Clustering process for our data is visualised by dendrograms where length of horizontal branches represent dissimilarity between two items or clusters (these data are provided in Online Supplement 1). Where the "jump" of horizontal branches was the most pronounced we cut the branches/tree (the three inserted horizontal lines as shown in Supplement 1). Each dendrogram contains data for 174 different categories so their names are represented in very small fonts. They are spelled-out in full in Table 1, on the case of the Salton's cosine dendrograms which are presented in Supplement 1. Clusters can be established on any level. We used the three measures of similarity in order to ascertain the levels which exhibit the highest resemblance among all three measures. The fragmentation on lower levels was very high so no particular ressemblance could be established. Based on the similarity of three dendrograms we estimated that some sufficiently good resemblance could be achieved with four groups/clusters. Thus, those four groups then served as a basis for the more detailed further analyses.
9 Scientometrics (2016) Volume 106, Issue 2, pp 563-581
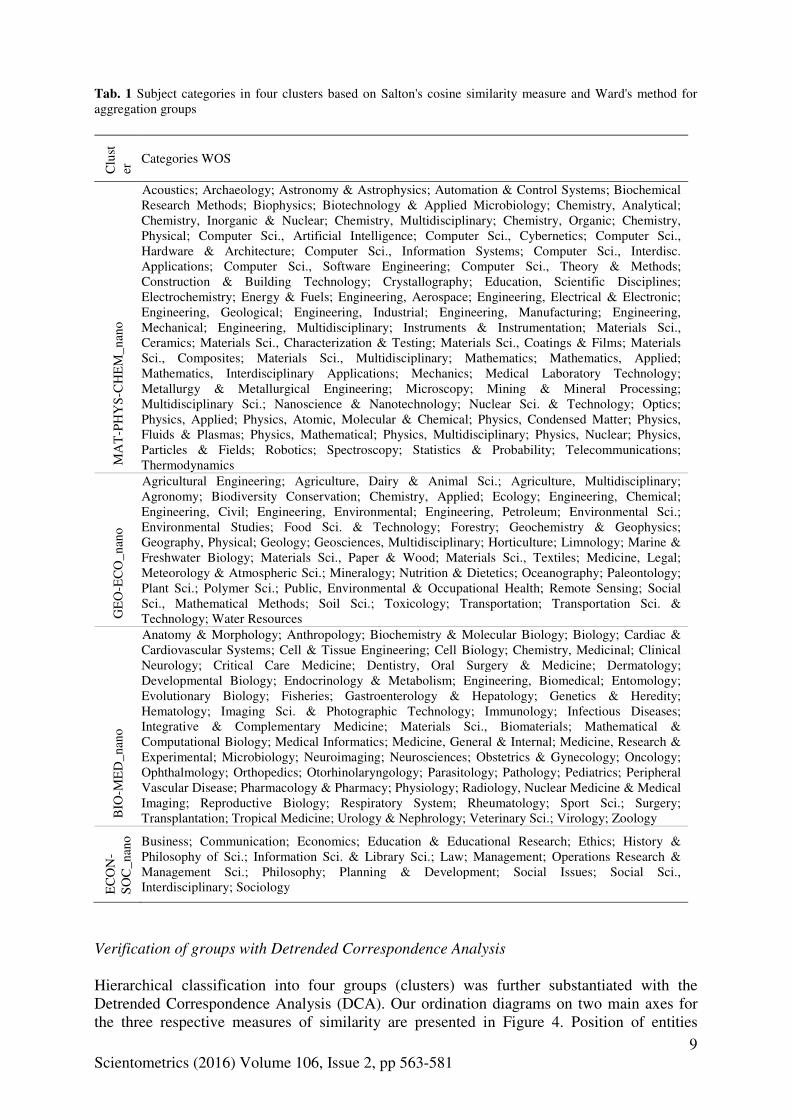
Tab. 1 Subject categories in four clusters based on Salton's cosine similarity measure and Ward's method for aggregation groups
C
lust
er Categories WOS
MA
T-P
HY
S-C
HE
M_n
ano
Acoustics; Archaeology; Astronomy & Astrophysics; Automation & Control Systems; Biochemical Research Methods; Biophysics; Biotechnology & Applied Microbiology; Chemistry, Analytical; Chemistry, Inorganic & Nuclear; Chemistry, Multidisciplinary; Chemistry, Organic; Chemistry, Physical; Computer Sci., Artificial Intelligence; Computer Sci., Cybernetics; Computer Sci., Hardware & Architecture; Computer Sci., Information Systems; Computer Sci., Interdisc. Applications; Computer Sci., Software Engineering; Computer Sci., Theory & Methods; Construction & Building Technology; Crystallography; Education, Scientific Disciplines; Electrochemistry; Energy & Fuels; Engineering, Aerospace; Engineering, Electrical & Electronic; Engineering, Geological; Engineering, Industrial; Engineering, Manufacturing; Engineering, Mechanical; Engineering, Multidisciplinary; Instruments & Instrumentation; Materials Sci., Ceramics; Materials Sci., Characterization & Testing; Materials Sci., Coatings & Films; Materials Sci., Composites; Materials Sci., Multidisciplinary; Mathematics; Mathematics, Applied; Mathematics, Interdisciplinary Applications; Mechanics; Medical Laboratory Technology; Metallurgy & Metallurgical Engineering; Microscopy; Mining & Mineral Processing; Multidisciplinary Sci.; Nanoscience & Nanotechnology; Nuclear Sci. & Technology; Optics; Physics, Applied; Physics, Atomic, Molecular & Chemical; Physics, Condensed Matter; Physics, Fluids & Plasmas; Physics, Mathematical; Physics, Multidisciplinary; Physics, Nuclear; Physics, Particles & Fields; Robotics; Spectroscopy; Statistics & Probability; Telecommunications; Thermodynamics
GE
O-E
CO
_nan
o
Agricultural Engineering; Agriculture, Dairy & Animal Sci.; Agriculture, Multidisciplinary; Agronomy; Biodiversity Conservation; Chemistry, Applied; Ecology; Engineering, Chemical; Engineering, Civil; Engineering, Environmental; Engineering, Petroleum; Environmental Sci.; Environmental Studies; Food Sci. & Technology; Forestry; Geochemistry & Geophysics; Geography, Physical; Geology; Geosciences, Multidisciplinary; Horticulture; Limnology; Marine & Freshwater Biology; Materials Sci., Paper & Wood; Materials Sci., Textiles; Medicine, Legal; Meteorology & Atmospheric Sci.; Mineralogy; Nutrition & Dietetics; Oceanography; Paleontology; Plant Sci.; Polymer Sci.; Public, Environmental & Occupational Health; Remote Sensing; Social Sci., Mathematical Methods; Soil Sci.; Toxicology; Transportation; Transportation Sci. & Technology; Water Resources
BIO
-ME
D_n
ano
Anatomy & Morphology; Anthropology; Biochemistry & Molecular Biology; Biology; Cardiac & Cardiovascular Systems; Cell & Tissue Engineering; Cell Biology; Chemistry, Medicinal; Clinical Neurology; Critical Care Medicine; Dentistry, Oral Surgery & Medicine; Dermatology; Developmental Biology; Endocrinology & Metabolism; Engineering, Biomedical; Entomology; Evolutionary Biology; Fisheries; Gastroenterology & Hepatology; Genetics & Heredity; Hematology; Imaging Sci. & Photographic Technology; Immunology; Infectious Diseases; Integrative & Complementary Medicine; Materials Sci., Biomaterials; Mathematical & Computational Biology; Medical Informatics; Medicine, General & Internal; Medicine, Research & Experimental; Microbiology; Neuroimaging; Neurosciences; Obstetrics & Gynecology; Oncology; Ophthalmology; Orthopedics; Otorhinolaryngology; Parasitology; Pathology; Pediatrics; Peripheral Vascular Disease; Pharmacology & Pharmacy; Physiology; Radiology, Nuclear Medicine & Medical Imaging; Reproductive Biology; Respiratory System; Rheumatology; Sport Sci.; Surgery; Transplantation; Tropical Medicine; Urology & Nephrology; Veterinary Sci.; Virology; Zoology
EC
ON
-S
OC
_nan
o Business; Communication; Economics; Education & Educational Research; Ethics; History & Philosophy of Sci.; Information Sci. & Library Sci.; Law; Management; Operations Research & Management Sci.; Philosophy; Planning & Development; Social Issues; Social Sci., Interdisciplinary; Sociology
Verification of groups with Detrended Correspondence Analysis
Hierarchical classification into four groups (clusters) was further substantiated with the Detrended Correspondence Analysis (DCA). Our ordination diagrams on two main axes for the three respective measures of similarity are presented in Figure 4. Position of entities

10 Scientometrics (2016) Volume 106, Issue 2, pp 563-581
(points) which represent categories of citing articles indicates degree of similarity according to the citation patterns.
The four clusters exhibit some shared characteristics with regard to the predominant topics within each cluster. These topics are represented by the WOS subject categories. For each cluster we have introduced a label which reflects the principal topics: − MAT-PHYS-CHEM (cat: materials, physics, chemistry, computer sciences, engineering) − GEO-ECO (cat: environmental sciences, geosciences, agriculture) − BIO-MED (cat: biological, medical sciences) − ECON-SOC (cat: economics, social sciences, humanities)
Fig. 4 DCA ordination of categories in the first two correspondence axes. Tags correspond to clusters identified using different similarity/distance measures; A - Manhattan, B - Euclidean, C - Salton's cosine
Figure 4 represents the four clusters with regard to the position of clusters and variability of topics within clusters. First axes represents various groups and the second axes variability inside the groups. First axis explains most of the original information. In our case it accounts for 39.9 % of variability of data. The second axis is perpendicular to the first and explains additional 26.9 % of the original information.
The comparison based on the three different measures of similarity enabled us to detect possible differences in the distribution of individual categories into groups. The ordinations of clusters which were composed using either Manhattan, Euclidean or Salton's cosine distances show very similar results. The cluster ECON-SOC is identical in each of the three approaches. The other three clusters show some differences. For example, the categories Biochemical
Research Methods, Biophysics and Biotechnology & Applied Microbiology get arranged in different categories, depending on the index: MAT-PHYS-CHEM in the case of Salton's cosine, GEO-ECO in the case of Euclidean, and BIO-MED if Manhattan distance is
11 Scientometrics (2016) Volume 106, Issue 2, pp 563-581
employed. The socio-economic cluster of WOS categories is the most distinct, ordinated in the right part of the first ordination axis. Categories of the natural sciences are located to the left of ECON-SOC cluster. The core nano science cluster MAT-PHYS-CHEM occupies central position. This group is also quite compact. GEO-ECO cluster shows the largest scatter (variability) of categories. This cluster also appears relatively weak and shows larger percentage of categories similar to either MAT-PHYS-CHEM or BIO-MED.
Assessment of interdisciplinarity Assessment of interdisciplinarity in the groups with Rao-Stirling diversity index
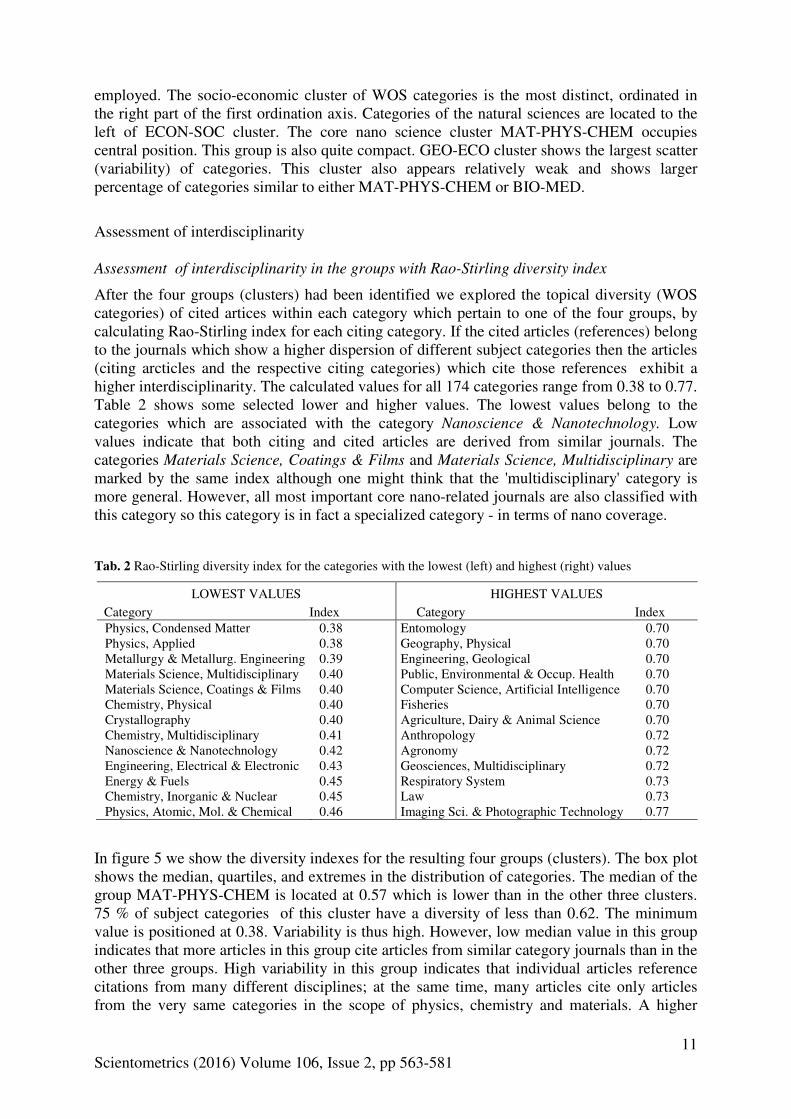
After the four groups (clusters) had been identified we explored the topical diversity (WOS categories) of cited artices within each category which pertain to one of the four groups, by calculating Rao-Stirling index for each citing category. If the cited articles (references) belong to the journals which show a higher dispersion of different subject categories then the articles (citing arcticles and the respective citing categories) which cite those references exhibit a higher interdisciplinarity. The calculated values for all 174 categories range from 0.38 to 0.77. Table 2 shows some selected lower and higher values. The lowest values belong to the categories which are associated with the category Nanoscience & Nanotechnology. Low values indicate that both citing and cited articles are derived from similar journals. The categories Materials Science, Coatings & Films and Materials Science, Multidisciplinary are marked by the same index although one might think that the 'multidisciplinary' category is more general. However, all most important core nano-related journals are also classified with this category so this category is in fact a specialized category - in terms of nano coverage.
Tab. 2 Rao-Stirling diversity index for the categories with the lowest (left) and highest (right) values
LOWEST VALUES HIGHEST VALUES Category Index Category Index Physics, Condensed Matter 0.38 Entomology 0.70 Physics, Applied 0.38 Geography, Physical 0.70 Metallurgy & Metallurg. Engineering 0.39 Engineering, Geological 0.70 Materials Science, Multidisciplinary 0.40 Public, Environmental & Occup. Health 0.70 Materials Science, Coatings & Films 0.40 Computer Science, Artificial Intelligence 0.70 Chemistry, Physical 0.40 Fisheries 0.70 Crystallography 0.40 Agriculture, Dairy & Animal Science 0.70 Chemistry, Multidisciplinary 0.41 Anthropology 0.72 Nanoscience & Nanotechnology 0.42 Agronomy 0.72 Engineering, Electrical & Electronic 0.43 Geosciences, Multidisciplinary 0.72 Energy & Fuels 0.45 Respiratory System 0.73 Chemistry, Inorganic & Nuclear 0.45 Law 0.73 Physics, Atomic, Mol. & Chemical 0.46 Imaging Sci. & Photographic Technology 0.77
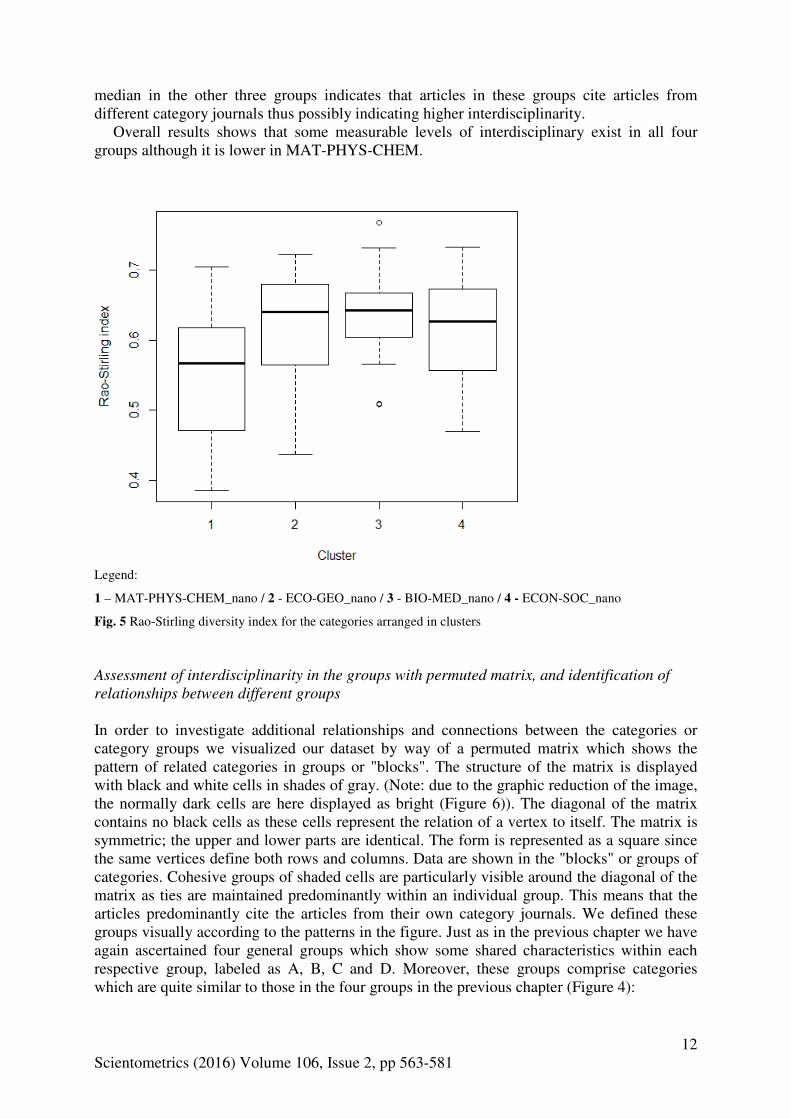
In figure 5 we show the diversity indexes for the resulting four groups (clusters). The box plot shows the median, quartiles, and extremes in the distribution of categories. The median of the group MAT-PHYS-CHEM is located at 0.57 which is lower than in the other three clusters. 75 % of subject categories of this cluster have a diversity of less than 0.62. The minimum value is positioned at 0.38. Variability is thus high. However, low median value in this group indicates that more articles in this group cite articles from similar category journals than in the other three groups. High variability in this group indicates that individual articles reference citations from many different disciplines; at the same time, many articles cite only articles from the very same categories in the scope of physics, chemistry and materials. A higher
12 Scientometrics (2016) Volume 106, Issue 2, pp 563-581
median in the other three groups indicates that articles in these groups cite articles from different category journals thus possibly indicating higher interdisciplinarity.
Overall results shows that some measurable levels of interdisciplinary exist in all four groups although it is lower in MAT-PHYS-CHEM.
Legend:
1 – MAT-PHYS-CHEM_nano / 2 - ECO-GEO_nano / 3 - BIO-MED_nano / 4 - ECON-SOC_nano
Fig. 5 Rao-Stirling diversity index for the categories arranged in clusters
Assessment of interdisciplinarity in the groups with permuted matrix, and identification of
relationships between different groups
In order to investigate additional relationships and connections between the categories or category groups we visualized our dataset by way of a permuted matrix which shows the pattern of related categories in groups or "blocks". The structure of the matrix is displayed with black and white cells in shades of gray. (Note: due to the graphic reduction of the image, the normally dark cells are here displayed as bright (Figure 6)). The diagonal of the matrix contains no black cells as these cells represent the relation of a vertex to itself. The matrix is symmetric; the upper and lower parts are identical. The form is represented as a square since the same vertices define both rows and columns. Data are shown in the "blocks" or groups of categories. Cohesive groups of shaded cells are particularly visible around the diagonal of the matrix as ties are maintained predominantly within an individual group. This means that the articles predominantly cite the articles from their own category journals. We defined these groups visually according to the patterns in the figure. Just as in the previous chapter we have again ascertained four general groups which show some shared characteristics within each respective group, labeled as A, B, C and D. Moreover, these groups comprise categories which are quite similar to those in the four groups in the previous chapter (Figure 4):
13 Scientometrics (2016) Volume 106, Issue 2, pp 563-581
Group A; categories related to BIO-MED Group B; categories related to GEO-ECO Group C; categories related to ECON-SOC Group D; categories related to MAT-PHY-CHEM
We have divided some of these groups into narrower groups (for example, A into A1, A2 and A3) because some subject areas within these A groups exhibit some visible special characteristics which are reflected in the connections of these A groups with D groups. All A sub-groups are related to each other which is reflected in the upper left rectangle (on the diagonal). The strongest relations are reflected in light shades. On the other hand, A2 and A3 are also related to D whereas at A1 no such characteristics are visible.
Categories within D1 represent multidisciplinary or interdisciplinary categories, categories related to physics, chemistry, and materials science, as well as the "generic" category Nanoscience & Nanotechnology. Essentially, these are the principal or core nano-associated categories which reflect the nano-topics most strongly. This is also evidenced in the WOS journal classification scheme where many journals are concurrently classified with the category Nanoscience & Nanotechnology and some other related categories, such as Chemistry Physical, Physics Applied, Materials Science Multidisciplinary, Chemistry
Multidisciplinary, etc. The relatedness between the narrower groups is expressed in light shades around the
diagonal (above D1). The names of categories are presented in very small fonts just above the labels (a few selected categories are presented as an insertion at A3 and D1). The categories are listed in full in the legend pertaining to Figure 6.
The core nano-associated categories (labeled with D1) are most highly related to the categories in D2. Most importantly, this relatedness (light shades) is also visible futher away from the diagonal. If the relatedness moves away from the diagonal this signifies that two seemingly less related groups express substantial similarity in citation patterns. In our case, this is most visibly expressed in the relations between D1 and A3, and to some lesser extent between D2 and A3 Thus, in the sense of citation patterns, A3-group categories (the topics of biology, biophysics and medicine …) are related to the categories in D1 (multidisciplinary, physics, chemistry, and materials). Group D1 (partly D2) also shows some connections with A2 and B2.

14 Scientometrics (2016) Volume 106, Issue 2, pp 563-581
Fig. 6 Network of the citing categories according to similarity in citation in the permutation matrix Legend: A1: Rheumatology; Ophthalmology; Urology & Nephrology; Gastroenterology & Hepatology; Cardiac & Cardiovascular Systems; Peripheral Vascular Disease; Hematology; Clinical Neurology; Neurosciences; Neuroimaging; Pediatrics; Physiology; Infectious Diseases; Virology; Immunology; Microbiology; Fisheries; Developmental Biology; Plant Sci.; Evolutionary Biology; Zoology; Otorhinolaryngology; Endocrinology; Medicine, General & Internal; Genetics & Heredity; Pathology; Mathematical & Computational Biology; Cell Biology; Parasitology; Tropical Medicine; Veterinary; Chemistry, Medicinal; Pharmacology; Obstetrics & Gynecology; Oncology; Respiratory System; Integrative & Complementary Medicine; Dermatology; Transplantation; Cell & Tissue Engineering; Surgery A2: Chemistry, Analytical; Chemistry, Organic; Food Sci. & Technology; Agricultural Engineering; Materials Sci., Paper & Wood; Agriculture, Multidisciplinary; Statistics & Probability; Imaging Sci. & Photographic Technology; Archaeology; Medicine, Legal; Toxicology; Medical Informatics; Radiology; Nutrition & Dietetics; Agriculture, Dairy & Animal Sci. A3: Biochemical Research Methods; Medical Laboratory Technology; Reproductive Biology; Biophysics; Biotechnology & Applied Microbiology; Anatomy & Morphology; Engineering, Biomedical; Materials Sci., Biomaterials; Biochemistry & Molecular Biology; Biology; Medicine, Research & Experimental B1: Biodiversity Conservation; Oceanography; Ecology; Remote Sensing; Marine & Freshwater Biology; Limnology B2: Transportation; Social Sci., Mathematical Methods; Soil Sci.; Geosciences, Multidisciplinary; Transportation Sci. & Technology; Meteorology & Atmospheric Sci.; Water Resources; Public, Environmental & Occupational Health; Law; Environmental Studies

15 Scientometrics (2016) Volume 106, Issue 2, pp 563-581
C: Information Sci. & Library Sci.; Social Issues; Planning & Development Education; Social Sci., Interdisciplinary; Sociology; Philosophy; Ethics; History & Philosophy of Sci.; Communication; Business; Operations Research & Management Sci.; Management; Economics
D1: Materials Sci., Characterization & Testing; Engineering, Multidisciplinary; Materials Sci., Coatings & Films; Materials Sci., Composites; Physics, Applied; Physics, Condensed Matter; Chemistry, Physical; Chemistry, Multidisciplinary; Acoustics; Materials Sci., Multidisciplinary; Nanoscience & Nanotechnology; Microscopy; Robotics; Multidisciplinary Sci.; Computer Sci., Interdisciplinary Aplications; Mathematics, Interdisciplinary; Physics, Fluids & Plasmas; Physics, Multidisciplinary; Physics, Atomics, Molecular & Chemical D2: Energy & Fuels; Mineralogy; Chemistry, Inorganic & Nuclear; Engineering, Chemical; Materials Sci., Ceramics; Polymer Sci.; Materials Sci., Textiles; Crystallography; Chemistry, Applied; Education, Scientific Disciplines; Electrochemistry; Instruments & Instrumentation, Spectroscopy; Engineering, Petroleum; Engineering, Civil; Environmental Sci.; Engineering, Environmental; Engineering, Chemical; Engineering, Mechanical; Engineering, Geological; Mining & Mineral Processing; Construction & Building Technology; Nuclear Sci. & Technology; Physics, Nuclear; Metallurgy & Metallurgical Engineering; Engineering, Industrial; Mechanics; Engineering, Aerospace; Engineering, Manufacturing; Computer Sci., Information Systems; Mathematics, Applied; Physics, Mathematical; Computer Sci., Software Engineering; Optics; Engineering, Electrical & Electronic; Computer Sci., Artificial Intelligence; Computer Sci., Cybernetics; Telecommunications; Automation & Control Systems; Computer Sci., Hardware & Architecture; Computer Sci., Theory & Methods; Physics, Particles & Fields Based on the similarity of citation patterns (cited articles) we tentatively assume that it is possible to roughly delineate four groups which show some shared characteristics of the citation patterns within the group. In addition, it is possible to detect processes of integration of knowledge between certain groups. This is expressed in similar citation patterns in the groups D and A. Namely, many articles in the domain of biosciences cite the same articles as the articles published in journals which are classified with core nano-associated categories. This points to parallels between the two seemingly unconnected domains. Discussion and Conclusions
In terms of theory and methodology, nanosciences are in various respects related to several other scientific fields so it is frequently discussed whether this is a homogeneous field or just a special amalgamation of different more traditional areas of research which use a nano particle or nanoscale as a unifying common denominator. In order to explore some possibly more consistent major areas of research in this field we examined the complex relationships between citing and cited articles through schematic visualization. Similarity in citations was used as a basis for the aggregation of subject categories (WOS) into groups based on the assumption that studies derive knowledge from the different 'parts' of other knowledge. In spite of the frequently disscused deficiencies of the existing WOS classification it is invariably used in bibliometric studies (cited in previous sections). Experiments which employ this classification permit comparison of results in large data sets which corrects a considerable part of possible anomalies (Leydesdorff and Rafols, 2009).
Nano articles (journals) under study are scattered across many different subject areas (categories). Despite the seemingly haphazard scatter, it is possible to delienate a few major groups of categories which show some shared chracteristics. This can be done by using an appropriate measure of similiarity which will outline the particular distinguishing characteristics of a particular group. In our case, we have identified four such groups. In order to verify the groups, we used three different measures, interechangingly. Whereas Salton's cosine is used most frequently, the other two measures are also used. In our study, all three methods validated clusters which possess similar properties. In addition to cluster analysis we also employed Detrendend Correspondence Analysis for the purposes of visualization and exploratory confirmation of groups.
The most "important" group (cluster) is characterized by the topics pertaining to the materials science, physics and chemistry which are all related to shared chemico-physical

16 Scientometrics (2016) Volume 106, Issue 2, pp 563-581
properties of nanoparticles (nanomaterials). This group shows the lowest interdisciplinarity which means that this group predominantly employs references from similar journals and thus aggregates categories which are in a sense generically related to nanosciences. This aggregation of both physical as well as chemical aspects seems perhaps too generalized, however, some other authors who attempted a more detailed classification also noted that, in terms of citation patterns, there exist strong parallels between these fields (e.g. Porter and Youtie, 2009, Bassecoulard et al., 2007).
The four groups are not identical in size. In fact, any clustering may put different number of categories in each cluster. The first cluster thus represents the "original nanotopics" which are inreasingly tackled by other disciplines, for example medicine or biosciences. These venues of research are still less frequent, therefore producing smaller clusters. The fourth cluster of "social sciences" is the smallest yet indicating, perhaps, the social implications of nanoresearch. At this point it needs to be mentioned that our experiment is based on the existing proprietary WOS classification which favors some disciplines, for different reasons. Even though this classification has several limitations this scheme has also been used in related research providing a basis for the comparison of results. The limitations were taken into account in our initial aim to outline more inclusive broader groups.
The four groups thus obtained served as a basis for a more detailed exploration to assess interdisciplinarity inside the groups and relationships between the groups. Rao-Stirling diversity index which was employed as a metrics of such interdisciplinarity helped us to examine the topical diversity (WOS categories) of cited artices within each category which pertain to one of the four groups. Low index values indicate that both citing and cited articles are derived from similar journals.
Detectable levels of interdisciplinary exist in the groups labeled as ECO-GEO, BIO-MED, ECON-SOC, and also partly in the main nano group MAT-PHYS-CHEM. Despite lower interdisciplinary this group also shows a strong variability which indicates that individual journals (subject categories) also reference citations from such disciplines which are not necessarily related to nanosciences. However, most citing articles, and respective categories, in this group predominantly employ references from journals which are 'located' in the same or related categories. These articles thus remain confined within the more narrow framework of physics, chemistry and materials. These are apparently the more central nano-related fields where the articles are not necessariliy published in journals classified with the particular WOS category Nanoscience & Nanotechnologies. In fact, this category incorporates only a smaller part of relevant nanotopics. These limitations have also been addressed by several other authors cited in this paper. Similarity of citation patterns in this main nano group indicates that nanosciences indeed show some characteristics of a discipline on its own which is characterized by the nanoparticle and also a specific scientific apparatus.
Higher values of diversity indexes show that, in all groups, the articles in certain categories cite topics which are less related to that associated category (thus exhibiting stronger interdisciplinary characteristic). As the degree of interdisciplinarity is dependent on how detailed the classification is and on the level of aggregation of subject categories (Adams et al., 2007) we furtermore wished to explore the possible special connections, in terms of the similarity of cited articles (references), between the different groups. This was conducted by examining the data with a permuted matrix where such connections were better identified.
The citing within each respective group shows the predominance of cited articles from the same group of categories. However, we can also perceive relatedness in the citation patterns between the groups. The categories in the broader group of biology, biophysics and medicine ("bio-group") are related to the group of multidisciplinary categories, physics, chemistry, and materials ("nano-group"). Many articles in bio-categories-associated journals cite similar references as the articles in the more "central" nano-associated journals. This similarity of citation patterns between the two groups suggests possible special connections of bio- and

17 Scientometrics (2016) Volume 106, Issue 2, pp 563-581
nano-topics within the broader context of nanosciences and indicates certain integration of knowledge in the sense of bio-nano topics. The perception of interdisciplinarity depends to an important degree on classification and the respective narrower divisions. Instead of employing very detailed partitions we preferred to delineate only a few broader groups which show some shared characteristics. In addition to assessing interdisciplinarity of individual categories, we also examined interdisciplinarity of groups in order to assess relations in the groups and between the groups more clearly. We were thus able to identify those specific subgroups, in different larger groups, which are also related to each other - in terms of citing similar articles. By identifying appropriate major topics in a research discipline and possible specific links between these topics it is possible to detect some novel subject matter which integrates topics. At this point it needs to be reiterated that such conclusions are based on the existing classification schemes. The detected interactions between seemingly different topics nevertheless show that it is usefull to think outside the frame of the existing schemes. It is thus sensible that authors in different fields of science explore possibilities for a broader co-operation in areas of mutual scientific interest in order to plan scientific and technological strategies more efficiently.
Acknowledgments This work was partially supported by the Slovenian Research Agency (ARRS) Research Programme P4-0085 (D).
References
Adams, J., Jackson, L. & Marshal S. (2007). Bibliometric analysis of interdisciplinary research.
Report to the higher education funding council for England. Leeds, Evidence Ltd. Bartol, T., Stopar, K. (2015). Nano language and distribution of article title terms according to power
laws. Scientometrics, 103(2), 435-451. Bassecoulard, E., Lelu, A. & Zitt, M. (2007). Mapping nanosciences by citation flows: a preliminary
study. Scientometrics, 70(3), 859-880. Batagelj, V., Mrvar, A. (2012). Pajek. Programs for large networks analysis.
http://pajek.imfm.si/doku.php?id=pajek. Accessed 25 June 2012. Bordons, M., Morillo, F. & Gómez I. (2004). Analysis of cross-disciplinary research through
bibliometric tools. In Moed H.F., Glänzel W., Schmoch U. (Eds.). Handbook of quantitative
science and technology research (pp. 437–456). Dordrecht: Kluwer. Boyack, K.W., Klavans, R. & Börner K. (2005). Mapping the backbone of science. Scientometrics,
64(3), 351-374. Braun, T., Schubert, A., & Zsindely, S. (1997). Nanoscience and nanotechnology on the balance.
Scientometrics, 38(2), 321–325. Committee on Facilitating Interdisciplinary Research. National Academy of Sciences - (2004).
Facilitating Interdisciplinary Research. Washington, DC: National Academies Press. de Nooy, W., Mrvar, A. & Batagelj, V. (2011). Exploratory social network analysis with Pajek. 2. ed.
Cambridge, University Press. Grieneisen, M.L. & Zhang, M. (2011). Nanoscience and nanotechnology: evolving definitions and
growing footprint on the scientific landscape. Small, 7(20), 2836-2839. Hill, M.O. & Gauch H.G. (1980). Detrended correspondence analysis: an improved ordination
technique. Vegetatio, 42(1-3), 47-58. Igami, M. & Okazaki, T. (2007). Capturing nanotechnology's current state of development via
analysis of patents. STI Working paper 2007/4. Paris, OECD. Janssens, F., Zhang, L., De Moor, B. & Glänzel W. (2009). Hybrid clustering for validation and
improvement of subject-classification schemes. Information Processing & Management, 45(6), 683-702.

18 Scientometrics (2016) Volume 106, Issue 2, pp 563-581
Klavans, R. & Boyack, K. W. (2006). Identifying a better measure of relatedness for mapping science. Journal of the American Society For Information Science and Technology, 57(2), 251–263.
Leydesdorff, L. (2008). The delineation of nanoscience and nanotechnology in terms of journals and patents: a most recent update. Scientometrics, 76(1), 159-167.
Leydesdorff, L. & Rafols, I. (2009). A global map of science based on the ISI subject categories. Journal of the American Society for Information Science and Technology, 60(2), 348-362.
Leydesdorff, L. & Rafols, I. (2011). Indicators of the interdisciplinarity of journals: diversity, centrality, and citations. Journal of Informetrics, 5(1), 87-100.
Leydesdorff, L. & Zhou, P. (2007). Nanotechnology as a field of science: Its delineation in terms of journals and patents. Scientometrics, 70(3), 693–713.
Maghrebi, M., Abbasi, A., Amiri, S., Monsefi, R. & Harati, A. (2011). A collective and abridged lexical query for delineation of nanotechnology publications. Scientometrics, 86, 15–25.
Meyer, M. & Persson, O. (1998). Nanotechnology - interdisciplinarity, patterns of collaboration and differences in application. Scientometrics, 42(2), 195-205.
Mogoutov, A. & Kahane, B. (2007). Data search strategy for science and technology emergence: A scalable and evolutionary query for nanotechnology tracking. Research, 36, 893-903.
Morillo, F., Bordons, M. & Gómez, I. (2001). An approach to interdisciplinarity through bibliometric indicators. Scientometrics, 51(1), 203-222.
Moya-Anegon, F., Vargas-Quesada, B., Herrero-Solana, V., Chinchilla-Rodríguez, Z., Corera-Álvarez, E. & Munoz-Fernández, F.J. (2004). A new technique for building maps of large scientific domains based on the cocitation of classes and categories. Scientometrics, 61(1), 129-145.
Noyons, E.C.M. (2001). Bibliometric mapping of science in a science policy context. Scientometrics, 50(1), 83-98.
Noyons, E.C.M., Buter, R.K., van Raan, A.F.J., Schmoch, U., Heinze, T., Hinze, S. & Rangnow, R. (2003). Mapping excellence in science and technology across Europe: Nanoscience and Nanotechnology. Final report of project EC-PPN CT-2002-0001 to the European Commission. Leiden, Leiden University.
Oksanen, J., Guillaume Blanchet, F., Kindt, R., Legendre, P., Minchin, P.R., O'Hara, R. B., Simpson, G. L., Solymos, P., Henry M., Stevens, H., Wagner H. (2015). Package 'vegan'. http://cran.r-project.org/web/packages/vegan/vegan.pdf. Accessed 12. January 2015.
Persson, O. (2010). Bibexcel – a toolbox for bibliometricians. Inforsk, Umeå university. http://www8.umu.se/inforsk/Bibexcel/. Accessed 11 June 2012.
Porter, A.L. & Rafols, I. (2009). Is science becoming more interdisciplinary? Measuring and mapping six research fields over time. Scientometrics, 81(3), 719-745.
Porter, A.L. & Youtie, J. (2009). How interdisciplinary is nanotechnology? Journal of Nanoparticle
Research, 11(5), 1023-1041. Porter, A.L., Youtie, J., Shapira, P. & Schoeneck, D.J. (2008). Refining search terms for
nanotechnology. Journal of Nanoparticle Research, 10(5), 715-728. Rafols, I. & Meyer, M. (2007). How cross-disciplinary is bionanotechnology? Explorations in the
specialty of molecular motors. Scientometrics, 70(3), 633-650. Rafols, I., Meyer, M. (2010). Diversity and network coherence as indicators of interdisciplinarity: case
studies in bionanoscience. Scientometrics, 82(2), 263-287. Rao, C. R. (1982). Diversity and dissimilarity coefficients: A unified approach. Theoretical
Population Biology, 21, 24-43. R Development Core Team (2012). R: A language and environment for statistical computing. R
Foundation for Statistical Computing. Vienna, Austria. http://www.R-project.org. Accessed 15 June 2012.
Roco, M.C. (2002). Coherence and divergence of megatrends in science and engineering. Journal of
Nanoparticle Research, 4(1-2), 9-19. Schummer, J. (2004). Multidisciplinarity, inetrdisciplinarity, and patterns of research collaboration in
nanoscience and nanotechnology. Scientometrics, 59(3), 425-465. Stirling, A. (1994). Diversity and ignorance in electricity supply investment: addressing the solution
rather than the problem. Energy Policy, 22, 195-216. Stirling, A. (2007). A general framework for analysing diversity in science, technology and society.
Journal of the Royal Socety Interface, 4, 707-719.

19 Scientometrics (2016) Volume 106, Issue 2, pp 563-581
Ter Braak, C. J. F. (1986). Canonical correspondence analysis: a new eigenvector technique for multivariate direct gradient analysis. Ecology, 67(5), 1167–1179.
van Eck, N.J., Waltman L. (2009). How to normalize cooccurrence data? An analysis of some well-known similarity measures. Journal of the American Society for Information Science and
Technology, 60( 8), 1635-1651. van Leeuwen, T. & Tijssen, R.(2000). Interdisciplinary dynamics of modern science: Analysis of
cross-disciplinary citation flows. Research Evaluation, 9,183-187. Wagner, C.S., Roessner, J.D., Bobb, K., Thompson Klein, J., Boyack, K W., Keyton, J., Rafols, I. &
Börner, K. (2011). Approaches to understanding and measuring interdisciplinary scientific research (IDR): A review of the literature. Journal of Informetrics, 165, 14-26.
Warris, C. (2004). Nanotechnology benchmarking project. Canberra, Australian Academy of Science. Zhang, L., Liu, X., Janssens, F., Liang, L. & Glänzel W. (2010). Subject clustering analysis base on
ISI category classification. Journal of Informetrics, 4, 185-193.