circular pofysomes predominate on the rough endoplasmic
TRANSCRIPT

THE AMERICAN JOURNAL OF ANATOMY 178~1-10 (1987)
Circular Pofysomes Predominate on the Rough Endoplasmic Reticulum of Somatotropes and Mammotropes in the- Rat Anterior Pituitary A. KENT CHRISTENSEN, LARRY E. KAHN, AND CAROL M. BOURNE Department ofAnatomy and Cell Biology, The University of Michigan Medical School, Ann Arbor, Michigan 48109
ABSTRACT We have studied the shape and size distribution of membrane-bound polysomes in somato- tropes and mammotropes, which are the sources, re- spectively, of growth hormone and of prolactin in the rat pituitary. The observations were made in conven- tional electron micrographs of these cells in situ, where occasional surface or en face views of the rough endo- plasmic reticulum allow the polysomes to be seen as rows of ribosomes arranged in distinctive patterns on the membranes. It is possible by this means to charac- terize the shape and number of ribosomes for the total population of bound polysomes in the respective cell types.
The great majority of membrane-bound polysomes in these two cell types (81% in somatotropes, 78% in mam- motropes) have an approximately circular shape and contain an average of 6.8 (somatotropes) or 6.5 (mam- motropes) ribosomes, which is an appropriate size for translation of the polypeptide hormones produced by these cells. About 17% of the membrane-bound poly- somes in somatotropes and 20% in mammotropes have a spiral shape, resembling somewhat the letter “G,” and contain about eight to nine ribosomes in both cell types.
The preponderance of circular polysomes on the rough endoplasmic reticulum of somatotropes and mammo- tropes suggests the possibility that ribosomes (or the 40s ribosomal subunit) may recycle on the polysome after the translation of growth hormone or of prolactin.
INTRODUCTION In his 1955 description of ribosomes, observed by elec-
tron microscopy, Palade (1955) noted that occasional in- stances could be found in electron micrographs in which the membranes of the endoplasmic reticulum were sec- tioned tangentially (in “grazing” or en face section) rather than in usual cross sections. In these fortuitous areas the membranes of the endoplasmic reticulum were seen in surface view, and the arrangement of the ribo- somes on the membrane surface could be observed. Un- der these circumstances, the ribosomes were seen to occur in linear Series, forming consistent patterns in- cluding parallel double rows, loops, spirals, circles, and rosettes.
In the years since that original description, the litera- ture of electron microscopy has contained numerous fur- ther examples of bound polysomes seen in surface views
0 1987 ALAN R. LIYS, INC.
of the rough endoplasmic reticulum (RER). In general, the polysomes have varied considerably in size and shape, depending on the cell type and its physiological state, reflecting the diversity of proteins being produced. Of particular note are the papers by Ross and Benditt (1964), Baglio and Farber (1965), Bonnett and Newcomb (19651, Dallner et al. (1966a,b), and Palmiter et al. (1970). However, there has been no previous effort to character- ize the size distribution and shapes of the population of bound polysomes seen in electron micrographs of specific cell types that secrete a well-characterized protein. This has been the goal of the present study.
For this analysis, we have chosen two cell types of the rat anterior pituitary: the somatotrope, source of growth hormone (or somatotropin), and the mammotrope (also called lactotrope), source of prolactin. The chemistry, gene organization, messenger RNA, and synthesis of growth hormone and of prolactin are well characterized (reviewed in Seo, 1985). The rat genome contains a sin- gle gene for each of these hormones (Page et al., 1981; Cooke and Baxter, 1982), and both are thought to derive from a common ancestral gene (Seo, 1985). Rat growth hormone is a simple protein of 191 amino acids and a molecular weight of 22,000. The mRNA for the precur- sor of rat growth hormone (Seeburg et al., 1977; Page et al., 1981) has 60 untranslated nucleotides at the 5‘ end, followed by a 651-base coding region made up of 78 nucleotides translating for a 26-amino-acid signal pep- tide and 573 nucleotides coding for the hormone. There are about 102 untranslated bases before the poly4A) tail at the 3’ end. Rat prolactin has 197 amino acids, a molecular weight of 23,000, and the prehormone bears a signal peptide of 29 amino acids. Rat preprolactin mRNA (Gubbins et al., 1980; Cooke et al, 1980; Cooke and Baxter, 1982) has 51 untranslated nucleotides pre- ceding the coding region, which contains 87 bases for the signal sequence and 591 bases for the hormone. The coding region is followed by approximately 140 untran- slated nucleotides before the 3’ poly-(A) tail.
MATERIALS A N D M E T H O D S Animals and Treatments
Sprague-Dawley rats (Charles River Breeding Labo- ratories, Inc., branch office in West Portage, Michigan) were maintained on a 13-hr light and 11-hr dark regime and fed water and rat chow ad libitum. The rats were arranged in groups, as outlined below, and each rat was used to study only one cell type, either somatotrope or mammotrope.
Received February 14, 1986. Accepted September 8,1986.

2 A.K. CHRISTENSEN, L.E. KAHN, AND C.M. BOURNE
Somatotropes were studied in 30- to 45-day-old male rats (100-125gm), in which the secretion of growth hor- mone should be maximal (Eden, 1979), and also in ma- ture rats.
Mammotropes were studied in adult female rats of 200-225 gm that were either untreated or estrogen- treated or lactating. The untreated animals were fol- lowed through a t least four estrous cycles (determined by vaginal smears) in order to fix tissue for electron microscopy at 1500 hr on the day of proestrus, a time when prolactin production in the normal female rat should be maximal (Butcher et al., 1974; Poole et al., 1980a). Estrogen treatment to induce high levels of pro- lactin synthesis (Maurer and Gorski, 1977) was admin- istered by a 1-cm Silastic capsule containing a 1:15 mixture of crystalline estradiol benzoate and cholestrol, which was implanted for 7-10 days under the dorsal skin.
Electron Microscopy
The pituitary of an intact rat that had been etherized was fixed by vascular perfusion through the ascending aorta, utilizing a method modified from that of Palay et al. (1962). Brief initial perfusion with medium 199 (Gibco) was followed by a fixative consisting of 2.5% glutaraldehyde in 0.1 M s-collidine buffer a t pH 7.4 and containing 2 mM calcium chloride at a flow rate of two to three drops per second. The pituitary was removed after about 10 min of perfusion fixation, and the lateral portions of the anterior lobe were cut into small pieces which were given further immersion fixation overnight a t 4”C, followed by a buffer wash and postfixation with 1.3% osmium tetroxide in 0.07 M s-collidine buffer for 2 hr. Tissues were then dehydrated in ethanol, stained en bloc with 10% uranyl acetate in absolute methanol for 30 min, embedded in Epon-Araldite, and sectioned at silver or pale gold interference color on a Sorvall MT- 5000 ultramicrotome. Sections were usually poststained for 30 min with bismuth subnitrite (Locke and Huie, 1977) to enhance the staining of ribosomes and were examined with either a Philips 201 or a Philips 400 electron microscope. Electron micrographs to be used for counting were taken at x 12,500-16,500 initial magnifi- cation and enlarged photographically to about x 35,000
The procedure varied somewhat over the course of the study, but was generally as follows: two to three blocks for electron microscopy were used from each pituitary. Several sections cut from a block were mounted on a grid, and from one to five electron micrographs each were taken of four to ten of the particular cell type under study in that pituitary. Prints of the electron micro- graphs were studied, and one print each from four to six cells was chosen for final counting, on the basis of the number and quality of available polysome surface views. The surface views were generally infrequent, with only small areas occurring here and there in a cell. The large area of polysome surface views shown in Figure 2 was unusual. The occurrence of polysome surface views is inherently random, since they are found only where the plane of the RER membrane happens to lie approxi- mately in the plane of the section.
Measurements of polysomal and ribosomal size were made on photographic prints a t ~ 9 0 , 0 0 0 total magnifi- cation with a x 7 magnifying glass fitted with a 20-mm reticle graduated at 0.1-mm intervals (Bausch & Lomb, Rochester, NY).
Polysome Counts and Analysis Since it may not be clear to all readers how polysome
surface views occur in conventional electron micro- graphs, the nature of these surface views is shown dia- grammatically in Figure l .
Included in Table 1 is information on the number of animals used for counts in each of the groups (total- ling 14 rats for somatotropes and nine rats for mammo- tropes) and the number of polysomes counted (a total of 2,478 for somatotropes and 1,994 for mammotropes).
To count the number of ribosomes per polysome in micrographs of the present study, a clear cellulose acetate overlay was placed over an electron micrograph that showed polysome surface views. Those bound poly- somes that appeared complete were circled on the over- lay with a colored felt pen. The number of ribosomes in the polysome was written adjacent to it. Different colors were used for the various polysomal shapes (circular “0” and “C,” spiral “G” and other; see Results). Some of the counts were repeated independently by a second individual using a separate sheet of cellulose acetate as
Table 1. Number of ribosomes per polysome in somatotropes and mammotropes
Circular “0” Circular “C” Spiral “G’ Cell type No. of (ribosomes/polysome) (ribosomes/polysome) (ribosomes/polysome) and No. of polysomes Mean Mean Mean treatment animals counted Percent Peak (+ SD) Percent Peak (+ SD) Percent Peak ( 5 SD)
Somatotropes 33-42-day 11 2,108 39 7 7.3 38 7 6.7 21 8 8.5
Adult 3 370 45 7 6.9 40 6 6.5 13 7 8.3 ( 5 1.0) (+ 1.0) (* 1.2)
( 5 1.1) (* 1.1) (+ 1.5) Mammotropes
Normal 3 811 52 6 6.7 27 6 6.3 20 8 8.5
Estrogen 3 803 43 7 6.7 33 6 6.4 23 8 8.2
Lactating 3 380 45 7 6.6 35 6 6.2 18 8 7.8
proestrus (* 0.9) (* 1.0) (+ 1.5)
implant (+ 1.0) (+ 1.1) (+ 1.4)

CIRCULAR POLYSOMES IN PITUITARY CELLS 3
V i e w e d f r o m a b o v e i n e l e c t r o n m i c r o s c o p e
P o r t i o n o f a n E M S e c t i o n 1 1 1 1 . . . . .
cross section
membrane (seen \: 1. . . . .
. . . . . . . . . . . . . . . . .
edge on)
. . . . . . * . . . . . . . . . . . . . . . . . . . . . . . . . . . . . . . . . .
‘ . . . . . . . . . . . . . . : , ..:.
. . . . . . .
. . . . . .
. . . . . . . . . . . . . . . . . . . ’ * . .
ta&enti& section
. . . . . . . . . . . . . . . . . . . .
. . . . . . . . . . . . . . . . . . . . . .
:. . . . . . . . . . . . . . . . . . . .. . . . . : . . . .
~olysome in surface view imomplete polysome A p p e a r a n c e i n E l e c t r o n M i c r o g r a p h
fig. 1. Diagram showing the nature of surface views of rough endo- plasmic reticulum (RER) used in the present study. At the top is a small portion of a plastic EM section which contains portions of two RER cisternae. The lower part of the drawing illustrates the appear- ance that these cisternae would have in electron micrographs. The cisterna at left is cut in cross section, and so the RER membranes are seen edge-on in the final electron micrograph. This is the familiar picture of the RER, with two membranes enclosing a lumen and the cytoplasmic surfaces of the membranes studded with ribosomes. The cisterna at right is oriented very obliquely and constitutes a tangential
a “blind” check. For occasional polysomes for which these parallel counts differed (seldom by more than one ribosome), a n average value was used. For tabulation and appropriate statistical analyses, the final counts were entered into the Michigan Interactive Data Analysis System (MIDAS) (Fox and Guire, 19761, avail- able through the central computer facility of the Univer- sity of Michigan.
In making ribosomal counts in polysomes, it is impor- tant to avoid errors that result from the three-dimen- sional arrangement of the RER membranes in the sections (see Fig. 1). Polysomes may occur on the mem-
or grazing section of the membranes. In electron micrographs, these membranes appear in surface or en face view as gray areas. The polysomes consist of characteristic arrays of ribosomes, and the num- ber of ribosomes per polysome can be counted. Polysomes situated where the membrane passes out of the plane of section may he incom- plete. In some areas, the two membranes of an RER cisterna may overlap, with superimposition of polysomes, making it difficult to in- terpret the individual polysomes. The polysomal mRNA, although present, is not usually visible.
brane as it passes out of the plane of section, and it thus is common for one or more ribosomes on one side of a polysome to be missing at the edge of the visible mem- brane. This problem can be avoided by counting only those polysomes that are within the gray membrane areas, or which otherwise appear to be complete. An- other problem of interpretation may arise when there is an overlapping of the two membranes of an RER cis- terna, both included in the thickness of the section. The nature of this overlapping is illustrated at right in Fig- ure 1. Viewed from above, there is a narrow zone in which polysomes from the upper and lower membranes
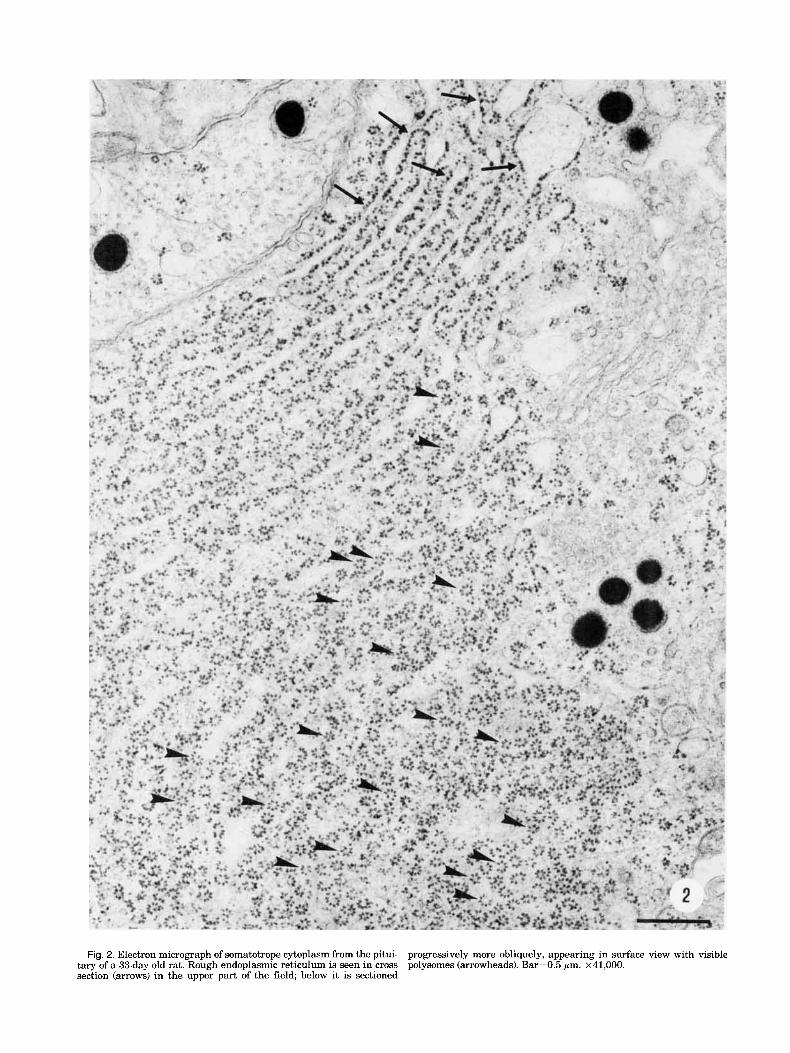
Fig. 2. Electron micrograph of somatotrope cytoplasm from the pitui- tary of a 33-daydd rat. Rough endoplasmic reticulum is seen in cross section (arrows) in the upper part of the field; below it is sectioned
progressively more obliquely, appearing in surface view with visible polysomes (arrowheads). Bar=0.5 pm. ~41,000.

CIRCULAR POLYSOMES IN PITUITARY CELLS 5
may be superimposed, producing a composite ribosomal group that may be difficult to interpret. Occasional po- lysomes that were thought to be composites of this sort were excluded from counts in the present study.
RESULTS The ultrastructure of somatotropes and mammotropes
in the present study resembles that described by others for the rat pituitary (Kurosumi, 1968; Farquhar, 1971; Moriarty, 1973). The rough endoplasmic reticulum (RER) generally consists of extensive and regularly arranged stacks of flattened cisternae that occupy considerable areas of the cytoplasm. The RER cisternae of mammo- tropes were often somewhat dilated in our material and were therefore less favorable for surface views than the RER in somatotropes.
An electron micrograph of somatotrope cytoplasm (Fig. 2) illustrates the appearance of RER cisternae cut in various planes of section. In the upper portion of the micrograph, the cisternae appear in familiar cross sec- tions characterized by distinct ER membranes with ri- bosomes arranged along their cytoplasmic surface. As one observes successive cisternae lower in the micro- graph, the plane of section of the RER becomes progres- sively more oblique until the lower half of the micrograph shows mostly surface views of the RER membranes on which can be seen numerous polysomes. Each consists of a row of ribosomes arranged in a dis- tinctive pattern.
Most of the polysomes seen in surface views of the RER in somatotropes and mammotropes exhibit a cir- cular shape; others have a spiral form (Fig. 3). Further examples of these polysomal forms as they are seen in electron micrographs of the two cell types are shown in Figure 4. Polysomes in surface view may show some distortion, and it is difficult to know how much of this may be normal variation or to what extent it may be caused by processing for electron microscopy.
Circular Polysomes Circular polysomes (Figs. 3,4) commonly consist of six
or seven ribosomes arranged approximately equidistant from one another in a circle, resembling the letter “0.” There may be a somewhat wider space between ribo- somes on one side, causing the polysome to resemble a letter “C.” The radius of a circle circumscribing the outermost tips of the ribosomes in circular polysomes averages 40.4 (k0.3 SEMI nm. The shape is sometimes oval rather than circular. This may be a natural varia- tion of the circular polysome, or it could result from a circular polysome being viewed obliquely due to the sloping orientation of the membranes in the section (Fig. 1). It is difficult to define a center-to-center distance between ribosomes in circular polysomes because the radial orientation of the ribosomes causes the outer ends of adjacent ribosomes to be farther apart than the inner ends.
Spiral Polysomes The spiral polysome (Figs. 3,4) consists of about eight
or nine ribosomes, arranged in a broad half-circle, with a ribosome at one of the ends commonly extending sharply inward toward the center of the polysome, re- sembling the bar of the letter “G.” There is often a slender strand passing between ribosomes in the bar.
Fig. 3. Diagrams of circular and spiral polysomes, the predominant forms seen in surface views of the RER in somatotropes and mammo- tropes. The dotted lines indicate the usual position of occasional slen- der strands extending between ribosomes, which could represent the mRNA, possibly covered with coalesced protein (Martin and Miller, 1983). Inset: Electron micrograph of part of a polysome, illustrating some of the features shown in the drawings including the strands (arrowheads) between ribosomes. Bar=BOnm. x 232.000.
Since a larger spiral of different nature is seen on rare occasion in these cell types (see below), we will designate this more common and distinctive type as the “G’ spiral.
Other Polysomal Forms The population of bound polysomes in somatotropes
and mammotropes is rather homogeneous compared to that of some other cell types, such as liver, that produce a broader range of proteins for export (Palade, 1955, 1975; Baglio and Farber, 1965; Dallner et al., 1966a,b). However, larger and more elaborate polysomes are seen occasionally. Some of these unusual forms are illus- trated in Figure 4. Among the forms are large spirals with 17-21 ribosomes and loops shaped like hairpins. These larger figures should be considered with some caution, since cross sections of small RER cisternae can sometimes resemble surface views of polysomes.
General Features of Polysomes in Surface Views The detailed appearance of the individual ribosomes
in the polysomes observed here varies considerably Fig. 4). This is probably due in part to vagaries of fixation and staining, but it may also result from the fact that ribosomes are observed in diverse orientations, depend- ing on the slope of the RER membrane in the EM section (Fig. 1). Occasional ribosomes exhibit hints of structural details that have been described for isolated, negatively stained, eukaryotic ribosomes (Boublik and Hellman, 1978). However, we have not attempted to characterize the variations or infrequent details but will merely de- scribe the general features of ribosomes and the interri- bosomal strands that can be seen in our material.
The ribosomes that make up polysomes seen in surface view (Figs. 3,4) are consistently oblong in shape, aver- aging 25.3 (k0.2 SEM) nm in length and 14.8 (+0.2) nm in width, with the long axis oriented perpendicular to

6 A.K. CHRISTENSEN, L.E. KAHN, AND C.M. BOURNE
the probable path of the polysomal mRNA. The inner end of the ribosome, directed toward the center of the polysome, is commonly thicker than the outer end, al- though there is considerable variation. We did not ob- serve clear-cut subdivisions of the ribosomes that might be interpreted as subunits, as have been described for plant polysomes observed in surface view (Bonnett and Newcomb, 1965).
Sometimes a slender strand is visible connecting ad- jacent ribosomes in the polysomes (inset, Fig. 3; also see Fig. 4). This strand usually meets the ribosome near its inner end (directed toward the center of the polysome) and commonly lies about one-quarter to one-third of the ribosomal length from that end. Although the nature of the strand is uncertain, its orientation suggests that it might be the polysomal mRNA, perhaps appearing thicker because of coalesced protein (Martin and Miller, 1983).
Counts of Ribosomes per Polysome Counts of ribosomes in surface views of polysomes
provide a size distribution for the total population of
Circular
membrane-bound polysomes in somatotropes and in mammotropes. Table 1 gives the number of ribosomes per polysome of circular and spiral types in somato- tropes and mammotropes of the various groups. These data are shown graphically in Figure 5A for somato- tropes and in Figure 5B for mammotropes. Although we consider the circular “C” polysome to be a variant of the circular “0” polysome, the two were analyzed sepa- rately for the data shown in Table l. They were pooled for the graphs in Figure 5. The circular polysome consti- tutes the great majority of bound polysomes in both cell types, constituting an average of 81% of polysomes in somatotropes and 78% in mammotropes. The number of ribosomes in circular polysomes is essentially the same in the two cell types, both showing a peak at six to seven ribosomes, with a striking drop beyond eight ribosomes.
The spiral polysome makes up approximately 17% of the population of bound polysomes in somatotropes and 20% in mammotropes and shows a peak for ribosome number at about eight to nine ribosomes for both cell types. The percentage of spiral “G’ polysomes may be overestimated, since circular polysomes of equivocal ap-
Spiral ”G’’ Other
Fig. 4. Examples of representative circular, spiral, and other poly- somes, from electron micrographs of somatotropes and mammotropes. Bar=100 nm. X90,OOO.

CIRCULAR POLYSOMES IN PITUITARY CELLS 7
700
600 v, w 0
g 500 a 3 8 400 0
B 300 a w rn I 200 3 z
loo
pearance, resulting from distortion or passing out of the plane of section, can be mistaken for "G' forms.
Other polysomal forms (Fig. 4) constitute only 1-2% of the observed population and so are not shown in either Table 1 or Figure 5. It may be noted, however, that the number of large polysomes may be underestimated, since they are more likely to go out of the plane of section, because of their size, and would then be uninterpretable and thus excluded from the counts.
The polysome counts in somatotropes did not suggest any substantial variation in the results between mature animals and the 30-40-day-olds, in which the somato- tropes are maximally active (Eden, 1979); and we there- fore pooled the data for graphic presentation in Figure 5A. Similarly, our counts for mammotropes did not re- veal clear-cut differences between normal, estrogen- treated, and lactating animals; and so Figure 5B also represents pooled data. Our main interest in this study has been with the overall pattern of polysome shapes and sizes in the two cell types and not with possible hormonal effects. We have therefore not carried out sta- tistical analyses to see if slight differences between the experimental groups are significant.
DISCUSSION This study shows that approximately 80% of the mem-
brane-bound polysomes in somatotropes and mammo- tropes have a circular shape as seen in surface views of RER membranes. It seems likely that a majority of these circular polysomes are producing pregrowth hormone and preprolactin in the respective cell types, since we would expect bound polysomes for the preponderant se- cretory product of these cells to be abundant on the membranes of the RER. The number of ribosomes in the circular polysomes averages six to seven, which is an appropriate size (Staehelin et al., 1964) for the produc-
I-
-
-
-
-
-
-
-
i -\
-L 1
SOM ATOTROPES
tion of pregrowth hormone and preprolactin. The ribo- somal counts for circular polysomes in mammotropes of this study (Fig. 5B) are consistent with biochemical re- sults (Maurer, 1980) for rat pituitary polysomes isolated on a sucrose gradient after immunoprecipitation with 1251-labelled antiprolactin, which showed a peak of five to eight ribosomes for the labeled polysomes.
Circular polysomes similar to those that predominate in the somatotropes and mammotropes of the present study have also been described in other cell types (Pa- lade, 1955, 1975; Dallner et al., 1966a,b).
Geometric considerations suggest that the mRNA in circular polysomes is not fully extended. If the extended 651-nucleotide coding region of the mRNA for pregrowth hormone, for example, were arranged in a circle, then, assuming 0.34 nm per nucleotide (Warner et al., 1962), the circumference of the circle would be about 220 nm and the radius would be approximately 35 nm. This radius would come within 5 nm of the outermost tips of the ribosomes in the average circular polysome, which would seem unlikely if the observed strands connecting more proximal parts of adjacent ribosomes indeed rep- resent the path of the mRNA. There is evidence that mRNA is normally somewhat contracted (see Martin and Miller, 1983), presumably due to protein-induced folding or internal base pairing. Assuming that the in- terribosomal strands sometimes seen in our material represent the mRNA, then the geometric reasoning de- scribed above would suggest that the contraction of mRNA in circular polysomes of the present study is about 1.6-fold. Of course, we cannot exclude the possibil- ity that preparation for electron microscopy has some effect on polysome size.
The basis for the shape of bound polysomes has been of interest for many years. Some of the early models for the organization of bound polysomes (Sabatini and Krei-
700 - 600 -
Y) W 0 5 SO0 - a a 3 0 400 - 0 0
8 300 - a w
3 z g 200 -
100 -
MAMMOTROPES
"G" \ { , , ,
0 4 6 8 10 12 14 B NUMBER OF RIBOSOMES/POLYSOME
Fig. 5. Graphs showing the size distribution of circular and of spiral polysomes in somatotropes (A) and mammotropes (B) of the rat anterior pituitary.

8 A.K. CHRISTENSEN, L.E. KAHN, AND C.M. BOURNE
poly(A) tail 3’ untranslated region
Fig. 6. Schematic drawing of a circular polysome, showing the possi- ble arrangement of the mRNA. The mRNA is drawn in fully extended form, causing the ribosomes to be more widely spaced than those seen in the electron micrographs (see Discussion). The relative size of the ribosomes and various segments of the mRNA are drawn to scale, based on a length of about 220 nm for the 651-nucleotide coding region of pregrowth hormone mRNA, assuming 0.34 nm per nucleotide (War- ner et al., 1962). A ribosome has almost reached the 3’ termination codon, and the 5’ AUG site is available for initiation. The 3’ untran-
bich, 1976) were influenced by evidence from cultured cells that the mRNA at or near the poly-(A) tail at the 3’ end of the mRNA was tightly bound to the membrane and perhaps embedded in it (Milkarek and Penmann, 1974; Lande et al., 1975). It was later found, however (Kruppa and Sabatini, 1977), that comparable binding could not be demonstrated in cells from organs such as the liver. The basis for the shape of membrane-bound polysomes has yet to be explained, although it would be anticipated that the characteristics of the mRNA would play an important role in determining the shape.
Possible Significance of Circular Polysomes The possible arrangement of the messenger RNA in a
circular polysome is shown in Figure 6. The mRNA and the ribosomes are drawn to relative scale, based on the d N A of pregrowth hormone and a length of 0.34 nm per nucleotide (Warner et al., 1962). The mRNA is por- trayed in extended (rather than contracted) form, and the ribosomes are therefore separated more widely than in the electron micrographs. The untranslated regions of mRNA are also drawn to scale, and the 5‘ noncoding region is portrayed both with and without possible sec- ondary structure (Cooke et al., 1980). The presence of
termination codon
I ‘-5’ end Cflregion extended)
slated region and poly<A) tail extend to the right. The 5‘ untranslated region, lying between the 5’ end and the initiation codon, is drawn in two different forms (see inset): in extended form (dashed line) and with possible secondary structure (solid line) postulated for rat preprolactin mRNA (Cooke et al., 1980). Note that as a ribosome passes the termi- nation codon, it would again be adjacent to the 5‘ end of the mRNA, which suggests the possibility that ribosomes (or 40s subunits) might recycle on the polysome.
50-60 untranslated nucleotides at the 5‘ end of the message could bring the 5’ terminus near the 3’ termi- nation codon, in a favorable position to interact with the ribosome as it completes translation. This proximity might allow the ribosome (or 40s subunit) to recycle directly onto the 5’ end of the message to begin a new round of protein synthesis. Kozak (1984) has demon- strated that ribosomes are capable of scanning beyond a termination codon and that they can begin translation at a new initiation codon downstream from a termina- tion. Kozak concluded that one consequence of these findings was “the possibility of recycling 40s ribosomal subunits back to the 5’-end of the message that has just been translated.” The predominance of circular poly- somes of appropriate size in somatotropes and mammo- tropes raises the possibility that a mechanism for recycling ribosomes on the polysomes may exist in the synthesis of growth hormone and prolactin.
Recycling, if it takes place, might involve only the 40s subunit, or a combination of both 40s and 60s subunits. If the 60s subunit, which is already attached to the membrane, were included, then this would make it un- necessary to carry out the elaborate ribosomal attach- ment mechanism (Hortsch and Meyer, 1984) that

CIRCULAR POLYSOMES IN PITUITARY CELLS 9
otherwise is necessary for each new ribosome. The 60s subunit might remain linked to the 40s subunit during recycling, or might dissociate from it but remain bound to the RER membrane long enough to be available when the 40s subunit reached the initiation codon (Kozak, 1983).
Spiral Polysomes The spiral “G” polysomes in somatotropes and mam-
motropes average about eight to nine ribosomes and are thus somewhat larger than the circular form, averaging six to seven ribosomes. It is not clear which end of the polysome constitutes the 5’ end of the mRNA and which is 3’. The shape of the spiral polysome would place the two ends of the mRNA some distance from one another, and so ribosomal recycling would not be postulated for this polysomal type.
Spiral “G’ polysomes, as well as some of the circular polysomes and larger types, would presumably be in- volved in synthesizing other proteins that are produced in small quantities by bound polysomes on the RER of somatotropes and mammotropes. These would include a variety of secretory and integral membrane proteins involved in the process of secretion or in other needs of the cell (Palade, 1975; Sabatini and Kreibich, 1976; Far- quhar, 1977; Sabatini et al., 1982). For example, lysoso- ma1 enzymes constitute a substantial transported product of the RER in these pituitary cells and play an important role in the disposal of unused secretory gran- ules (Smith and Farquhar, 1966).
The Concentration of Polysomes Within the Cells In an electron microscopic morphometric study of pi-
tuitary mammotropes over the estrous cycle in female rats, Poole et al. (1980b) showed that the total surface area of RER membranes per cell varied from about 500 pm2 to a proestrous peak of 1,161 (+115 SEMI pm2. In the present study it was not possible to obtain an exact count of polysome density on the RER membranes by using methods such as planimetry or image analysis because of the variable obliquity of the membranes within the section, difficulties in tracing exact mem- brane boundaries, and other problems. However, rough counts consistently yielded an approximation of about 50 bound polysomes per pm2 of surface area on RER membranes in both somatotropes and mammotropes. This figure, together with the morphometric data of Poole et al. (1980b) mentioned above, would suggest that the total number of bound polysomes in a mammotrope cell might reach approximately 60,000 during the es- trous cycle in a female rat.
ACKNOWLEDGMENTS We appreciate the expert technical assistance of Ur-
sula Reuter during part of this project. We are also indebted to the late Dr. Tung-Yang Wing for valuable early help in data entry and statistical analysis using the MIDAS program in the central computer of the University of Michigan. Roberta Kay Brabec gave valu- able help during the preparation of the manuscript.
This work was supported by N.I.H. research grant HD- 03159 and in part by grant HD-11311. Part of this work appeared earlier in abstract form (A.K. Christensen and L.E. Kahn, 1980, J. Cell Biol. 87:302a).
LITERATURE CITED Baglio, C.M., and E. Farber 1965 Correspondence between ribosome
aggregation patterns in rat liver homogenates and in electron micrographs following administration of ethionine. J. Mol. Biol., 12:466467.
Bonnett, H.T., Jr., and E.H. Newcomb 1965 Polyribosomes and cister- nal accumulations in root cells of radish. J . Cell Biol., 27:423-432.
Boublik, M., and W. Hellmann 1978 Comparison of Artemia salina and Escherichia coli ribosome structure by electron microscopy. Proc. Natl. Acad. Sci. USA, 752829-2833,
Butcher, R.L., W.E. Collins, and N.W. Fugo 1974 Plasma concentration of LH, FSH, prolactin, progesterone and estradiol-17B throughout the 4-day estrous cycle of the rat. Endocrinology, 94:1704-1708.
Cooke, N.E., and J.D. Baxter 1982 Structural analysis of the prolactin gene suggests a separate origin for its 5’ end. Nature, 297:603- 606.
Cooke, N.E., D. Coit, R.I. Weiner, J.D. Baxter, and J.A. Martial 1980 Structure of cloned DNA complementary to rat prolactin messen- ger RNA. J. Biol. Chem., 255:6502-6510.
Dallner, G., P. Siekevitz, and G.E. Palade 1966a Biogenesis of endo- plasmic reticulum membranes. I. Structural and chemical differ- entiation in developing rat hepatocyte. J. Cell Biol., 30:73-96.
Dallner, G., P. Siekevitz, and G.E. Palade 196613 Biogenesis of endo- plasmic reticulum membranes. 11. Synthesis of constitutive micro- soma1 enzymes in developing rat hepatocyte. J . Cell Biol., 30:97- 117.
Eden, S. 1979 Age and sex-related differences in episodic growth hor- mone secretion in the rat. Endocrinology, 105t555-560.
Farquhar, M.G. 1971 Processing of secretory products by cells of the anterior pituitary gland. Mem. Soc. Endocrinol., No. 19, pp. 79- 124.
Farquhar, M.G. 1977 Secretion and crinophagy in prolactin cells. In: Comparative Endocrinology of Prolactin. H.-D. Dellmann, J.A. Johnson, and D.M. Klachko, eds. Plenum Press, New York, pp. 37- 94.
Fox, D.J., and K.E. Guire 1976 Documentation for MIDAS, 3rd ed. Statistical Research Laboratory, the University of Michigan, Ann Arbor.
Gubbins, E.J., R.A. Maurer, M. Lagrimini, C.R. Erwin, and J.E. Donel- son 1980 Structure of the rat prolactin gene. J. Biol. Chem., 2553655-8662.
Hortsch, M., and D.I. Meyer 1984 Pushing the signal hypothesis: What
Kozak, M. 1983 Comparison of initiation of protein synthesis in procar- are the limits? Biol. Cell, 52:l-8.
yotes, eucaryotes, and organelles. Microbiol. Rev., 47:l-45. Kozak, M. 1984 Selection of initiation sites by eucaryotic ribosomes:
Effect of inserting AUG triplets upstream from the coding se- quence for preproinsulin. Nucleic Acids Res., I2t3873-3894.
Kruppa, J., and D.D. Sabatini 1977 Release of poly A(+) messenger RNA from rat liver rough microsomes upon disassembly of bound polysomes. J . Cell Biol., 74~414-427.
Kurosumi, K. 1968 Functional classification of cell types of the ante- rior pituitary gland accomplished by electron microscopy. Arch. Histol. Jpn., 29:329-362.
Lande, M.A., M. Adesnik, M. Sumida, Y. Tashiro, and D.D. Sabatini 1975 Direct association of messenger RNA with microsomal mem- branes in human diploid fibroblasts. J . Cell Biol., 65513-528.
Locke, M., and P. Huie 1977 Bismuth staining for light and electron microscopy. Tissue Cell, 9:347-371.
Martin, K.A., and O.L. Miller, Jr. 1983 Polysome structure in sea urchin eggs and embryos: An electron microscopic analysis. Dev. Biol., 98:338-348.
Maurer, R.A. 1980 Immunochemical isolation of prolactin messenger RNA. J. Biol. Chem., 255854459,
Maurer, R.A., and J. Gorski 1977 Effects of estradiol-17B and pimozide on prolactin synthesis in male and female rats. Endocrinology, 10136-84.
Milkarek, C., and S. Penmann 1974 Membrane-bound polyribosomes in HeLa cells: Association of polyadenylic acid with membranes. J. Mol. Biol., 89:327-338.
Moriarty, G.C. 1973 Adenohypophysis: Ultrastructural cytochemistry, a review. J . Histochem. Cytochem., 21t855-894.
Page, G.S., S. Smith, and H.M. Goodman 1981 DNA sequence of the rat growth hormone gene: Location of the 5‘ terminus of the growth hormone mRNA and identification of an internal transposon-like element. Nucleic Acids Res., 9~2087-2104.
Palade, G.E. 1955 A small particulate component of the cytoplasm. J. Biophys. Biochem. Cytol., 1:59-68.
10 A.K. CHRISTENSEN, L.E. KAHN, AND C.M. BOURNE
Pala.de, G.E. 1975 Intracellular aspects of the process of protein synthe- sis. Science, 189:347-358.
Palay, S.L., S.M. McGee-Russell, S. Gordon, and M.A. Grill0 1962 Fixatin of neural tissues for electron microscopy by perfusion with solutions of osmium tetroxide. J . Cell Biol., 12t385-410.
Palmiter, R.D., A.K. Christensen, and R.T. Schimke 1970 Organization of polysomes from pre-existing ribosomes in chick oviduct by a secondary administration of either estradiol or progesterone. J . Biol. Chem., 245:833-845.
Poole, M.C., V.B. Mahesh, and A. Costoff 1980a Intracellular dynamics in pituitary mammotropes throughout the rat estrous cycle. I. Morphometric methodology and hormonal correlations with cellu- lar and nuclear volumes. Am. J. Anat., L58:3-13.
Poole, M.C., V.B. Mahesh, and A. Costoff 1980b Intracellular dynamics in pituitary mammotropes throughout the rat estrous cycle. 11. Changes in synthetic and secretory organelles. Am. J. Anat., 158:15-28.
Ross, R., and E.P. Benditt 1964 Wound healing and collagen formation. IV. Distortion of ribosomal patterns of fibroblasts in scurvy. J. Cell Biol., 22~365-389.
Sabatini, D.D., and G. Kreibich 1976 Functional specialization of mem- brane-bound ribosomes in eukaryotic cells. In: The enzymes of
Biological Membranes. A. Martonosi, ed. Plenum, New York, vol. 2, pp. 531-579.
Sabatini, D.D., G. Kreibich, T. Morimoto, and M. Adesnik 1982 Mech- anisms for the incorporation of proteins in membranes and organ- elles. J . Cell Biol., 92:l-22.
Seeburg, P.H., J . Shine, J.A. Martial, J.D. Baxter, and H.M. Goodman 1977 Nucleotide sequence and amplification in bacteria of struc- tural gene for rat growth hormone. Nature, 270:486-494.
Seo, H. 1985 Growth hormone and prolactin-Chemistry, gene organi- zation, biosyntheses, and regulation of gene expression. In: Pitui- tary Gland. Comprehensive Endocrinology. H. Imura, ed. pp. 57- 82.
Smith, R.E., and M.G. Farquhar 1966 Lysosome function in the regu- lation of the secretory process in cells of the anterior pituitary gland. J. Cell Biol., 31:319-347.
Staehelin, T., F.O. Wettstein, H. Oura, and H. Knoll 1964 Determina- tion of the coding ratio based on molecular weight of mes.wnger ribonucleic acid associated with ergosomes of different aggregate size. Nature, 201:264-270.
Warner, J.R., A. Rich, and C.E. Hall 1962 Electron microscope studies of ribosomal clusters synthesizing hemoglobin. Science, 138:1399- 1403.