circuits of potential diagnostic utility
TRANSCRIPT
cancers
Article
Neuroendocrine Neoplasms: Identification of Novel MetabolicCircuits of Potential Diagnostic Utility
Beatriz Jiménez 1,2,† , Mei Ran Abellona U 1,2,† , Panagiotis Drymousis 1, Michael Kyriakides 1, Ashley K. Clift 1,Daniel S. K. Liu 1 , Eleanor Rees 1, Elaine Holmes 2,3, Jeremy K. Nicholson 3,4, James M. Kinross 1
and Andrea Frilling 1,*
�����������������
Citation: Jiménez, B.; Abellona U,
M.R.; Drymousis, P.; Kyriakides, M.;
Clift, A.K.; Liu, D.S.K.; Rees, E.;
Holmes, E.; Nicholson, J.K.; Kinross,
J.M.; et al. Neuroendocrine
Neoplasms: Identification of Novel
Metabolic Circuits of Potential
Diagnostic Utility. Cancers 2021, 13,
374. https://doi.org/10.3390/
cancers13030374
Received: 29 October 2020
Accepted: 14 January 2021
Published: 20 January 2021
Publisher’s Note: MDPI stays neutral
with regard to jurisdictional claims in
published maps and institutional affil-
iations.
Copyright: © 2021 by the authors.
Licensee MDPI, Basel, Switzerland.
This article is an open access article
distributed under the terms and
conditions of the Creative Commons
Attribution (CC BY) license (https://
creativecommons.org/licenses/by/
4.0/).
1 Department of Surgery and Cancer, Imperial College London, Exhibition Road, London SW7 2AZ, UK;[email protected] (B.J.); [email protected] (M.R.A.U.); [email protected] (P.D.);[email protected] (M.K.); [email protected] (A.K.C.);[email protected] (D.S.K.L.); [email protected] (E.R.); [email protected] (J.M.K.)
2 Department of Metabolism, Nutrition and Reproduction, Imperial College London, Exhibition Road,London SW7 2AZ, UK; [email protected]
3 The Australian National Phenome Centre, Health Futures Institute, Murdoch University,Perth 6150, Australia; [email protected]
4 Institute for Global Health Innovation, Imperial College London, Exhibition Road, London SW7 2AZ, UK* Correspondence: [email protected]; Tel.: +44-(0)-20-3313-1000† These authors contributed equally to the manuscript.
Simple Summary: Neuroendocrine neoplasms (NEN) are rare tumours, and currently available,mono-analyte biomarkers for diagnosis and prognosis have poor predictive and prognostic accuracy.Metabolic profiling has been applied to several cancer types, but the systemic metabolic consequencesof NEN have not yet been well studied. Here, we demonstrate, in a treatment-naïve cohort of patientswith NEN, that several metabolites are dysregulated in NEN and this is detectable in urine, due tochanges in cancer metabolic processes, neuroendocrine signalling molecules and the gut mirobiome.This may have relevance for novel diagnostic biomarkers.
Abstract: The incidence of neuroendocrine neoplasms (NEN) is increasing, but established biomark-ers have poor diagnostic and prognostic accuracy. Here, we aim to define the systemic metabolicconsequences of NEN and to establish the diagnostic utility of proton nuclear magnetic resonancespectroscopy (1H-NMR) for NEN in a prospective cohort of patients through a single-centre, prospec-tive controlled observational study. Urine samples of 34 treatment-naïve NEN patients (median age:59.3 years, range: 36–85): 18 had pancreatic (Pan) NEN, of which seven were functioning; 16 hadsmall bowel (SB) NEN; 20 age- and sex-matched healthy control individuals were analysed usinga 600 MHz Bruker 1H-NMR spectrometer. Orthogonal partial-least-squares-discriminant analysismodels were able to discriminate both PanNEN and SBNEN patients from healthy control (Healthyvs. PanNEN: AUC = 0.90, Healthy vs. SBNEN: AUC = 0.90). Secondary metabolites of tryptophan,such as trigonelline and a niacin-related metabolite were also identified to be universally decreased inNEN patients, while upstream metabolites, such as kynurenine, were elevated in SBNEN. Hippurate,a gut-derived metabolite, was reduced in all patients, whereas other gut microbial co-metabolites,trimethylamine-N-oxide, 4-hydroxyphenylacetate and phenylacetylglutamine, were elevated inthose with SBNEN. These findings suggest the existence of a new systems-based neuroendocrinecircuit, regulated in part by cancer metabolism, neuroendocrine signalling molecules and gut mi-crobial co-metabolism. Metabonomic profiling of NEN has diagnostic potential and could be usedfor discovering biomarkers for these tumours. These preliminary data require confirmation in alarger cohort.
Keywords: neuroendocrine neoplasms; neuroendocrine tumours; biomarkers; nuclear magneticresonance; metabolic profiling; metabonomics; precision medicine
Cancers 2021, 13, 374. https://doi.org/10.3390/cancers13030374 https://www.mdpi.com/journal/cancers
Cancers 2021, 13, 374 2 of 16
1. Introduction
Neuroendocrine tumours, recently reclassified as neuroendocrine neoplasms (NEN),were historically regarded as rare entities and arise from the gastroenteropancreatic sys-tem in about 70% of cases. Multiple epidemiological studies have described a steadilyincreasing incidence [1,2] and NEN frequently present with distant metastases at the initialdiagnosis [3]. Fewer than 20% of patients with distantly metastatic (stage IV) NEN arecandidates for surgery with curative intent. Currently, effective treatment options for “non-surgical” patients with advanced tumours are limited, and although novel modalities havebeen demonstrated to improve progression-free survival in randomised clinical trials [4–7],ramifications in terms of improved overall survival are yet to be identified [8]. Standardtumour markers for neuroendocrine disease include the neurosecretory peptides chromo-granins A and B (CgA, CgB) and a panel of cell-type-specific secretory products includinggastrin, insulin, pancreatic polypeptide, vasoactive intestinal peptide, and serotonin orits urinary metabolites, such as 5-hydroxyindoleacetic acid (5-HIAA). Their clinical utilityis burdened by limited accuracy [9] and there is an urgent unmet need for novel non-invasive biomarkers for early identification, treatment monitoring, precision diagnosticsand phenotyping of NEN for the stratification of therapy.
Systems medicine provides a compelling opportunity to develop novel diagnostic andprognostic strategies for rare diseases, where a diagnosis may be made on a deeper analysisof an individual’s biology, based on the measurement of many thousands of genes, proteinsor metabolites [10]. Although the role of miRNA [11,12], circulating tumour cells [13],circulating cell-free DNA and copy number variations [14] or circulating neuroendocrinegene transcripts [15,16] in NEN have been recently analysed and encouraging resultsreported, to date, there is no compelling “omics based” technology in routine clinicaluse. One of the most widely applicable aspects of the development of precision medicinerelates to the diverse applications of metabolic phenotyping (metabotyping) to clinicaldiagnostics, prognostics and molecular epidemiology [10]. Metabolic profiling has beenshown to provide promising biomarker panels in various neoplasms, including prostatecancer [17], breast cancer [18], colorectal cancer [19,20], hepatocellular carcinoma [21], lungcancer [22] and leukaemia [23]. The metabotypes of individuals can be measured fromthe composition of accessible biofluids or tissues sampled in the clinic. Metabotypes varyextensively between individuals and populations and result from the complex interplayof host genes, lifestyle, diet and gut microbes. The systems metabolism of NEN has notpreviously been described in detail and subtle metabolic perturbations induced by NENremain poorly defined.
Metabolic phenotyping may provide novel diagnostic and prognostic strategies forvarious diseases [10]. Urinary analysis also delivers the greatest possible chance of achiev-ing this, as it provides a non-invasive “window” into gastrointestinal metabolism. In ourprevious discovery study, we demonstrated that retrospective proton nuclear magneticresonance (1H-NMR) analysis of urine was able to describe distinct metabolic phenotypesfor NEN based on the clinical presentation [24]. The aim of the current study was, therefore,to define the systemic metabolic consequences of NEN and to establish the diagnosticutility of 1H-NMR for NEN in a prospective study of treatment-naïve patients with eitherpancreatic NEN (PanNEN) or small bowel NEN (SBNEN) which, together, account for thevast majority of digestive NEN.
2. Results
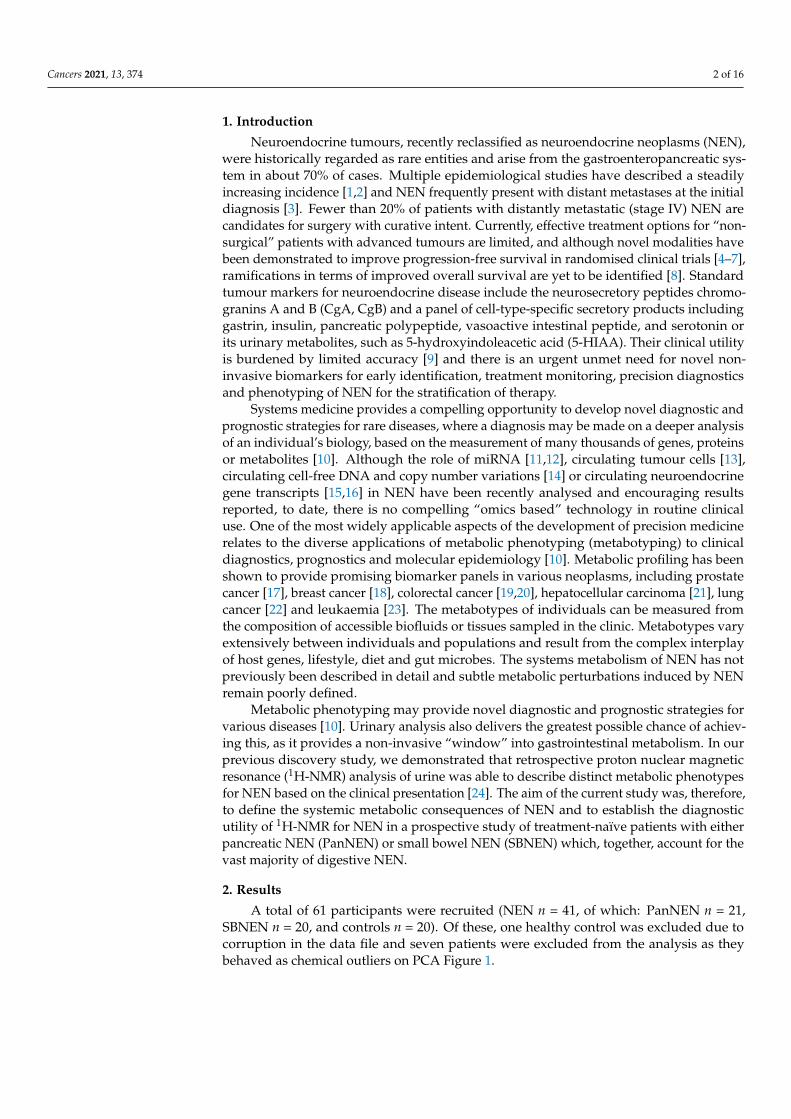
A total of 61 participants were recruited (NEN n = 41, of which: PanNEN n = 21,SBNEN n = 20, and controls n = 20). Of these, one healthy control was excluded due tocorruption in the data file and seven patients were excluded from the analysis as theybehaved as chemical outliers on PCA Figure 1.
Cancers 2021, 13, 374 3 of 16
Figure 1. Remark diagram of the cohort studied.* Exclusion criteria are: patients under the age of 18,pregnancy, patients undergoing neuroendocrine neoplasm (NEN)-specific systemic treatment, secondmalignancies, comorbidities requiring significant systemic treatment (e.g., immunosuppression),impaired renal function, poor compliance, missing consent for study participation. # 1 healthycontrol sample due to the corruption of the original data file; for NEN samples, 1 due to poor watersuppression, 3 due to high intensity of an unknown drug signal, and 3 due to extreme misalignment ofthe spectra. PanNEN = pancreatic neuroendocrine neoplasm, SBNEN = small bowel neuroendocrineneoplasm, BMI = body mass index.
One patient was excluded due to poor water suppression of the spectrum; three furtherspectra were dominated by a high concentration of an unknown drug metabolite whichmasked a considerable portion of the spectra, and three patients had spectra which couldnot be aligned satisfactorily due to abnormal pH and osmolality, and were hence unsuitablefor analysis. In total, 34 NEN (18 PanNEN and 16 SBNEN) patients and 19 healthy controlswere included in the final analysis. The median age of the included NEN patients was59.3 years (range 36–85), and further demographic data are shown in Table 1. Of the healthycontrols, nine were female, the mean age was 57.2 years (range 31–68), and the medianBMI was 25.1 (range 17.9–28.7).
Cancers 2021, 13, 374 4 of 16
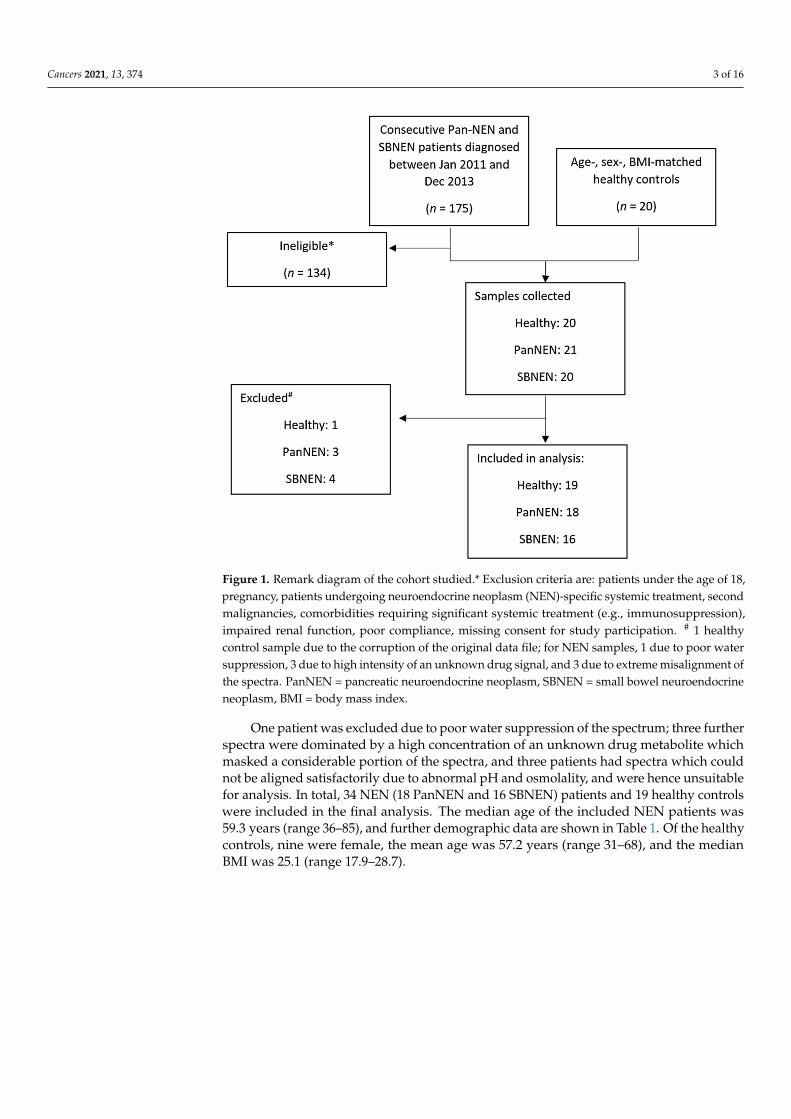
Table 1. Clinicopathological characteristics of neuroendocrine neoplasm patients at study entry.
Parameter Number
Number of patients 34
Sex -Male 21
Female 13
Ethnicity -Caucasian 20
African/Caribbean 5Asian/Arabic 9
Median age at diagnosis (years) 59.3 (range 36–85)
Median BMI 27.8 (range 17.4–42.0)
Site of primary tumour -Small Bowel 16
Pancreas (sporadic) 18
Tumour functionality–Pancreas -Non-functioning 11
Functioning 7
Median serum chromogranin A (normal < 60 pmol/L) 42 (range 21–2342)
Median 5-HIAA in 24 h urine (normal 0.0–45.0 µmol/L) 25.5 (range 9.4–581.4)
Tumour Grade * -1 182 163 0
Tumour stage # -T1–4N0M0 7T1–4N1M0 13T1–4N0M1 2T1–4N1M1 12
Liver metastases present -
Pancreas NEN -Yes 3No 15
Small bowel NEN -Yes 11No 5
BMI = body mass index; * = tumour grading performed in accordance with World Health Organization/EuropeanNeuroendocrine Tumor Society grading system [25,26], # = staging in accordance with the American Joint Committeeon Cancer/Union for International Cancer Control staging system [27], NEN = neuroendocrine neoplasm.
Seven of 18 (39%) of the PanNEN patients had functioning tumours. Of these, fourwere insulinoma, two gastrinoma and one glucagonoma. Twenty-seven patients (79%)had metastatic disease at initial diagnosis; of them, three out of 18 (17%) of the PanNENpatients and 11 out of 16 (69%) SBNEN presented with metastases to the liver. Five of thesmall bowel NEN patients had carcinoid syndrome (all untreated at study entry). Thedisease stage remained unchanged in 31 patients during the 3-year follow-up.
Supervised orthogonal projection to latent structures discriminant analysis (OPLS-DA)modelling of the NMR spectra revealed that the urinary metabolic phenotype of NEN wasclearly differentiated from that of healthy individuals (Figures 2 and 3).
Cancers 2021, 13, 374 5 of 16
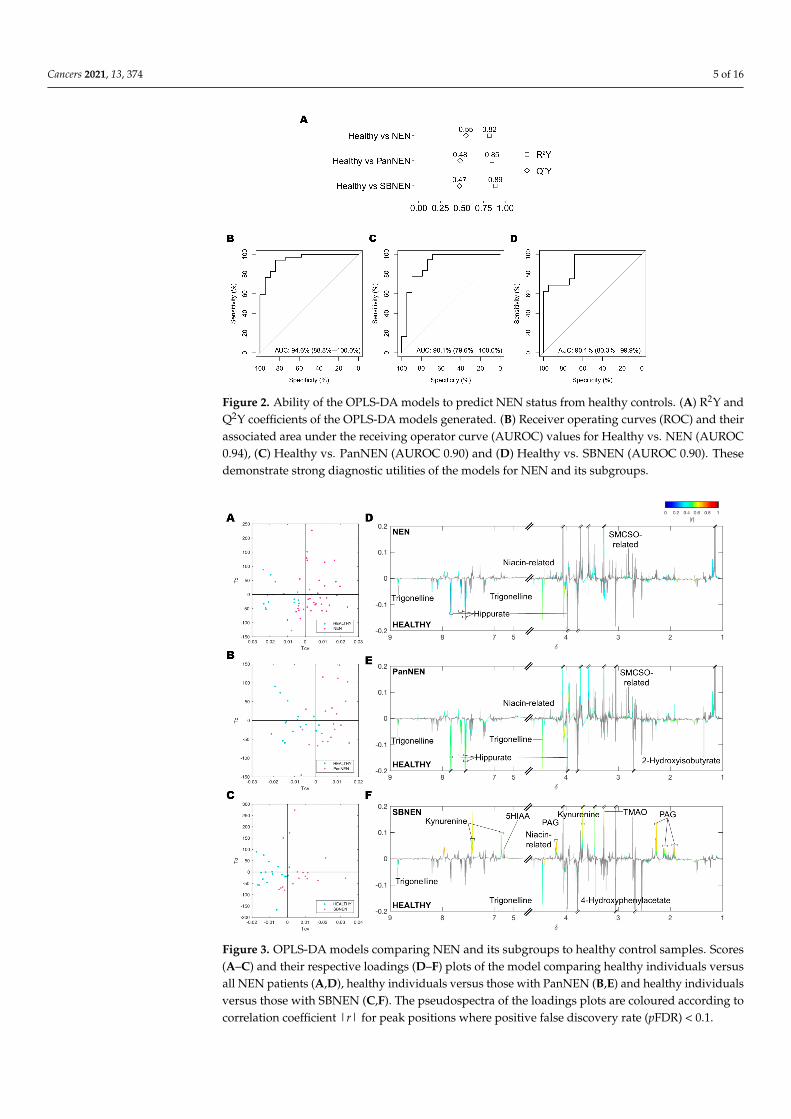
Figure 2. Ability of the OPLS-DA models to predict NEN status from healthy controls. (A) R2Y andQ2Y coefficients of the OPLS-DA models generated. (B) Receiver operating curves (ROC) and theirassociated area under the receiving operator curve (AUROC) values for Healthy vs. NEN (AUROC0.94), (C) Healthy vs. PanNEN (AUROC 0.90) and (D) Healthy vs. SBNEN (AUROC 0.90). Thesedemonstrate strong diagnostic utilities of the models for NEN and its subgroups.
Figure 3. OPLS-DA models comparing NEN and its subgroups to healthy control samples. Scores(A–C) and their respective loadings (D–F) plots of the model comparing healthy individuals versusall NEN patients (A,D), healthy individuals versus those with PanNEN (B,E) and healthy individualsversus those with SBNEN (C,F). The pseudospectra of the loadings plots are coloured according tocorrelation coefficient |r| for peak positions where positive false discovery rate (pFDR) < 0.1.
Cancers 2021, 13, 374 6 of 16
Valid OPLS-DA models could be built, with permutation p < 0.05, comparing betweencontrol and all NEN patients (R2Y = 0.82, Q2Y = 0.55, AUROC = 0.95) and comparingcontrol to each subgroup of NEN, respectively (Control vs. PanNEN: R2Y = 0.85, Q2Y = 0.48,AUROC = 0.90, Control vs. SBNEN: R2Y = 0.89, Q2Y = 0.47, AUROC = 0.90); Figure 2. Novalid model could be built comparing PanNEN and SBNEN (Q2Y < 0).
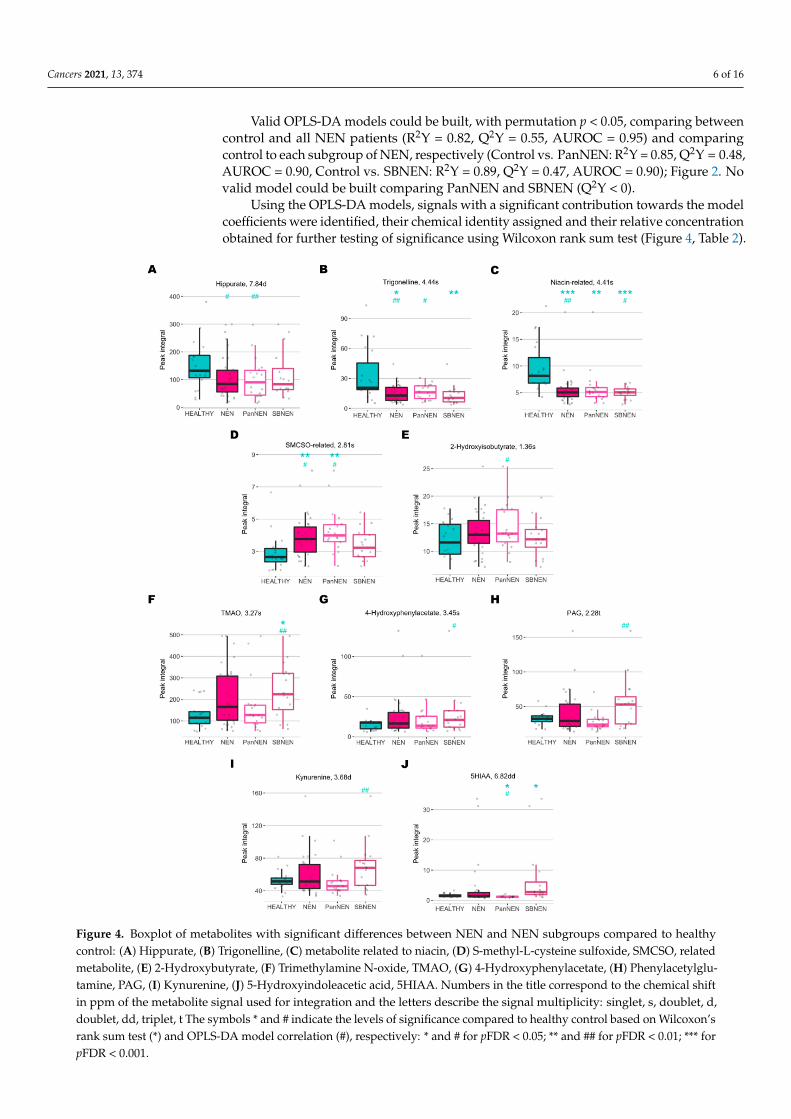
Using the OPLS-DA models, signals with a significant contribution towards the modelcoefficients were identified, their chemical identity assigned and their relative concentrationobtained for further testing of significance using Wilcoxon rank sum test (Figure 4, Table 2).
Figure 4. Boxplot of metabolites with significant differences between NEN and NEN subgroups compared to healthycontrol: (A) Hippurate, (B) Trigonelline, (C) metabolite related to niacin, (D) S-methyl-L-cysteine sulfoxide, SMCSO, relatedmetabolite, (E) 2-Hydroxybutyrate, (F) Trimethylamine N-oxide, TMAO, (G) 4-Hydroxyphenylacetate, (H) Phenylacetylglu-tamine, PAG, (I) Kynurenine, (J) 5-Hydroxyindoleacetic acid, 5HIAA. Numbers in the title correspond to the chemical shiftin ppm of the metabolite signal used for integration and the letters describe the signal multiplicity: singlet, s, doublet, d,doublet, dd, triplet, t The symbols * and # indicate the levels of significance compared to healthy control based on Wilcoxon’srank sum test (*) and OPLS-DA model correlation (#), respectively: * and # for pFDR < 0.05; ** and ## for pFDR < 0.01; *** forpFDR < 0.001.
Cancers 2021, 13, 374 7 of 16
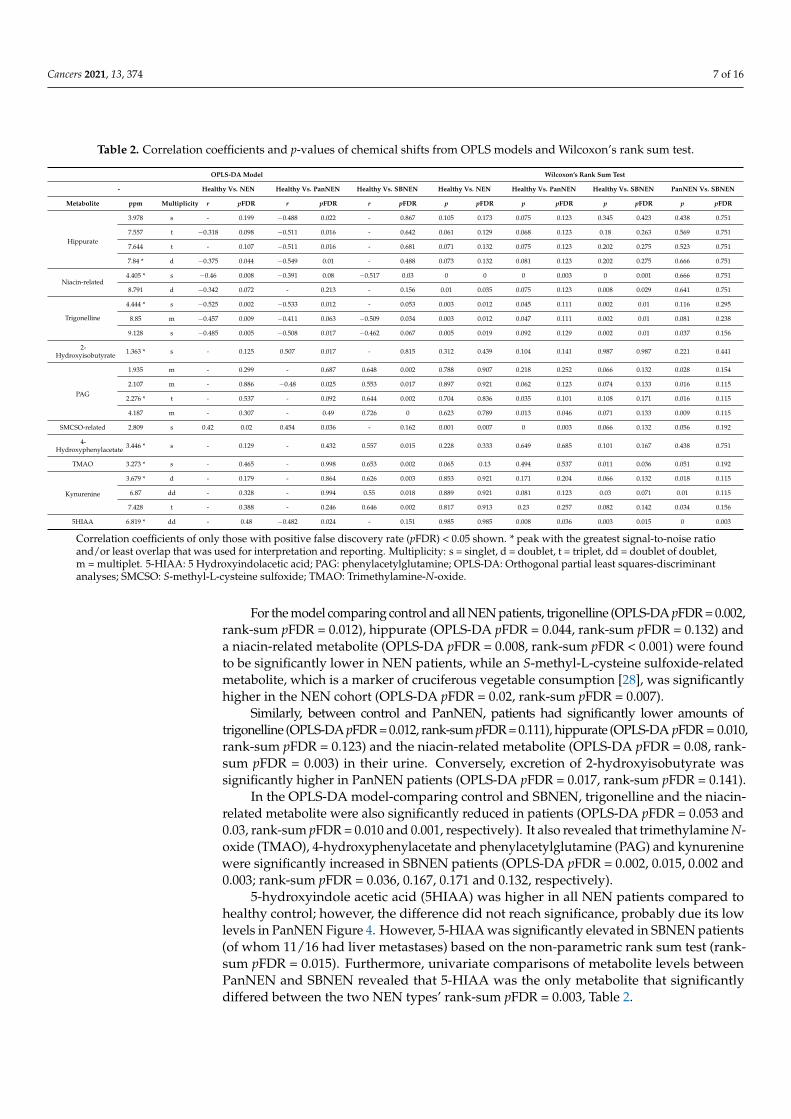
Table 2. Correlation coefficients and p-values of chemical shifts from OPLS models and Wilcoxon’s rank sum test.
OPLS-DA Model Wilcoxon’s Rank Sum Test
- Healthy Vs. NEN Healthy Vs. PanNEN Healthy Vs. SBNEN Healthy Vs. NEN Healthy Vs. PanNEN Healthy Vs. SBNEN PanNEN Vs. SBNEN
Metabolite ppm Multiplicity r pFDR r pFDR r pFDR p pFDR p pFDR p pFDR p pFDR
Hippurate
3.978 s - 0.199 −0.488 0.022 - 0.867 0.105 0.173 0.075 0.123 0.345 0.423 0.438 0.751
7.557 t −0.318 0.098 −0.511 0.016 - 0.642 0.061 0.129 0.068 0.123 0.18 0.263 0.569 0.751
7.644 t - 0.107 −0.511 0.016 - 0.681 0.071 0.132 0.075 0.123 0.202 0.275 0.523 0.751
7.84 * d −0.375 0.044 −0.549 0.01 - 0.488 0.073 0.132 0.081 0.123 0.202 0.275 0.666 0.751
Niacin-related4.405 * s −0.46 0.008 −0.391 0.08 −0.517 0.03 0 0 0 0.003 0 0.001 0.666 0.751
8.791 d −0.342 0.072 - 0.213 - 0.156 0.01 0.035 0.075 0.123 0.008 0.029 0.641 0.751
Trigonelline
4.444 * s −0.525 0.002 −0.533 0.012 - 0.053 0.003 0.012 0.045 0.111 0.002 0.01 0.116 0.295
8.85 m −0.457 0.009 −0.411 0.063 −0.509 0.034 0.003 0.012 0.047 0.111 0.002 0.01 0.081 0.238
9.128 s −0.485 0.005 −0.508 0.017 −0.462 0.067 0.005 0.019 0.092 0.129 0.002 0.01 0.037 0.156
2-Hydroxyisobutyrate 1.363 * s - 0.125 0.507 0.017 - 0.815 0.312 0.439 0.104 0.141 0.987 0.987 0.221 0.441
PAG
1.935 m - 0.299 - 0.687 0.648 0.002 0.788 0.907 0.218 0.252 0.066 0.132 0.028 0.154
2.107 m - 0.886 −0.48 0.025 0.553 0.017 0.897 0.921 0.062 0.123 0.074 0.133 0.016 0.115
2.276 * t - 0.537 - 0.092 0.644 0.002 0.704 0.836 0.035 0.101 0.108 0.171 0.016 0.115
4.187 m - 0.307 - 0.49 0.726 0 0.623 0.789 0.013 0.046 0.071 0.133 0.009 0.115
SMCSO-related 2.809 s 0.42 0.02 0.454 0.036 - 0.162 0.001 0.007 0 0.003 0.066 0.132 0.056 0.192
4-Hydroxyphenylacetate 3.446 * s - 0.129 - 0.432 0.557 0.015 0.228 0.333 0.649 0.685 0.101 0.167 0.438 0.751
TMAO 3.273 * s - 0.465 - 0.998 0.653 0.002 0.065 0.13 0.494 0.537 0.011 0.036 0.051 0.192
Kynurenine
3.679 * d - 0.179 - 0.864 0.626 0.003 0.853 0.921 0.171 0.204 0.066 0.132 0.018 0.115
6.87 dd - 0.328 - 0.994 0.55 0.018 0.889 0.921 0.081 0.123 0.03 0.071 0.01 0.115
7.428 t - 0.388 - 0.246 0.646 0.002 0.817 0.913 0.23 0.257 0.082 0.142 0.034 0.156
5HIAA 6.819 * dd - 0.48 −0.482 0.024 - 0.151 0.985 0.985 0.008 0.036 0.003 0.015 0 0.003
Correlation coefficients of only those with positive false discovery rate (pFDR) < 0.05 shown. * peak with the greatest signal-to-noise ratioand/or least overlap that was used for interpretation and reporting. Multiplicity: s = singlet, d = doublet, t = triplet, dd = doublet of doublet,m = multiplet. 5-HIAA: 5 Hydroxyindolacetic acid; PAG: phenylacetylglutamine; OPLS-DA: Orthogonal partial least squares-discriminantanalyses; SMCSO: S-methyl-L-cysteine sulfoxide; TMAO: Trimethylamine-N-oxide.
For the model comparing control and all NEN patients, trigonelline (OPLS-DA pFDR = 0.002,rank-sum pFDR = 0.012), hippurate (OPLS-DA pFDR = 0.044, rank-sum pFDR = 0.132) anda niacin-related metabolite (OPLS-DA pFDR = 0.008, rank-sum pFDR < 0.001) were foundto be significantly lower in NEN patients, while an S-methyl-L-cysteine sulfoxide-relatedmetabolite, which is a marker of cruciferous vegetable consumption [28], was significantlyhigher in the NEN cohort (OPLS-DA pFDR = 0.02, rank-sum pFDR = 0.007).
Similarly, between control and PanNEN, patients had significantly lower amounts oftrigonelline (OPLS-DA pFDR = 0.012, rank-sum pFDR = 0.111), hippurate (OPLS-DA pFDR = 0.010,rank-sum pFDR = 0.123) and the niacin-related metabolite (OPLS-DA pFDR = 0.08, rank-sum pFDR = 0.003) in their urine. Conversely, excretion of 2-hydroxyisobutyrate wassignificantly higher in PanNEN patients (OPLS-DA pFDR = 0.017, rank-sum pFDR = 0.141).
In the OPLS-DA model-comparing control and SBNEN, trigonelline and the niacin-related metabolite were also significantly reduced in patients (OPLS-DA pFDR = 0.053 and0.03, rank-sum pFDR = 0.010 and 0.001, respectively). It also revealed that trimethylamine N-oxide (TMAO), 4-hydroxyphenylacetate and phenylacetylglutamine (PAG) and kynureninewere significantly increased in SBNEN patients (OPLS-DA pFDR = 0.002, 0.015, 0.002 and0.003; rank-sum pFDR = 0.036, 0.167, 0.171 and 0.132, respectively).
5-hydroxyindole acetic acid (5HIAA) was higher in all NEN patients compared tohealthy control; however, the difference did not reach significance, probably due its lowlevels in PanNEN Figure 4. However, 5-HIAA was significantly elevated in SBNEN patients(of whom 11/16 had liver metastases) based on the non-parametric rank sum test (rank-sum pFDR = 0.015). Furthermore, univariate comparisons of metabolite levels betweenPanNEN and SBNEN revealed that 5-HIAA was the only metabolite that significantlydiffered between the two NEN types’ rank-sum pFDR = 0.003, Table 2.
Cancers 2021, 13, 374 8 of 16
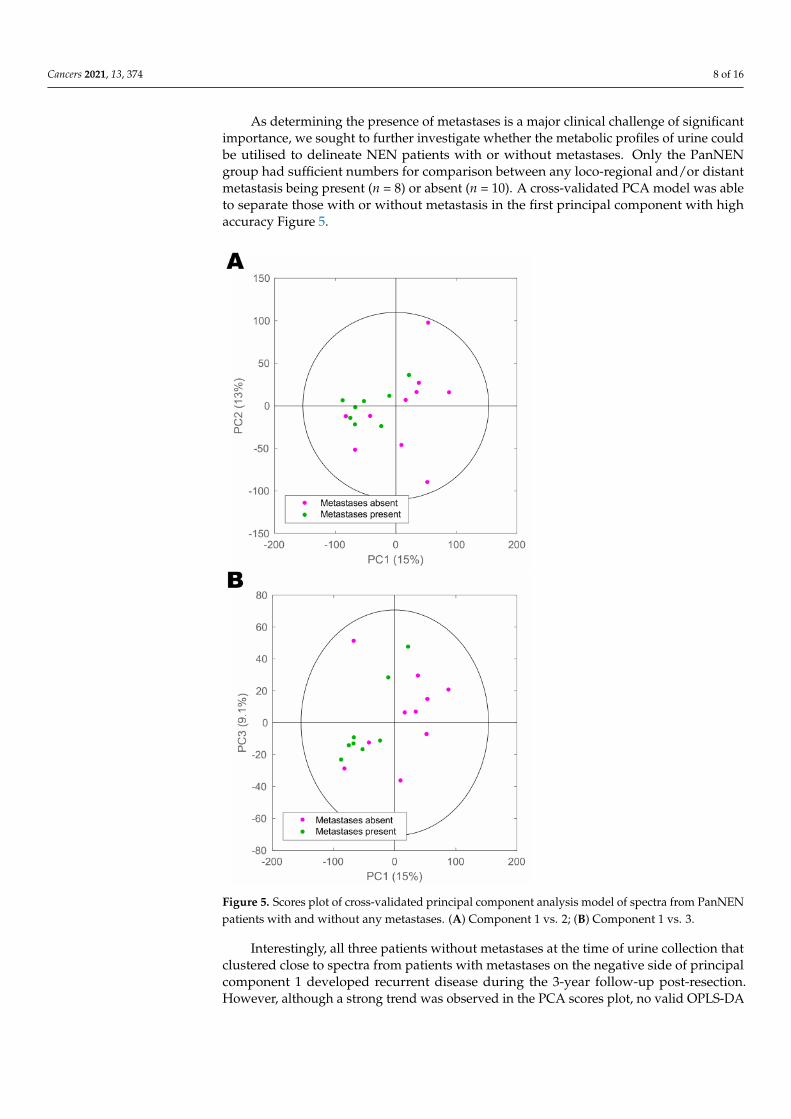
As determining the presence of metastases is a major clinical challenge of significantimportance, we sought to further investigate whether the metabolic profiles of urine couldbe utilised to delineate NEN patients with or without metastases. Only the PanNENgroup had sufficient numbers for comparison between any loco-regional and/or distantmetastasis being present (n = 8) or absent (n = 10). A cross-validated PCA model was ableto separate those with or without metastasis in the first principal component with highaccuracy Figure 5.
Figure 5. Scores plot of cross-validated principal component analysis model of spectra from PanNENpatients with and without any metastases. (A) Component 1 vs. 2; (B) Component 1 vs. 3.
Interestingly, all three patients without metastases at the time of urine collection thatclustered close to spectra from patients with metastases on the negative side of principalcomponent 1 developed recurrent disease during the 3-year follow-up post-resection.However, although a strong trend was observed in the PCA scores plot, no valid OPLS-DA
Cancers 2021, 13, 374 9 of 16
models could be built to differentiate patients with metastatic from non-metastatic tumours(Q2Y < 0), probably owing to the small sample size.
3. Discussion
This is the first prospective study defining the systemic metabolic consequences ofNEN and assessing metabolic phenotyping as a diagnostic tool in neuroendocrine neoplasiadisease. This suggests that 1H-NMR has tangible clinical utility, as it is able to identifyNEN status when compared to a healthy control group with a high diagnostic accuracy,and to provide candidate biomarkers, new diagnostic strategies and phenotyping for thestratification of therapy and identify therapeutic targets that could be pursued. In light ofthe imminent need for novel biomarkers in NEN, metabolic phenotyping deserves furtherattention. Chromogranin A, as a global biomarker for NEN that is currently widely usedin clinical practice, is burdened by poor assay reproducibility, low sensitivity and limitedpredictive value. Chromogranin levels can be influenced by various medical conditionssuch as renal failure, inflammatory bowel disease and irritable bowel syndrome, non-NEN malignancies, and therapy with proton pump inhibitors. As expected, this analysisidentified that 5-HIAA, an established biomarker currently used in the clinical diagnosisof NEN, was a discriminant between SBNEN patients and healthy controls. Of note,68.8% of patients had liver metastases. Apart from NEN, elevation of urinary 5-HIAAhas been reported in several types of malignant conditions including gastric cancer [29]and breast cancer [30]. The prognostic value of 5-HIAA has been suggested for advanceddisease in SBNEN [31]. Our multivariate models showed that 5-HIAA contributed onlyminimal diagnostic strength to the model, but was significant in univariate non-parametriccomparisons. Its level was raised in SBNEN rank-sum pFDR = 0.015), and it was the onlymetabolite found to be significantly different between PanNEN and SBNEN (rank-sumpFDR = 0.003; Table 2. This might be due to the higher rate of liver metastases in SBNEN inour cohort.
Similar to 5-HIAA, which is a urinary metabolite of tryptophan-derived serotonin,a number of other discriminatory metabolites identified in this study are also productsof tryptophan metabolism. A niacin-related metabolite and trigonelline were found to besignificantly reduced in NEN patients (OPLS-DA pFDR = 0.002, rank-sum pFDR = 0.012)and the significance remained even in comparisons to the subgroups (PanNEN: OPLS-DA pFDR = 0.012, rank-sum pFDR = 0.111 and SBNEN: OPLS-DA pFDR = 0.053, rank-sum pFDR = 0.010). Niacin (vitamin B3) and trigonelline are downstream products oftryptophan metabolism via the kynurenine pathway. Trigonelline is found in coffee andother dietary products [32], and has been shown to have anti-tumourogenic effects [33].Liao et al. demonstrated that trigonelline inhibited migration of Hep3B cells throughdown-regulation of nuclear factor E2-related factor-2-dependent antioxidant enzymes’activity [34]. However, despite both metabolites being potentially confounded by dietaryfactors, niacin deficiency is known to be prevalent in patients with serotonin-producingNEN [35]. In the series reported by Bouma et al., the urinary niacin metabolite N1-methylnicotinamide was reduced compared to healthy controls (median 17.9 µmol/24 hvs. 43.7 µmol/24 h, respectively) and below normal in 45% of the patients [35]. Therefore,it is possible that the reduced excretion of trigonelline and the niacin-related metaboliteobserved in NEN patients here is directly related to the presence of NEN and that niacincould play a role in the prevention of tumour progression.
Interestingly, kynurenine, a metabolite found upstream of the two previously dis-cussed metabolites in tryptophan metabolism, was found to be elevated in the SBNENgroup in this study. It has been increasingly recognised that indoleamine-2,3-dioxygenase(IDO) and tryptophan-2,3-dioxygenase (TDO), which catabolise tryptophan into kynure-nine, is commonly upregulated in tumours and this is thought to facilitate tumour immuneevasion [36]. Elevated levels of kynurenine and kynurenine/tryptophan ratio has beenreported in the serum of breast [37] and lung [38] cancer patients, as well as in the urineof patients with bladder [39] and prostate [40] cancers. Our observation suggests that
Cancers 2021, 13, 374 10 of 16
tryptophan metabolism is universally perturbed in NEN patients but the dynamics of theperturbation may differ between the NEN subgroups.
Urinary excretion of hippurate, which was found to be lowered in NEN patients(OPLS-DA pFDR = 0.044, rank-sum pFDR = 0.132), is modulated by the microbiota, andit derives from bacterial activity in the distal small intestine rather than in the colon [41].Increased urinary excretion of hippurate has been associated with weight loss or withlean body mass [42]. However, there was no significant difference in BMI between theNEN patients and healthy controls. It has been repeatedly reported to be reduced inNEN patients [24], and also in various cancer types, such as renal cell carcinoma [43] andcolorectal cancer [44]. This further supports the association of gut microbial dysbiosis withcancer development.
A few of the markers were found to have significantly increased levels in SBNENpatients compared to control, namely, TMAO, PAG and 4-hydroxyphenylacetate, also ofgut microbial origin. TMAO has been associated with several diseases including coloncancer [45] and cardiovascular disease [46]. Previous data have shown that TMAO levels in-crease with the consumption of L-carnitine, which is metabolised by the gut microbiota suchas Peptostreptococcaceae and Clostridiaceae families, into trimethylamine (TMA). TMA isfurther metabolised into TMAO by flavin monooxygenases in the liver [47]. Similarly, PAGand 4-hydroxyphenylacetate are also gut microbial co-metabolites and elevated urinary ex-cretion of them has been reported in colorectal [19] and gastric [48] cancers, respectively. Insummary, this analysis provides new evidence to suggest that host-microbial co-metabolicpathways are perturbed in both PanNEN and SBNEN, and may have diagnostic value.
The PCA model of PanNEN patients showed an observable differential segregationof patients with or without metastasis. Interestingly, all three PanNEN patients withoutdistant metastases at the time of analysis that clustered close to spectra from patients withmetastases on the negative side of principal component 1 developed recurrent disease dur-ing the 3-year follow-up. This highlights the potential for metabolic phenotyping to detectmetastases earlier and more accurately than current clinical practice allows. However, thepatient numbers in this study were not large enough to enable robust statistical inference.Future studies should include an increased number of patients with metastases as one ofthe aims and recruit accordingly to obtain sufficient numbers for comparison.
There are limitations to this study. Firstly, we have analysed a highly selected groupof NEN patients and it remains a matter of further study to validate the results in theheterogeneous patient population seen in clinical practice. Our inclusion criteria in thisinitial study on metabolic circuits in NEN were very strict, since we wanted to controlcofounding factors affecting the variables being studied and avoid false discovery results.The patient numbers in our study are small, which did not permit the correlation of thespectroscopic data with clinical parameters such as tumour grade, tumour stage andfunctional status or comparison with standard tumour markers. However, this will alwaysbe a challenge when prospectively studying uncommon tumours such as NEN. The smallstudy size also prevented having a separate set of data for validation of the findings, whichshall be addressed in our future work. We were also unable to definitively account forpotential confounders such as diet in this work, since some of the metabolites, such as theSMCSO-related metabolite, were possibly of dietary origin. This analysis also did not setout to study the microbiome. As a result, there were no data from the luminal microbiometo corroborate the metabolic dataset, which strongly indicates disease-associated dysbiosisbased on the perturbation of gut microbial (co-)metabolites such as hippurate and PAG.This will be the subject of future work. We had to exclude some patient samples because oftechnical reasons. We will attempt to increase the robustness of methodology to confirm thediagnostic capability of this tumour marker in clinical practice. Furthermore, the majorityof SBNEN patients and many PanNEN patients have present metastasis, which may pose achallenge to identifying biomarkers for early diagnosis before the tumour has metastasised.However, this is as much a research challenge as a clinical challenge, as patients oftenpresent late with metastasis at diagnosis. Finally, 1H-NMR spectroscopy accesses only

Cancers 2021, 13, 374 11 of 16
a portion of the metabolome, with a bias towards high-concentration metabolites. Thefailure rate of 10% is related to the experimental nature of the analysis and the challengesof sample storage and volume. 1H-NMR is a scalable, high-throughout technology thatcould be leveraged for translational applications. However, it is likely that this work wouldlead to the development of targeted, quantitative assays for the analysis of the candidatebiomarkers that are described, which could be deployed at the point of care. Furtherstudies would be necessary to provide more mechanistic insight into the biology of themetabolic perturbations caused by the presence of NEN in the organism. New studieswould obviously require the analysis of larger cohorts, and targeted analytical techniqueswhich should include the characterisation of the NEN gut microbiome. Studies whichadditionally acquire data from complementary techniques such as liquid-chromatographymass spectrometry, and comparison with other novel biomarkers such as circulatingneuroendocrine gene transcripts (NETest) should aid metabolic profiling characterisationand delineate its clinical utility.
It is not possible to delineate cause and effect for the metabolites identified here, andwe can only speculate, at this stage, as to their roles. However, we have identified animportant avenue of research for the functional NEN microbiome that could be capitalisedon to improve current clinical practice.
4. Materials and Methods4.1. Patient Recruitment and Sample Collection
From January 2011 to December 2013, consecutive patients with either PanNEN orSBNEN were recruited from the European Neuroendocrine Tumor Society (ENETS) Centreof Excellence at Imperial College London NHS Healthcare Trust, UK. Data were recorded inour prospectively maintained database for NEN. Only treatment-naïve patients with a pri-mary tumour still in place and confirmed diagnosis of a localised or metastasised NEN anda follow-up of at least 3 years were included. Patients under the age of 18, those who werepregnant, and patients undergoing NEN-specific systemic treatment (e.g., somatostatinanalogues, mTOR inhibitors, chemotherapy or peptide receptor radionuclide therapy), andpatients who had any previous systemic, liver directed or surgical NEN-specific treatment,were excluded. In all patients, the diagnosis of NEN was confirmed based on conventionalhistology and immunohistochemistry for NEN-specific markers utilising either surgicalspecimens or biopsy material. Tumour functional activity was defined by considerationof clinical symptoms and results of standard biochemical testing. All patients underwentstaging and grading according to World Health Organization/European NeuroendocrineTumor Society (WHO/ENETS) [25,26] and American Joint Committee on Cancer/Unionfor International Cancer Control (AJCC/UICC) [27] criteria. Staging included computedtomography (CT), magnetic resonance imaging (MRI), somatostatin receptor-targetedpositron emission tomography (PET) PET/CT, and other diagnostic modalities tailored toindividual clinical situations. Standard biochemical work-up comprised assessment of guthormones and chromogranin A and B in serum (Imperial Supra-Regional Assay Serviceradioimmunoassay, London, UK) and 5-hydroxyindolacetic acid (5-HIAA) in 24 h urine(Chromsystems Instruments & Chemicals GmbH, Grafelfing, Germany).
Prospective data collection on medical history and clinical variables (NEN phenotype,disease stage and grade, standard NEN biomarkers) was performed by a single researcher(PD). Age-, sex- and body mass index (BMI)-matched healthy control individuals wererecruited from a healthy population of volunteers at the same institution and at TheWelcome Trust, London, UK. Patients who were on proton pump inhibitors interruptedtreatment for 2 weeks prior to sample collection when clinically justifiable. The projectwas designed and carried out in accordance with reporting recommendations for tumourmarker prognostic studies REMARK; Figure 1 and [49].
Cancers 2021, 13, 374 12 of 16
4.2. Sample Preparation
Patients and healthy controls were asked to provide a single sample of urine foranalysis, which was collected and stored at −80 ◦C. Samples were prepared accordingto our previously published protocol [50]. In short, samples were thawed on the dayof analysis. An aliquot of 600 µL of urine was placed into 2 mL Eppendorf tubes andcentrifuged for 5 min at 6× g. A volume of 540 µL of the supernatant was transferredinto a new Eppendorf tube and mixed with 60 µL of standard urine buffer [50] containing1.5 M potassium dihydrogen phosphate at pH 7.4 in deuterium oxide, with 3-trimethyl-silyl-[2,2,3,3–2H4]propionic acid (TSP) as reference, and sodium azide to avoid bacterialgrowth. Eppendorf tubes were vortexed and 550 µL of the solution was placed intoSampleJet 5 mm NMR tubes (Bruker BioSpin Ltd., Rheinstetten, Germany). SampleJet rackswere immediately transferred to the SampleJet robot (Bruker BioSpin Ltd., Rheinstetten,Germany) and were maintained at 4 ◦C until measurement.
4.3. 1H-NMR Spectroscopic Analysis of Urine Samples
A standard NMR experiment for urine profiling as defined by the Clinical PhenotypingCentre (CPC) was undertaken for each urine sample [50]. The experimental set-up followedthe strict protocol of the CPC and consisted of temperature calibration, water suppressionoptimisation, quantitation calibration and optimisation of each run for a quality control(QC) urine sample [50]. An 1H 1-dimensional (1D) profile was acquired for each urinesample using a standard 1D pulse sequence employing the first increment of a NuclearOverhauser Effect pulse sequence to achieve pre-saturation of the water resonance in aBruker 600 Avance III NMR spectrometer (Bruker BioSpin Ltd., Rheinstetten, Germany).The machine was equipped with a SampleJet robot, a 5 mm probe with high-degreeZ gradients and an automatic tuning and matching unit. The 1H-NMR spectra wereprocessed, phased, baseline corrected and calibrated in automation using TopSpin 3.2(Bruker BioSpin Ltd., Rheinstetten, Germany). Any samples that did not conform toaccepted criteria for line-width, baseline and water suppression were reacquired. Inaddition to the 1D NMR profile, a 2-dimensional (2D) J-res experiment was also acquiredto exploit the structural properties and help with biomarker identification. The acquisitionand processing parameters were as previously described elsewhere [50]. To facilitatethe identification of metabolites that were determined to be of statistical importance incharacterising NEN, 1D titration experiments with the corresponding chemical standardand 2D experiments such as COSY, TOCSY [51] and 1H-13C-HSQC were acquired forselected samples [52,53].
4.4. Statistical Analysis of the Spectral Data
All data pre-processing and statistical analyses were performed using Matlab R2016a(MathWorks, Natick, MA, USA). The spectra were imported into Matlab and digitised into65,536 datapoints with segment widths of 0.0002 ppm using in-house scripts. Spectralregions corresponding to the TSP reference peak (<0.1 ppm), methanol (3.35–3.38 ppm),water (4.7–4.9 ppm) and urea (5.6–6.0 ppm) signal regions, and background noise inregions without signals (>9.4 ppm) were removed. The spectra were then aligned [54]and normalised [55]. The probabilistic quotient normalization based on the calculationof a most probable dilution factor by looking at the distribution of the quotients of theamplitudes of a test spectrum by those of a reference spectrum was used.
Spectra were first subjected to principal component analysis (PCA) for the identifica-tion of outliers. The original spectra of putative outliers, determined by being outside of the95% Hotelling’s T2 confidence interval in the PCA scores space, were examined. Spectrawere excluded from subsequent analyses as an outlier only if they contained extremeconcentrations of certain drugs since drug metabolites can potentially confound or bias themodels. Cross-validated PCA models were made using the leave-one-out method.
For orthogonal projection to latent structures-discriminant analysis (OPLS-DA) [56],7-fold cross-validation was used and predictive models were further validated by 1000 per-

Cancers 2021, 13, 374 13 of 16
mutations of the outcome vector. Integrals of individual peaks of interest were obtainedand further tested by Wilcoxon rank sum test for significant difference between groups.P-values were adjusted for multiple testing using the Benjamini–Hochberg procedure [57]with cut-off for significance at the false discovery rate of 0.5%. Predictions from the OPLS-DA models were used for creating receiver operating characteristics (ROC) curves [58]. Theinvestigators Mei Ran Abellona U, Beatriz Jiménez and Michael Kyriakides were blindedto clinical details.
Metabolite assignments were facilitated by in-house database comparison, statisticaltools such as statistical total correlation spectrometry (STOCSY) [59], with subset optimi-sation by reference matching (STORM) [60], and 2-dimentional NMR data acquired fromselected samples. Of the metabolites identified (n = 250) only those with discriminatoryvalue were used for final analysis.
5. Conclusions
These findings suggest the existence of a new systems-based neuroendocrine circuit,regulated in part by cancer metabolism, neuroendocrine signalling molecules and gutmicrobial co-metabolism. This may represent a novel avenue for the discovery of preci-sional medicine for NEN. The metabolic profiling of NEN has diagnostic potential andshould be expanded to larger studies to develop next-generation assays for precision NENphenotyping that assesses the levels of activity of these pathways. The role of the gutmicrobial changes in the aetiology of NEN now needs to be defined based on the dysbiosisobserved in this patient population.
Author Contributions: Conceptualisation: all authors; methodology: B.J., M.R.A.U., M.K., D.S.K.L.,E.R., E.H., J.K.N., J.M.K.; software: B.J., M.R.A.U.; validation: B.J., M.R.A.U., M.K., D.S.K.L., E.R.,E.H., J.K.N., J.M.K.; formal analysis: B.J., M.R.A.U., E.R., E.H., J.K.N., J.M.K.; data curation: Allauthors; writing—original draft: B.J., M.R.A.U., P.D.; writing—review and editing: M.K., A.K.C.,D.S.K.L., E.R., E.H., J.K.N., J.M.K., A.F. All authors have read and agreed to the published version ofthe manuscript.
Funding: The research was supported by grants of the Heinz-Horst Deichmann Foundation (Grantnumber: P31294), Commission of the European Communities/FP7 (FP7-MC-IEF 300586), TransNETSof UKI NETS (Grant number: P52805), and Imperial NIHR Biomedical Research Centre (Grantnumber: P47850).
Institutional Review Board Statement: The study was conducted according to the guidelines of theDeclaration of Helsinki, and approved by the Research Ethics Committee for Wales (protocol code07/MRE09/54).
Informed Consent Statement: Informed consent was obtained from all subjects involved in the study.
Data Availability Statement: The data presented in this study are available on request from thecorresponding author. The data are not publicly available as they are derived from sensitive medicalinformation from individuals with neuroendocrine neoplasms or are study ‘controls’. Therefore,ethical approval for data sharing would need to be sought.
Acknowledgments: We would like to thank the Imperial College Healthcare NHS Trust TissueBank which provided the biosamples. Other investigators may have received samples from thesesame tissues. The research was supported by the National Institute for Health Research (NIHR)Biomedical Research Centre based at Imperial College Healthcare NHS Trust, MRC-NIHR NationalPhenome Centre and Imperial College London. The views expressed are those of the authors and notnecessarily those of the NHS, the NIHR or the Department of Health.
Conflicts of Interest: The authors declare no conflict of interest. The funders had no role in the designof the study; in the collection, analyses, or interpretation of data; in the writing of the manuscript, orin the decision to publish the results.
References1. Ellis, L.; Shale, M.J.; Coleman, M.P. Carcinoid tumors of the gastrointestinal tract: Trends in incidence in England since 1971. Am.
J. Gastroenterol. 2010, 105, 2563–2569. [CrossRef] [PubMed]
Cancers 2021, 13, 374 14 of 16
2. Dasari, A.; Shen, C.; Halperin, D.; Zhao, B.; Zhou, S.; Xu, Y.; Shih, T.; Yao, J.C. Trends in the Incidence, Prevalence, and SurvivalOutcomes in Patients With Neuroendocrine Tumors in the United States. JAMA Oncol. 2017, 3, 1335. [CrossRef] [PubMed]
3. Clift, A.K.; Faiz, O.; Al-Nahhas, A.; Bockisch, A.; Liedke, M.O.; Schloericke, E.; Wasan, H.; Martin, J.; Ziprin, P.; Moorthy, K.; et al.Role of Staging in Patients with Small Intestinal Neuroendocrine Tumours. J. Gastrointest. Surg. 2016, 20, 180–188. [CrossRef][PubMed]
4. Raymond, E.; Dahan, L.; Raoul, J.-L.; Bang, Y.-J.; Borbath, I.; Lombard-Bohas, C.; Valle, J.; Metrakos, P.; Smith, D.; Vinik, A.; et al.Sunitinib malate for the treatment of pancreatic neuroendocrine tumors. N. Engl. J. Med. 2011, 364, 501–513. [CrossRef] [PubMed]
5. Yao, J.C.; Guthrie, K.A.; Moran, C.; Strosberg, J.R.; Kulke, M.H.; Chan, J.A.; LoConte, N.; McWilliams, R.R.; Wolin, E.M.; Mattar, B.; et al.Phase III Prospective Randomized Comparison Trial of Depot Octreotide Plus Interferon Alfa-2b Versus Depot Octreotide PlusBevacizumab in Patients with Advanced Carcinoid Tumors: SWOG S0518. J. Clin. Oncol. 2017, 35, 1695–1703. [CrossRef][PubMed]
6. Caplin, M.E.; Pavel, M.; Cwikła, J.B.; Phan, A.T.; Raderer, M.; Sedlácková, E.; Cadiot, G.; Wolin, E.M.; Capdevila, J.; Wall, L.; et al.Lanreotide in metastatic enteropancreatic neuroendocrine tumors. N. Engl. J. Med. 2014, 371, 224–233. [CrossRef] [PubMed]
7. Strosberg, J.; El-Haddad, G.; Wolin, E.; Hendifar, A.; Yao, J.; Chasen, B.; Mittra, E.; Kunz, P.L.; Kulke, M.H.; Jacene, H.; et al. Phase3 Trial of177Lu-Dotatate for Midgut Neuroendocrine Tumors. N. Engl. J. Med. 2017, 376, 125–135. [CrossRef]
8. Frilling, A.; Clift, A.K. Therapeutic strategies for neuroendocrine liver metastases. Cancer 2015, 121. [CrossRef]9. Oberg, K.; Modlin, I.M.; De Herder, W.; Pavel, M.; Klimstra, D.; Frilling, A.; Metz, D.C.; Heaney, A.; Kwekkeboom, D.; Strosberg,
J.; et al. Consensus on biomarkers for neuroendocrine tumour disease. Lancet Oncol. 2015, 16, e435–e446. [CrossRef]10. Nicholson, J.K.; Holmes, E.; Kinross, J.M.; Darzi, A.W.; Takats, Z.; Lindon, J.C. Metabolic phenotyping in clinical and surgical
environments. Nature 2012, 491, 384–392. [CrossRef]11. Li, S.-C.C.; Essaghir, A.; Martijn, C.; Lloyd, R.V.; Demoulin, J.-B.B.; Oberg, K.; Giandomenico, V.; Öberg, K.; Giandomenico,
V. Global microRNA profiling of well-differentiated small intestinal neuroendocrine tumors. Mod. Pathol. 2013, 26, 685–696.[CrossRef]
12. Malczewska, A.; Frampton, A.E.; Mato Prado, M.; Ameri, S.; Dabrowska, A.F.; Zagorac, S.; Clift, A.K.; Kos-Kudła, B.; Faiz, O.;Stebbing, J.; et al. Circulating MicroRNAs in Small-bowel Neuroendocrine Tumors. Ann. Surg. 2019. [CrossRef] [PubMed]
13. Khan, M.S.; Tsigani, T.; Rashid, M.; Rabouhans, J.S.; Yu, D.; Luong, T.V.; Caplin, M.; Meyer, T. Circulating tumor cells and EpCAMexpression in neuroendocrine tumors. Clin. Cancer Res. 2011, 17, 337–345. [CrossRef] [PubMed]
14. Boons, G.; Vandamme, T.; Peeters, M.; Beyens, M.; Driessen, A.; Janssens, K.; Zwaenepoel, K.; Roeyen, G.; Van Camp, G.; DeBeeck, K.O. Cell-free DNA from metastatic pancreatic neuroendocrine tumor patients contains tumor-specific mutations andcopy number variations. Front. Oncol. 2018, 8. [CrossRef] [PubMed]
15. Modlin, I.M.; Frilling, A.; Salem, R.R.; Alaimo, D.; Drymousis, P.; Wasan, H.S.; Callahan, S.; Faiz, O.; Weng, L.; Teixeira, N.; et al.Blood measurement of neuroendocrine gene transcripts defines the effectiveness of operative resection and ablation strategies.Surgery 2015, 159, 336–347. [CrossRef] [PubMed]
16. Modlin, I.M.; Bodei, L.; Kidd, M. Neuroendocrine tumor biomarkers: From monoanalytes to transcripts and algorithms. BestPract. Res. Clin. Endocrinol. Metab. 2016, 30, 59–77. [CrossRef]
17. Sreekumar, A.; Poisson, L.M.; Rajendiran, T.M.; Khan, A.P.; Cao, Q.; Yu, J.; Laxman, B.; Mehra, R.; Lonigro, R.J.; Li, Y.; et al.Metabolomic profiles delineate potential role for sarcosine in prostate cancer progression. Nature 2009, 457, 910–914. [CrossRef]
18. Asiago, V.M.; Alvarado, L.Z.; Shanaiah, N.; Gowda, G.A.N.; Owusu-Sarfo, K.; Ballas, R.A.; Raftery, D. Early detection of recurrentbreast cancer using metabolite profiling. Cancer Res. 2010, 70, 8309–8318. [CrossRef]
19. Qiu, Y.; Cai, G.; Su, M.; Chen, T.; Liu, Y.; Xu, Y.; Ni, Y.; Zhao, A.; Cai, S.; Xu, L.X.; et al. Urinary Metabonomic Study on ColorectalCancer. J. Proteome Res. 2010, 9, 1627–1634. [CrossRef]
20. Mirnezami, R.; Jiménez, B.; Li, J.V.; Kinross, J.M.; Veselkov, K.; Goldin, R.D.; Holmes, E.; Nicholson, J.K.; Darzi, A. Rapiddiagnosis and staging of colorectal cancer via high-resolution magic angle spinning nuclear magnetic resonance (HR-MAS NMR)spectroscopy of intact tissue biopsies. Ann. Surg. 2014, 259, 1138–1149. [CrossRef]
21. Chen, T.; Xie, G.; Wang, X.; Fan, J.; Qiu, Y.; Zheng, X.; Qi, X.; Cao, Y.; Su, M.; Wang, X.; et al. Serum and Urine Metabolite ProfilingReveals Potential Biomarkers of Human Hepatocellular Carcinoma. Mol. Cell. Proteomics 2011, 10, M110.004945. [CrossRef][PubMed]
22. Carrola, J.; Rocha, C.M.; Barros, A.S.; Gil, A.M.; Goodfellow, B.J.; Carreira, I.M.; Bernardo, J.; Gomes, A.; Sousa, V.; Carvalho, L.; et al.Metabolic Signatures of Lung Cancer in Biofluids: NMR-Based Metabonomics of Urine. J. Proteome Res. 2011, 10, 221–230.[CrossRef] [PubMed]
23. MacIntyre, D.A.; Jiménez, B.; Lewintre, E.J.; Martín, C.R.; Schäfer, H.; Ballesteros, C.G.; Mayans, J.R.; Spraul, M.; García-Conde,J.; Pineda-Lucena, A. Serum metabolome analysis by 1H-NMR reveals differences between chronic lymphocytic leukaemiamolecular subgroups. Leukemia 2010, 24, 788–797. [CrossRef] [PubMed]
24. Kinross, J.M.; Drymousis, P.; Jiménez, B.; Frilling, A. Metabonomic profiling: A novel approach in neuroendocrine neoplasias.Surgery 2013, 154, 1185–1192. [CrossRef]
25. Rindi, G.; Klöppel, G.; Couvelard, A.; Komminoth, P.; Körner, M.; Lopes, J.M.; McNicol, A.-M.; Nilsson, O.; Perren, A.; Scarpa, A.; et al.TNM staging of midgut and hindgut (neuro) endocrine tumors: A consensus proposal including a grading system. Virchows Arch.2007, 451, 757–762. [CrossRef]
Cancers 2021, 13, 374 15 of 16
26. Rindi, G.; Klöppel, G.; Alhman, H.; Caplin, M.; Couvelard, A.; de Herder, W.W.; Erikssson, B.; Falchetti, A.; Falconi, M.;Komminoth, P.; et al. TNM staging of foregut (neuro)endocrine tumors: A consensus proposal including a grading system.Virchows Arch. 2006, 449, 395–401. [CrossRef]
27. Edge, S.; Byrd, D.; Compton, C.; Fritz, A.; Greene, F.; Trotti, A. AJCC Cancer Staging Manual, 7th ed.; Springer: Chicago, IL, USA, 2010.28. Edmands, W.M.B.; Beckonert, O.P.; Stella, C.; Campbell, A.; Lake, B.G.; Lindon, J.C.; Holmes, E.; Gooderham, N.J. Identification of
human urinary biomarkers of cruciferous vegetable consumption by metabonomic profiling. J. Proteome Res. 2011, 10, 4513–4521.[CrossRef]
29. Mokhtari, M.; Rezaei, A.; Ghasemi, A. Determination of Urinary 5-Hydroxyindoleacetic Acid as a Metabolomics in Gastric Cancer.J. Gastrointest. Cancer 2015, 46, 138–142. [CrossRef]
30. Nam, H.; Chung, B.C.; Kim, Y.; Lee, K.Y.; Lee, D. Combining tissue transcriptomics and urine metabolomics for breast cancerbiomarker identification. Bioinformatics 2009, 25, 3151–3157. [CrossRef]
31. Landry, C.S.; Cavaness, K.; Celinski, S.; Preskitt, J. Biochemical prognostic indicators for pancreatic neuroendocrine tumors andsmall bowel neuroendocrine tumors. Gland Surg. 2014, 3. [CrossRef]
32. Arai, K.; Terashima, H.; Aizawa, S.I.; Taga, A.; Yamamoto, A.; Tsutsumiuchi, K.; Kodama, S. Simultaneous determination oftrigonelline, caffeine, chlorogenic acid and their related compounds in instant coffee samples by HPLC using an acidic mobilephase containing octanesulfonate. Anal. Sci. 2015, 31, 831–835. [CrossRef] [PubMed]
33. Jeong, Y.-I.; Kim, D.H.; Chung, K.D.; Kim, Y.H.; Lee, Y.S.; Choi, K.-C. Antitumor activity of trigonelline-incorporated chitosannanoparticles. J. Nanosci. Nanotechnol. 2014, 14, 5633–5637. [CrossRef]
34. Liao, J.C.; Lee, K.T.; You, B.J.; Lee, C.L.; Chang, W.T.; Wu, Y.C.; Lee, H.Z. Raf/ERK/Nrf2 signaling pathway and MMP-7 expressioninvolvement in the trigonelline-mediated inhibition of hepatocarcinoma cell migration. Food Nutr. Res. 2015, 59. [CrossRef][PubMed]
35. Bouma, G.; van Faassen, M.; Kats-Ugurlu, G.; de Vries, E.G.E.; Kema, I.P.; Walenkamp, A.M.E. Niacin (Vitamin B3) Supple-mentation in Patients with Serotonin-Producing Neuroendocrine Tumor. Neuroendocrinology 2016, 103, 489–494. [CrossRef][PubMed]
36. Heng, B.; Lim, C.K.; Lovejoy, D.B.; Bessede, A.; Gluch, L.; Guillemin, G.J. Understanding the role of the kynurenine pathway inhuman breast cancer immunobiology. Oncotarget 2016, 7, 6506–6520. [CrossRef]
37. Lyon, D.E.; Walter, J.M.; Starkweather, A.R.; Schubert, C.M.; McCain, N.L. Tryptophan degradation in women with breast cancer:A pilot study. BMC Res. Notes 2011, 4. [CrossRef] [PubMed]
38. Suzuki, Y.; Suda, T.; Furuhashi, K.; Suzuki, M.; Fujie, M.; Hahimoto, D.; Nakamura, Y.; Inui, N.; Nakamura, H.; Chida, K.Increased serum kynurenine/tryptophan ratio correlates with disease progression in lung cancer. Lung Cancer 2010, 67, 361–365.[CrossRef] [PubMed]
39. Boyland, E.; Williams, D.C. The metabolism of tryptophan. 2. The metabolism of tryptophan in patients suffering from cancer ofthe bladder. Biochem. J. 1956, 64, 578–582. [CrossRef] [PubMed]
40. Gamagedara, S.; Kaczmarek, A.T.; Jiang, Y.; Cheng, X.; Rupasinghe, M.; Ma, Y. Validation study of urinary metabolites as potentialbiomarkers for prostate cancer detection. Bioanalysis 2012, 4, 1175–1183. [CrossRef]
41. Aronov, P.A.; Luo, F.J.-G.; Plummer, N.S.; Quan, Z.; Holmes, S.; Hostetter, T.H.; Meyer, T.W. Colonic contribution to uremicsolutes. J. Am. Soc. Nephrol. 2011, 22, 1769–1776. [CrossRef]
42. Lees, H.J.; Swann, J.R.; Wilson, I.D.; Nicholson, J.K.; Holmes, E. Hippurate: The natural history of a mammalian-microbialcometabolite. J. Proteome Res. 2013, 12, 1527–1546. [CrossRef] [PubMed]
43. Cheng, Y.; Xie, G.; Chen, T.; Qiu, Y.; Zou, X.; Zheng, M.; Tan, B.; Feng, B.; Dong, T.; He, P.; et al. Distinct urinary metabolic profileof human colorectal cancer. J. Proteome Res. 2012, 11, 1354–1363. [CrossRef] [PubMed]
44. Monteiro, M.S.; Barros, A.S.; Pinto, J.; Carvalho, M.; Pires-Luís, A.S.; Henrique, R.; Jerónimo, C.; Bastos, M.D.L.; Gil, A.M.; GuedesDe Pinho, P. Nuclear Magnetic Resonance metabolomics reveals an excretory metabolic signature of renal cell carcinoma. Sci. Rep.2016, 6. [CrossRef] [PubMed]
45. O’Keefe, S.J.D.; Li, J.V.; Lahti, L.; Ou, J.; Carbonero, F.; Mohammed, K.; Posma, J.M.; Kinross, J.; Wahl, E.; Ruder, E.; et al. Fat, fibreand cancer risk in African Americans and rural Africans. Nat. Commun. 2015, 6, 6342. [CrossRef] [PubMed]
46. Tang, W.H.W.; Wang, Z.; Levison, B.S.; Koeth, R.A.; Britt, E.B.; Fu, X.; Wu, Y.; Hazen, S.L. Intestinal Microbial Metabolism ofPhosphatidylcholine and Cardiovascular Risk. N. Engl. J. Med. 2013, 368, 1575–1584. [CrossRef] [PubMed]
47. Dumas, M.E.; Barton, R.H.; Toye, A.; Cloarec, O.; Blancher, C.; Rothwell, A.; Fearnside, J.; Tatoud, R.; Blanc, V.; Lindon, J.C.; et al.Metabolic profiling reveals a contribution of gut microbiota to fatty liver phenotype in insulin-resistant mice. Proc. Natl. Acad. Sci.USA 2006, 103, 12511–12516. [CrossRef]
48. Jung, J.; Jung, Y.; Bang, E.J.; Cho, S.-I.; Jang, Y.J.; Kwak, J.M.; Ryu, D.H.; Park, S.; Hwang, G.S. Noninvasive Diagnosis and Evaluationof Curative Surgery for Gastric Cancer by Using NMR-based Metabolomic Profiling. Ann. Surg. Oncol. 2014, 21, 736–742. [CrossRef]
49. McShane, L.M.; Altman, D.G.; Sauerbrei, W.; Taube, S.E.; Gion, M.; Clark, G.M. Statistics Subcommittee of the NCI-EORTCWorking Group on Cancer Diagnostics Reporting recommendations for tumor MARKer prognostic studies (REMARK). Nat. Clin.Pract. Oncol. 2005, 2, 416–422.
50. Dona, A.C.; Jiménez, B.; Schäfer, H.; Humpfer, E.; Spraul, M.; Lewis, M.R.; Pearce, J.T.M.; Holmes, E.; Lindon, J.C.; Nicholson,J.K. Precision High-Throughput Proton NMR Spectroscopy of Human Urine, Serum, and Plasma for Large-Scale MetabolicPhenotyping. Anal. Chem. 2014, 86, 9887–9894. [CrossRef]

Cancers 2021, 13, 374 16 of 16
51. Spraul, M.; Nicholson, J.K.; Lynch, M.J.; Lindon, J.C. Application of the one-dimensional TOCSY pulse sequence in 750 MHz1H-NMR spectroscopy for assignment of endogenous metabolite resonances in biofluids. J. Pharm. Biomed. Anal. 1994, 12, 613–618.[CrossRef]
52. Beckonert, O.; Keun, H.C.; Ebbels, T.M.D.; Bundy, J.; Holmes, E.; Lindon, J.C.; Nicholson, J.K. Metabolic profiling, metabolomicand metabonomic procedures for NMR spectroscopy of urine, plasma, serum and tissue extracts. Nat. Protoc. 2007, 2, 2692–2703.[CrossRef] [PubMed]
53. Fonville, J.M.; Maher, A.D.; Coen, M.; Holmes, E.; Lindon, J.C.; Nicholson, J.K. Evaluation of full-resolution J-resolved 1H-NMRprojections of biofluids for metabonomics information retrieval and biomarker identification. Anal. Chem. 2010, 82, 1811–1821.[CrossRef] [PubMed]
54. Veselkov, K.A.; Lindon, J.C.; Ebbels, T.M.D.; Crockford, D.; Volynkin, V.V.; Holmes, E.; Davies, D.B.; Nicholson, J.K. RecursiveSegment-Wise Peak Alignment of Biological 1H-NMR Spectra for Improved Metabolic Biomarker Recovery. Anal. Chem. 2009,81, 56–66. [CrossRef] [PubMed]
55. Dieterle, F.; Ross, A.; Schlotterbeck, G.; Senn, H. Probabilistic quotient normalization as robust method to account for dilution ofcomplex biological mixtures. Application in 1H-NMR metabonomics. Anal. Chem. 2006, 78, 4281–4290. [CrossRef]
56. Trygg, J.; Wold, S. Orthogonal projections to latent structures (O-PLS). J. Chemom. 2002, 16, 119–128. [CrossRef]57. Benjamini, Y.; Hochberg, Y. Controlling the False Discovery Rate: A Practical and Powerful Approach to Multiple Testing. J. R.
Stat. Soc. Ser. B 1995, 57, 289–300. [CrossRef]58. Robin, X.; Turck, N.; Hainard, A.; Tiberti, N.; Lisacek, F.; Sanchez, J.C.; Müller, M. pROC: An open-source package for R and S+ to
analyze and compare ROC curves. BMC Bioinform. 2011, 12. [CrossRef]59. Cloarec, O.; Dumas, M.-E.; Craig, A.; Barton, R.H.; Trygg, J.; Hudson, J.; Blancher, C.; Gauguier, D.; Lindon, J.C.; Holmes, E.;
et al. Statistical Total Correlation Spectroscopy: An Exploratory Approach for Latent Biomarker Identification from Metabolic1H-NMR Data Sets. Anal. Chem. 2005, 77, 1282–1289. [CrossRef]
60. Posma, J.M.; Garcia-Perez, I.; De Iorio, M.; Lindon, J.C.; Elliott, P.; Holmes, E.; Ebbels, T.M.D.; Nicholson, J.K. Subset optimizationby reference matching (STORM): An optimized statistical approach for recovery of metabolic biomarker structural informationfrom 1H-NMR spectra of biofluids. Anal. Chem. 2012, 84, 10694–10701. [CrossRef]