circuit efficiency -' a novel tool for energy audit in...
TRANSCRIPT
Journal of Scientific & Industrial ResearchVol. 60, February 200 I pp 96-111
Circuit Efficiency -' A Novel Tool for Energy Audit in Industrial Utilities
M Siddhartha BhattCentral Power Research Institute, Energy Research Centre, Trivandrum 695 017 ,India
E-mail: [email protected]: [email protected]
This paper presents an analytical diagnostic tool for energy audit of industrial utilities. The overall circuit efficiency (whichis the transfer function relating the input energy to the energy used at the end point) is determined as a product of the segmentenergy efficiencies using experimental plant data as inputs. These component efficiencies will provide clear information on thepattern of energy losses and will aid in decision support for evolution of energy conservation measures. It has been utilized forsteam, air conditioning (cooling), compressed air, and water pumping systems. The technique does not address exergetic losses.
IntroductionAn energy audit is a technique to establish the current
status of energy efficiency of an industrial system. It in-volves identifying energy losses, quantifying them, esti-mating energy conservation potential and proposing vi-able and economically attractive solutions. The ultimateend result of such an exercise is to improve the systemperformance, increase its efficiency by minimizing lossesand introduce favourable design changes leading to ret-rofits, renovation, modernization and upgradation.
After conducting energy audits in over fifty diversi-fied process industries, a general technique or frame-work for analysis has been evolved. This technique isable to pinpoint precisely and quantify the areas wherelosses occur. It involves identifying the utilities in theindustry and evaluating their component energy efficien-cies which are then used to compute their circuit effi-ciency. The input data needed for the calculations areessentially from experimental measurements (flows, tem-peratures, pressures, voltages, currents, phase angles,chemical compositions, acidity, alkalinity and relativehumidity), the absence or inaccuracy of which limits theusefulness of this technique.
The circuit efficiency provides a bird's eye view ofwhere and how losses occur in an industry, though itdoes not address exergetic losses. It also provides anoverview of where energy conservation measures willbe most effective. Another advantage is that this tech-nique will enable beginners having less exposure to en-
ergy audit methodology to pin point areas of high en-ergy losses which would otherwise require skilled audi-tors. Hence, the circuit efficiency is an excellent tool forenergy audit. The question of generality of this techniqueto conform to the extreme diversity of arrangement, con-figuration and circuitry of equipment in industry has beenaddressed and the majority of the systems can be ana-lyzed satisfactorily by using these formulae recursivelyor in parallel. Numerous case studies of energy auditswhere this technique has been used in boilers land airconditioning plants 2 have been reported.
Here, the theory of the circuit efficiency, as appliedto four utilities viz., steam circuits, air conditioning (cool-ing) circuits, compressed air circuits and water pumpingsystems is presented. Computer codes have been evolvedfor these and the technique has been used successfullyin industrial energy auditing.
The mathematical formulations and the resultsof efficiencies in industries as well as the best practiceguides are presented subsequently. These efficiencies areof experimental origin and not based on predictive math-ematical models. Several suggestions for energy conser-vation 3-5 fit well into this framework.
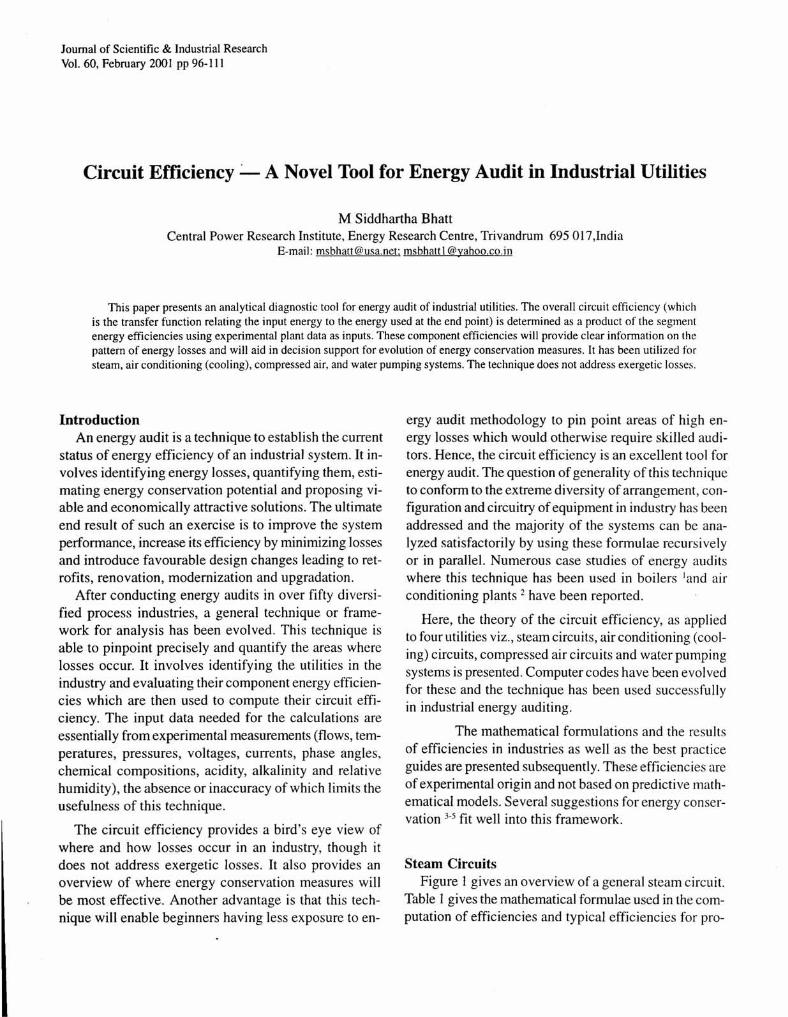
Steam CircuitsFigure I gives an overview of a general steam circuit.
Table I gives the mathematical formulae used in the com-putation of efficiencies and typical efficiencies for pro-

COMBUSTOR
BHATT: CIRCUIT EFFICIENCY
MAIN STEAM L1N�-"'" RETURN LINE
BOILE R
AIR
FUEL
USEFUL", TASKS
CONDENSATE
EE RETURN
F 0 P UM P r--_=__-----'I
FE ED TANK
Figure I - A view of a general steam circuit
97
cess boilers and their associated steam circuits. Table I also describes the fol lowing facts: rt-----'HE AT EXCHANGER I
(i) The minimum requirements of the steam circuit are that the main steam must be superheated, return must be sub-cooled liquid and a high fraction of the condensate must be recycled.
( i i) The greenhouse emission reduction potential is computed considering the calorific value of fuels used in the boilers . The enthalpy Of steam in industrial applications is between 2,500 to 3,500 kJlkg and the calorific value of fuels used in industrial boilers are between 14,000 to 50,000 kJlkg.
The causes of energy losses and remedial action are given in Table 2.
Air Conditioning (Cooling) Circuits
Figure 2 describes the flow paths in an Ale plant. Table 3 gives the mathematical formulae and the results of typical component efficiencies of the Ale systems. The following facts are to be noted:
REFRIGERAN CIRCUIT
CHILLER
COOLING TOWER
ir AHU ROOM
RETURN DU CT
ONDITIONE D � �PACE .-
Figure 2 - A schematic of an air conditioning (cooling) plant

98
(i)
( i i)
( i i i)
J SCI IND RES VOL 60 FEBRUARY 200 1
VI.2 V2
TANK
V4
USE FULL TASKS
USE FULL TASKS
Figure 3 - A schematic of a compressed air system
The chi ller in the present context, refers to the losses, infiltration losses, heating losses and shell and tube heat exchanger with refrigerant thermal i n-leaks 6. flow on the shell side (evaporator portion of the refrigerant circuit) and water flow on the (iv) In most cases, NC plants are operated inter-tube s ide. The AHU refers to a coil type heat mittently for 8-20 hid. One of the measures to exchanger (where chi l led water is circulated save energy is to put off the refrigerant circuit through the inside of the coil and air blowing but continue running the chil led water pumps over i t in forced convection). The air under low and AHUs, thereby recouping the residual cool-pressure is transferred through the cold duct ing effect in the chilled water. The cut-off time into the conditioning space. The circuit is com- ratio accounts for the difference in operating pleted by a return duct through which the re- time of the compressor motors and the cool ing tum air is discharged into the AHU room, where loads. it mixes with fresh air, before cycl ing i nto the cold duct. (v) The greenhouse emission reduction potential
is computed considering the national average In most of the NC plants, chil led water lines values (with a confidence limit of 95 per cent) and refrigerant l ines are often hermetically of the power generating system: sealed without access to flow measurement. Hence the cooling load can be computed at the • Calorific value of coal (which accounts for over AHU by measurement of the change in tem- 75 per cent of the power generation): 1 5,360 kJI perature relative humidity of the air along with kg. its flow rate. From this point, measurements are • Fraction of carbon in power station coal : 43 per made, both in the direction of chi lled air flow cent. (cold duct, conditioned space and return duct) • Gross overall efficiency of thermal power plant: and in the direction of chil led water flow (chiller 30 per cent ; Aux i l iary effic iency of thermal and refrigerant circuit). power plant: 90 per cent; Transmission and dis-
tribution efficiency: 78 per cent. The net effi-The dispersive losses i n the conditioned space ciency of the power generating system is there-are determined by computing the ventilation fore 21 .06 per cent. The greenhouse burden at

BHATT: CIRCUIT EFFICIENCY 99
INLET TANK LINE USEFULL
� TASKS
COOLER INTAKE LINE
PUMP-MOTORS
Figure 4 - A view of a typical water pumping system
the beginning of the industrial conversion chain is 1 .755 kg/kWh and increases along the conversion chain.
The solutions for improvement in the system efficiencies 1.2 are given in Table 4.
Compressed Air Circuits
The compressed air system (Figure 3) cannot be evaluated in the normal running condition as the other utilities. It has to be evaluated through a test scheme composed of leakage tests at different sections of the system such as, inlet side of the tank, tank proper and outlet side of the tank. For each of the leakage tests, the storage tank is charged/discharged between the cut-in and cut-out l imits.
Table 5 gives the mathematical formulae and the results of typical component efficiencies of the compressed air circuit. The following facts are observed:
( i) The tank efficiency refers to the mechanical energy loss in the tank due to leakage from the tank connections and isolation valves.
( i i ) When cylinder un-loading is present, power is drawn by the motors but there is no throughput of compressed air.
( i i i ) The procedure can also be used for evacuated systems energized by vacuum pumps.
(iv) The procedure followed for the estimation of greenhouse emission reduction potential is same as that used in Ale plants.
In the case of vacuum pumps the evacuation time is given by,
. . . ( I)
Using Eq. (I), the evacuation time is given by,
t = (vlV)ln[ {(P"vlV) - (plt)" ... )/{ (pvlV) - (plt)bk )]. .. (2)
The experimental data on compressed air systems are fitted to a curve of the form,
... (3)
The curve fits for data on compressed air systems are given in Table 6.
The causes for the various losses and strategies for improvement in the system efficiencies are given in Table 7.
Water Pumping Systems
Figure 4 gives a view of a typical water pumping system.
Table 8 gives the mathematical formulae the results of typical component efficiencies of the water pumping systems. From Table 7, we may observe as follows:

100 J SCI IND RES VOL 60 FEBRUARY 2001
(i) Water pumping plant operation is highly unsteady and only time averaged steady state power is relevant.
(ii) The efficiencies are evaluated at the balance point (flow rate at which the pressure drops of the system match with the pressure gain in the pumps) .
(iii) The pressure drop across the circuit can be classified as pressure drop in equipment cores, frictional pressure drop in lines, pressure drop due to piping elements like valves, constrictions, bends, orifices, expansions and bends.
(iv) The procedure followed for the estimation of greenhouse emission reduction potential is same as that used in AlC plants.
The experimental data are fitted in the form of Eq. (3). In the case of two independent variables the data are fitted to a curve of the form,
The constants in the curve fits are given in Table 9. The reasons for various losses and solutions for increase in the system efficiencies are given in Table 1 0.
Conclusions
The study concludes as follows: (i) The main problem in the utilities studied is that
of lack of two way communication between the utility (supply of steam, chil led water, compressed air or compressed water) and the end use requirement. As a result the utilities overproduce leading to a high level of wastage. Introduction of on-off, proportional-integral-differential or logic based controls can eliminate losses due to the source-load mismatch.
(ii) Introduction of optimal storage of steam, compressed air, chilled water and pumped water inbetween the source and the end tasks wil l
smoothen out fluctuations and minimize the specific energy consumption.
(iii) Introduction of external and internal feedback loops can induce better elasticity of the outputs to the energy inputs.
(iv) Use of low energy consuming mechanical alternatives such as cyclone separators and filter presses for moisture removal, vacuum evaporators; evaporative cooling and steam jet ejectors for lo'w head water pumping, in series with the existing utilities can reduce the specific energy consumption.
(v) The best practice component efficiencies can be used as bench marks for setting energy conservation standards in various sections of the plant.
(vi) The energy conservation potential is as follows:
• Steam systems: 29.3 per cent. • Air conditioning systems: 62.3 per cent. • Compressed air systems: 37.7 per cent. • Water pumping systems: 76.0 per cent.
References Bhatt M Siddhartha, Energy conservation in refrigeration and
air conditioning systems through system simulation, Technical Report No. 292, (Central Power Research Institute, Bangalore-560 094, India) 1 996a, 40- 1 02.
2 Bhatt M Siddhartha, Energy conservation in refrigeratioll and
air conditioning systems through system simulation, CPRI News, No. 58, (Central Power Research Institute, Bangalore-560 094, India) 1 996b, 2-4.
3 Steam: Its generation and use (Babcock and Wilcox Co. , New York) 1 983.
4 O'Callaghan P W , Energy Management (McGraw Hill Co., Berkshire) 1 993.
5 Eastop T D & Croft D R, Energy Efficiency (Longman Scientific and Technical, Essex) 1 990.
6 Stoecker W F & Jones J W , Refrigeration and air conditioning(McGraw Hill, Singapore) 1 984.
7 Bhatt M Siddhartha, Energy audit case studies I-Applications to boilers, Appl Therm Eng, 20 (2000) 285-296.
8 Bhatt M Siddhartha, Energy audit case studies II-Applications to air conditioning (cooling) systems, Appl Then/! Eng, 20
(2000) 297-307.

a(). aJ' � . . . . a.
A
AlC
AHU
C
cos cp E
fc
G
h
m
me
N
P P
PER
Q (kW)
R
SEC
T
tr
TR
v
v X Y
Z
Greek letters Ll .., e t
V
B HAll: CIRCUIT EFFICIENCY
Nomenclature
-Constants in curve fits
-Area of cross section (m2)
-Air conditioning
-Air handling unit
-Calorific value of fuel (kJ /kg)
-Power factor (dimensionless)
-Energy conservation potential
(dimensionless or per cent of energy input)
-Fraction of carbon in fuel (dimensionless)
-Greenhouse emission reduction potential (kg/kWh at user end)
-Enthalpy (kJ/kg)
-Current (A)
-Mass flow rate (kgls)
-Mechanical
-Speed (r p m)
-Pressure (kPa)
-Steady electrical power input (kW)
-Primary energy ratio (kW of cooling load! kW of electric input)
-Rate of thermal energy added/withdrawn
-Gas constant of air (0.287 kJ /kg K)
-Specific energy consumption (kW ITR: for AlC plants; kWh let of fluid output): for other systems)
-Time (s)
-Temperature (0C)
-Time ratio (cylinder loading time/cycle time of compressor motor) (dimensionless)
-Tonne of refrigeration ( I TR=3.5 1 69 kW)
-Voltage (kV)
-Volume flow rate (m] Is)
-Independent variables
-Dependent variables
-Independent variables
-Change in variable
-Efficiency (dimensionless or per cent)
-Energy loss coefficient
-Torque (Nm)
-Volume of air storage tank (m])
-Summation
Subscripts A
aux
B
c
C CH ckt cI cu E f h I in
L loss I I 12 leak m M me n new
o o off on out p P
PG
r
Rc
R
S
T
Th Total
U
V
W
1 0 1
-Air handling unit
-Auxiliary
-Boiler
-Combustion
-Compressor -Chiller -Circuit -Cylinder loading of compressor -Cylinder un-loading of compressor -Evaporator -Fuel -Heat transfer -Input -Inlet -Steam line -Cooling at the conditioned space -Dispersive losses -Inlet line to storage tank -Exit line from storage tank -Leakage from compressed air circuit -Material -Motor -Mechanical -Net energy absorption -New value after incorporating energy conserva
tion measures -Ambient -Overall system -Compressors off but auxiliary motors on -Compressors and auxiliaries on -Exit -Pressure -Pump
-Power generating system
-Condensate recovered
-Re-circulation
-Refrigerant
-Shaft (motor-compressor/pump)
-Tank
-Theoretical
-total operating period
-Useful end task
-Volumetric
-Chilled water

102 J SCI IND RES VOL 60 FEBRUARY 2001
Table I-Mathematical descri ption of component efficiencies and related variables of steam systems
Description
Energy in hot flue gas
Energy in fuel supplied to boiler
Energy absorbed by water-steam
Energy in condensate recovered
Energy in steam at boiler outlet
Combustion efficiency per cent
Heat transfer efficiency per cent
Material efficiency per cent
Boiler efficiency per cent
Factor of un-recovered condensate per cent
Steam line efficiency per cent
Useful task efficiency per cent
Overall circuit efficiency per cent
Energy conservation potential per cent
Greenhouse emission reduction potential [ kg! (kg of steam at end point) ]
Formulae Range
Q,=L(mC)
Q,,=L(mMl)
Q,=L(m�h)
90.0-94.0
90.0-95.0
97.0-98.0
78.6-87.5
90.0-100.0
70.0-78.5
110 = Qj(QB - Q) 35.0-55.0
19.2-42.0
G=[fc(44112)(h/C)] [( 1/110)-( I 1110.,,,,)]
Best practice guide
96.0
96.0
99.5
9 1 .7
85.0
87.0
63.3
59.4
29.3
0. 1 6

B HA1T: CIRCUIT EFFICIENCY 103
Table 2 - Steam system component efficiencies-causes and remedial action
Causes for low efficiency
Combustion efficiency- Excess air through ingress, in-leaks and excessive blowing of fans; unconverted or partially converted fuel in ash, unconverted gaseous products in flue gases and fuel rejects
Heat transfer efficiency- Low area of contact, low temperature difference between the flue gas and water/steam, low cleanliness of the heat transfer surfaces and poor hydrodynamics of water, steam and flue gas
Material efficiency- Energy losses due to physical loss of water/steam due to continuous blow down, intermittent blow down, venting from boiler drum, release of pressure relief valves in the boiler; extraction of steam from boiler before main steam outlet for steam jet ejectors and water treatment plant
Steam line efficiency-Loss in the main steam line and in return line (after completion of the useful tasks). These includes energy loss in the line due to heat dissipation from the surface of pipelines; steam loss from steam traps, flanges, valve bodies, threaded joints, drips; steam loss from venting and leakage; and mal operation of steam traps resulting in water flow in steam lines
Useful task efficiency- Energy lost due to poor geometric configuration of the task set up; inefficient tracking of the useful tasks by the steam flow (poor control of the useful load by the steam source), surface heat loss of end task equipment, steam condensation end use equipment
Un-recovered condensate factor-Draining away hot condensate due to contamination, excessively long distance between end use and feed tank or non-availability of liquid lines, energy losses due to physical draining of condensate out of the system and escape of steam-air mixture from the ejector exhaust and deaerator
Overall circuit efficiency- Poor communication between the steam generator and end use, air or oxygen in steam (which suppress the saturation temperature, heat transfer and cause air blanketing) which leads to uneven distribution
Remedial action for improvement in efficiency
Combustion efficiency -Minimizing excess air (air fans, il legal furnace ingress and the air pre-heater in-leakage), automation of co-ordination of forced-induced draft fans; and Improvement in atomization efficiency, uniformity in fuel size, fireball symmetry, furnace turbulence, ejection geometry of fuel, turn down ratio of burners and burner management system for multiple burner boilers
Heat transfer efficiency- Ensuring adequate heat transfer surface, high cleanliness on the furnace and water sides by on line and off line cleaning schedules (scale control , corrosion control and erosion control), low furnace skin radiation by cold side insulation and staggered of steam demand to ensure constant non-fluctuating loading and introduction of air pre-heating, economizer and flue gas recycling
Material efficiency--Replacing use of high pressure live steam (for steam jet ejection, de aerator pegging, steam coil air pre-heater, etc.) with low grade steam; and minimizing loss of steam through blow down (optimal contaminant control and flash steam recovery), venting, frequent lifting of pressure relief valves, bypass t10ws into drains
Steam line efficiency- Use of heat recovery devices (stack steam condensers, vent steam condensers and gland steam condensers) and ensuring that only superheated steam enters the main line; that only sub-cooled liquid enters the return line after the useful tasks; that steam traps do not leak steam, that redundant piping/equipment loads are isolated, that pipe sizes are based on volumetric flow rather than on size of end use connectors; and that the pipe lines are laid on the shortest route rather than on the building layout
Useful task efficiency-Ensuring co-generation in place of throttling, adequate heat transfer surface area, minimum bypass of useful steam into drain, shorter processing time, accurate control of temperatureltlow of steam into end task equipment, effective deaeration, pre-heating of products before steam heating, changeover from indirect to direct heating, slight reduction in pressure of steam just prior to its end use and losses from seals, glands, drains and vents are minimized
Un-recovered condensate factor-Minimizing steam/water loss (deaerator steam-air venting, ejector steam-air venting, drains, flash steam, etc.), ensuring that all condensate is recycled, use of filters for condensate which is in indirect contact (heat exchangers) with oils, chemical treatment of condensate in deaerator, use of condensate polishing, adequate size and insulation of condensate return piping
Overall circuit efficiency-Use of new technology: Automation of sub-systems (task-source control, blow down, burner operation, combustion controls, feed pump pressure control, load management, soot blowing, etc.) , use of erosion resistant seating materials (to minimize passing of drain valves, balancing valves and re-circulation valves) , reverse osmosis water treatment plants, and mechanical moisture removal processes (filter presses, roll squeezing, centrifugal hydro-extractors, cyclone separators, air knives, steam jet ejector based vacuum drying, etc.) before thermal moisture removal

104 J SCI IND RES VOL 60 FEBRUARY 2001
Table 3 -Mathematical description of component efficiencies and related variables of air-conditioning systems
Description
Mechanical power in refrigerant at compo Out
Electrical input to compressor motors
Electrical input to motors of auxiliaries
Shaft power to compressors
Cooling load output of AHU
Cooling effect to cooling space
Cooling load to chilled water circuit
Cooling load at chiller outlet
Cooling load at evaporator
Useful cooling load
Useful efficiency per cent
AHU energy efficiency per cent
Efficiency of chilled water circuit per cent
Energy efficiency of chiller per cent
Energy efficiency of evaporator per cent
Coefficient of performance of refrigerant circuit (dimensionless)
Compressor efficiency per cent
Compressor motor efficiency per cent
Auxiliary power efficiency per cent
Cut-off time ratio per cent
Specific energy consumption (kWrrR of useful cooling load)
Overall circuit eft1ciency per cent
Primary energy ratio (dimensionless)
Energy conservation potential per cent
Greenhouse emission reduclion potential (kg l(kWh at task end) )
Formulae
p,.M=I(-V3v I cos cj» p,."ux=I(-V3v I cos cj» p,.c =I (tN/60000)
QA= I(m�h)
QL = I(m�h)
Qw= I(m�h)
QCH= I(m�h)
QE= I(m�h)
Tlu = (QjQL)
TlA = (QJQA)
Tlw= (Q/Qw)
TlCH = (QJQCH)
TlE = (QCiQE)
TlR = (Q/Pc)
Tlc = (P JPl.c)
TlM = (P,.JP'M)
Tl,ux = [P'.M/(P'M+P, .• u')]
SEC =3.5169 (P,. M + p' .• u,) IQL
PER= Tl"TlR= Q/(P'.M + p'.,u') [aJ
E = [ 1- (TlJTl".nc)J
G =[ft:(44112)(3600IC)/TlPGJ [( 1 ITl)-( I ITlo.,,,,) J
[aJ PER= [QjQL] [QJQA][Q/QWJ[QJQCHJ[QciQEJ[Q/P c] [P JP,.c] [P,.JP'.MJ
X[P'.M/(P'.M+P,.,U')] [t,,,,,, /(I,,,ta1-t,,n.)]
Range Best praclice guide
86.0-90.0 94.0
40.0-60.0 90.0
90.0-94.0 �g.O 99.6-99.9 99.9
96.0-98.0 99.0
1.8-4.6 8.0
48.0-60.0 65.0
78.0-82.0 90.0
40.0-70.0 80.0
60.0-70.0 50.0
2.59 1.50
6.3-28.5 76.7
0.1 1-1.3 1 6. 14
62.8
3.87

BHA1T: CIRCUIT EFFICIENCY 1 05
Table 4 - Solutions for improvement in air conditioning system component efficiencies
Causes for low efficiency
Compressor efficiency - Contamination of refrigerant (air, moisture or nitrogen), inadequate inter cooling in multi-stage machines and excessive/deficient charging of refrigerant into circuit
Auxiliary power efficiency - No communication between the cooling requirement and the operation of the auxiliaries; scaling, debris, biological growth and corrosion in the condenser, condenser cooling water line and cooling tower
Coefficient of performance of refrigerant circuit - Decrease in evap(lrator pressur�, increase in condensing pressure, decrease in condensate sub-cooling, decrease in vapor super heating to normal, fouling of evaporator (lubricating oil or air contamination), scaling in condenser and inefficient response of the expansion device
Evaporator efficiency - Losses due to cycling of incondensible components, decreased evaporator pressure and decreased degree of superheat
Chiller efficiency - Ice formation and its propagation along the chiller pipeline, surface heat infiltration on area exposed to the atmosphere and damaged insulation
Chilled water line efficiency - Excessive length of chilled water line, damage of thermal insulation in line length exposed to weathering and unsteady flow of chilled water due to line hydrodynamics
Air handling unit (AHU) efficiency - Loss of chilled air cooling effect in cold duct, return duct and in AHU room; and cooling of AHU room instead of conditioned space
Useful cooling effect - Heat gain (solar radiation, building walls, heaters, electric motors, etc.), air infiltration leakage (exhaust fans, door openings), .redundant cooling spaces, ineffective temperature control
Remedial action for improvement in efficiency
Compressor efficiency - Operation at the maximum efficiency point, overhaul of compressors (to prevent internal leakage, inadequate lubrication, etc.), sequential cyclic loading of compressor for even wear, optimal compression ratio of compressor
Auxiliary power efficiency - Control of scaling, corrosion and erosion; cleaning of air filters of AHU fans, hydrodynamic matching of pumps-pipes to obtain maximum flow, minimizing electrical abnormalities (un-symmetric voltage/current profiles, resistive drops and phase misalignment), revamping of pumps/fans with eroded/corroded impellers/ casings, restoration of c1eanliness/ surface finish in internal circuits; and use of variable speed drives (for control of condenser pumps, chiller pumps, AHU fans and on-off control for cooling tower fans)
Coefficient of performance of refrigerant circuit - Tuning of the system to restore the refrigerant pressures, use of integrally finned tubes and spiral tubing and avoiding manual control valves in series or in the bypass of automatic flow regulating valves
Evaporator efficiency - Improving thermal quality al' :hickness of insulation; and quality of workmanship (to eliminate water ingress, moisture condensation, etc.)
Chiller efficiency - Imprevement in thermal insulation of chiller and substitloticn of common pump bay chiller configuration with dedicated pumps for each chiller in parallel
Chilled water line efficiency - Improvement in thermal insulation of the lines and providing cladding (to protect insulation from moisture, ingress, mechanical damage and weathering)
Air handling unit (AHU) efficiency - Introduction of thermostatic control for operation of AHUs, ensuring that the cold and return ducts are proof against heat ingress/cold air leaks and use of heat recovery wheels to recuperate cooling effect from return line
Useful cooling effect - Review of redundant heat gains and comfort conditions and relaxation of these, re-distribution of air flow in the conditioned space to make it more effecti ve, ensuring that the range of comfort conditions are maintained (by effecti ve control of temperature, relative humidity and direction of air flow), Installation of ingress proof equipment (false roofing, automatic door closers, revolving doors, double doors and sun control film for window panes), sealing gaps/holes, and control of the number of air changes based on operating infiltration
Overall system - Improvement in quality, accuracy and reliability of primary temperature sensors (RTDs) and thermostats; automation of plant by logic based controls, and in areas of low relative humidity, use of evaporative cooling and vacuum cooling system in series with the NC plant

106 J SCI IND RES VOL 60 FEBRUARY 200 1
Table 5 - Mathematical description of efticiencies and variables of compressed air units.
Description
Tank pressure during charge/discharge
Charge/discharge rate
Volume flow rate at compressor outlet
Volume flow rate at the tank inlet
Volume flow rate at tank outlet
Volume flow rate at useful end
Shaft power
Motor power with loaded cylinders
Mechanical power to compressor
Mechanical power in air at compo out
Mechanical power in air at tank inlet
Mechanical power in air at tank outlet
Mechanical power in air at useful end
Volumetric efficiency of compo per cent
Pressure/hydrodynamic efficiency of compo per cent
Mechanical efficiency per cent
Compressor efficiency per cent
Motor efficiency per cent
Efficiency of tank inlet side circuit per cent
Tank efficiency per cent
�fficiency of tank outlet side circuit per cent
Material utilization efficiency per cent
Cylinder loading efficiency of compressor-motor unit per cent
Overall circuit efficiency per cent
Specific energy consumption kWh (t of compressed air)-')
Energy conservation potential per cent
Greenhouse emission reduction potential (kg /(kWh at task end) )
Formulae
fip, m = vfip/[R(273. 15+ T )(tl60)J
V =V -V C,out C,in C, leak
V =V -V t,in C,OU! II, leak
V =V.-V Lilul 1.111 I,lcilk
V"=V -V I.uut le .. k,12
P, = L:tN/60000
P, = I'l/3v I cos <I> PC.'h = V C.'h(PC.tl'- p)
Pc = V c.,,"'(Pc .... , - p)
PI.in = V Un(Pl.in - p)
PI.UUI = V 1,nul(PcuU'- p) p" = V"(p" - p)
llv = Vc."jV C',h
IIp = (Pc."u, - p)/ (Pc.tl, - p) ll"", = Pe . ./P M .. ,
lle =TJvllpTJn", =P d PM"
TJM = PM/PI
TJII = p,.iPe 11, = Pl.ou,lPt.in
llil = PiP,.,,",
11111= mime,nul
lld = P/[PI+ {( 1.0- tr)PI .• " IJ
ll" = TJMTJcllllTJ,lllzTJd [aJ
SEC = P/(3.6 m)
E = [ 1 - (llc!llo.ncw)J
G=[fc(44/ 12)(3600/C)/TJPGJ [( I /llo,,.,)-( I /TJ') J
Range
34.5-64.7
41.0-78.4
96.0-98.0
13.6-49.7
85.3-93.2
88.0-96.6
86.4-96.8
64.0-93.3
84.2-95.6
8 1.4-92.8
3.9-35.8
8 1.3- 154.4
Best practice
guide
80.0
80.0
99.6
63.7
94.0
98.0
99.0
100.0
99.0
)00.0
57.5
28.0
37.7
1.85

BHA1T: CIRCUIT EFFICIENCY
Table 6 - Constants in the curve fits for data on compressed air systems.
Particular
X: Area of opening/slit
Y: (SEC with opening)/
Range of values
Compressed air systems
0-125 mm2
0-1.5
(SEC without opening)
X: Inlet air temperature
Y: (m at D/(m at 15.5 0c) X: Inlet air temperature
Y: (SEC at T)/(SEC at 15.5 0c) X: Scale in compressed air pipe
Y: (SEC with scale)/
(SEC with no scale)
X: Age of compressed air plant
Y: (SEC at a given age)/
(SEC of new plant)
X: In (final vacuum)
Y: Rate of ingress in vacuum line (p/t)lcak in common industrial environment
X: In (final vacuum)
Y: Rate of ingress in vacuum line (p/t)lcak in good industrial environment
X: In (final vacuum)
Y: Rate of ingress in vacuum line (p/t)lcak . as best practice in industry
15.5-50°C
0.9-1.0
15.5-50°C
1.0-1.1
0-1.2 mm
1.0-1.06
0-15 Y 1.0-1.28
V acuum pumps
100-4000 Pa
0.1-0.5 Pas·1
100-4000 Pa
0.05-0.12 Pals
100-4000 Pa
0.01-0.02 Pals
1.00 0.003631
1.049181 -0.003173
0.951423 0.003134
1.0 0.053166
1.00 0.018705
-0.340305 0.0899884
-0.124664 0.037862
-0.006466 0.036840
107
•

1 08 J SCI IND RES VOL 60 FEBRUARY 2001
Table 7 - Solutions for improvement i n compressed air system component
efficiencies.
Causes for low efficiency
Volumetric efficiency (compressor)-Simultaneous operation of several compressors of different pressure ratings in the same line, air intake
at high temperature and ineffective inter-cooling due to scaling, fouling, under sizing of inter-cooler
Pressure efficiency (compressor)-Pressure drop inside compressors due to rough surfaces, restrictions
Compressor-motor efficiency-Mismatch of compressor and motor capacities
Inlet side of tank efficiency-Leakage in piping, high pressure drop in piping and increased capacity of plant with the same old piping
geometry
Storage tank efficiency-Leakage of compressed air from the suction and discharge valves of the tank, loss in compressed air during moisture
draining
Outlet side of tank efficiency-Leakage in piping, mal operation of solenoid valves controlling flow to the end tasks , long pipeline lengths,
low pipe diameters and excessive pressure drops in piping
Overall circuit efficiency-Inadequate storage tank capacity, overloading at some locations resulting in inconsistent air distribution elsewhere
Remedial action for improvement in efficiency
Volumetric efficiency (compressor)- Ensuring increased of tank size, tank pressure to the minimum required for the task and storage volume,
lower air inlet temperature, lower air temperature to inlet of second stage compressors (in two stage compressors) by effective heat transfer in
inter-cooler (fouling control, adequate coolant flow, adequate capacity of secondary cooling system, etc.), lower air temperature at inlet of
storage tank by effective heat transfer in the after-cooler and ventilation of air in the compressor room by passive cooling techniques
Pressure efficiency (compressor)- Cleaning/renewal of air filters, oil filters and packing o(compressors
Compressor-motor efficiency- Change over from bypass/throttle/suction unloading modes of flow control to soft starters, use of tank
sufficient to smoothen out load variations, .renovation of outdated compressors, and use of screw compressors as base load units and recip
rocating compressors as peak load units
Inlet side of tank efficiency- Review of pipe sizes vis-a-vis the present volumetric flow requirement
Storage tank efficiency-Automation of tank drain operation and overhaul and leak test on safety valves and non-return valves for blockage
or leak
Outlet side of tank efficiency-Re-Iaying of compressed air lines over 1 5 y old, replacement of leaking terminal plastic piping/joints, review
of pipe sizes vis-a-vis the present volumetric flow requirement, conversion of radial air lines to closed loop 'ring' type for flow uniformity,
lubrication of air tools and servicing of solenoid valves at the useful task end
Overall circuit efficiency- Review of the present pressure requirement at end point and adjustment of tank pressure accordingly, automation of compressed air system by programmable logic controllers, moisture removal from compressed air by active or passive devices, introduction
of flow metering at the outlet side of tank and review of end use equipment (vacuum aeration, electric tools, etc.)

BHAlT: CIRCUIT EFFICIENCY
Table 8 - Mathematical description of component efficiencies and related variables of water pumping systems
Description
Volume flow rate at pump outlet
Volume flow rate at end point of use
Electric power input to pump motors
Shaft power
Mechanical power in water at pump outlet
Mechanical power in end point of use
Mechanical power in re-circulated water
Mechanical power loss in circuit elements
Mechanical power input to pump
Volumetric efficiency of pump per cent
Pressure efficiency of pump per cent
Pump mechanical efficiency per cent
Pump efficiency per cent
Motor efficiency per cent
Circuit efficiency per cent
Re-circulation efficiency per cent
Material utilization efficiency per cent
Circuit pressure efticiency per cent
Overall circuit efficiency per cent
Specific energy consumption
(kWh! (t of water delivered»
Energy conservation potential per cent
Greenhouse emission reduction potential
(kg l(kWh at task end) )
Formulae
V = V -V P,IIUI P,in P,lcak
V =V -V U P,tKlI !.:kl.k:ak
PI = I;V3v I cos <I> P, = L:tN/60000
P p = V p(pp - p)
Pu = V,(Pu - p)
P ,,= V)pp- p)
PI .. " = I[(9/pA)m2J2]
P ?,u, = V P.u, (Pp.u, - p)
TI. = V IV,,,
TIp = (pp- p) I (pP.,,, - p,)
TI , .. , = P P.U,1P M.,
TIp = TI.TlpTl,,>c =P p IP M.,
TIM = P M.,IPI
TI'k' = P/[Pp-P,J
TI" = [Pp-PJlPp
11111 = m/mp,ou,
TIp." = (Pu-p,Y(pp-P')
TI" = TlpTlMTI'k,TI" [a]
SEC = P/(3.6 m)
E = [1- (TlJTlo"",)]
G=[fc(441 12)(3600/C)1
TlPG] [( I ITlo ... ,w)( 1ITlo)]
Range
48.0-63.0
62.0-74.0
95.0-97.0
28.3-45.2
75.0-82.0
23.0-39.0
65.0-90.0
80.0-90.0
28.0-43.0
3.2- 13.0
10. 1-22.3
109
Best practice guide
85.0
95.0
99.0
79.9
85.0
80.0
100.0
100.0
80.0
54.3
6.3
76.0
10.3

l ID 1 SCI IND RES VOL 60 FEBRUARY 2001
Table 9 -CoostanlS in the ClUVe filS for data m Wclter ]JlII1ling system; Particular
Radial now water pumps
X [m".nlin/lTlb.il"]
Y: (pp:rJlin/p...'<il"] X [mp:rJlin/I1li..-.il"] Y: [P'.,.,.Jlill/P<L"<il"] X [m.,.,.Jlill/lTlb.i!,']
Y: [ll.,:ralill/T).bi!,']
Mixed tlow water pumps
X [mp:rJIU,tI1li..'<i!,'] Y: [P.,.,.Jlill/p..."l"] X [rn.,.,."IU,/I1li.."<il"] Y: [P,p:r"lin/P <L'<il"] X [rnp:r.Ilin/ll1.b;gn]
Y: [l1,,:ralu,/r).b;i!,']
Axial now water pumps
X [rn.,.,.Jlin/lTlb.il"] Y: [plU'Ilin/P.""i!,'] X [rn",'''lin/m''''il''] Y: [P,p:rJlU'/Ptbi!,,] X [rnp:rJlin/rnbil"]
Y: [l1",'r.llin/llL"<i!,']
Axial flow water pumps X: logw(m) Y: TII'""'I' End suction flow pumps X: logll)rr. Y: llrutllp Venical turbine type pumps X: logillm Y: llrulllr Single/multi-stage centrifugal pumps X:P, Y: [1111 l''''11' 1
Range of values a)
0-1.4 1.201730 0.6- 1 .2 0- 1 .4 0.5im
0.4-1.2 0- 1 .4 -0.04521 4 0-1.0
0- 1 .4 1 .5JXi80 0.6- 1 .6 0-1 .4 0.991896
0.8-1.0 0- 1 .4 -0.046%4 0- 1 .0
0 - 1 .4 3.039 1 20 0.6-3.2 0-1.4 2.070530
0.8-2. I 0- 1 .4 -0. 1 22454 0-1.0
m: 10-10000 m'/h 803990 80-95 per cent
m: 10-10000 m'/h 75.1070 75-90 per cent
m: 10-10000 m'/h X4.8440 84-96 per cent
0.25 - 60.0 kW 238096 1.5 -2.3
Rang\:! of p: 400- 1000 kPa; m: 0.2-108.0 kg /s 012 pumps with 963 data points)
Multi-stage submersible pumps X: PI 0.25 - 90.0 kW Y: [1/11)""'1'1 1.2 - 2.0
2.04535
Range of" p: 80-3000 kPa; m: 03-108.0 kg /s (258 pumps with 1574 data points)
Single/multi-stage centrifugal water pumps X: logw(Pump discharge) Y: luglll(l-l1p) X: Impeller-casing clearance Y: (l1",wltll �ar-)l(Tl\·,wilh minimullI �ar) X: 10glO(specific speed/lOoo ) Specific speed: (rpm)(m'/srll2 (m) .,'<] Z: (V13600) with (V): m% Y: 111' (dimensionless)
X: loglll(Pump discharge)
Z: S peci lic speed [(rp01)(I11'/s) ·)I2(m) .. IMJ Y: loglO(l-l1,,)
0-1 Q()() m'/h 11,,:0.60-0.97 0.1-23 mm
0.X6-1.00 0-3.0
0-3.5
0-1.0 V: 0-125 m'/h
500-5000 0 01-0.20
-0.56256
1.00
U,F 0.505503 al= 0.136587 a2= -0.02783 a,= 0.684068 <14=-0.18097 a,=-O. I 990 I ao=O.053026
ao= -1.31451 u,= 0.725261 a2= -0.47792 UF -0.00076
n.= 0.000362 a,= 0.0 a,,= 0.0
al a1
-0.012 177 -0. 1 93338
0.4100 0.0
2.06805 - 1 .072&l
-0. 1 67459 -0.3743 1 3
-0.005163 0.003228
1.95680 -0.97 1 84 1
-2.843610 0.676258
-1.6XJTJJJ 0.542913
2.088220 - 1 .057 170
2.4770 0
1.083590 0
233250 0
-0.0150597 0.0
-0'(lO90912 0.0
-0.08738 -(umXI
-0.086807 0.0145<)4

BHAlT: CIRCUIT EFFICIENCY I I I
Table 10 - Solutions for improvement in compressed water system component efficiencies
Causes for low efficiency
Volumetric efficiency (pump)- Leakage through labyrinths, balancing valves and glands; reverse flow from impeller discharge past wearing ring to the suction eye
Pressure efficiency (pump)- Liquid friction losses through suction elbow/nozzle, impeller surface, diffuser vanes, volute casing, entrancel exit valve, etc.
Mechanical efficiency (pump)- Friction losses in bearings, stuffing box and disk, wearing rings, etc.
Pump efficiency-Operation at non-optimal operating point, deterioration in efficiency due to aging of the pump
Pumping circuit efficiency- High exit losses -exit of water at a pressure higher than the end requirement, throttling losses at the end use point
Re-circulation efficiency- Excessive volumetric capacity in any section is corrected by re-circulation
Material utilization efficiency- Leakage of water from tanks due to overflow, leakage through pipe joints, control valves and through breaks in piping and leakage through end use points due to not utilization of water
Remedial action form improvement in efficiency
Volumetric efficiency (pump)-Minimizing leakage between impeller and causing by operation at higher specific speeds and special materials for the contact rings
Pressure efficiency (pump)- Improving surface finish of hydraulic passages inside the pump, minimizing profile losses and eddy losses in pumps, elimination of hydraulic transients in the pump discharge line (through surge tanks, air chambers, surge suppressors, one way surge tank and water column separation) and increasing the net positive suction head (by raising the liquid level, physically lowering the pump, reducing the friction losses in suction piping and use of boosters wherever required)1 decreasing the net positive suction head (by lowering of operating speed, use of double suction impellers, increase of impeller eye area, fitting of inducers ahead of the conventional impellers, reducing the number of stages of multi-stage pumps and substitution by more number of pumps in parallel)
Mechanical efficiency (pump)- Lubricating of pump bearings and elimination of mechanical misal ignment
Pump efficiency- Ensuring that the balance point of the pump and hydraulic circuit occurs in the maximum efficiency zone of pump operation., review of pump sizes vis-a-vis the present requirement, review of the pump types: axiallradial/vis-a-vis the present application, introduction of variable speed drives for capacity control, replacement of large number of smaller pumps by one single pump if used for same applications, replacement of all old pumps with a service of over l O y.
Pumping circuit efficiency- Replacement of multiple pipes of lower diameters with lesser number of pipes of higher diameters, replacement of old pipes of over l O y old, increasing pipe diameter wherever economically feasible, minimizing losses through control valves, minimizing friction in the suction side (non-return valve, strainers and trash racks) and minimizing friction through low friction polymeric coatings (vinyl ester glass flake, bisphenol glass flake, high build epoxy, etc.)
Re-circulation efficiency- Pumps can be undersized to avoid re-circulation, elimination of re-circulation valve passing, control of tlow through variable speed drives
Material utilization efficiency- Introduction of level controllers and effective valve control of end use points for eliminating leaks
Overall circuit efficiency- When steam is available, steam jet ejector pumps can be used for low head pumping