cio reporting structure, strategic positioning, and …banker/information...
TRANSCRIPT

CIO Reporting Structure, Strategic Positioning, and Firm Performance:
To Whom Should the CIO Report?1
Rajiv D. Banker Fox School of Business
Temple University 210C Speakman Hall
Philadelphia, PA Phone: (215) 204-2029
Nan Hu School of Information Systems
Singapore Management University 80 Stamford Road Singapore 178902
Phone: +65-68280921 [email protected]
Paul A. Pavlou Fox School of Business
Temple University 207D Speakman Hall
Philadelphia, PA Phone: (213) 268-2259
Jerry Luftman Howe School of Technology Management
Stevens Institute of Technology Babbio Center 407, 1 Castle Point on Hudson
Hoboken, NJ 07030 Phone: (201) 216-8255 [email protected]
A Revised Submission to MIS Quarterly
October 2008
1 We thank Rajkumar Kempaiah for his research assistance in the data collection and analysis.

ii
CIO Reporting Structure, Strategic Positioning, and Firm Performance:
To Whom Should the CIO Report?
ABSTRACT Almost 30 years after the introduction of the CIO position, the ideal CIO reporting structure (whether the CIO should report to the CEO or the CFO) is yet to be prescribed. There is an intuitive assumption among some proponents of IT that the CIO should always report to the CEO to emphasize the importance of IT in the firm and the clout of the CIO, while some adversaries of IT call for a CIO-CFO reporting structure to keep a tab on IT spending. However, we challenge these ad hoc prescriptions by arguing that neither CIO reporting structure is necessarily superior for all firms, and proposing that the ideal CIO reporting structure should be contingent on the firm’s strategy. First, extending the strategy-structure paradigm, we propose a firm’s intended strategic positioning (differentiation or cost leadership) to determine its CIO reporting structure. We hypothesize that differentiators are more likely to have their CIO report to the CEO to use IT in innovative ways to differentiate their products and deliver new ones. We also hypothesize that cost leaders are more likely to have their CIO report to the CFO to apply IT toward operational excellence. Second, extending the alignment-fit view to the CIO reporting structure, we propose that firms that align their CIO reporting structure with their strategic positioning (differentiation with a CIO-CEO reporting structure and cost leadership with a CIO-CFO reporting structure) will display superior performance over time, reflected in abnormal stock returns and cash flows from operations. Longitudinal data from two periods (1990-1993 and 2006) support the proposed hypotheses, validating the relationship between a firm’s strategic positioning and its CIO reporting structure, and also their aligned joint role in firm performance. The results challenge the ad hoc prescriptions about the CIO reporting structure, demonstrating that a CIO-CEO reporting structure is superior for differentiators, while a CIO-CFO reporting structure is superior for cost leaders pursuing operational excellence. Hence, the CIO reporting structure must be designed to align with the firm’s strategic positioning. Keywords: Chief Information Officer (CIO), CIO Reporting Structure, Strategic Positioning, Porter’s Generic Strategies, Product and Service Differentiation, Cost Leadership, Operational Excellence, Chief Executive Officer (CEO), Chief Financial Officer (CFO), Firm Performance, Abnormal Returns, Cash Flows from Operations.
A Revised Submission to MIS Quarterly
October 2008

1
1. INTRODUCTION 1
The CIO position emerged in the early 1980s in response to the pervasive use of IT in firms 2
and the emergence of the information economy (e.g., Benjamin et al. 1985; Rockart et al., 1982). 3
The CIO position gradually became more influential as IT increasingly played a central role in 4
business processes and firm strategy (e.g., Applegate and Elam 1992; Jarvenpaa and Ives 1991; 5
Kaarst-Brown, 2005; Raghunathan and Raghunathan, 1989). Today’s CIOs are often members of 6
the firm’s C-level executive team and assume many influential roles and responsibilities besides 7
maintaining the IT infrastructure, such as establishing the firm’s information policy and standards, 8
promoting IT as an agent of business transformation, managing the firm’s information resources, 9
operations, and product introductions, offering leadership and vision for the role of IT in the firm, 10
acting as a liaison between IT and business, redesigning firm strategy, and creating firm value 11
(Feeny et al. 1992; Hutheesing, 1999; Ross and Feeny, 2000; Stephens et al., 1992). Still, CIOs 12
face many obstacles, such as higher dismissal rates, limited power, and a weaker role in the firm’s 13
strategy than most other C-level executives (e.g., Guimaraes and Igbaria, 1992; Rothfeder, 1990). 14
This study focuses on the CIO reporting structure, which influences both the CIO’s role and 15
also the firm’s IT structure and strategic initiatives (e.g., Feeny et al., 1992; Karimi et al., 1996; 16
Raghunathan and Raghunathan, 1989; 1993; Slofstra, 2001). Notably, Kaarst-Brown (2005) argues 17
that incorrect formal structure and reporting relationships impede the role and status of the CIO. 18
The CIO reporting structure is one of many decisions that a firm must make, but since it involves 19
the firm’s highest IT executive, it is likely to have implications for firm performance, consistent 20
with Hambrick and Mason’s (1984) “Upper Echelon” logic that a firm’s Top Management Team 21
influences firm performance. Nonetheless, empirical evidence on the ideal CIO reporting structure 22
(whether the CIO should report to the CEO, the CFO, or some other executive) has not yet been 23
presented in prior studies.2 The pursuit of the ideal CIO reporting structure (CEO or CFO) remains 24
2 Besides the CEO and CFO, there are other entities to whom the CIO reports to. This study focuses on the CIO-CEO and CIO-CFO that are the most common CIO reporting relationships, especially for firms in which IT plays an important role.
2
an important issue in the academic and practitioner IS literature (e.g., Feeny et al. 1992; Parry, 1
2004; Talbot, 2008; Wilson, 2007). 2
CIO-reporting-to-the-CEO has been viewed as an indication of the CIO’s power in the firm 3
(e.g., Applegate and Elam, 1992; Luftman and Kempaiah, 2008; Talbot, 2008). Raghunathan and 4
Raghunathan (1989) tested this proposition and found that the impact of the CIO declines 5
substantially when the CIO is more than two levels below the CEO. Watson (1990, p. 228) states: 6
“The fact that the IS manager is distant from the CEO is an indication that the organization does 7
not place a high value on IS and IS planning.” Since the CIO’s influence is negligible when the 8
CIO reports two levels below the CEO and is not a member of the firm’s C-level executive team 9
(Earl and Feeny, 1994),3 our focus is on whether the CIO reports to the CEO or to the CFO. 10
There is a wide-held implicit assumption among IS academics (e.g., Applegate and Elam 1992; 11
Benjamin et al., 1985; Ein-Dor and Segev, 1981; Raghunathan and Raghunathan, 1989) and IS 12
practitioners (e.g., Luftman and Kempaiah, 2007; Ross and Feeny, 2000; Slofstra, 2001) that the 13
CIO is better off reporting to the highest level executive. This is because the reporting relationship 14
indicates the CIO’s power (Applegate and Elam, 1992), and IT success is more likely if the CIO is 15
closer to the CEO (e.g., Armstrong et al., 1999; Cash et al., 1992; Rockart et al., 1982). Notably, 16
Raghunathan and Raghunathan (1989) found that only a CIO-CEO reporting structure made much 17
difference to the IS planning effort. Moreover, CIOs who report to CEOs have expanded roles 18
(Raghunathan and Raghunathan, 1993). Even incoming CIOs often demand to report to the CEO 19
(Evans, 2007). Watson (1990) shows that CIOs who report to the CEO have a better understanding 20
of the firm’s objectives and direction and have no difficulty engaging in business planning. Thus, 21
to enhance the CIO’s role, the IS literature has prescribed several means, such as creating value 22
(e.g., Earl and Feeny, 1994), having a strong business background and superior communication 23
skills (e.g., Armstrong et al., 1999; Reich and Nelson, 2003), rational persuasion, personal appeal, 24
3 Using Armstrong et al.’s (1999) classification of hierarchical distance from the CEO, a CIO-CEO reporting structure is a direct (zero) distance, and a CIO-CFO structure is one.

3
and working relationships with peers (e.g., Enns et al., 2003; Hutheesing, 1999; Preston and 1
Karahanna, 2005) and two-way communication with the CEO (Watson, 1990). 2
While IT proponents believe that a CIO-CEO reporting structure facilitates IT success, others 3
see IT as a liability, arguing that CIOs should report to the CFO to cut IT costs and comply with 4
regulations (Koch, 2006; Power, 2002; Senn and Porrello, 2005). Thus, depending on how IT is 5
viewed (asset or liability), a CIO-CEO or a CIO-CFO reporting structure is prescribed.4 However, 6
neither CIO reporting structure may be optimal for all firms. We argue that the CIO reporting 7
structure should not be viewed as a means to enhance the CIO’s power in the firm, but rather as a 8
means to create value for the firm and impact its performance. We draw upon Porter’s (1980, 1996) 9
generic strategies framework (product or service differentiation and cost leadership) 5 by which 10
firms can achieve a competitive advantage. To prescribe the ideal CIO reporting structure relative to 11
its strategic positioning and its impact on performance, we address two research questions: 12
1. How does a firm’s strategic positioning (differentiation or cost leadership) determine 13
its CIO reporting structure (CIO reporting to the CEO versus to the CFO)? 14
2. Is there an alignment or “fit” between the CIO reporting structure and the firm’s 15
strategic positioning that is associated with higher firm performance? 16
Extending Chandler’s (1962) strategy-structure paradigm, we propose that the firm’s strategic 17
positioning determines the firm’s choice of CIO reporting structure. Second, extending the 18
alignment-fit paradigm (Mintzberg, 1990; Venkatraman, 1989), we propose that a firm’s CIO 19
reporting structure must align with its strategic positioning to enhance its performance. The results 20
from analyzing secondary data from two time periods show that differentiators tend to have their 21
CIO report to the CEO, while cost leaders tend to have a CIO-CFO reporting structure. Also, 22
differentiators with a CIO-CEO reporting structure and cost leaders with a CIO-CFO reporting 23
structure outperform firms with misaligned configurations (either differentiators with a CIO-CFO 24
4 In fact, Anderson, Banker, and Ravindran (2006) present evidence documenting that Y2K compliance costs that were viewed as a liability, actually were an asset, enhancing future firm performance. 5 For brevity, we shall refer to “differentiation” to construe both product and/or service differentiation.

4
reporting structure, or cost leaders with a CIO-CEO reporting structure). We find no significant 1
performance differences between the two aligned configurations, implying that either a CIO-CEO 2
or a CIO-CFO reporting structure may be equally effective, as long as it matches the firm’s 3
strategic positioning. Also, there are no significant performance differences between the two 4
misaligned configurations. Therefore, the ideal CIO reporting structure must align with the firm’s 5
strategic positioning to achieve superior performance. 6
2. LITERATURE REVIEW 7
2.1 The CIO Position 8
The CIO is defined as the highest level IT executive or manager in a firm or business unit, even 9
if the term CIO may not always be used. According to the 2008 ‘State of the CIO’ survey 10
(www.cio.com/article/147950/), 60% of the heads of IT carry the “CIO” title, while other titles 11
include “Director of IT” (18%), “VP of IT” (11%), and Chief Technology Officer (CTO)6 (4%). 12
Other titles are also emerging that eliminate the terms ‘Technology’ or ‘Information’, such as VP of 13
Services. Nonetheless, the “CIO” title is the most widely accepted for the firm’s top IT executive. 14
The CIO position is becoming more important as IT is increasingly playing a greater role in the 15
firm’s strategy and operations. The CIO has many roles, such as IT strategy, business leadership 16
(Applegate and Elam, 1992), and relationship builder (Earl and Feeny, 1994). The CIO position has 17
increased in importance, not only for the IT function, but also for the success of the entire firm 18
(Benjamin et al., 1985; Luftman and Kempaiah, 2007; Preston and Karahanna, 2005; Slofstra, 2001). 19
Market announcements of new CIO positions help spawn positive reactions in the marketplace 20
(Chatterjee et al., 2001). CIOs have also become attractive candidates for the CEO position (Synott, 21
1987). Broadbent and Kitzis (2005) argue that the CIO’s role is to lead the entire firm, suggesting 22
that CIO should mean “Chief Influencing Officer.” Karahanna and Chen (2006) argue that CIOs help 23
create value by increasing the strategic foresight of the Top Management Team, and find that firms 24
6 The CTO position is often created by the CIO to focus primarily on technology issues to allow the CIO to focus more on business and strategy issues (see Vizard (2000) for a review of the CTO position). Typically, the CTO reports to the CIO. Rarely (about 4%) firms call the highest IT executive CTO instead of CIO.

5
with effective CIOs consistently outperform their industry competitors on several success measures. 1
2.2 CIO Reporting Structure 2
A key element of a firm’s IT structure is the CIO reporting structure. There are two key 3
entities that CIOs tend to report to (Armstrong et al., 1999; Ein-Dor and Segev, 1981): 4
1. The highest-level or chieve executive (e.g., CEO, Chairman, President), or 5
2. The highest-rank finance executive (e.g., CFO, Vice Chairman of Finance). 6
Following this classification, we parsimoniously categorize the CIO reporting structure to either 7
report to the CEO or to the CFO. We acknowledge that this binary classification is not exhaustive 8
of all possible CIO reporting structures, and CIOs may report to C-level executives other than the 9
CEO and the CFO, such as the COO (Stephens et al., 1992). However, CIO reporting to COO is not 10
very common. In our InformationWeek sample, for example, less than 5% of CIOs report to the 11
COO. Our proposed parsimonious classification captures the vast majority of the CIO reporting 12
structures found in practice, and our basic distinction is between reporting to a high-level executive 13
who focuses on financial risk and financial performance versus reporting to a top executive who 14
focuses on the firm’s overall strategy and management. 15
The CIO reporting structure has a strong reciprocal relationship with the firm’s IT orientation 16
(e.g., Karimi et al., 1996; Raghunathan and Raghunathan, 1989; 1993; Ross and Feeny, 2000), 17
which can be either strategic or operational (Cash et al., 1992). In a strategic IT orientation, the 18
CIO is a member of the Top Management Team (TMT), is involved in strategic planning, and 19
shapes the firm’s strategy (Reich and Nelson, 2003). In an operational IT orientation, the CIO is 20
mainly responsible for the IT function, offers IT support, and manages less risky ‘must-do’ IT 21
projects with a clear payback. In general, firms whose CIO has a higher reporting structure (CEO or 22
CFO) and is member of the TMT tend to have a strategic IT orientation; firms whose CIO reports 23
to lower-level executives two or more levels below the CEO, tend to have an operational IT 24
orientation (Raghunathan and Raghunathan, 1993). Since an operational IT orientation with the 25
CIO reporting to entities two or more levels below the CEO are unlikely to affect firm performance 26
(e.g., Armstrong et al., 1999; Ein-Dor and Segev, 1981), we focus on CIO reporting to CEO or 27
6
CFO, which tend to be associated with a more strategic IT orientation, whether it be oriented 1
toward differentiation or cost leadership. 2
2.3 Strategic Positioning 3
Porter’s (1980; 1996) typology of strategic positions is widely accepted, and it is still relevant 4
in today’s environments (e.g., Kald, 2003), including Internet strategy (Porter, 2001). Porter 5
maintains that there are two generic strategies: differentiation and cost leadership. 6
Differentiation: Differentiators offer products or services with unique features that customers 7
perceive valuable. These features can be superior designs, innovative R&D, personalized 8
customer service, and brand image (Porter, 1980; 1996). For example, Cadillac was an example 9
of differentiation associated with higher-end prices. Differentiation is achieved by leading 10
scientific research, innovative product development, and superior customer segmentation 11
(Hambrick and Mason, 1984). A differentiation strategy allows firms to command high price 12
margins through superior customer value (Kald, 2003; Kim et al., 2004). 13
Cost Leadership: Cost leaders strive to have the lowest average unit costs by achieving 14
operational excellence, and they can thus offer their products or services at low prices. 15
Operational excellence implies running similar activities more efficiently than rivals (Porter, 1996). 16
Cost leaders gain an advantage by reducing costs in the value chain (Hambrick and Mason, 1984) 17
by achieving “efficient scale facilities, cost reductions through experience, tight cost and overhead 18
control, and cost minimization in R&D, advertising, sales, and so on” (Porter 1980, p. 35). 19
Chevrolet was an example of cost leadership with tight cost control, efficiency, and low prices. 20
In their study of differentiators and cost leaders, Hambrick and Mason (1984) show that firms 21
that pursue either of the two generic strategies are among the top performers. While neither 22
strategic position is necessarily superior, the competitive advantage gained through a 23
differentiation strategy is more likely to be sustained (Selling and Stickney, 1989), and advantage 24
from operational effectiveness is more fleeting since it can be imitated by rivals (Porter, 1996). 25
Porter’s (1980) generic strategies are the extremes of a continuum, and firms compete across 26
the entire spectrum. The fact that firms pursue one strategy does not imply that they totally ignore 27
7
the other (Porter, 1996). In fact, prior research has shown that cost leaders do differentiate their 1
products, and differentiators do focus on cost reduction (Miller and Friesen, 1986). Therefore, 2
irrespective of a firm’s strategy, there may be a pursuit of high product quality and cost reduction. 3
3. THEORY DEVELOPMENT 4
3.1 Strategic Positioning and CIO Reporting Structure 5
Chandler (1962) proposes the need to link firm strategy and structure. Chandler’s paradigm 6
applies to many aspects of the firm’s structure, and firm strategy also determines the IT structure 7
(Floyd and Wooldridge, 1990). We specifically focus on the CIO reporting structure. While the 8
CIO is only a single entity, as the firm’s highest IT executive and leader of the IT function, the 9
CIO reporting structure affects the entire IT function. If a CIO promotes the use of IT initiatives to 10
support a certain vision, the IT function is likely to shift toward this strategy to fulfill this vision. 11
For IT initiatives to succeed, an effective relationship between IT and business executives must 12
be established (Jarvenpaa and Ives 1991; Karimi et al. 1996; Raghunathan, 1992). This is because 13
the CIO’s relationship and interaction with C-level executives enable the success of IT initiatives. 14
Therefore, our proposition is that firms choose to have their CIO report to that C-level executive 15
(CEO or CFO) whose primary focus (overall strategy and firm management versus financial 16
performance and risk management, respectively) to enable the CIO to facilitate IT initiatives that 17
enhance the firm’s intended strategic positioning (differentiation or cost leadership). 18
Following the strategy-structure paradigm, firm strategy is viewed as an exogenous variable 19
that determines the CIO reporting structure. Specifically, a differentiation strategy is hypothesized 20
to lead to a CIO-CEO reporting structure, and a cost leadership strategy is hypothesized to yield a 21
CIO-CFO reporting structure, as explained below: 22
Differentiation Strategy & CIO-CEO Reporting Structure 23
Differentiators focus on new opportunities for product innovation and customer intimacy, and 24
they view IT as a competitive weapon to gain an advantage, such as by using IT to build new 25
business models and redefining the value chain. For example, CRM, SCM, and ERP systems help 26
8
link customers, suppliers, and partners to integrate multiple activities in the firm’s value chain 1
(Porter, 2001). IT systems, such as data mining tools for market intelligence and personalized 2
marketing, can be used to better understand customer preferences and inputting their voice into 3
new products. For example, in the retail apparel industry, Neiman Marcus uses IT-based demand 4
forecasting systems to recognize products that meet seasonal changes in customer preferences 5
(Farrell et al., 2003). Applegate and Elam (1992) show that CIOs who are closer to the CEO have 6
a greater effect on the success of IT initiatives for innovation. CIOs who directly report to the CEO 7
are thus more likely to focus on IT initiatives that enhance product and service differentiation. 8
The success of new products requires coordination among marketing, R&D, and engineering, 9
which can be supported by IT systems. Ives and Olson (1981) show that IT executives at higher 10
reporting levels have diverse roles and spend most of their time coordinating with business units. 11
The CIO who reports to the CEO is more likely to be in a position to facilitate the coordination 12
between IT and business units, thus supporting the differentiation of new products and services. 13
Product and service innovation works best with subjective measures of success (e.g., creativity) 14
versus quantitative measures (e.g., time, efficiency, cost). Since it is difficult to quantify the impact 15
of IT on innovation and creativity, a CIO who reports to the CFO would have a difficult time 16
justifying IT expenditure for product and service innovation. Since differentiators use risky IT 17
initiatives in new ways, a CIO who reports directly to the CEO is more likely to appreciate creative 18
decision-making. On the contrary, a CIO who reports to the CFO is less likely to receive support 19
for risky open-ended IT initiatives whose returns are not easy to quantify (Koch, 2006). In fact, for 20
the CIO, the CFO is often seen as an adversary due to the difficulty in clearly documenting 21
financial returns on novel IT initiatives to obtain funding for them (Power, 2002; Slater, 2002). 22
In sum, the CIO who reports to the CEO can (1) facilitate the success of IT initiatives by 23
promoting differentiation, (2) promote coordination between IT and other business units, and (3) 24
receive support for novel but risky IT initiatives. 25
H1: Differentiators are more likely to have their CIO report to the CEO. 26

9
Cost Leadership Strategy & CIO-CFO Reporting Structure 1
A cost leadership strategy dictates cost reduction throughout the value chain. Cost leaders 2
focus on IT initiatives that drive operational excellence, such as automating processes, utilizing 3
assets efficiently, cutting operating expenses, and supporting efficient back-end and front-end IT 4
infrastructures. IT systems, such as data warehousing systems can support efficient supply chains 5
by cutting the time products stay in inventory and on retail shelves. For example, Wal-Mart 6
successfully uses its state-of-the-art supply chain IT to enhance its operational effectiveness with 7
efficient data collection and storage. Since product discounting is a key element of the apparel 8
industry, cost leaders can achieve optimum product discounts with neural networks and transaction 9
risk models that analyze customer data to enhance sales force operations (Feeny et al., 1992). The 10
Internet is another powerful tool for enhancing operational efficiency by facilitating information 11
exchange across the value chain (Porter, 2001). For example, new mobile tools have reduced 12
inefficiencies in sales-force operations. The IT strategy of cost leaders focuses on tight cost 13
control, frequent and detailed financial reports, incentives for lower costs, and quantitative goals. 14
Since cost leaders use IT mainly to cut operating expenses, reduce cycle time, maintain lean 15
operations, and achieve operational excellence, their CIO focuses on how IT facilitates cost 16
reduction. The CIO’s major responsibility is to bring cost discipline to IT spending, manage 17
prudent IT projects on urgent needs, and assure adequate IT resources for financial reporting and 18
analysis. Since the CIO leads the use of IT for operational excellence and efficiency, the CIO 19
should report to the CFO who is in charge of finance. Working closely with the CFO helps the CIO 20
pursue appropriate IT initiatives for operational efficiency to support a cost leadership strategy. 21
H2: Cost leaders are more likely to have their CIO report to the CFO. 22
3.2 Identifying the Ideal CIO Reporting Structure 23
Many prior studies (e.g., Cash et al., 1992; Feeny et al., 1992; Jarvenpaa and Ives, 1991) posit 24
that the status and relationship between the CIO and other C-level executives impacts the success 25
of IT strategy. Preston and Karahanna (2005) show that a shared language between the CIO and 26

10
the other C-level executives enhances the CIO’s understanding of the firm’s overall strategy by 1
helping achieve alignment between IT and business strategy. However, the authors argue that if 2
the CIO is not a member of the firm’s TMT, the CIO is unable to help achieve alignment between 3
IT and business strategy. Therefore, we choose to focus on the CIO reporting to the CEO or the 4
CFO since a CIO reporting to a lower level executive is unlikely to be in a position to achieve 5
alignment between IT and business strategy, or have a significant effect on firm performance. 6
Following the alignment-fit view (Mintzberg, 1990),7 the importance of aligning firm strategy 7
with structure has been widely established (e.g., Govindarajan, 1989; Hambrick and Mason, 1984). 8
Extending the alignment view, we propose that an alignment between a firm’s strategic positioning 9
and its CIO reporting structure enhances firm performance by enabling the CIO to use appropriate 10
IT initiatives to enhance the firm’s strategic positioning. IT can be used to support both a 11
differentiation and a cost leadership strategy, and a CIO whose reporting structure aligns with the 12
firm’s strategic positioning is more likely to emphasize those IT initiatives that can help enhance 13
the firm’s chosen strategy and to appropriately lead the IT function to enhance firm performance. 14
In this study, we parsimoniously consider only two CIO reporting relationships with the CEO – 15
(1) direct reporting to the CEO - enabling the CIO to use IT to support a differentiating strategy, or 16
(2) direct reporting to the CFO - enabling the CIO to use IT to support a cost leadership strategy. 17
We propose a “fit” variable to capture the alignment of the CIO reporting structure with the firm’s 18
strategic positioning. Fit is defined as either having a differentiation strategy with a CIO-CEO 19
reporting structure or a cost leadership strategy with a CIO-CFO reporting structure. Lack of fit is 20
defined as either a differentiation strategy with a CIO-CFO reporting structure or a cost leadership 21
strategy with a CIO-CEO reporting structure. The exact operationalization of the continuous fit 22
variable is described in the Methods section below. 23
7 Alignment or fit, rooted in the information processing view of the firm (Galbraith, 1997), is the degree of configuration among relevant factors. Mintzberg (1990) extended Chandler’s (1962) one-way relationship between strategy and structure, calling for interactions among strategy and structure. The alignment view emphasizes a reciprocal relationship between strategy and structure and a contingent effect on firm performance (Venkatraman, 1989).
11
Aligning CIO-CEO Reporting Structure with a Differentiation Strategy 1
Since differentiators build an advantage with new product and service configurations, the CIO 2
must help use IT to help deliver superior performance through innovation and customer intimacy. 3
By enhancing the CIO’s access to the CEO, facilitating the success of novel IT initiatives, and 4
enhancing the CIO-CEO relationship (Slofstra, 2001), a CIO-CEO reporting structure is proposed to 5
help support a differentiation strategy. Since differentiation emphasizes innovative product designs 6
and customer intimacy, the CIO must appreciate marketing and R&D skills and be creative in terms 7
of how IT can by used in new product development. New IT systems and technologies trigger 8
many opportunities for product innovation (Porter, 2001), and a CIO who is at the forefront of 9
experimentation with IT can think more innovatively to take advantage of new IT-enabled 10
opportunities to develop new product and service configurations that better serve customers. 11
To support a differentiation strategy, CIOs must focus their efforts in monitoring, identifying, and 12
pursuing open-ended IT opportunities and developing novel products and services to satisfy 13
emerging customer needs. A CIO-CEO reporting structure is most appropriate for differentiators 14
since the CIO who reports to the CEO has the opportunity and incentives to think strategically. 15
Accordingly, a CIO who is close to the CEO is more likely to have the opportunity to regularly scan 16
the environment for innovative IT systems, monitor and imitate what innovative competitors do 17
with IT, and be able to anticipate and satisfy changes in customer preferences. Taken together, 18
differentiators with a CIO-CEO reporting structure are more likely to have higher firm performance. 19
Aligning CIO-CFO Reporting Structure with a Cost Leadership Strategy 20
A cost leadership strategy emphasizes attention to internal operations and financial control. 21
Thus, a CIO who reports to the CFO can benefit from being in a close proximity to a C-level 22
executive who possesses the requisite finance skills to reduce the risk and ensure the financial 23
performance of IT initiatives. While the CIO can help achieve operational efficiency and lean 24
operations with the aid of IT (Karahanna and Chen 2006), the CFO can further guide the CIO in 25
efficiently utilizing the firm’s resources with the aid of financial IT systems. Thus, for cost leaders, 26
12
it is appropriate for CIOs to report to the CFO who would help the CIO deploy IT to efficiently 1
utilize assets, encourage conservative IT investments, avoid risky ones with unclear payoff, and 2
sustain quantifiable returns for IT projects. The CFO can also focus the CIO on eliminating waste 3
by maintaining a lean infrastructure, promoting efficient business processes, and complying with 4
regulatory needs. Efficient utilization of the firm’s resources is critical for cost leaders, and a focus 5
on IT systems that monitor and coordinate resources facilitates the cost leadership strategy. 6
A cost leadership strategy that focuses on operational excellence must continuously strive to 7
enhance efficiency since cost-based advantages are easily imitated (Porter, 1996). Thus, CIOs in 8
cost leaders must constantly work to improve the firm’s operational excellence with the aid of IT. 9
Working with the CFO can help the CIO identify opportunities for continuously improving IT 10
resources to more efficiently execute business processes. A CIO-CFO reporting structure is likely 11
to support the need of cost leaders to continuously improve the more fleeting operations-based 12
advantages of their strategy by improving the efficient use of their assets and resources. Hence, a 13
cost leadership strategy that aligns with a CIO-CFO reporting structure helps enhance performance. 14
Misaligned Configurations 15
Besides these well-aligned configurations, there are two misaligned configurations - cost leaders 16
whose CIO reports to the CEO, and product differentiators whose CIO reports to the CFO. 17
First, for differentiators, the CIO-CEO reporting structure helps the CIO educate the CEO 18
about IT initiatives that would contribute to the firm’s differentiation strategy. However, if the CIO 19
has to go through the CFO to advance novel and potentially risky IT initiatives, it may be difficult 20
for CIOs to pursue potentially valuable, but risky, cutting-edge IT initiatives (Slater, 2002). The 21
CFO is unlikely to encourage the CIO to be creative and experiment with novel IT initiatives that 22
do not have easy-to-quantify financial returns, thus hindering IT-enabled opportunities for 23
promoting differentiation. The CFO is unlikely to give the CIO the necessary latitude to pursue 24
open-ended IT opportunities. Hence, differentiators with a CIO-CFO reporting structure are likely 25
to have a lower performance than differentiators with a CIO-CEO reporting structure. 26

13
Second, for cost leaders, the advantage from the IT function is in promoting the firm’s 1
emphasis on operational excellence and efficiency. When the CIO reports to the CEO, there is a 2
tendency to pursue risky IT initiatives, invest in cutting-edge IT systems, and let IT spending get 3
out of control (Koch, 2006). Moreover, a lack of direct supervision from the CFO may lead to 4
the CIO not being as closely linked to the firm’s day-to-day operations, financial controls, and 5
resource utilization. Therefore, cost leaders with a CIO-CEO reporting structure are likely to 6
underperform relative to cost leaders with a CIO-CFO reporting structure. 7
H3: A fit between strategic positioning (differentiation and cost leadership) and CIO 8
reporting structure (CEO and CFO) is associated with a higher firm performance. 9
Specifically, H3 is composed of the following two sub-hypotheses: 10
H3a: Differentiators with a CIO-CEO reporting structure are likely to have higher firm 11
performance than differentiators with a CIO-CFO reporting structure. 12
H3b: Cost leaders with a CIO-CFO reporting structure are likely to have higher firm 13
performance than cost leaders with a CIO-CEO reporting structure. 14
Is the CIO-CEO Reporting Structure Always Superior? 15
The intuitive assumption in the IS literature is that CIOs are better off reporting to CEOs 16
because they have more power, can be more creative, experiment with new IT initiatives, and 17
have a role in strategic planning (e.g., Applegate and Elam 1992; Luftman and Kempaiah, 2007; 18
Raghunathan and Raghunathan, 1989; Ross and Feeny, 2000). To challenge this long-held 19
intuitive assumption of the absolute and unconditional superiority of a CIO-CEO reporting 20
structure, we propose the following hypothesis: 21
H4: A CIO-CEO reporting structure outperforms a CIO-CFO reporting structure. 22
Failure to support H4 implies that a CIO-CEO reporting structure is not always optimal, 23
contradicting the assertion that the CIO should always report to the CEO, and prescribing a 24
contingent optimal reporting structure: a CIO-CEO reporting structure for differentiators and a 25
CIO-CFO reporting structure for cost leaders. 26

14
Since our primary argument is that the CIO reporting structure must align with the firm’s 1
strategic positioning, we also compare the firm performance between the two proposed well-2
aligned configurations, and between the two proposed misaligned configurations: 3
H4a: Aligned Configurations: Differentiators with a CIO-CEO reporting structure will have a 4
higher firm performance than cost leaders with a CIO-CFO reporting structure. 5
H4b: Misaligned Configurations: Cost leaders with a CIO-CEO reporting structure will have a 6 higher firm performance than differentiators with a CIO-CFO reporting structure. 7
The alignment theory we have expounded above predicts no significant differences in either case. 8
Control Variables 9
Table 1 below summarizes the control variables considered in this study: 10
Table 1. Control Variables 11 IT Orientation (Automate/Informate)
The firm’s IT orientation (automate or Informate) is a dummy variable that captures the strategic role of IT in an industry (InformationWeek’s industry designations) (Chatterjee et al., 2001). The literature distinguishes IT that “automates” business processes from IT that “informates” the firm (Zuboff 1985). We also assigned these variables based on their SIC codes with no significant difference in the results. Since IT for automation is less risky but not cutting-edge, it is likely to be linked to a CIO-CFO reporting structure. Moreover, as IT for automation is easily imitable, the performance gains are likely to be minimal. However, since IT that informates the organization is more likely to be risky yet more rewarding, firms in Informate industries may have their CIO report to the CEO and also to have higher firm performance.
IT Investment Intensity This is measured as the total IT spending divided by a firm’s total assets. Firms with higher IT spending are more likely to pursue larger and riskier IT projects, and have their CIO report to the CFO.
High Tech Versus Low Tech Industry Industries can be classified as either high tech or low tech following Francis and Schipper’s (1999) classification scheme based on the three-digit SIC industry code. Since CIOs are more likely candidates for CEOs for technology firms (Synott, 1987), we expect a CIO-CEO reporting structure to be more likely for high tech firms. However, we make no prediction for performance difference among these two industries.
Industry Concentration This is measured as the annual sales revenues for the largest four firms in each four-digit SIC code divided by the sales for all firms in the industry. The CIO is likely to play a lesser role in highly concentrated industries, and a high industry concentration ratio is likely to be associated with a CIO-CFO reporting structure. Industry concentration is also included to control for its potential effect on performance without making specific predictions about the direction of the effect.
CIO Tenure CIO tenure is also a potential control variable since CIOs who stay longer may gain clout in the firm and strive to report to the CEO. Also, evidence suggests that CIOs with longer tenure tend to move away from the CEO (Luftman and Kempaiah, 2008). However, the two datasets in our study did not measure CIO tenure. Using data from a different SIM study (reported in Luftman and Kempaiah 2007), we ran a logistic regression that uses CIO tenure to predict CIO reporting structure. The results show that CIO tenure is not significantly associated with the CIO reporting structure (either to the CEO or to the CFO). This is consistent with our logic that a firm’s strategic positioning must determine its CIO reporting structure, and not the CIO’s tenure.

15
4. RESEARCH METHOD & RESULTS 1
4.1 Measure Development 2
We used secondary data to operationalize the study’s principal constructs to avoid potential 3
biases from using perceptual measures that are likely to be influenced by subjectivity. 4
CIO Reporting Structure 5
Following our proposed conceptualization of CIO reporting structure, we classified firms into 6
two groups: firms whose CIO reports to (1) the CEO and (2) the CFO. The CIO reporting structure 7
is viewed as a binary variable where “1” represents firms whose CIO reports to CEO and “0” 8
represents firms whose CIO reports to CFO. The CIO-CEO reporting structure includes firms whose 9
CIOs report to the CEO, Chairman, Executive VP, Executive Senior Officer, General Manager, or 10
President/CEO. The CIO-CFO reporting structure includes firms whose CIOs report to the CFO, 11
EVP/Finance, EVP/CFO, Treasurer, Controller, Senior VP/CFO, Vice Chairman/CFO, and VP of 12
Finance. In our primary sample, 315 (74%) firms have their CIO report to the CEO and 110 (26%) 13
to the CFO. In our second sample, 78 (63%) of CIOs report to the CEO and 46 (37%) to the CFO. 14
Strategic Positioning 15
Snow and Hambrick (1980) proposed four approaches for measuring strategic positioning: 16
researcher’s inference, self-assessment, external assessment, and objective indicators. Most 17
studies have used self-assessment methods (e.g., Govindarajan, 1989; Miller and Friesen, 1986). 18
Instead, this study employs external assessment - the DuPont method for analyzing ROA into 19
profit margin and asset turnover (e.g., Stickney and Brown, 1999; Fairfield and Yohn, 2001; 20
Nissim and Penman, 2001) to use common accounting ratios to objectively capture Porter’s 21
(1980) two generic strategies – profit margin for a differentiation strategy and asset turnover for 22
a cost leadership strategy (Selling and Stickney, 1989). The Dupont method is a standard method 23
used in accounting textbooks (e.g., Stickney and Brown, 1999). 24
Product Differentiation: Differentiators are likely to be high profit margin firms that command 25
higher margins as returns for their superior product quality or greater customer intimacy (Selling 26
16
and Stickney, 1989). Operating Income over Sales measures the profit margin and is used to 1
capture a firm’s differentiation strategy. 2
Cost Leadership: To be the lowest cost producer, firms must achieve operational efficiency, 3
economies of scale, and high asset turnover (Selling and Stickney, 1989). Since cost leaders must 4
utilize their assets efficiently, they must maintain lean operations (e.g., Fairfield and Yohn, 2001; 5
Stickney and Brown, 1999). Since cost leadership firms efficiently utilize their assets to generate 6
sales, Sales over Assets is used as a proxy for such firms. 7
The two ratios, Operating Income over Sales and Sales over Assets capture a firm’s realized 8
success in pursuing a strategic position, which may differ from the firm’s intended one 9
(Mintzberg, 1978). While both ratios predict performance, there may be a negative link between 10
profit margins and asset turnover (Nissim and Penman, 2001). 11
Fit Variable 12
The alignment between strategic positioning and CIO reporting structure is operationalized 13
with a continuous “FIT” variable that captures the distance between the actual reporting structure 14
and our predicted probability of a CIO reporting to CEO - Prob(CEO) - based on Equation 1: 15
FIT = Prob(CEO) when a firm’s CIO reports to the CEO 16
FIT = 1 - Prob(CEO) when a firm’s CIO reports to the CFO 17
Firm Performance 18
To broadly capture performance, we measure how the firm creates value in terms of enhancing 19
future cash flows. We employ two conceptually consistent measures to capture value creation: 20
The first measure (abnormal stock returns) is the change in the firm’s value as perceived by 21
investors in the capital market based on their expectations about the firm’s discounted future 22
operating cash flows for the firm. The stock market is likely to react to new information that may 23
change expectations of future cash flows, and the firm’s stock price will adjust accordingly. 24
Information about firms that will improve their expected future cash flows is rewarded with 25
abnormal stock returns. This measure, however, is based on investors’ expectations about the 26
17
future based on current information.8 1
Since we have data on subsequent firm performance, we also employ a second measure, 2
actually realized cash flows from operations. By looking back at the firm’s cash flows, this 3
measure captures whether the investors’ expectations were realized. In sum, firm performance is 4
operationalized with two complementary measures: abnormal stock returns reflect what investors 5
expect the firm’s cash flows to be in the future, and realized cash flows from operations reflect 6
the cash flows that the firm actually achieved (in the future). Measurement of these two ratios is 7
further elaborated below: 8
Abnormal Stock Returns: Since capital markets are efficient in valuing information, stock 9
returns reflect the discounted expected future cash flows. Abnormal stock returns reflect the 10
market’s unbiased evaluation of the impact of new information on expected cash flows, while all 11
prior and current information available to the market is already incorporated in the stock price. 12
Positive abnormal stock returns are associated with a well-aligned CIO reporting structure 13
because if the market does not recognize the value of CIO reporting structure aligned with 14
strategic positioning, the subsequent realized performance improvement from a well-aligned CIO 15
reporting structure will induce the market to correct this omission and react positively. Since the 16
CIO reporting structure brings an intangible value to the firm that is not fully captured by the 17
current accounting performance and is likely to materialize and be captured over time, abnormal 18
stock returns are likely to reflect the value potential of an aligned CIO reporting structure. 19
Abnormal stock returns are measured relative to the market portfolios of similar firms in terms 20
of (a) the ratio of book equity to market equity and (b) size (market equity). The market portfolios 21
8 Abnormal stock returns are serially uncorrelated because efficient markets incorporate implications of all information available in the past. Therefore, in the portfolio approach, past performance measures should not be included. However, when we study accounting performance (e.g., cash flows from operations), we need to, and do control for past performance. A problem when directly comparing future performance is that firms with superior past firm performances might selectively choose a certain CIO reporting structure. Thus, in such cases, it is not the alignment between CIO reporting structure and firm strategy that drives performance; it is the past performance that drives future performance. This so-called halo effect refers to the cognitive bias where the perception of a particular trait is influenced by the perception of former traits. To minimize the possibility of a halo effect, we predict future accounting performance after controlling for past performance.
18
represent the intersections of 5 portfolios formed based on the ratio of book equity to market equity 1
and 5 portfolios based on market equity.9 Each firm’s normal return in each group was calculated as 2
the collective monthly abnormal return over 12 months.10 The 5X5 portfolio returns (taken from 3
http://mba.tuck.dartmouth.edu/pages/faculty/ken.french/data_library.html) were subtracted from the 4
normal returns to get each firm’s abnormal returns. To estimate the abnormal returns, the fiscal and 5
the calendar year were used with similar results. Having calculated the cumulative abnormal returns 6
for each firm for each group over 12-month periods, we compared the average abnormal returns for 7
each group to infer whether there is any performance difference across different groups. 8
Cash Flows from Operations: Financial analysts determine a firm’s current value based on 9
estimated future cash flows. Since we have data on realized subsequent performance, we also use 10
actual future cash flows from operations as a performance measure. This is conceptually 11
appropriate since the value of the firm depends on the present value of its expected future cash 12
flows, and an aligned CIO reporting structure is likely to enhance the firm’s value by increasing 13
subsequent cash flows. We expect the alignment of the CIO reporting structure at time t to 14
predict the firm’s realized subsequent operating cash flows (at time t+1, t+2, t+3, and t+4), after 15
controlling for the firm’s operating cash flows at time t. 16
4.2 Data Description 17
Data were collected by integrating data from two surveys of CIO reporting structure with 18
financial information from Compustat and corresponding stock returns from the Center for 19
Research on Security Prices (www.csrp.com). The first dataset used for our primary data analysis 20
was obtained from InformationWeek (IW) (1990-1993) surveys of IT executives of US firms 21
9 We calculate abnormal stock returns following the procedure of Fama and French (1992). We also performed our analysis using the Capital Asset Pricing Model (CAPM) – that states that the expected returns of a security equal the rate on a risk-free security plus a risk premium - and found qualitatively similar results. Fama and French (1992) extended the CAPM model with two factors (small cap and book-to-market ratio) because stocks with small cap and a high book-to-market ratio are associated with higher returns. Thus, this method controls for the impact of industry, size, and past performance on stock returns. 10 The size breakpoints for year t are the NYSE market equity quintiles at the end of June of year t. The book to market equity ratio for year t is the book equity for the last fiscal year end in t-1, divided by market equity for year t-1. The book to market equity breakpoints are the NYSE quintiles.

19
(Appendix 1).11 The IW dataset has 425 firms in 27 industries, with the largest four being banking 1
(11.5%), aerospace (6.1%), chemicals (6.1%), and computer (6.1%).12 The second dataset used for 2
validation purposes was obtained from a survey of 124 CIOs of Fortune Global 1,000 firms 3
(Luftman and Kempaiah, 2007). From those, we retained the 58 publicly-traded firms in the United 4
States whose financial and stock information could be matched. Table 2 shows the demographics 5
of the firms in the two datasets. 6
Table 2. Demographics of Firms in the Study’s Two Datasets 7 Information Week Firms Fortune Global 1,000 Firms Item Mean Median STD Mean Median STD
Income Before Extraordinary Items ($M) 354 201 750 3122 1098 4223 Net Sales ($M) 7,771 4,516 9,350 28,861 14,119 32,400 Total Assets ($M) 15,762 7,519 24,885 166,582 27,073 395,735 Employees (thousands) 44 26 55 70 55 86 CIO Reporting Structure (CEO) 0.7412 1.0000 0.4385 0.6300 1.0000 0.4889 Operating Income over Sales 0.0557 0.0500 0.0562 0.0903 0.0825 0.0637 Sales over Assets 0.9683 0.8842 0.7935 0.7499 0.6689 0.5203 IT Orientation (Automate Vs Informate) 0.7176 1.0000 0.4507 0.7143 1.0000 0.4558 High Tech Dummy 0.1553 0.0000 0.3626 0.3925 0 0.4928 Low Tech Dummy 0.0847 0.0000 0.2788 0.0536 0 0.2272 Industry Concentration Ratio 0.3640 0.3571 0.1426 0.3506 0.3245 0.1924 Abnormal Stock Returns 0.0406 0.0280 0.2441 0.0258 0.0314 0.1792
8
4.3 Primary Data Analysis & Results (InformationWeek Data) 9
The first logistic regression uses the firm’s realized strategic positioning (as reflected by its 10
Operating Income/Sales and Sales/Assets ratios)13 to predict its CIO reporting structure (Eq. 1): 11
CIO Reporting StructureBi, t B= αB1B*Average (Operating Income/Sales)B i, t-4…tB + 12
αB2B*Average (Sales/Assets)B i, t-4…t + αB3B* Control Variables i, t-4…t B (1) 13
11 IW collects information on CIO reporting structure, IT employees, and IT spending. For firms that did not disclose IT budget data, IW estimated their IT budgets based on revenue, IT employees, past IT budgets, and IT budgets of peer firms. After 1993, InformationWeek does not publish information on CIO reporting. 12 In the IW sample, 72 firms appear once, 58 firms appear twice, 47 firms appear thrice, and 24 firms appear four times. Out of the 129 firms that appear more than once in our sample, there are only 20 firms whose CIO reporting structure changes over the 1990-1993 period. Therefore, the results are unlikely to be influenced by the firms whose CIO reporting structure changed during this period. 13 The reliability coefficients (standardized Cronbach’s alpha) during the five-year period are 0.80 for Operating Income over Sales and 0.99 for Sales over Assets. These high reliability values suggest that both ratios are stable, implying that strategic positioning remains consistent over time.
20
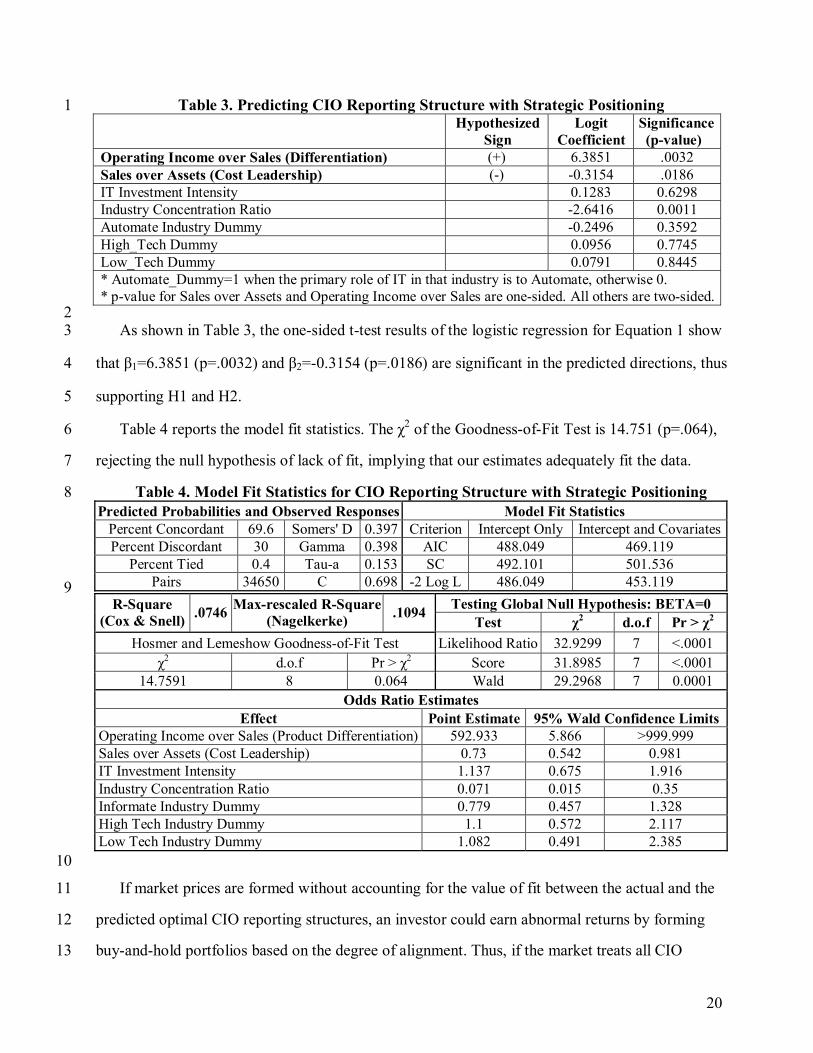
Table 3. Predicting CIO Reporting Structure with Strategic Positioning 1 Hypothesized
Sign Logit
Coefficient Significance(p-value)
Operating Income over Sales (Differentiation) (+) 6.3851 .0032 Sales over Assets (Cost Leadership) (-) -0.3154 .0186 IT Investment Intensity 0.1283 0.6298 Industry Concentration Ratio -2.6416 0.0011 Automate Industry Dummy -0.2496 0.3592 High_Tech Dummy 0.0956 0.7745 Low_Tech Dummy 0.0791 0.8445 * Automate_Dummy=1 when the primary role of IT in that industry is to Automate, otherwise 0. * p-value for Sales over Assets and Operating Income over Sales are one-sided. All others are two-sided.
2 As shown in Table 3, the one-sided t-test results of the logistic regression for Equation 1 show 3
that β1=6.3851 (p=.0032) and β2=-0.3154 (p=.0186) are significant in the predicted directions, thus 4
supporting H1 and H2. 5
Table 4 reports the model fit statistics. The χ2 of the Goodness-of-Fit Test is 14.751 (p=.064), 6
rejecting the null hypothesis of lack of fit, implying that our estimates adequately fit the data. 7
Table 4. Model Fit Statistics for CIO Reporting Structure with Strategic Positioning 8 Predicted Probabilities and Observed Responses Model Fit Statistics
Percent Concordant 69.6 Somers' D 0.397 Criterion Intercept Only Intercept and CovariatesPercent Discordant 30 Gamma 0.398 AIC 488.049 469.119
Percent Tied 0.4 Tau-a 0.153 SC 492.101 501.536 Pairs 34650 C 0.698 -2 Log L 486.049 453.119
9 Testing Global Null Hypothesis: BETA=0 R-Square
(Cox & Snell) .0746 Max-rescaled R-Square(Nagelkerke) .1094
Test χ2 d.o.f Pr > χ2 Hosmer and Lemeshow Goodness-of-Fit Test Likelihood Ratio 32.9299 7 <.0001
χ2 d.o.f Pr > χ2 Score 31.8985 7 <.0001 14.7591 8 0.064 Wald 29.2968 7 0.0001
Odds Ratio Estimates Effect Point Estimate 95% Wald Confidence Limits
Operating Income over Sales (Product Differentiation) 592.933 5.866 >999.999 Sales over Assets (Cost Leadership) 0.73 0.542 0.981 IT Investment Intensity 1.137 0.675 1.916 Industry Concentration Ratio 0.071 0.015 0.35 Informate Industry Dummy 0.779 0.457 1.328 High Tech Industry Dummy 1.1 0.572 2.117 Low Tech Industry Dummy 1.082 0.491 2.385
10
If market prices are formed without accounting for the value of fit between the actual and the 11
predicted optimal CIO reporting structures, an investor could earn abnormal returns by forming 12
buy-and-hold portfolios based on the degree of alignment. Thus, if the market treats all CIO 13

21
reporting structures similarly, when a firm’s subsequent performance information becomes 1
available to the market, the stock price corrects its expectations more for a firm with a better 2
alignment between its CIO reporting structure and its strategic positioning because a better 3
aligned firm is likely to have superior subsequent performance. 4
Our analysis of portfolio returns follows Sloan's (1996) analysis of earnings components.14 5
We sorted stocks into portfolios based on our measure of the fit between a firm’s CIO reporting 6
structure and its strategic positioning in period t to predict the firm’s future portfolio returns. 7
Fit is measured by comparing the actual CIO reporting structure with the predicted one. Table 5 8
reports the regression results for the abnormal portfolio returns. 9
Table 5. Abnormal Stock Returns based on Equally-Weighted Portfolios across Firms 10 Hypothesized Sign Abnormal_Returns = α1 + β1*Fiti +εi
Intercept -0.018(p=0.61) FIT (+) 0.089(p=0.034) N 425
Adjusted R2 0.0187 11
As shown in Table 5, firms whose CIO reporting structure aligns well with their strategic 12
positioning enjoy higher abnormal returns (β=0.089, p-value=0.034), supporting H3. Empirical 13
support for H3 holds even after including the control variables listed in Table 1. 14
Table 6. Differences in Abnormal Stock Returns on Equally-Weighted Portfolios 15
CIO Reporting Structure Abnormal Return
(CEO Group) Abnormal Return
(CFO Group)
Abnormal Return Difference
(CEO-CFO) Mean 0.0397 0.0432 -0.0036 (p=0.8961)
Actual N 315 110
16 Table 6 shows the abnormal returns of the CEO versus the CFO panels. The difference in 17
abnormal stock returns between the actual reporting to the CEO versus the CFO is not significantly 18
14 Having shown that the earnings components were differentially informative about future earnings, Sloan (1996) tested whether market valuations fully incorporated the information of various earnings components. Sloan formed portfolios of stocks based on the relative values of the earnings components in period t. Stocks high on the more informative component were placed in one portfolio, and stocks high on the other component were placed in a second portfolio. If the market did not discriminate between the two components and undervalued the information in the more informative component, then abnormal returns in future periods would be higher for the first portfolio than for the second portfolio.

22
different from zero, showing that whether a CIO reports to the CEO or to the CFO does not affect 1
firm performance on average (rejecting H4). Thus, what causes the performance difference across 2
firms is whether the CIO reporting structure fits the firm’s strategic positioning, as H3 proposes. 3
Table 7 reports the effects of the alignment between the CIO reporting structure and the firm’s 4
strategic positioning on future cash flows from operations (Eq. 2): 5
Log(Cash_Flowj,t+i/ Salesj,t+i)= α1 + β1* Log(Cash_Flowj,t/ Salesj,t)+ β2* Fitj,t + β3* Automate_Dummyj,t + 6 β4* Concentration_Ratioj,t+ Β5* High_Techj,t + β6* Low_Techj,t + εj,t (where i=1, 2, 3, and 4) 7
The estimated mean coefficients of the FIT variable are significant for the first 3 years 8
subsequent to our sample date peaking in t+2, but become insignificant in t+4, as shown in Table 7. 9
This suggests that firms whose CIO reporting structure aligns well with their strategic positioning 10
have superior cash flows from operations in the future, after controlling for their current cash flows. 11
The results are very similar even when other control variables are included in the model (Table 7). 12
Table 7. Predicting Cash Flows in Period t+i to Cash Flows in Period t (1990-1993 IW Data) 13 LogCashFlow i,t+1 LogCashFlowi,t+2 LogCashFlowi,t+3 LogCashFlowi,t+4
Intercept -0.9467 (p<.0001) -1.3841 (p<.0001) -1.3685 (p<.0001) -1.1986 (p<.0001) FITi,t 0.2430 (p<.0541) 0.4127 (p<.0007) 0.2818 (p<.0304) 0.1142 (p<.3988)
LogCashFlowi,t 0.6608 (p<.0001) 0.5328 (p<.0001) 0.4717 (p<.0001) 0.5183 (p<.0001) Automate Dummyi,t -0.1529 (p<.0094) -0.2411 (p<.0001) -0.2097 (p<.0007) -0.1986 (p<.0018)
Concentrationi,t -0.1821 (p<.3587) -0.2052 (p<.2826) -0.2033 (p<.3403) -0.0988 (p<.6481) High Techi,t 0.0439 (p<.5362) 0.1134 (p<.0991) 0.0538 (p<.4636) 0.0852 (p<.2598) Low Techi,t -0.0488 (p<.5811) -0.0343 (p<.6860) -0.0496 (p<.5876) -0.0699 (p<.4556)
N 332 325 323 321 Adjusted R2 0.5463 0.5581 0.4419 0.4382
* Cash Flows is measured as the cash flows from operations divided by sales * FIT: The alignment between firm reporting structure and its strategic position. It equals Prob(CEO) when a firm’s CIO reports to the CEO; otherwise, it equals 1- Prob(CEO) when a firm’s CIO reports to the CFO
14 4.4 Robustness Test: Replication of Data Analysis and Results with 2006 Data 15
The generalizability of the 1990-93 IW data may be an issue because of their age. Given the 16
many changes in IT during the last decade (e.g., dot.com expansion and bust, Y2K, IT outsourcing), 17
we replicated the data analysis with data from 58 Fortune Global 1,000 US firms collected in 2006. 18
As shown in Table 8, the results of the logistic regression (Equation 1) show both αB1B=10.2511 19
(p=.0404) and αB2B=-1.6118 (p=.0350) to be significant, supporting H1 and H2. This shows that 20
strategic positioning determines the CIO reporting structure, even in 2006, similar to the IW data. 21

23
Table 8. Predicting CIO Reporting Structure with Strategic Positioning (2006 Data) 1 CIO Reporting Structure i, Bt B= αB1B*Average (Operating Income/Sales) i, Bt-4…tB + αB2B*Average 2
(Sales/Assets) i, Bt-4…t + αB3B* Control Variables i, t-4…t B 3 Hypothesized
Sign Logit
Coefficient Significance
(p-value) Operating Income over Sales (Differentiation) (+) 10.2511 0.0404 Sales over Assets (Cost Leadership) (-) -1.6118 0.0350 Industry Concentration Ratio -1.7648 0.3737 Automate Industry Dummy 0.8069 0.3919 High_Tech Dummy -1.4854 0.1074 Low_Tech Dummy -0.0088 0.9957 * Automate_Dummy=1 when the primary role of IT in that industry is to Automate, otherwise 0. * p-value for Sales over Assets and Operating Income over Sales are one-sided. All others are two-sided.
4 Table 9 reports the model fit statistics when predicting CIO reporting structure with strategic 5
positioning for the 2006 data. The χ2 of the Goodness-of-Fit Test is 3.7963 (p=.803), rejecting the 6
null hypothesis of lack of fit, implying that our model's estimates adequately fit the data. 7
Table 9. Model Fit Statistics for CIO Reporting Structure with Strategic Positioning (2006 data) 8 9 Predicted Probabilities and Observed Responses Model Fit Statistics
Percent Concordant 80.7 Somers' D 0.614 Criterion Intercept Only Intercept and CovariatesPercent Discordant 19.3 Gamma 0.614 AIC 76.095 71.466
Percent Tied 0.0 Tau-a 0.293 SC 78.12 85.643 Pairs 735 C 0.807 -2 Log L 74.095 57.466
10 Testing Global Null Hypothesis: BETA=0 R-Square
(Cox & Snell) .2569 Max-rescaled R-Square(Nagelkerke) .3502
Test χ2 d.o.f Pr > χ2 Hosmer and Lemeshow Goodness-of-Fit Test Likelihood Ratio 16.6293 6 0.0107
χ2 d.o.f Pr > χ2 Score 31.8985 6 0.0234 3.7963 7 0.0803 Wald 29.2968 6 0.1180
11
As Table 10 attests, the fit between CIO reporting structure and strategic positioning is associated 12
with higher abnormal stock returns, thus supporting H3, consistent with the 1990-1993 IW data. 13
Table 10. Abnormal Stock Returns based on Equally-Weighted Portfolios (2006 data) 14 Hypothesized Sign Abnormal_Return = α1 + β1*FITi +εi
Intercept -0.0646(p<0.3585) FIT (+) 0.1388(p<0.087) N 56
Adj R2 0.034 15
Table 11 shows the abnormal stock returns of the CEO versus the CFO portfolios. Since there 16
are no differences between the firms reporting to the CEO versus the CFO, H4 is not supported, 17
as before. 18

24
Table 11. Differences in Abnormal Stock Returns on Equally-Weighted Portfolios (2006 Data) 1 CIO Reporting
Structure Abnormal Return (CEO Group)
Abnormal Return (CFO Group)
Abnormal Return Difference
(CEO-CFO) Mean 0.0244 0.0280 -0.0036
Actual N 35 21 p=0. 9423
2 Table 12 reports the results of predicting future cash flows from operations in 2007 based on 3
the alignment between the CIO reporting structure with strategic positioning in 2006. Similar to 4
the 1990-1993 IW data, the results show that firms with a better fit between their CIO reporting 5
structure and strategic positioning have higher cash flows from operations during the next year, 6
even after controlling for current cash flows from operations. These results support H3. 7
Table 12. Regression Results Predicting 2007 Cash Flows from Operations with 2006 Data 8 Hypothesized Sign Log(Cash_Flow2007)
Intercept -1.44671 (p<.0011) FIT2006 (+) 0.99043 (p<.0113)
Log(Cash_Flow2006) 0.66879 (p<.0001) Automate Dummy2006 0.05151 (p<.8582)
Concentration2006 0.12398 (p<.8790) High Tech2006 0.1619 (p<.4611) Low Tech2006 -0.59321 (p<.1544)
N 38 Adjusted R2 0.6712
9 Taken together, the 2006 results closely correspond to the 1990-93 IW results. These findings 10
indicate the robustness of the results over time, implying that the optimal CIO reporting structure 11
relative to the firm’s strategic positioning has not changed, despite many changes in the nature and 12
use of IT in firms during the last two decades. 13
5. DISCUSSION 14
5.1 Key Findings 15
This study has three key findings that are supported from data from two time periods: First, it 16
shows that a firm’s strategic positioning determines its CIO reporting structure. Specifically, 17
differentiators tend to have their CIO report to the CEO, while cost leaders tend to have their 18
CIO report to the CFO. Second, the alignment or fit between a firm’s strategic positioning and its 19
CIO reporting structure influences firm performance (measured with both abnormal stock returns 20
25
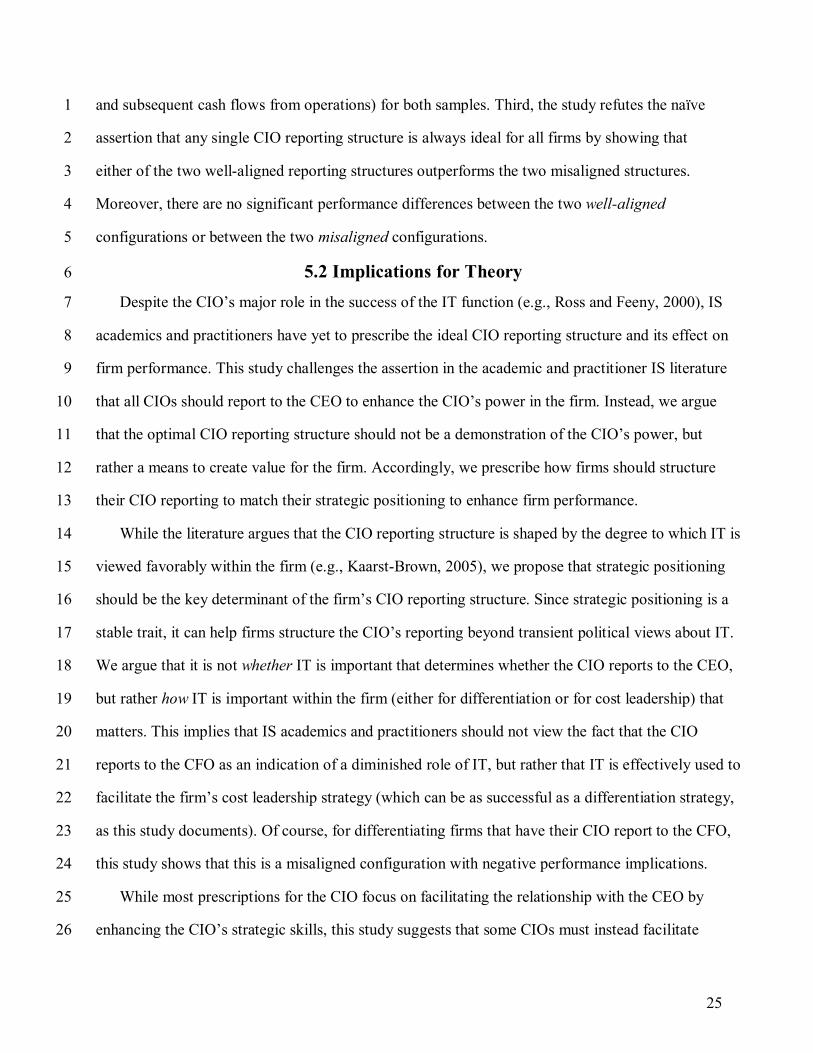
and subsequent cash flows from operations) for both samples. Third, the study refutes the naïve 1
assertion that any single CIO reporting structure is always ideal for all firms by showing that 2
either of the two well-aligned reporting structures outperforms the two misaligned structures. 3
Moreover, there are no significant performance differences between the two well-aligned 4
configurations or between the two misaligned configurations. 5
5.2 Implications for Theory 6
Despite the CIO’s major role in the success of the IT function (e.g., Ross and Feeny, 2000), IS 7
academics and practitioners have yet to prescribe the ideal CIO reporting structure and its effect on 8
firm performance. This study challenges the assertion in the academic and practitioner IS literature 9
that all CIOs should report to the CEO to enhance the CIO’s power in the firm. Instead, we argue 10
that the optimal CIO reporting structure should not be a demonstration of the CIO’s power, but 11
rather a means to create value for the firm. Accordingly, we prescribe how firms should structure 12
their CIO reporting to match their strategic positioning to enhance firm performance. 13
While the literature argues that the CIO reporting structure is shaped by the degree to which IT is 14
viewed favorably within the firm (e.g., Kaarst-Brown, 2005), we propose that strategic positioning 15
should be the key determinant of the firm’s CIO reporting structure. Since strategic positioning is a 16
stable trait, it can help firms structure the CIO’s reporting beyond transient political views about IT. 17
We argue that it is not whether IT is important that determines whether the CIO reports to the CEO, 18
but rather how IT is important within the firm (either for differentiation or for cost leadership) that 19
matters. This implies that IS academics and practitioners should not view the fact that the CIO 20
reports to the CFO as an indication of a diminished role of IT, but rather that IT is effectively used to 21
facilitate the firm’s cost leadership strategy (which can be as successful as a differentiation strategy, 22
as this study documents). Of course, for differentiating firms that have their CIO report to the CFO, 23
this study shows that this is a misaligned configuration with negative performance implications. 24
While most prescriptions for the CIO focus on facilitating the relationship with the CEO by 25
enhancing the CIO’s strategic skills, this study suggests that some CIOs must instead facilitate 26

26
the reporting relationship with the CFO by enhancing their financial control skills. This study 1
indicates that there may be two types of CIOs - CIOs with a strategy background who focus on 2
novel and differentiating IT systems, and CIOs with strong financial control skills who 3
emphasize IT systems for efficiency. Accordingly, the IS literature should prescribe how both 4
types of CIOs should enhance their respective skills to enhance the CIO reporting relationship. 5
While the IS literature has primarily used field interviews and case studies to determine the 6
ideal CIO reporting structure, this study uses objective longitudinal data from multiple firms, 7
enhancing the external validity and robustness of the study’s findings. Despite many changes in 8
the role of IT between 1990 and 2006, the optimality of our proposed CIO reporting structure has 9
persisted over time. Despite the many different structural factors that affect firm performance, 10
the pervasive impact of CIO reporting structure on firm performance documented in this study is 11
a major finding. This implies that the role of IT to sustain certain strategies and the role of the 12
CIO to support the requisite IT initiatives is ubiquitous. Also, while the CIO is often deemed 13
important only for IT-intensive firms, this study shows that the appropriately structuring the CIO 14
reporting applies to virtually all firms, irrespective of industry type (Automate or Informate). 15
The extensive literature on Porter’s (1980) generic strategies has predominantly used 16
perceptual measures that may suffer from subjectivity bias. Following the Dupont method 17
(Selling and Stickney, 1989), this study uses objective measures. Operating Income over Sales, 18
a measure of a firm’s ability to sustain high margins, captures differentiation strategy, while 19
Sales over Assets, a measure of efficient utilization of resources, captures cost leadership 20
strategy. These accounting ratios can be used by managers to better understand the success of 21
their firm’s realized strategic positioning and the effectiveness in pursuing either generic strategy. 22
This approach thus overcomes a key obstacle for research using Porter’s (1980) generic 23
strategies since it reflects realized, not intended, strategies. 24
5.3 Implications for Practice 25
The results suggest that firm performance depends on the alignment between the firm’s 26
strategic positioning and its CIO reporting structure. Firms with misaligned configurations have 27
27
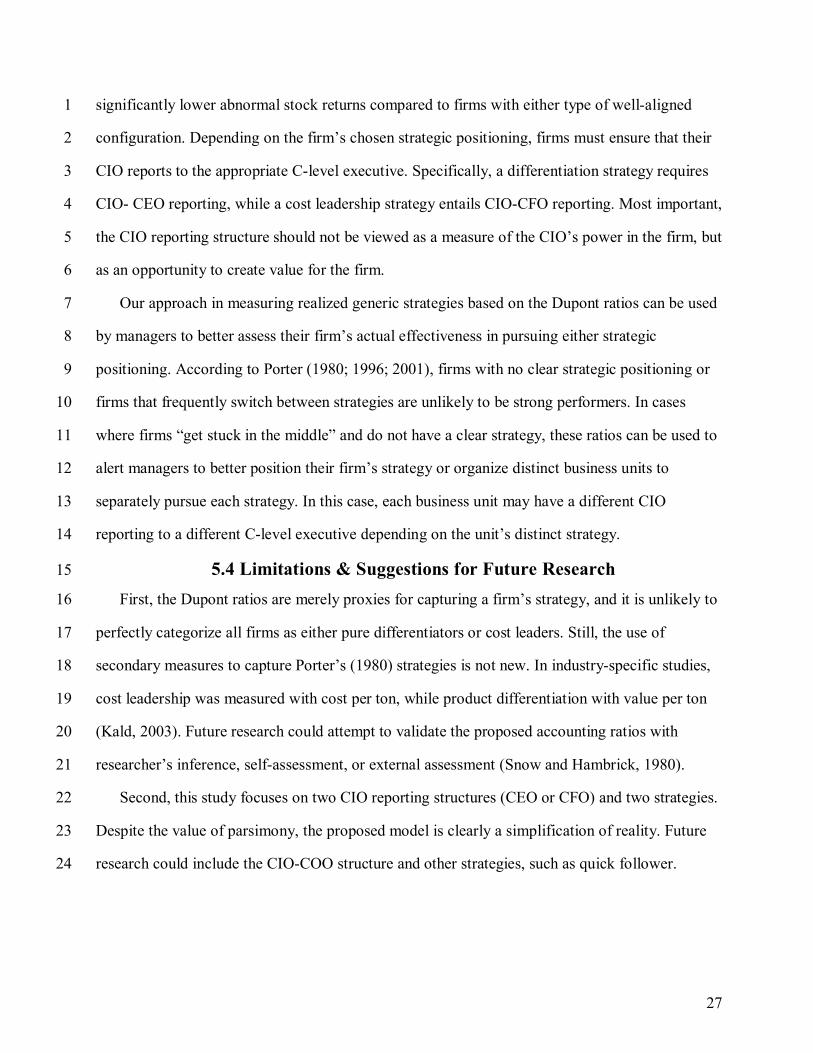
significantly lower abnormal stock returns compared to firms with either type of well-aligned 1
configuration. Depending on the firm’s chosen strategic positioning, firms must ensure that their 2
CIO reports to the appropriate C-level executive. Specifically, a differentiation strategy requires 3
CIO- CEO reporting, while a cost leadership strategy entails CIO-CFO reporting. Most important, 4
the CIO reporting structure should not be viewed as a measure of the CIO’s power in the firm, but 5
as an opportunity to create value for the firm. 6
Our approach in measuring realized generic strategies based on the Dupont ratios can be used 7
by managers to better assess their firm’s actual effectiveness in pursuing either strategic 8
positioning. According to Porter (1980; 1996; 2001), firms with no clear strategic positioning or 9
firms that frequently switch between strategies are unlikely to be strong performers. In cases 10
where firms “get stuck in the middle” and do not have a clear strategy, these ratios can be used to 11
alert managers to better position their firm’s strategy or organize distinct business units to 12
separately pursue each strategy. In this case, each business unit may have a different CIO 13
reporting to a different C-level executive depending on the unit’s distinct strategy. 14
5.4 Limitations & Suggestions for Future Research 15
First, the Dupont ratios are merely proxies for capturing a firm’s strategy, and it is unlikely to 16
perfectly categorize all firms as either pure differentiators or cost leaders. Still, the use of 17
secondary measures to capture Porter’s (1980) strategies is not new. In industry-specific studies, 18
cost leadership was measured with cost per ton, while product differentiation with value per ton 19
(Kald, 2003). Future research could attempt to validate the proposed accounting ratios with 20
researcher’s inference, self-assessment, or external assessment (Snow and Hambrick, 1980). 21
Second, this study focuses on two CIO reporting structures (CEO or CFO) and two strategies. 22
Despite the value of parsimony, the proposed model is clearly a simplification of reality. Future 23
research could include the CIO-COO structure and other strategies, such as quick follower. 24
28
Third, our analysis treats the highest IT executive as the CIO. While most top IT executives are 1
called CIOs (60% in the 2008 State of the CIO survey), they may be termed otherwise, such as VP 2
or Director of IT, or CTO. Future research may assess if the title CIO or others make a difference. 3
Fourth, this study focuses on the highest level IT executive (CIO) and the executive the CIO 4
reports to. Thus, it does not refer to the firm’s overall IT structure that deals with other aspects of 5
IT structure, such as how the IT function is managed or how the positions of other IT executives 6
are structured. Building on the evidence in this study documenting the importance of the CIO 7
reporting structure, future research could examine the implications of how other aspects of the IT 8
function are structured. 9
Fifth, despite the relatively constant strategic positioning over the 5-year period for our 10
sample firms, it is possible that a firm’s strategy changes over time. Future research could 11
examine how strategic positioning and CIO reporting structure change over time and determine 12
their impact on firm performance. 13
Finally, the CIO is one of many C-level executives whose reporting structure is likely to have 14
an impact on firm performance. Building upon this study’s results, future research could examine 15
the reporting structure of other high-ranked C-level executives, such as the COO or other VPs. 16
ENDING NOTE 17
Contrary to the intuitive assertion that the CIO should always report to the CEO, this study 18
shows that a CIO-CEO reporting structure is not necessarily superior for all firms; rather, it 19
depends on the firm’s strategic positioning. Challenging the prior literature, the results suggest 20
that irrespective of whether the CIO reports to the CEO or to the CFO, firms can have equally 21
high performance, as long as they align their CIO reporting structure with their strategic 22
positioning. Also, when the CIO reporting structure does not align well with strategic positioning, 23
it results in lower performance, irrespective of whether the CIO reports to the CEO or to the CFO. 24
This study shows that the CEO-CIO reporting structure may not be the best approach for all firms, 25
and it proposes the alignment of CIO reporting with strategic positioning to create firm value. 26
27
29
REFERENCES 1 1. Anderson, M.C., Banker, R.D., and Ravindran, S. “Value Implications of Investments in Information 2
Technology,” Management Science, 52, 9, (2006), pp. 1359-1376. 3 2. Applegate, L.M. and Elam, J.J. “New Information Systems Leaders: A Changing Role in a Changing World,” 4
MIS Quarterly, 16, (1992), pp. 469-490. 5 3. Armstrong, C., Curtis, V. and Sambamurthy, V. “Information Technology Assimilation in Firms: The 6
Influence of Senior Leadership and IT Infrastructures,” Information Systems Research, 10, 4, (1999), pp. 304-7 327. 8
4. Benjamin, R.I., Dickinson, C. and Rockart, J.F. “Changing Role of the Corporate Information Systems 9 Officer,” MIS Quarterly, 9, (1985), pp. 177-188. 10
5. Broadbent, M., and Kitzis, E. The New CIO Leader, Harvard Business School Press, Boston, MA, 2005. 11 6. Cash, J.I., McFarlan, F.W., McKenney, J.L. and Applegate, L.M. Corporate Information Systems 12
Management: Text and Cases, Irwin, Homewood, IL, 1992. 13 7. Chatterjee, D., Richardson, V. J., and Zmud, R.W. “Examining the Shareholder Wealth Effects of New CIO 14
Position Announcements,” MIS Quarterly, 25, 1, (2001), pp. 43-70. 15 8. Chandler, A.D. Strategy and Structure: Chapters in the History of Industrial Enterprise, MIT Press, 16
Cambridge, MA, 1962. 17 9. Earl, M. J., and Feeny, D. F. "Is Your CIO Adding Value," Sloan Management Review, 35, 3, (1994), 11-20. 18 10. Ein-Dor, P. and Segev, E. A Paradigm for Management Information Systems, New York, Praeger, 1981. 19 11. Enns, H.G., Huff, S.L., and Higgins, C.A. “CIO Lateral Influence Behaviors: Gaining Peers’ Commitment to 20
Strategic Information Systems,” MIS Quarterly, 27, 1, (2003), pp. 155-176. 21 12. Evans, B., “Solve the Mystery of the Disappearing CIO,” Information Week, September 29, (2007). 22 13. Fairfield, P.M. and Yohn, T. L. “Using Asset Turnover and Profit Margin to Forecast Changes in Firm 23
Profitability,” Review of Accounting Studies, 6, 4, (2001), pp. 371-385. 24 14. Fama, E. F. and French, K. R. “The Cross-Section of Expected Stock Returns,” Journal of Finance, 47, 25
(1992), pp. 427-465. 26 15. Farrell, D. Terwilliger, T., and Webb, A.P. “Getting IT Spending Right this Time,” McKinsey Quarterly, 2, 27
Online: http://www.management.com.ua/ims/ims058.html 28 16. Feeny, D.F., Edwards, B.R. and Simpson, K.M. “Understanding the CIO/CEO Relationship,” MIS Quarterly, 29
16, 4, (1992), pp. 435-448. 30 17. Floyd, S.W. and Wooldridge, B. “Path Analysis of the Relationship between Competitive Strategy, IT, and 31
Financial Performance,” Journal of Management Information Systems, 7, 1, (1990), pp. 47-64. 32 18. Francis, J., and K. Schipper, “Have Financial Statements Lost their Relevance?” Journal of Accounting 33
Research 37, 2, (1999), pp. 319-352. 34 19. Galbraith, J.R., Organizational Design, Addison-Wesley, Reading, MA, 1977. 35 20. Govindarajan, V. “Implementing Business Strategies at the Business Unit Level: Implications of Matching 36
Managers to Strategies,” Strategic Management Journal, 10, 3, (1989), pp. 251-269. 37 21. Guimaraes, T. and Igbaria, M. “Determinants of Turnover Intentions: Comparing IC and IS Personnel,” 38
Information Systems Research, 3, 3, (1992), pp. 273-303. 39 22. Hambrick, D.C. and Mason, P.A. “Upper Echelons: The Organization as a Reflection of its Top Managers,” 40
Academy of Management Review, 9, 1, (1984), pp. 193-206. 41 23. Hutheesing, N. "From CIO to CEO," Forbes, June 14, (1999), pp. 104-108. 42 24. Ives, B. and Olson, M.H. “Manager or Technician? The Nature of Information Systems Manager’s Job,” MIS 43
Quarterly, 5, 4, (1981), pp. 49-63. 44 25. Jarvenpaa, S.L. and Ives, B. “Executive Involvement and Participation in the Management of Information 45
Technology,” MIS Quarterly, 15, 2, (1991), pp. 204-227. 46 26. Kaarst-Brown, M.L. “Understanding an Organization’s View of the CIO: The Role of Assumptions about 47
IT,” MIS Quarterly Executive, 4, 2, (2005), pp. 287-301. 48 27. Kald, M. “Strategic Positioning: A Study of the Nordic Paper and Pulp Industry,” Strategic Change, 12, 6, 49
(2003), pp. 329-343. 50 28. Karahanna, E. and Chen, D. “Give Your CIO Time: An Empirical Analysis of CIO Role Effectiveness and 51
Firm Performance,” Working Paper, Terry School of Business, University of Georgia, 2006. 52 29. Karimi, J., Gupta, Y.P., and Somers, T.M. “The Congruence between a Firm’s Competitive Strategy and 53
Information Technology Leader’s Rank and Role, Journal of Management Information Systems, 13, 1, 54 (1996), pp. 63-88. 55
30. Kim, E., Nam, D. and Stimpert, J.L. “Testing the Applicability of Porter’s Generic Strategies in the Digital 56

30
Age: A Study of Korean Cyber Malls,” Journal of Business Strategies, 21, 1, (2004), pp. 19-45. 1 31. Koch, C. “CIOs Reporting to CFOs: Conflict of Interest,” CIO Magazine, September, 25, 2006. 2 32. Luftman, J.N., and Kempaiah, R. “An Update on Business-IT Alignment: “A Line” Has Been Drawn, MIS 3
Quarterly Executive, 6, 3, (2007), pp. 165-177. 4 33. Luftman, J.N., and Kempaiah, R. “Key Issues for IT Executives,” MIS Quarterly Executive, 7, 2 (2008), pp. 5
57-70. 6 34. Miles, R.E. and Snow, C.C. Organizational Strategy, Structure, and Process, New York, McGraw Hill, 1978. 7 35. Miller, D. and Friesen, P.H. “Porter’s (1980) Generic Strategies and Performance: An Empirical Examination 8
of with American Data,” Organization Studies, 7, 1, (1986), pp. 37-55. 9 36. Mintzberg, H., “Patterns in Strategy Formation,” Management Science, 24, 9, pp. 934-948. 10 37. Mintzberg, H., “The Design School: Reconsidering the basic premises of Strategic Management,” Strategic 11
Management Journal, 11, 1, (1990), pp. 171-195. 12 38. Nissim, D. and Penman, S., “Ration Analysis and Equity Valuation: From Research to Practice,” Review of 13
Accounting Studies, 6, 1, (2001), pp. 109-154. 14 39. Parry, E. “Survey shows more CIOS report to CEOs,” SearchCIO.com, September 23, 2004. 15 40. Porter, M. Competitive Strategy, New York: The Free Press, 1980. 16 41. Porter, M. “What is Strategy?” Harvard Business Review, 74, 6, (1996), pp. 61-78. 17 42. Porter, M. “Strategy and the Internet,” Harvard Business Review, 79, 3, (2001), pp. 63-82. 18 43. Power, K. “CFO: Friend or Foe,” CIO Magazine, July 8, 2002. 19 44. Preston, D. and Karahanna, E. “The Development of a Shared CIO/Executive Management Understanding 20
and its Impact on Information Systems Strategic Alignment,” Information Systems Control Journal, 3, 21 (2005). 22
45. Raghunathan, B. and Raghunathan, T.S. “Relationship of the Rank of Information Systems Executives to the 23 Organizational Role and Planning Dimensions of Information Systems,” Journal of Management Information 24 Systems, 6, 1, (1989), pp. 111-126. 25
46. Raghunathan, B. and Raghunathan, T.S. “Does the Reporting Level of the Information Systems Executive 26 Make a Difference?” Journal of Strategic Information Systems, 2, 1, (1993), pp. 27-38. 27
47. Raghunatham, T.S. “Impact of the CEO’s participation on Information Systems Steering Committees,” 28 Journal of Management Information Systems, 8, 4, (1992), pp. 83-96. 29
48. Reich, B.H. and Nelson, K.M. “In their Own Words: CIO Visions about the Future of In-House IT 30 Organizations,” DATABASE, 34, 4, (2003), pp. 28-44. 31
49. Rockart, J.F., Bullen, C.V. and Ball, L. “Future Role of the Information Systems Executive,” MIS Quarterly, 32 6, 1, (1982), pp. 1-14. 33
50. Ross, J. and Feeny, D. “The Evolving Role of the CIO,” In Zmud, R.W. (Ed.) Framing the Domains of IT 34 Management, Pinnaflex Press, 2000. 35
51. Rothfeder, J. “CIO is Starting to Stand for Career is Over,” Business Week, February 26, (1990), pp. 78-80. 36 52. Selling, T.I. and Stickney, C.P. “The Effects of Business Environment and Strategy on a Firm's Rate of 37
Return on Assets,” Financial Analysts Journal, 45, 1 (1989), pp. 43-68. 38 53. Senn, A. and Porrello, K. “Decoding the CIO-CFO Relationship,” OptimizeMag, June 2005. 39 54. Slater, D. “Get in Touch with Your Inner CFO: How can the CIO and CFO quit arguing and come together?” 40
CIO Magazine, 15, 19, (2002), pp. 1-3. 41 55. Sloan, R.G. “Do Stock Prices Fully Reflect Information on Cash Flows and Accruals about Future Earnings,” 42
The Accounting Review, 71, 3, (1996), pp. 289-315. 43 56. Slofstra, M. “CIO role grows in influence on CEO” Computing Canada, 27, 16, (2001), pp. 1-2. 44 57. Snow, C.C. and Hambrick, D.C. “Measuring Organizational Strategies: Some Theoretical and 45
Methodological Problems,” Academy of Management Review, 5, 4, (1980), pp. 527-538. 46 58. Stephens, C.S., Ledbetter, W.N., Mitra, A. and Ford, F.N. “Executive or Functional Manager? The Nature of 47
the CIO’s Job,” MIS Quarterly, 16, (1992), pp. 449-467. 48 59. Stickney, C. and Brown, P. Financial Reporting and Financial Statement Analysis, Harcourt College 49
Publishers, New York, NY, 1999. 50 60. Talbot, C., “CIO perception regarding strategic importance shifts downwards,” Connect IT, April 2, 2008. 51 61. Venkatraman, N., "The Concept of Fit in Strategy Research: Toward Verbal and Statistical Correspondence," 52
Academy of Management Review, 14, 3, (1989), pp. 423-444. 53 62. Vizard, M. “Changing CIO Characteristics Explain CTO’s Rise,” InfoWorld, December 4, (2000), p. 49. 54 63. Watson, R.T. “Influences on the IS Manager’s Perceptions of Key Issues: Information Scanning and the 55
Relationship with the CEO,” MIS Quarterly, 14, 2, (1990), pp. 217-231. 56 64. Wilson, S. “Two Steps Back in the CIO Reporting Structure,” CIO Magazine, October 11, 2007. 57