cics performance analyzer - ibm · pdf file3.3.8 bts report ... viii cics performance analyzer...
TRANSCRIPT

ibm.com/redbooks
Front cover
CICS Performance Analyzer
Chris RaynsShirley Collins
Eugene DeborinPeter Klein
Greg TodaroMark Todd
Norbert Verbestel
Gain insight to the IBM WebSphere MQ reporting capabilities
Explore enhanced CICS Monitoring Facility (CMF) resource class reporting
Learn how to work with historical performance data


International Technical Support Organization
CICS Performance Analyzer
September 2003
SG24-6063-00

© Copyright International Business Machines Corporation 2003. All rights reserved.Note to U.S. Government Users Restricted Rights -- Use, duplication or disclosure restricted by GSA ADP ScheduleContract with IBM Corp.
First Edition (September 2003)
This edition applies to Version 1 Release 3 of IBM CICS Performance Analyzer for z/OS (product number 5655-F38), Version 1 Release 3 of CICS Transaction Server (product number 5655-147), and Version 2 Release 2 of CICS Transaction Server (product number 5697-E93).
Note: Before using this information and the product it supports, read the information in “Notices” on page xi.

Contents
Notices . . . . . . . . . . . . . . . . . . . . . . . . . . . . . . . . . . . . . . . . . . . . . . . . . . . . . . . . . . . . . . . . . xiTrademarks . . . . . . . . . . . . . . . . . . . . . . . . . . . . . . . . . . . . . . . . . . . . . . . . . . . . . . . . . . . . . . xii
Preface . . . . . . . . . . . . . . . . . . . . . . . . . . . . . . . . . . . . . . . . . . . . . . . . . . . . . . . . . . . . . . . . xiiiThe team who wrote this book . . . . . . . . . . . . . . . . . . . . . . . . . . . . . . . . . . . . . . . . . . . . . . . xiiiBecome a published author . . . . . . . . . . . . . . . . . . . . . . . . . . . . . . . . . . . . . . . . . . . . . . . . . xivComments welcome. . . . . . . . . . . . . . . . . . . . . . . . . . . . . . . . . . . . . . . . . . . . . . . . . . . . . . . .xv
Part 1. CICS Performance Analyzer overview . . . . . . . . . . . . . . . . . . . . . . . . . . . . . . . . . . . . . . . . . . . . . . 1
Chapter 1. CICS performance management . . . . . . . . . . . . . . . . . . . . . . . . . . . . . . . . . . . 31.1 How to approach CICS performance monitoring and tuning. . . . . . . . . . . . . . . . . . . . . . 41.2 CICS tools . . . . . . . . . . . . . . . . . . . . . . . . . . . . . . . . . . . . . . . . . . . . . . . . . . . . . . . . . . . . 4
1.2.1 CICS Performance Analyzer . . . . . . . . . . . . . . . . . . . . . . . . . . . . . . . . . . . . . . . . . . 51.2.2 CICS Performance Monitor . . . . . . . . . . . . . . . . . . . . . . . . . . . . . . . . . . . . . . . . . . . 61.2.3 Benefits of CICS Performance Analyzer and CICS Performance Monitor . . . . . . . 71.2.4 CICS Online Transmission Time Optimizer . . . . . . . . . . . . . . . . . . . . . . . . . . . . . . 81.2.5 CICS Interdependency Analyzer. . . . . . . . . . . . . . . . . . . . . . . . . . . . . . . . . . . . . . . 81.2.6 CICS Business Event Publisher for MQSeries . . . . . . . . . . . . . . . . . . . . . . . . . . . . 81.2.7 IBM Session Manager for z/OS. . . . . . . . . . . . . . . . . . . . . . . . . . . . . . . . . . . . . . . . 91.2.8 CICS VSAM Recovery . . . . . . . . . . . . . . . . . . . . . . . . . . . . . . . . . . . . . . . . . . . . . . 9
1.3 Data used by CICS Performance Analyzer . . . . . . . . . . . . . . . . . . . . . . . . . . . . . . . . . . 101.3.1 CICS Monitoring Facility data (SMF 110 records). . . . . . . . . . . . . . . . . . . . . . . . . 101.3.2 DB2 accounting data (SMF 101 records) . . . . . . . . . . . . . . . . . . . . . . . . . . . . . . . 141.3.3 WebSphere MQ accounting data (SMF 116 records) . . . . . . . . . . . . . . . . . . . . . . 151.3.4 MVS System Logger data (SMF 88 records) . . . . . . . . . . . . . . . . . . . . . . . . . . . . 16
1.4 Other relevant CICS data and utilities . . . . . . . . . . . . . . . . . . . . . . . . . . . . . . . . . . . . . . 171.4.1 CICS statistics. . . . . . . . . . . . . . . . . . . . . . . . . . . . . . . . . . . . . . . . . . . . . . . . . . . . 181.4.2 The sample statistics program: DFH0STAT . . . . . . . . . . . . . . . . . . . . . . . . . . . . . 191.4.3 Statistics utility program: DFHSTUP . . . . . . . . . . . . . . . . . . . . . . . . . . . . . . . . . . . 191.4.4 Monitoring dictionary utility program: DFHMNDUP. . . . . . . . . . . . . . . . . . . . . . . . 201.4.5 Sample monitoring data print program: DFH$MOLS . . . . . . . . . . . . . . . . . . . . . . 201.4.6 Journal utility program: DFHJUP. . . . . . . . . . . . . . . . . . . . . . . . . . . . . . . . . . . . . . 21
1.5 Other relevant information sources . . . . . . . . . . . . . . . . . . . . . . . . . . . . . . . . . . . . . . . . 211.5.1 System Management Facility . . . . . . . . . . . . . . . . . . . . . . . . . . . . . . . . . . . . . . . . 211.5.2 Resource Management Facility. . . . . . . . . . . . . . . . . . . . . . . . . . . . . . . . . . . . . . . 221.5.3 Generalized Trace Facility . . . . . . . . . . . . . . . . . . . . . . . . . . . . . . . . . . . . . . . . . . 221.5.4 Tivoli Decision Support for OS/390. . . . . . . . . . . . . . . . . . . . . . . . . . . . . . . . . . . . 22
Chapter 2. A quick start to CICS Performance Analyzer . . . . . . . . . . . . . . . . . . . . . . . . 232.1 What CICS PA is . . . . . . . . . . . . . . . . . . . . . . . . . . . . . . . . . . . . . . . . . . . . . . . . . . . . . . 242.2 System requirements . . . . . . . . . . . . . . . . . . . . . . . . . . . . . . . . . . . . . . . . . . . . . . . . . . 252.3 Recommended ISPF setup . . . . . . . . . . . . . . . . . . . . . . . . . . . . . . . . . . . . . . . . . . . . . . 262.4 Preparing the SMF data for CICS PA . . . . . . . . . . . . . . . . . . . . . . . . . . . . . . . . . . . . . . 282.5 Starting CICS PA . . . . . . . . . . . . . . . . . . . . . . . . . . . . . . . . . . . . . . . . . . . . . . . . . . . . . 29
2.5.1 CICS PA Primary Option Menu. . . . . . . . . . . . . . . . . . . . . . . . . . . . . . . . . . . . . . . 292.6 System definitions . . . . . . . . . . . . . . . . . . . . . . . . . . . . . . . . . . . . . . . . . . . . . . . . . . . . . 29
2.6.1 System Definitions Menu . . . . . . . . . . . . . . . . . . . . . . . . . . . . . . . . . . . . . . . . . . . 302.6.2 Take-Up from SMF . . . . . . . . . . . . . . . . . . . . . . . . . . . . . . . . . . . . . . . . . . . . . . . . 30
© Copyright IBM Corp. 2003. All rights reserved. iii

2.6.3 Maintain system definitions. . . . . . . . . . . . . . . . . . . . . . . . . . . . . . . . . . . . . . . . . . 312.6.4 MVS image definition . . . . . . . . . . . . . . . . . . . . . . . . . . . . . . . . . . . . . . . . . . . . . . 322.6.5 CICS System definition . . . . . . . . . . . . . . . . . . . . . . . . . . . . . . . . . . . . . . . . . . . . . 342.6.6 Other system definitions: DB2, WebSphere MQ, System Logger. . . . . . . . . . . . . 35
2.7 Requesting reports and extracts . . . . . . . . . . . . . . . . . . . . . . . . . . . . . . . . . . . . . . . . . . 352.7.1 Creating the Report Sets data set. . . . . . . . . . . . . . . . . . . . . . . . . . . . . . . . . . . . . 352.7.2 Report Sets . . . . . . . . . . . . . . . . . . . . . . . . . . . . . . . . . . . . . . . . . . . . . . . . . . . . . . 362.7.3 Editing the Report Set . . . . . . . . . . . . . . . . . . . . . . . . . . . . . . . . . . . . . . . . . . . . . . 362.7.4 Global Options . . . . . . . . . . . . . . . . . . . . . . . . . . . . . . . . . . . . . . . . . . . . . . . . . . . 382.7.5 Specifying report options . . . . . . . . . . . . . . . . . . . . . . . . . . . . . . . . . . . . . . . . . . . 392.7.6 Reports list . . . . . . . . . . . . . . . . . . . . . . . . . . . . . . . . . . . . . . . . . . . . . . . . . . . . . . 40
2.8 Running your reports. . . . . . . . . . . . . . . . . . . . . . . . . . . . . . . . . . . . . . . . . . . . . . . . . . . 402.8.1 Active status . . . . . . . . . . . . . . . . . . . . . . . . . . . . . . . . . . . . . . . . . . . . . . . . . . . . . 412.8.2 Run Report Set . . . . . . . . . . . . . . . . . . . . . . . . . . . . . . . . . . . . . . . . . . . . . . . . . . . 412.8.3 JCL generation . . . . . . . . . . . . . . . . . . . . . . . . . . . . . . . . . . . . . . . . . . . . . . . . . . . 42
2.9 Viewing the report output . . . . . . . . . . . . . . . . . . . . . . . . . . . . . . . . . . . . . . . . . . . . . . . 432.10 Tailoring report formats . . . . . . . . . . . . . . . . . . . . . . . . . . . . . . . . . . . . . . . . . . . . . . . . 44
2.10.1 Creating the Report Forms data set . . . . . . . . . . . . . . . . . . . . . . . . . . . . . . . . . . 442.10.2 Report Form types . . . . . . . . . . . . . . . . . . . . . . . . . . . . . . . . . . . . . . . . . . . . . . . 442.10.3 Report Forms list. . . . . . . . . . . . . . . . . . . . . . . . . . . . . . . . . . . . . . . . . . . . . . . . . 452.10.4 Sample Report Forms. . . . . . . . . . . . . . . . . . . . . . . . . . . . . . . . . . . . . . . . . . . . . 452.10.5 Edit Report Form. . . . . . . . . . . . . . . . . . . . . . . . . . . . . . . . . . . . . . . . . . . . . . . . . 462.10.6 New Report Form . . . . . . . . . . . . . . . . . . . . . . . . . . . . . . . . . . . . . . . . . . . . . . . . 482.10.7 Using the Report Form in your report . . . . . . . . . . . . . . . . . . . . . . . . . . . . . . . . . 49
2.11 Filtering the report . . . . . . . . . . . . . . . . . . . . . . . . . . . . . . . . . . . . . . . . . . . . . . . . . . . . 512.11.1 Selection criteria . . . . . . . . . . . . . . . . . . . . . . . . . . . . . . . . . . . . . . . . . . . . . . . . . 522.11.2 Run Report Set . . . . . . . . . . . . . . . . . . . . . . . . . . . . . . . . . . . . . . . . . . . . . . . . . . 542.11.3 JCL generation . . . . . . . . . . . . . . . . . . . . . . . . . . . . . . . . . . . . . . . . . . . . . . . . . . 55
2.12 Maintaining Object Lists . . . . . . . . . . . . . . . . . . . . . . . . . . . . . . . . . . . . . . . . . . . . . . . 562.12.1 Creating the Object Lists data set . . . . . . . . . . . . . . . . . . . . . . . . . . . . . . . . . . . . 562.12.2 Object Lists . . . . . . . . . . . . . . . . . . . . . . . . . . . . . . . . . . . . . . . . . . . . . . . . . . . . . 562.12.3 Edit Object List . . . . . . . . . . . . . . . . . . . . . . . . . . . . . . . . . . . . . . . . . . . . . . . . . . 562.12.4 Using the Object List in your selection criteria . . . . . . . . . . . . . . . . . . . . . . . . . . 57
Chapter 3. Reports and extracts . . . . . . . . . . . . . . . . . . . . . . . . . . . . . . . . . . . . . . . . . . . 593.1 CICS PA Report Set . . . . . . . . . . . . . . . . . . . . . . . . . . . . . . . . . . . . . . . . . . . . . . . . . . . 603.2 CICS PA commands . . . . . . . . . . . . . . . . . . . . . . . . . . . . . . . . . . . . . . . . . . . . . . . . . . . 64
3.2.1 Commands for reports and extracts . . . . . . . . . . . . . . . . . . . . . . . . . . . . . . . . . . . 643.2.2 Commands for HDB processing . . . . . . . . . . . . . . . . . . . . . . . . . . . . . . . . . . . . . . 64
3.3 Performance reports . . . . . . . . . . . . . . . . . . . . . . . . . . . . . . . . . . . . . . . . . . . . . . . . . . . 653.3.1 Performance List report . . . . . . . . . . . . . . . . . . . . . . . . . . . . . . . . . . . . . . . . . . . . 653.3.2 Performance List Extended report . . . . . . . . . . . . . . . . . . . . . . . . . . . . . . . . . . . . 673.3.3 Performance Summary report. . . . . . . . . . . . . . . . . . . . . . . . . . . . . . . . . . . . . . . . 703.3.4 Performance Totals report . . . . . . . . . . . . . . . . . . . . . . . . . . . . . . . . . . . . . . . . . . 723.3.5 Wait Analysis report . . . . . . . . . . . . . . . . . . . . . . . . . . . . . . . . . . . . . . . . . . . . . . . 753.3.6 Cross-System Work report . . . . . . . . . . . . . . . . . . . . . . . . . . . . . . . . . . . . . . . . . . 773.3.7 Transaction Group report . . . . . . . . . . . . . . . . . . . . . . . . . . . . . . . . . . . . . . . . . . . 803.3.8 BTS report. . . . . . . . . . . . . . . . . . . . . . . . . . . . . . . . . . . . . . . . . . . . . . . . . . . . . . . 813.3.9 Workload Activity report . . . . . . . . . . . . . . . . . . . . . . . . . . . . . . . . . . . . . . . . . . . . 82
3.4 Exception reports . . . . . . . . . . . . . . . . . . . . . . . . . . . . . . . . . . . . . . . . . . . . . . . . . . . . . 843.4.1 Exception List report . . . . . . . . . . . . . . . . . . . . . . . . . . . . . . . . . . . . . . . . . . . . . . . 843.4.2 Exception Summary report . . . . . . . . . . . . . . . . . . . . . . . . . . . . . . . . . . . . . . . . . . 85
3.5 Transaction Resource Usage reports . . . . . . . . . . . . . . . . . . . . . . . . . . . . . . . . . . . . . . 85
iv CICS Performance Analyzer

3.5.1 File Usage Summary report . . . . . . . . . . . . . . . . . . . . . . . . . . . . . . . . . . . . . . . . . 863.5.2 Temporary Storage Usage Summary report . . . . . . . . . . . . . . . . . . . . . . . . . . . . . 873.5.3 Transaction Resource Usage List report. . . . . . . . . . . . . . . . . . . . . . . . . . . . . . . . 88
3.6 Subsystem reports . . . . . . . . . . . . . . . . . . . . . . . . . . . . . . . . . . . . . . . . . . . . . . . . . . . . 893.6.1 DB2 report. . . . . . . . . . . . . . . . . . . . . . . . . . . . . . . . . . . . . . . . . . . . . . . . . . . . . . . 893.6.2 WebSphere MQ report . . . . . . . . . . . . . . . . . . . . . . . . . . . . . . . . . . . . . . . . . . . . . 91
3.7 System reports . . . . . . . . . . . . . . . . . . . . . . . . . . . . . . . . . . . . . . . . . . . . . . . . . . . . . . . 943.7.1 System Logger report . . . . . . . . . . . . . . . . . . . . . . . . . . . . . . . . . . . . . . . . . . . . . . 94
3.8 Performance Graph reports . . . . . . . . . . . . . . . . . . . . . . . . . . . . . . . . . . . . . . . . . . . . . 973.8.1 Transaction Rate Graph report . . . . . . . . . . . . . . . . . . . . . . . . . . . . . . . . . . . . . . . 973.8.2 Transaction Response Time Graph report . . . . . . . . . . . . . . . . . . . . . . . . . . . . . . 98
3.9 Performance extracts . . . . . . . . . . . . . . . . . . . . . . . . . . . . . . . . . . . . . . . . . . . . . . . . . . 993.9.1 Cross-System Work extract . . . . . . . . . . . . . . . . . . . . . . . . . . . . . . . . . . . . . . . . . 993.9.2 Export extract . . . . . . . . . . . . . . . . . . . . . . . . . . . . . . . . . . . . . . . . . . . . . . . . . . . 1013.9.3 Record Selection extract . . . . . . . . . . . . . . . . . . . . . . . . . . . . . . . . . . . . . . . . . . . 104
3.10 Popular mix . . . . . . . . . . . . . . . . . . . . . . . . . . . . . . . . . . . . . . . . . . . . . . . . . . . . . . . . 105
Chapter 4. Processing extracts . . . . . . . . . . . . . . . . . . . . . . . . . . . . . . . . . . . . . . . . . . . 1074.1 Processing extracts with DB2 . . . . . . . . . . . . . . . . . . . . . . . . . . . . . . . . . . . . . . . . . . . 1084.2 Processing extracts with Lotus 1-2-3 . . . . . . . . . . . . . . . . . . . . . . . . . . . . . . . . . . . . . 108
4.2.1 Exporting performance extracts . . . . . . . . . . . . . . . . . . . . . . . . . . . . . . . . . . . . . 1084.2.2 Importing extracted data to Lotus 1-2-3 . . . . . . . . . . . . . . . . . . . . . . . . . . . . . . . 110
4.3 Processing extracts with Microsoft Excel . . . . . . . . . . . . . . . . . . . . . . . . . . . . . . . . . . 1124.3.1 Exporting a performance extract . . . . . . . . . . . . . . . . . . . . . . . . . . . . . . . . . . . . . 1124.3.2 Importing extracted data into Microsoft Excel . . . . . . . . . . . . . . . . . . . . . . . . . . . 113
4.4 Processing extracts with Microsoft Access . . . . . . . . . . . . . . . . . . . . . . . . . . . . . . . . . 1184.4.1 Exporting performance extract . . . . . . . . . . . . . . . . . . . . . . . . . . . . . . . . . . . . . . 1184.4.2 Importing extracted data into Microsoft Access . . . . . . . . . . . . . . . . . . . . . . . . . 118
Part 2. CICS Performance Analyzer in action. . . . . . . . . . . . . . . . . . . . . . . . . . . . . . . . . . . . . . . . . . . . . 127
Chapter 5. System setup and scenario overview. . . . . . . . . . . . . . . . . . . . . . . . . . . . . 1295.1 CICS region setup. . . . . . . . . . . . . . . . . . . . . . . . . . . . . . . . . . . . . . . . . . . . . . . . . . . . 130
5.1.1 Configuration for traditional workloads . . . . . . . . . . . . . . . . . . . . . . . . . . . . . . . . 1305.1.2 Configuration for Enterprise JavaBean workloads . . . . . . . . . . . . . . . . . . . . . . . 1305.1.3 CICS Web Support and 3270 Bridge setup . . . . . . . . . . . . . . . . . . . . . . . . . . . . 1315.1.4 CICS Transaction Gateway setup. . . . . . . . . . . . . . . . . . . . . . . . . . . . . . . . . . . . 131
5.2 Scenarios . . . . . . . . . . . . . . . . . . . . . . . . . . . . . . . . . . . . . . . . . . . . . . . . . . . . . . . . . . 1335.2.1 VSAM application performance analysis and Transaction Resource Monitoring
support . . . . . . . . . . . . . . . . . . . . . . . . . . . . . . . . . . . . . . . . . . . . . . . . . . . . . . . . 1345.2.2 Tuning the CICS-DB2 attachment facility . . . . . . . . . . . . . . . . . . . . . . . . . . . . . . 1345.2.3 WebSphere MQ . . . . . . . . . . . . . . . . . . . . . . . . . . . . . . . . . . . . . . . . . . . . . . . . . 1345.2.4 CICS use of MVS System Logger. . . . . . . . . . . . . . . . . . . . . . . . . . . . . . . . . . . . 1345.2.5 CICS access through CICS Transaction Gateway . . . . . . . . . . . . . . . . . . . . . . . 1355.2.6 CICS Web Support and 3270 Bridge . . . . . . . . . . . . . . . . . . . . . . . . . . . . . . . . . 1355.2.7 Java applications in CICS . . . . . . . . . . . . . . . . . . . . . . . . . . . . . . . . . . . . . . . . . . 1355.2.8 Enterprise JavaBeans in CICS . . . . . . . . . . . . . . . . . . . . . . . . . . . . . . . . . . . . . . 1355.2.9 Application Naming support . . . . . . . . . . . . . . . . . . . . . . . . . . . . . . . . . . . . . . . . 1365.2.10 CALL and LINK performance . . . . . . . . . . . . . . . . . . . . . . . . . . . . . . . . . . . . . . 1365.2.11 Exception reporting . . . . . . . . . . . . . . . . . . . . . . . . . . . . . . . . . . . . . . . . . . . . . . 1365.2.12 Analyzing overall CICS system performance . . . . . . . . . . . . . . . . . . . . . . . . . . 1365.2.13 Using CICS Performance Analyzer reports for problem determination. . . . . . . 1365.2.14 Historical Database (HDB) . . . . . . . . . . . . . . . . . . . . . . . . . . . . . . . . . . . . . . . . 137
Contents v

Chapter 6. VSAM application performance analysis and Transaction Resource Monitoring support. . . . . . . . . . . . . . . . . . . . . . . . . . . . . . . . . . . . . . . . . . . . 139
6.1 CICS VSAM interface . . . . . . . . . . . . . . . . . . . . . . . . . . . . . . . . . . . . . . . . . . . . . . . . . 1406.2 CICS VSAM RLS scenario description . . . . . . . . . . . . . . . . . . . . . . . . . . . . . . . . . . . . 140
6.2.1 RLS workload generation . . . . . . . . . . . . . . . . . . . . . . . . . . . . . . . . . . . . . . . . . . 1416.2.2 Performance objectives . . . . . . . . . . . . . . . . . . . . . . . . . . . . . . . . . . . . . . . . . . . 142
6.3 Running the VSAM RLS scenario . . . . . . . . . . . . . . . . . . . . . . . . . . . . . . . . . . . . . . . . 1436.3.1 Updating system definitions . . . . . . . . . . . . . . . . . . . . . . . . . . . . . . . . . . . . . . . . 1436.3.2 Creating a Summary Report Form . . . . . . . . . . . . . . . . . . . . . . . . . . . . . . . . . . . 1456.3.3 Creating an Object List . . . . . . . . . . . . . . . . . . . . . . . . . . . . . . . . . . . . . . . . . . . . 1466.3.4 Creating a Report Set . . . . . . . . . . . . . . . . . . . . . . . . . . . . . . . . . . . . . . . . . . . . . 147
6.4 CICS VSAM LSR scenario description . . . . . . . . . . . . . . . . . . . . . . . . . . . . . . . . . . . . 1576.5 Running the VSAM LSR scenario . . . . . . . . . . . . . . . . . . . . . . . . . . . . . . . . . . . . . . . . 157
6.5.1 LSR workload generation . . . . . . . . . . . . . . . . . . . . . . . . . . . . . . . . . . . . . . . . . . 1576.5.2 LSR application performance objectives. . . . . . . . . . . . . . . . . . . . . . . . . . . . . . . 1586.5.3 Analyzing the current average response time. . . . . . . . . . . . . . . . . . . . . . . . . . . 1586.5.4 Tuning changes to LSR . . . . . . . . . . . . . . . . . . . . . . . . . . . . . . . . . . . . . . . . . . . 1616.5.5 Analyzing results . . . . . . . . . . . . . . . . . . . . . . . . . . . . . . . . . . . . . . . . . . . . . . . . . 162
6.6 Application performance RLS versus LSR . . . . . . . . . . . . . . . . . . . . . . . . . . . . . . . . . 1636.7 Transaction Resource Monitoring . . . . . . . . . . . . . . . . . . . . . . . . . . . . . . . . . . . . . . . . 1636.8 Conclusion . . . . . . . . . . . . . . . . . . . . . . . . . . . . . . . . . . . . . . . . . . . . . . . . . . . . . . . . . 169
Chapter 7. Tuning the CICS DB2 attachment facility . . . . . . . . . . . . . . . . . . . . . . . . . . 1717.1 CICS and DB2. . . . . . . . . . . . . . . . . . . . . . . . . . . . . . . . . . . . . . . . . . . . . . . . . . . . . . . 172
7.1.1 Overview of the CICS DB2 Attachment Facility . . . . . . . . . . . . . . . . . . . . . . . . . 1727.1.2 Functions . . . . . . . . . . . . . . . . . . . . . . . . . . . . . . . . . . . . . . . . . . . . . . . . . . . . . . 1727.1.3 CICS and DB2 connectivity. . . . . . . . . . . . . . . . . . . . . . . . . . . . . . . . . . . . . . . . . 173
7.2 CICS DB2 accounting and monitoring . . . . . . . . . . . . . . . . . . . . . . . . . . . . . . . . . . . . 1777.3 CICS PA reporting CICS DB2 Attachment Facility . . . . . . . . . . . . . . . . . . . . . . . . . . . 1797.4 CICS PA example reports . . . . . . . . . . . . . . . . . . . . . . . . . . . . . . . . . . . . . . . . . . . . . . 1797.5 CICS TS V1.3 and DB2 V7 scenario. . . . . . . . . . . . . . . . . . . . . . . . . . . . . . . . . . . . . . 1877.6 CICS TS V2.2 and DB2 V7 scenario. . . . . . . . . . . . . . . . . . . . . . . . . . . . . . . . . . . . . . 1947.7 Extracting CICS DB2 records . . . . . . . . . . . . . . . . . . . . . . . . . . . . . . . . . . . . . . . . . . . 2007.8 Conclusion . . . . . . . . . . . . . . . . . . . . . . . . . . . . . . . . . . . . . . . . . . . . . . . . . . . . . . . . . 203
Chapter 8. WebSphere MQ . . . . . . . . . . . . . . . . . . . . . . . . . . . . . . . . . . . . . . . . . . . . . . . 2058.1 Overview . . . . . . . . . . . . . . . . . . . . . . . . . . . . . . . . . . . . . . . . . . . . . . . . . . . . . . . . . . . 2068.2 Environment . . . . . . . . . . . . . . . . . . . . . . . . . . . . . . . . . . . . . . . . . . . . . . . . . . . . . . . . 2068.3 CICS changes . . . . . . . . . . . . . . . . . . . . . . . . . . . . . . . . . . . . . . . . . . . . . . . . . . . . . . . 2078.4 MQ accounting trace . . . . . . . . . . . . . . . . . . . . . . . . . . . . . . . . . . . . . . . . . . . . . . . . . . 2078.5 MQ reports . . . . . . . . . . . . . . . . . . . . . . . . . . . . . . . . . . . . . . . . . . . . . . . . . . . . . . . . . 209
8.5.1 MQ class 1 reports . . . . . . . . . . . . . . . . . . . . . . . . . . . . . . . . . . . . . . . . . . . . . . . 2108.5.2 MQ Class 3 reports . . . . . . . . . . . . . . . . . . . . . . . . . . . . . . . . . . . . . . . . . . . . . . . 2138.5.3 Performance List report . . . . . . . . . . . . . . . . . . . . . . . . . . . . . . . . . . . . . . . . . . . 2168.5.4 Transaction Resource Usage Temporary Storage report . . . . . . . . . . . . . . . . . . 218
8.6 Conclusion . . . . . . . . . . . . . . . . . . . . . . . . . . . . . . . . . . . . . . . . . . . . . . . . . . . . . . . . . 221
Chapter 9. CICS and MVS System Logger . . . . . . . . . . . . . . . . . . . . . . . . . . . . . . . . . . 2239.1 CICS TS and the MVS System Logger . . . . . . . . . . . . . . . . . . . . . . . . . . . . . . . . . . . . 2249.2 CICS PA reporting on the System Logger . . . . . . . . . . . . . . . . . . . . . . . . . . . . . . . . . 2269.3 Scenario description . . . . . . . . . . . . . . . . . . . . . . . . . . . . . . . . . . . . . . . . . . . . . . . . . . 2269.4 Scenario run . . . . . . . . . . . . . . . . . . . . . . . . . . . . . . . . . . . . . . . . . . . . . . . . . . . . . . . . 2279.5 Conclusion . . . . . . . . . . . . . . . . . . . . . . . . . . . . . . . . . . . . . . . . . . . . . . . . . . . . . . . . . 239
vi CICS Performance Analyzer

Chapter 10. Scenarios with CICS Transaction Gateway . . . . . . . . . . . . . . . . . . . . . . . 24110.1 What is CICS Transaction Gateway . . . . . . . . . . . . . . . . . . . . . . . . . . . . . . . . . . . . . 242
10.1.1 Gateway components and downstream protocols . . . . . . . . . . . . . . . . . . . . . . 24210.1.2 Application programming interfaces and upstream protocols . . . . . . . . . . . . . . 243
10.2 Scenario description . . . . . . . . . . . . . . . . . . . . . . . . . . . . . . . . . . . . . . . . . . . . . . . . . 24410.2.1 Front-end application . . . . . . . . . . . . . . . . . . . . . . . . . . . . . . . . . . . . . . . . . . . . 24510.2.2 Back-end application. . . . . . . . . . . . . . . . . . . . . . . . . . . . . . . . . . . . . . . . . . . . . 24510.2.3 CTG for z/OS EXCI scenario . . . . . . . . . . . . . . . . . . . . . . . . . . . . . . . . . . . . . . 24610.2.4 Distributed CTG using ECI over TCP/IP . . . . . . . . . . . . . . . . . . . . . . . . . . . . . . 246
10.3 Scenario run . . . . . . . . . . . . . . . . . . . . . . . . . . . . . . . . . . . . . . . . . . . . . . . . . . . . . . . 24610.3.1 Running the workload using the CTG for z/OS. . . . . . . . . . . . . . . . . . . . . . . . . 24710.3.2 Running the workload using the distributed CTG . . . . . . . . . . . . . . . . . . . . . . . 252
10.4 Conclusion . . . . . . . . . . . . . . . . . . . . . . . . . . . . . . . . . . . . . . . . . . . . . . . . . . . . . . . . 256
Chapter 11. CICS Web Support and 3270 Bridge . . . . . . . . . . . . . . . . . . . . . . . . . . . . . 25711.1 CICS Web Support overview . . . . . . . . . . . . . . . . . . . . . . . . . . . . . . . . . . . . . . . . . . 25811.2 Scenario description . . . . . . . . . . . . . . . . . . . . . . . . . . . . . . . . . . . . . . . . . . . . . . . . . 25811.3 Scenario run . . . . . . . . . . . . . . . . . . . . . . . . . . . . . . . . . . . . . . . . . . . . . . . . . . . . . . . 26011.4 Tuning your CICS Web Support environment . . . . . . . . . . . . . . . . . . . . . . . . . . . . . . 263
11.4.1 Storage consumption by CWXN . . . . . . . . . . . . . . . . . . . . . . . . . . . . . . . . . . . . 26311.5 Conclusion . . . . . . . . . . . . . . . . . . . . . . . . . . . . . . . . . . . . . . . . . . . . . . . . . . . . . . . . 266
Chapter 12. Java applications in CICS . . . . . . . . . . . . . . . . . . . . . . . . . . . . . . . . . . . . . 26712.1 CICS and Java . . . . . . . . . . . . . . . . . . . . . . . . . . . . . . . . . . . . . . . . . . . . . . . . . . . . . 268
12.1.1 Java language programs in CICS . . . . . . . . . . . . . . . . . . . . . . . . . . . . . . . . . . . 26812.1.2 Stateless CORBA objects . . . . . . . . . . . . . . . . . . . . . . . . . . . . . . . . . . . . . . . . . 26812.1.3 Enterprise JavaBeans. . . . . . . . . . . . . . . . . . . . . . . . . . . . . . . . . . . . . . . . . . . . 268
12.2 Scenario description . . . . . . . . . . . . . . . . . . . . . . . . . . . . . . . . . . . . . . . . . . . . . . . . . 26912.3 Measuring JVM performance . . . . . . . . . . . . . . . . . . . . . . . . . . . . . . . . . . . . . . . . . . 271
12.3.1 Xresettable=NO . . . . . . . . . . . . . . . . . . . . . . . . . . . . . . . . . . . . . . . . . . . . . . . . 27112.3.2 Xresettable=YES. . . . . . . . . . . . . . . . . . . . . . . . . . . . . . . . . . . . . . . . . . . . . . . . 27912.3.3 Using the sharable application classpath . . . . . . . . . . . . . . . . . . . . . . . . . . . . . 281
12.4 Conclusion . . . . . . . . . . . . . . . . . . . . . . . . . . . . . . . . . . . . . . . . . . . . . . . . . . . . . . . . 283
Chapter 13. Enterprise JavaBeans in CICS . . . . . . . . . . . . . . . . . . . . . . . . . . . . . . . . . 28513.1 CICS logical EJB server configuration . . . . . . . . . . . . . . . . . . . . . . . . . . . . . . . . . . . 28613.2 Single thread enterprise bean scenario . . . . . . . . . . . . . . . . . . . . . . . . . . . . . . . . . . 287
13.2.1 CICS TS V2.2 JDBC/SQLJ support . . . . . . . . . . . . . . . . . . . . . . . . . . . . . . . . . 28713.2.2 Initiating transaction workload. . . . . . . . . . . . . . . . . . . . . . . . . . . . . . . . . . . . . . 287
13.3 Multithread enterprise bean scenario . . . . . . . . . . . . . . . . . . . . . . . . . . . . . . . . . . . . 30013.3.1 Workload generation. . . . . . . . . . . . . . . . . . . . . . . . . . . . . . . . . . . . . . . . . . . . . 30013.3.2 Objectives . . . . . . . . . . . . . . . . . . . . . . . . . . . . . . . . . . . . . . . . . . . . . . . . . . . . . 30213.3.3 Running the SQLJ workload . . . . . . . . . . . . . . . . . . . . . . . . . . . . . . . . . . . . . . . 30213.3.4 Running the JDBC workload. . . . . . . . . . . . . . . . . . . . . . . . . . . . . . . . . . . . . . . 30513.3.5 Running the JCICS (VSAM) workload . . . . . . . . . . . . . . . . . . . . . . . . . . . . . . . 307
13.4 Conclusion . . . . . . . . . . . . . . . . . . . . . . . . . . . . . . . . . . . . . . . . . . . . . . . . . . . . . . . . 310
Chapter 14. Application Naming support . . . . . . . . . . . . . . . . . . . . . . . . . . . . . . . . . . . 31114.1 Implementing Application Naming support . . . . . . . . . . . . . . . . . . . . . . . . . . . . . . . . 31214.2 Application Naming sample. . . . . . . . . . . . . . . . . . . . . . . . . . . . . . . . . . . . . . . . . . . . 312
14.2.1 Sample program . . . . . . . . . . . . . . . . . . . . . . . . . . . . . . . . . . . . . . . . . . . . . . . . 31214.2.2 Monitoring control table . . . . . . . . . . . . . . . . . . . . . . . . . . . . . . . . . . . . . . . . . . 31414.2.3 Program run results using the Performance List report . . . . . . . . . . . . . . . . . . 315
Contents vii
Chapter 15. CALL and LINK performance. . . . . . . . . . . . . . . . . . . . . . . . . . . . . . . . . . . 31915.1 Performance testing . . . . . . . . . . . . . . . . . . . . . . . . . . . . . . . . . . . . . . . . . . . . . . . . . 320
15.1.1 What is CBLPSHPOP? . . . . . . . . . . . . . . . . . . . . . . . . . . . . . . . . . . . . . . . . . . . 32015.1.2 CLER transaction . . . . . . . . . . . . . . . . . . . . . . . . . . . . . . . . . . . . . . . . . . . . . . . 32015.1.3 Monitoring control table. . . . . . . . . . . . . . . . . . . . . . . . . . . . . . . . . . . . . . . . . . . 32115.1.4 RUWAPOOL SIT option . . . . . . . . . . . . . . . . . . . . . . . . . . . . . . . . . . . . . . . . . . 322
15.2 Scenario description . . . . . . . . . . . . . . . . . . . . . . . . . . . . . . . . . . . . . . . . . . . . . . . . . 32215.3 Measuring CALL performance . . . . . . . . . . . . . . . . . . . . . . . . . . . . . . . . . . . . . . . . . 322
15.3.1 Sample MCT . . . . . . . . . . . . . . . . . . . . . . . . . . . . . . . . . . . . . . . . . . . . . . . . . . . 32215.3.2 First run: Program description. . . . . . . . . . . . . . . . . . . . . . . . . . . . . . . . . . . . . . 32315.3.3 Executed scenario . . . . . . . . . . . . . . . . . . . . . . . . . . . . . . . . . . . . . . . . . . . . . . 32415.3.4 Performance List report generation. . . . . . . . . . . . . . . . . . . . . . . . . . . . . . . . . . 32415.3.5 Data export . . . . . . . . . . . . . . . . . . . . . . . . . . . . . . . . . . . . . . . . . . . . . . . . . . . . 33015.3.6 Second run . . . . . . . . . . . . . . . . . . . . . . . . . . . . . . . . . . . . . . . . . . . . . . . . . . . . 333
15.4 Measuring the EXEC CICS LINK command performance . . . . . . . . . . . . . . . . . . . . 33515.4.1 Program description . . . . . . . . . . . . . . . . . . . . . . . . . . . . . . . . . . . . . . . . . . . . . 33515.4.2 Executed scenario . . . . . . . . . . . . . . . . . . . . . . . . . . . . . . . . . . . . . . . . . . . . . . 33615.4.3 LINK transaction characteristics . . . . . . . . . . . . . . . . . . . . . . . . . . . . . . . . . . . . 33715.4.4 LINK performance. . . . . . . . . . . . . . . . . . . . . . . . . . . . . . . . . . . . . . . . . . . . . . . 339
15.5 Conclusion . . . . . . . . . . . . . . . . . . . . . . . . . . . . . . . . . . . . . . . . . . . . . . . . . . . . . . . . 342
Chapter 16. Exception reporting . . . . . . . . . . . . . . . . . . . . . . . . . . . . . . . . . . . . . . . . . . 34316.1 Exception Class records . . . . . . . . . . . . . . . . . . . . . . . . . . . . . . . . . . . . . . . . . . . . . . 34416.2 Performance List report showing EXWAIT field . . . . . . . . . . . . . . . . . . . . . . . . . . . . 34416.3 Exception List report . . . . . . . . . . . . . . . . . . . . . . . . . . . . . . . . . . . . . . . . . . . . . . . . . 34916.4 Exception Summary report . . . . . . . . . . . . . . . . . . . . . . . . . . . . . . . . . . . . . . . . . . . . 353
Chapter 17. Analyzing overall system performance . . . . . . . . . . . . . . . . . . . . . . . . . . 35517.1 Making a subset of CMF performance records . . . . . . . . . . . . . . . . . . . . . . . . . . . . . 35617.2 Working with different CICS system releases . . . . . . . . . . . . . . . . . . . . . . . . . . . . . . 358
17.2.1 Dictionary record does not contain requested field . . . . . . . . . . . . . . . . . . . . . . 35917.2.2 Dictionary record contains requested field . . . . . . . . . . . . . . . . . . . . . . . . . . . . 360
17.3 Looking at overall system performance . . . . . . . . . . . . . . . . . . . . . . . . . . . . . . . . . . 36117.3.1 Performance Totals report . . . . . . . . . . . . . . . . . . . . . . . . . . . . . . . . . . . . . . . . 36217.3.2 Performance Summary report. . . . . . . . . . . . . . . . . . . . . . . . . . . . . . . . . . . . . . 36617.3.3 Performance List Extended report . . . . . . . . . . . . . . . . . . . . . . . . . . . . . . . . . . 37317.3.4 Cross-System Work report . . . . . . . . . . . . . . . . . . . . . . . . . . . . . . . . . . . . . . . . 37517.3.5 MVS Workload Activity report . . . . . . . . . . . . . . . . . . . . . . . . . . . . . . . . . . . . . . 37817.3.6 Using DB2. . . . . . . . . . . . . . . . . . . . . . . . . . . . . . . . . . . . . . . . . . . . . . . . . . . . . 381
Chapter 18. Using CICS Performance Analyzer reports for problem determination 38518.1 CICS VSAM problem determination scenario description. . . . . . . . . . . . . . . . . . . . . 386
18.1.1 Workload generation. . . . . . . . . . . . . . . . . . . . . . . . . . . . . . . . . . . . . . . . . . . . . 38618.1.2 Performance objectives . . . . . . . . . . . . . . . . . . . . . . . . . . . . . . . . . . . . . . . . . . 387
18.2 Running the scenario . . . . . . . . . . . . . . . . . . . . . . . . . . . . . . . . . . . . . . . . . . . . . . . . 38718.2.1 Collecting SMF data . . . . . . . . . . . . . . . . . . . . . . . . . . . . . . . . . . . . . . . . . . . . . 38818.2.2 Updating system definitions . . . . . . . . . . . . . . . . . . . . . . . . . . . . . . . . . . . . . . . 388
18.3 Producing the baseline Performance Summary report . . . . . . . . . . . . . . . . . . . . . . . 39018.3.1 Creating the Object List . . . . . . . . . . . . . . . . . . . . . . . . . . . . . . . . . . . . . . . . . . 39118.3.2 Creating the Report Set . . . . . . . . . . . . . . . . . . . . . . . . . . . . . . . . . . . . . . . . . . 39118.3.3 Creating the Performance Summary report . . . . . . . . . . . . . . . . . . . . . . . . . . . 39218.3.4 Submitting the batch job . . . . . . . . . . . . . . . . . . . . . . . . . . . . . . . . . . . . . . . . . . 394
18.4 Application changes implemented . . . . . . . . . . . . . . . . . . . . . . . . . . . . . . . . . . . . . . 39618.5 Producing the Wait Analysis report . . . . . . . . . . . . . . . . . . . . . . . . . . . . . . . . . . . . . . 398
viii CICS Performance Analyzer

18.6 Producing the Cross-System Work report. . . . . . . . . . . . . . . . . . . . . . . . . . . . . . . . . 40318.7 Producing the File Usage detailed list report . . . . . . . . . . . . . . . . . . . . . . . . . . . . . . 40618.8 The second CSMI mirror task . . . . . . . . . . . . . . . . . . . . . . . . . . . . . . . . . . . . . . . . . . 40918.9 Options to improve transaction BR1 performance . . . . . . . . . . . . . . . . . . . . . . . . . . 411
18.9.1 Define the VENDORX file as a CICS Maintained Data Table. . . . . . . . . . . . . . 41118.9.2 Define the VENDORX file locally . . . . . . . . . . . . . . . . . . . . . . . . . . . . . . . . . . . 412
18.10 Future problem determination efforts . . . . . . . . . . . . . . . . . . . . . . . . . . . . . . . . . . . 41218.11 Conclusion . . . . . . . . . . . . . . . . . . . . . . . . . . . . . . . . . . . . . . . . . . . . . . . . . . . . . . . 413
Chapter 19. Historical Database . . . . . . . . . . . . . . . . . . . . . . . . . . . . . . . . . . . . . . . . . . 41519.1 Introduction to the HDB. . . . . . . . . . . . . . . . . . . . . . . . . . . . . . . . . . . . . . . . . . . . . . . 41619.2 System setup and scenario overview . . . . . . . . . . . . . . . . . . . . . . . . . . . . . . . . . . . . 41619.3 CICS changes . . . . . . . . . . . . . . . . . . . . . . . . . . . . . . . . . . . . . . . . . . . . . . . . . . . . . . 41719.4 Using the HDB . . . . . . . . . . . . . . . . . . . . . . . . . . . . . . . . . . . . . . . . . . . . . . . . . . . . . 418
19.4.1 Summary HDB . . . . . . . . . . . . . . . . . . . . . . . . . . . . . . . . . . . . . . . . . . . . . . . . . 41819.4.2 List HDB . . . . . . . . . . . . . . . . . . . . . . . . . . . . . . . . . . . . . . . . . . . . . . . . . . . . . . 43719.4.3 HDB maintenance. . . . . . . . . . . . . . . . . . . . . . . . . . . . . . . . . . . . . . . . . . . . . . . 43719.4.4 HDB housekeeping . . . . . . . . . . . . . . . . . . . . . . . . . . . . . . . . . . . . . . . . . . . . . . 43919.4.5 Export HDB data sets to DB2 . . . . . . . . . . . . . . . . . . . . . . . . . . . . . . . . . . . . . . 441
19.5 Conclusion . . . . . . . . . . . . . . . . . . . . . . . . . . . . . . . . . . . . . . . . . . . . . . . . . . . . . . . . 451
Abbreviations and acronyms . . . . . . . . . . . . . . . . . . . . . . . . . . . . . . . . . . . . . . . . . . . . . 453
Related publications . . . . . . . . . . . . . . . . . . . . . . . . . . . . . . . . . . . . . . . . . . . . . . . . . . . . 455IBM Redbooks . . . . . . . . . . . . . . . . . . . . . . . . . . . . . . . . . . . . . . . . . . . . . . . . . . . . . . . . . . 455Other publications . . . . . . . . . . . . . . . . . . . . . . . . . . . . . . . . . . . . . . . . . . . . . . . . . . . . . . . 455Online resources . . . . . . . . . . . . . . . . . . . . . . . . . . . . . . . . . . . . . . . . . . . . . . . . . . . . . . . . 456How to get IBM Redbooks . . . . . . . . . . . . . . . . . . . . . . . . . . . . . . . . . . . . . . . . . . . . . . . . . 456Help from IBM . . . . . . . . . . . . . . . . . . . . . . . . . . . . . . . . . . . . . . . . . . . . . . . . . . . . . . . . . . 456
Index . . . . . . . . . . . . . . . . . . . . . . . . . . . . . . . . . . . . . . . . . . . . . . . . . . . . . . . . . . . . . . . . . 457
Contents ix

x CICS Performance Analyzer

Notices
This information was developed for products and services offered in the U.S.A.
IBM may not offer the products, services, or features discussed in this document in other countries. Consult your local IBM representative for information on the products and services currently available in your area. Any reference to an IBM product, program, or service is not intended to state or imply that only that IBM product, program, or service may be used. Any functionally equivalent product, program, or service that does not infringe any IBM intellectual property right may be used instead. However, it is the user's responsibility to evaluate and verify the operation of any non-IBM product, program, or service.
IBM may have patents or pending patent applications covering subject matter described in this document. The furnishing of this document does not give you any license to these patents. You can send license inquiries, in writing, to: IBM Director of Licensing, IBM Corporation, North Castle Drive, Armonk, NY 10504-1785 U.S.A.
The following paragraph does not apply to the United Kingdom or any other country where such provisions are inconsistent with local law: INTERNATIONAL BUSINESS MACHINES CORPORATION PROVIDES THIS PUBLICATION "AS IS" WITHOUT WARRANTY OF ANY KIND, EITHER EXPRESS OR IMPLIED, INCLUDING, BUT NOT LIMITED TO, THE IMPLIED WARRANTIES OF NON-INFRINGEMENT, MERCHANTABILITY OR FITNESS FOR A PARTICULAR PURPOSE. Some states do not allow disclaimer of express or implied warranties in certain transactions, therefore, this statement may not apply to you.
This information could include technical inaccuracies or typographical errors. Changes are periodically made to the information herein; these changes will be incorporated in new editions of the publication. IBM may make improvements and/or changes in the product(s) and/or the program(s) described in this publication at any time without notice.
Any references in this information to non-IBM Web sites are provided for convenience only and do not in any manner serve as an endorsement of those Web sites. The materials at those Web sites are not part of the materials for this IBM product and use of those Web sites is at your own risk.
IBM may use or distribute any of the information you supply in any way it believes appropriate without incurring any obligation to you.
Information concerning non-IBM products was obtained from the suppliers of those products, their published announcements or other publicly available sources. IBM has not tested those products and cannot confirm the accuracy of performance, compatibility or any other claims related to non-IBM products. Questions on the capabilities of non-IBM products should be addressed to the suppliers of those products.
This information contains examples of data and reports used in daily business operations. To illustrate them as completely as possible, the examples include the names of individuals, companies, brands, and products. All of these names are fictitious and any similarity to the names and addresses used by an actual business enterprise is entirely coincidental.
COPYRIGHT LICENSE:
This information contains sample application programs in source language, which illustrate programming techniques on various operating platforms. You may copy, modify, and distribute these sample programs in any form without payment to IBM, for the purposes of developing, using, marketing or distributing application programs conforming to the application programming interface for the operating platform for which the sample programs are written. These examples have not been thoroughly tested under all conditions. IBM, therefore, cannot guarantee or imply reliability, serviceability, or function of these programs.
© Copyright IBM Corp. 2003. All rights reserved. xi
Trademarks
IBM, the IBM logo, and ibm.com are trademarks or registered trademarks of International Business Machines Corporation in the United States, other countries, or both. These and other IBM trademarked terms are marked on their first occurrence in this information with the appropriate symbol (® or ™), indicating US registered or common law trademarks owned by IBM at the time this information was published. Such trademarks may also be registered or common law trademarks in other countries. A current list of IBM trademarks is available on the Web at http://www.ibm.com/legal/copytrade.shtml
The following terms are trademarks of the International Business Machines Corporation in the United States, other countries, or both:
1-2-3®AIX®AnyNet®CICSPlex®CICS®DB2®IBM®IMS™iSeries®
Language Environment®Lotus®MQSeries®MVS™OS/390®Parallel Sysplex®RACF®Redbooks®Redpaper™
Redbooks (logo) ®Resource Measurement Facility™RMF™S/390®Tivoli®VTAM®WebSphere®z/OS®zSeries®
The following terms are trademarks of other companies:
Java, and all Java-based trademarks are trademarks of Sun Microsystems, Inc. in the United States, other countries, or both.
Microsoft, Windows NT, Windows, and the Windows logo are trademarks of Microsoft Corporation in the United States, other countries, or both.
Linux is a trademark of Linus Torvalds in the United States, other countries, or both.
Other company, product, or service names may be trademarks or service marks of others.
xii CICS Performance Analyzer

Preface
This IBM® Redbooks® publication targets CICS® Transaction Server V1.3 and V2.2 customers who plan to implement IBM CICS Performance Analyzer. With this tool, you can produce a wide range of reports and extracts to help you tune and manage CICS systems.
The first part of this book begins with an overview of CICS-provided tools and utilities that help you gather and analyze performance data. Then it introduces the CICS Performance Analyzer product and its various report generating options. It also shows you how to import the extracted performance data into spreadsheets for further analysis.
The second part of this book takes you through a series of scenarios that cover major CICS components and interfaces. These include CICS-VSAM interface, CICS-DB2 Attachment Facility, CICS use of the MVS™ System Logger, Java™ applications in CICS, and others. For each scenario, you see how you can extract the relevant performance data using CICS Performance Analyzer. You can then use this data to improve the overall system performance or to compare different execution options at run time.
This Redbooks publication explores the new functionality of CICS PA Release 1.3, including IBM WebSphere® MQ and how CICS PA now handles System Management Facility (SMF) 116 records. It looks at the new CICS Monitoring Facility (CMF) reports such as the Wait Analysis and Temporary Storage Usage reports. It aslo explains the Historical Database (HDB) facility for maintaining a history of CMF performance data for longer term reporting or exporting to DB2®.
The team who wrote this bookThis Redbooks publication was produced by a team of specialists from around the world working at the International Technical Support Organization (ITSO), Poughkeepsie Center.
Chris Rayns is an IT Specialist and project leader at the ITSO, Poughkeepsie Center in New York. Specializing in security, Chris writes extensively on all areas of S/390® security. Before joining the ITSO, he worked in IBM Global Services in the United Kingdom (UK) as a CICS IT Specialist.
Shirley Collins is a Technical Writer with Fundi Software in Perth, Western Australia. She is a member of the development team for CICS Performance Analyzer, IMS™ Performance Analyzer, and IMS Problem Investigator. Prior to this position, she was with IBM Australia after starting out as a programmer/analyst on financial systems. She holds degrees in mathematics and education.
Eugene Deborin is a Consulting Information Technology Specialist at the ITSO, Poughkeepsie Center. He writes extensively and teaches IBM classes worldwide about all areas of transaction and message processing. Eugene has been working for IBM Israel since 1984, first as a systems engineer and, more recently, as a software technical sales specialist. He joined the ITSO San Jose Center in 1997 as a CICS Transaction Server Specialist and is now a CICS and WebSphere MQ project leader at the ITSO, Raleigh Center in North Carolina.
Note: This book is based on the Redbooks publication IBM Tools: CICS Performance Analyzer V1.2, SG24-6882.
© Copyright IBM Corp. 2003. All rights reserved. xiii

Peter Klein is a CICS Team Leader at the IBM Germany Customer Support Center. He has 18 years of experience working as a technical support specialist with IBM software products. His expertise includes WebSphere MQ, CICSPlex® System Manager, and distributed transaction systems. Peter has contributed to several other Redbooks publications and ITSO projects sponsored by IBM Learning Services.
Greg Todaro is an IBM Software Engineer with the CICS/390 Level 2 support group in Raleigh, North Carolina. Greg began working with CICS in 1985 as a programmer/analyst. Then, he moved quickly into MVS and CICS systems programming for the insurance, banking, and manufacturing sectors. He has been with IBM since 1998.
Mark Todd is a Software Engineer from IBM Hursley, England. He has been on the CICS/390 Change Team, and with IBM, for five years. He also has 13 years of experience in working as a systems programmer, for IBM software products, in the manufacturing and financial sectors.
Norbert Verbestel is an Information Technology Specialist at the IBM Belgium Support Center. His areas of responsibility include second-level support, customer service, and education. He has been with IBM for 28 years, spending 21 of those years working with the CICS product. His other areas of expertise are DB2 and CICSPlex System Manager. Norbert has contributed to several other Redbooks publications and ITSO projects sponsored by IBM Learning Services.
Thanks to the following people for their contributions to this project:
Jim GrauelIBM US, CICS Level 2 Support
Paola BariRichard ConwayRobert HaimowitzIBM ITSO, Poughkeepsie Center
Bart SteegmansIBM ITSO, San Jose Center
Chris BakerPhil WakelinIBM UK, Hursley Laboratories
John HancyFundi Software, Australia
Become a published authorJoin us for a two- to six-week residency program! Help write an IBM Redbook dealing with specific products or solutions while getting hands-on experience with leading-edge technologies. You'll team with IBM technical professionals, Business Partners and/or customers.
Your efforts will help increase product acceptance and customer satisfaction. As a bonus, you'll develop a network of contacts in IBM development labs, and increase your productivity and marketability.
Find out more about the residency program, browse the residency index, and apply online at:
ibm.com/redbooks/residencies.html
xiv CICS Performance Analyzer

Comments welcomeYour comments are important to us!
We want our Redbooks to be as helpful as possible. Send us your comments about this or other Redbooks in one of the following ways:
� Use the online Contact us review Redbooks form found at:
ibm.com/redbooks
� Send your comments in an email to:
� Mail your comments to:
IBM Corporation, International Technical Support OrganizationDept. HYJ Mail Station P0992455 South RoadPoughkeepsie, NY 12601-5400
Preface xv

xvi CICS Performance Analyzer

Part 1 CICS Performance Analyzer overview
Part 1 offers a theoretical look at CICS Performance Analyzer. It introduces the CICS Performance Analyzer product, a component of the IBM CICS Tools family. It explains how CICS reports performance information. Then it takes you through the main CICS Performance Analyzer menus and options. This part presents an overview of performance reports and extracts that CICS Performance Analyzer can generate. It also shows how you can process extracts using a variety of tools.
Part 2 presents a practical look at CICS Performance Analyzer. It takes you through actual scenarios. It shows you how to run CICS Performance Analyzer reports and extracts to analyze system performance. Part 2 also discusses the CICS Performance Analyzer Historical Database (HDB).
Part 1
© Copyright IBM Corp. 2003. All rights reserved. 1

2 CICS Performance Analyzer

Chapter 1. CICS performance management
This chapter discusses the basics of CICS performance monitoring and tuning methodology. It introduces two complementary CICS performance tools to help you analyze and improve the performance of your CICS systems:
� CICS Performance Analyzer (CICS PA)� CICS Performance Monitor (CICS PM)
It also mentions the following CICS tools:
� CICS Online Transmission Time Optimizer� CICS Interdependency Analyzer� CICS Business Event Publisher for MQSeries®� IBM Session Manager for z/OS®� CICS VSAM Recovery
This chapter describes the tools that CICS itself provides to help you gather data that serves as input to CICS Performance Analyzer. Plus it describes CICS statistics processing and monitoring utilities that you may find useful to use in conjunction with CICS Performance Analyzer.
1
© Copyright IBM Corp. 2003. All rights reserved. 3

1.1 How to approach CICS performance monitoring and tuningCICS performance management is the process of continuously monitoring, analyzing, and improving the behavior of your system so that you meet the service levels that you are committed to. Good performance is the achievement of the agreed service levels. It means that system throughput, system availability, and response times meet user’s expectations using resources within the budget.
There are several basic steps in tuning a system, some of which may be iterative:
1. Set up performance objectives.
Performance objectives often consist of a list of transactions and expected response times for each. Ideally, through them, good performance can be easily recognized. Therefore, they must be:
– Practically measurable– Based on a realistic workload– Within the budget
The performance objectives must be agreed upon and regularly reviewed with the users.
2. Decide on measurement criteria.
Performance objectives may be defined in such terms as:
– Desired or acceptable response times, such within which 80% of all responses occur– Average or peak number of transactions through the system– System availability, including mean time to failure and downtime after failure
3. Gather the performance data of your production system.
CICS provides a variety of tools that help you gather performance data for online monitoring or statistical analysis.
4. Analyze this performance data.
Use the online performance monitoring and the offline performance reporting tools and apply the methodology described in Part 3 of CICS Transaction Server for z/OS CICS Performance Guide, SC34-6009.
5. Adjust the system as necessary.
6. Continue to monitor the performance of the system and anticipate future constraints.
1.2 CICS toolsIn recent years, in response to customer requirements, IBM has developed an extensive portfolio of tools for use by customers running CICS Transaction Server on OS/390® or z/OS. Currently, the CICS tools portfolio includes:
� CICS Performance Analyzer� CICS Performance Monitor� CICS Online Transmission Time Optimizer� CICS Interdependency Analyzer� CICS Business Event Publisher for MQSeries� IBM Session Manager for z/OS� CICS VSAM Recovery
4 CICS Performance Analyzer

These tools complement the comprehensive range of IBM Eserver zSeries® tools:
� Data Management Tools (for example, IBM DB2 Performance Monitor for OS/390, IBM DB2 SQL Performance Analyzer for OS/390)
� Application Development Tools (for example, IBM Fault Analyzer for z/OS and OS/390, IBM File Manager for z/OS and OS/390, Debug Tool for z/OS and OS/390)
� System Management and other tools (for example, CICS VSAM Recovery)
Together with these other tools from IBM, CICS tools provide customers with an opportunity to significantly reduce the total cost of ownership of their z/OS and OS/390 systems.
1.2.1 CICS Performance AnalyzerCICS PA is a reporting tool that provides information about the performance of your CICS systems and applications. It helps you tune, manage, and plan your CICS systems in an efficient way.
CICS PA provides a Historical Database (HDB) facility to help you manage the performance data for your CICS transactions.
CICS PA provides reports and extracts using the data that is normally collected by your system in system management facility (SMF) data sets:
� CICS Monitoring Facility (CMF) performance, exception, and transaction resource class records (type 110)
� DB2 accounting records (type 101)
� WebSphere MQ accounting records (type 116)
� System Logger records (type 88)
CICS PA is designed to complement the CICS-supplied utilities and sample programs, such as DFH$MOLS, DFHSTUP, and DFH0STAT.
CICS PA can help:
� System programmers to track overall CICS performance and evaluate the results of their system tuning efforts
� Application programmers to analyze the performance of their applications and the resources they use
� Database administrators to analyze the usage and performance of database systems such as IMS and DB2
� MQ administrators to analyze the usage and performance of their WebSphere MQ messaging systems
� Managers to ensure that their service-level agreement objectives are met and measure trends to help plan future requirements
CICS PA reports all aspects of CICS system activity and resource usage, including:
� Transaction response time and resource usage
� CICS system resource usage
� Cross-system performance, including multiregion operation (MRO) and advanced program-to-program communication (APPC)
� Business Transaction Services (BTS)
� CICS Web Support (CWS)
Chapter 1. CICS performance management 5

� External subsystems, including DB2, IMS, and WebSphere MQ
� System Logger performance
� Exception events that cause performance degradation
CICS PA provides both an ISPF screen and a command interface. You can use either to request your reports and extracts.
1.2.2 CICS Performance MonitorCICS PM is an online monitoring tool that provides real-time performance management, monitoring, and troubleshooting solutions for CICS Transaction Server (TS). It allows you to detect performance problems early, identify the cause, and change system and resource parameters to avoid problems. CICS PM uses the CICSPlex System Manager (SM) Web User Interface (WUI) server component of CICS TS.
CICS PM complements CICS PA for online analysis. The product is based on a standard application programming interface (API). It is built on facilities of CICSPlex SM, which is an integral part of CICS TS. The underlying CICSPlex SM infrastructure is transparent to the CICS PM user, so little knowledge of CICSPlex SM is necessary to operate CICS PM.
CICS PM consists of two components:
� CICS PM workstation client: You download this component to a Windows® workstation. It provides a graphical user interface (GUI) that displays data provided by a supporting application of CICS PM installed in CICS TS. The client GUI consists of three components:
– Threshold definitional component: Allows the user to create and maintain threshold definitions.
– Monitoring component: Provides the ability to monitor the status of multiple CICS regions. When a threshold is triggered, an event is created. Information about multiple events is aggregated into an event view for rapid problem identification. Navigation to the CICS PM view sets facilitates problem resolution by providing more detailed information.
– History definitional and reporting component: Allows the user to create and maintain history definitions for completed task history. The status of installed history definitions can also be monitored. The reporting component launches Web-based views of completed task history data.
� CICS PM server: This component provides a comprehensive series of view sets specifically tailored for performance analysis and problem determination. These view sets provide real-time access to all CICS systems and resource-related performance data. They also provide access to all the task-level performance data collected by the CMF.
The CICS system-level view sets include:
– CICS region– CICS storage (dynamic storage area (DSA) and subpool usage)– Transaction manager– CICS dispatcher– Loader– Temporary storage– Transient data– DB2 connection– Recovery manager, including unit of work (UOW) analysis– Enqueue pools
6 CICS Performance Analyzer

– JVM pool– Global and task-related user exits
The view sets provide access to all resources defined to the CICS systems, including:
– Transactions– Transaction classes– Programs– Files, data tables, and local shared resource (LSR) pools– Connections– Log streams– Journals– Temporary storage queues– Transient data queues– Terminals– DB2 entries– System and transaction dumps– Enterprise Java resources
Other view sets are provided, giving access to the performance information about all the active and optionally recently completed tasks in the CICS systems.
1.2.3 Benefits of CICS Performance Analyzer and CICS Performance MonitorThis section summarizes the benefits provided by both CICS performance tools.
The benefits provided by CICS PA are:
� Ease of use (no additional setup or customization required)
� Easily customizable performance reports
� Detailed and summary reports on all aspects of CICS system activity and resource usage
� Extracts for graphing and analysis by external programs, such as DB2 or PC tools (for example, Lotus® 1-2-3®)
� Historical Database repository for CMF performance class data
� CICS PA can help to:
– Analyze CICS application performance– Improve CICS resource usage– Evaluate the effects of CICS system tuning efforts– Improve transaction response time– Provide ongoing system management and measurement reports– Increase availability of resources– Increase the productivity of system and application programmers– Provide awareness of usage trends, assisting with future growth estimates
The benefits provided by CICS PM are:
� Improved CICS systems availability� Reduced system management costs� Ability to detect performance problems early� Enablement of changes to key system and resource parameters� Enablement of online interactive access to performance data of recently completed tasks� Easy-to-use comprehensive interface for exception management� Built on standard APIs and proven CICS TS system management technologies� Ease of installation and setup
Chapter 1. CICS performance management 7

The two products, CICS PA and CICS PM, complement each other. Table 1-1 provides a functional comparison between the two products.
Table 1-1 CICS PA and CICS PM comparison
1.2.4 CICS Online Transmission Time OptimizerCICS Online Transmission Time Optimizer for z/OS (CICS OTTO) is a run-time tool that optimizes:
� Data streams directed to 3270-type display stations, printers, or both� Data streams directed to SCS-type printers� Data streams directed to banking terminals 3600/4700
The supported CICS releases are:
� CICS Transaction Server for z/OS, Version 2.1 and 2.2� CICS Transaction Server for OS/390, Version 1
1.2.5 CICS Interdependency AnalyzerCICS Interdependency Analyzer for z/OS and OS/390 (CICS IA) is a run-time tool that:
� Analyzes resource interdependencies
– What a CICS region has in it– What resources a transaction needs to run– Which programs use which resources– What resources are no longer used
� Writes report data to a DB2 database
The supported CICS releases are:
� CICS Transaction Server for z/OS, Version 2.1 and 2.2� CICS Transaction Server for OS/390, Version 1
1.2.6 CICS Business Event Publisher for MQSeriesCICS Business Event Publisher for MQSeries (CBEP) enables a rapid extension of existing applications running in CICS Transaction Server V1.3 or CICS Transaction Server V2.2. CBEP generates user-defined MQSeries messages as a side effect when certain EXEC CICS commands are executed by a CICS application. Message generation is transparent to
Function CICS PA CICS PM
Invocation Offline Online
Mode Passive Active
Input origin/output destination 3270/reports Windows workstation
Output format Tabular, graphical, extracts GUI
Information source SMF CICSPlex SM
History As far back as you keep SMF data, or maintained in CICS PA HDB
Recent
Deals with Exceptions, performance, transaction resource usage history
Alerts
Additional usage Capacity planning Status monitoring
8 CICS Performance Analyzer

the application program. CICS Business Event Publisher for MQSeries supports the following functions:
� Enables customizable MQSeries messages and queues based on rules � Provides real-time data propagation � Offers external logging or notification of CICS-related activity � Enables non-CICS functions to act as write-only data repositories
1.2.7 IBM Session Manager for z/OSIBM Session Manager for z/OS provides IBM Virtual Telecommunications Access Method (VTAM®) and Transmission Control Protocol/Internet Protocol (TCP/IP) users a secure and user-friendly way to access multiple IBM OS/390 and IBM z/OS systems from a single 3270 terminal. With a highly secure, single sign-on capability, users can access all your business applications from multiple concurrent, virtual sessions. Session Manager supports the following functions:
� Enables a common user interface for all TCP/IP and VTAM applications
� Eliminates redundant and time-consuming logon and logoff activities and application switching
� Uses a single network connection to establish multiple concurrent sessions
� Allows you to easily and efficiently manage multiple sessions and different types of user groups
Session Manager for z/OS can help you:
� Reduce training costs
Point-and-click ease means users don’t have to learn an entirely new skill set.
� Enhance system usage � Increase security � Reduce the cost and effort associated with network administration� Provide access to mainframe applications from distributed or workstation programs
1.2.8 CICS VSAM RecoveryCICS VSAM Recovery (CICSVR) recovers lost or damaged Virtual Storage Access Method (VSAM) data. CICSVR is for organizations where the availability and integrity of VSAM data is vital. CICSVR provides:
� A screen interface to help assess the situation and initiate forward recovery.
� Automatic backups and log streams and log stream copies required for recovery.
� Forward recovery to recover lost or damaged VSAM data sets.
� Multiple data set recovery in a single run.
� An ISPF screen interface that complies with Common User Access (CUA)
The interface can be used to direct CICSVR to create and submit a job to restore VSAM data sets from a logical backup and perform a forward recovery.
� Automatic restore of VSAM data sets from logical backups created by DFSMShsm and DFSMSdss.
� Support of backup-while-open (BWO) data sets
This enables you to create BWO backups when a data set is open and being updated by CICS. CICSVR can restore and recover VSAM data sets from backups created by the BWO facility.
Chapter 1. CICS performance management 9

1.3 Data used by CICS Performance AnalyzerThis section discusses the types of SMF data that CICS Performance Analyzer can process.
1.3.1 CICS Monitoring Facility data (SMF 110 records)CICS monitoring collects data about the performance of all user- and CICS-supplied transactions during online processing for later offline analysis. The records produced by CICS monitoring are MVS System Management Facility (SMF) type 110 records. They are written to an SMF data set.
The CMF enables you to collect the following types or classes of monitoring data:
� Performance class data� Exception class data� Transaction resource class data
Controlling CICS monitoringWhen you start CICS, you switch on the monitoring facility by specifying the system initialization parameter MN=ON. MN=OFF is the default setting. You can select the classes of monitoring data that you want to be collected using the MNPER, MNEXC, and MNRES system initialization parameters. You can request the collection of any combination of performance class data, exception class data, and transaction resource class data. You can change the class settings whether the monitoring facility is ON or OFF. For details about all the system initialization parameters that control monitoring activities, see the CICS Transaction Server for z/OS CICS System Definition Guide, SC34-5988.
When CICS is running, you can control the monitoring facility dynamically. As with CICS initialization, you can switch monitoring on or off. You can also change the classes of monitoring data that are being collected. There are two ways to do this:
� Use the master terminal CEMT INQ|SET MONITOR command, which is described in CICS Transaction Server for z/OS CICS Supplied Transactions, SC34-5992.
� Use the EXEC CICS INQUIRE MONITOR and SET MONITOR commands (see the CICS Transaction Server for z/OS CICS System Programming Reference, SC34-5995).
If you activate a class of monitoring data in the middle of a run, the data for that class becomes available only for transactions that are started thereafter. You cannot change the classes of monitoring data that is collected for a transaction after it has started. It is often preferable, particularly for long-running transactions, to start all classes of monitoring data at CICS initialization.
How CICS monitoring data is passed to SMFThe various CICS monitoring class records are not written to SMF in the same way as explained here.
Performance data records are written to a performance record buffer, which is defined and controlled by CICS as the records are produced. The performance records are passed to SMF for processing:
� When the buffer is full� When the performance class of monitoring is switched off � When CICS itself quiesces
When monitoring itself is deactivated or when there is an immediate shutdown of CICS, the performance records are not written to SMF and the data is lost.
10 CICS Performance Analyzer

Exception records are passed directly to SMF when the exception condition completes. Each exception record describes one exception condition. Performance and exception records can be matched by transaction number (TRANNUM) or network unit-of-work ID (NETUOWPX and NETUOWSX).
Transaction resource data records are written to a transaction resource record buffer, which is defined and controlled by CICS, as the records are produced. The transaction resource records are passed to SMF for processing:
� When the buffer is full � When the transaction resource class of monitoring is switched off � When CICS itself becomes quiescent
When monitoring itself is deactivated or when there is an immediate shutdown of CICS, the transaction resource records are not written to SMF and the data is lost.
Performance class dataPerformance class data is detailed transaction-level information, such as the processor and elapsed time for a transaction, or the time spent waiting for input/output (I/O). At least one performance record is written for each transaction that is being monitored.
Performance class data provides detailed, resource-level data that can be used for accounting, performance analysis, and capacity planning. This data contains information relating to individual task resource usage. It is completed for each task when the task terminates.
You can enable performance class monitoring by coding MNPER=ON (together with MN=ON) as a system initialization parameter. Alternatively, you can use one of the following two commands to enable performance class monitoring dynamically:
CEMT SET MONITOR ON PERFEXEC CICS SET MONITOR STATUS(ON) PERFCLASS(PERF)
You can use this information periodically to calculate the charges applicable to different tasks. If you want to set up algorithms for charging users for resources used by them, you can use this class of data collection to update the charging information in your organization’s accounting programs. For older versions of CICS, charging primarily on exact resource usage was not recommended, because of the overhead involved in obtaining these figures.
Exception class dataException class monitoring data is information about CICS resource shortages suffered by a transaction. This data highlights possible problems in CICS system operation. It is intended to help you identify system constraints that affect the performance of your transactions. There is one exception record for each type of exception condition. The exception records are produced and written to SMF as soon as the resource shortage encountered by the transaction is resolved. Exception records are produced for each of the following resource shortages:
� Wait for storage in the CDSA� Wait for storage in the UDSA� Wait for storage in the SDSA� Wait for storage in the RDSA� Wait for storage in the ECDSA� Wait for storage in the EUDSA� Wait for storage in the ESDSA� Wait for storage in the ERDSA� Wait for auxiliary temporary storage
Chapter 1. CICS performance management 11

� Wait for auxiliary temporary storage string� Wait for auxiliary temporary storage buffer� Wait for coupling facility data tables locking (request) slot� Wait for coupling facility data tables non-locking (request) slot� Wait for file buffer� Wait for LSRPOOL string� Wait for file string
If the monitoring performance class is also recorded, the performance class record for the transaction includes the total elapsed time that the transaction was delayed by a CICS system resource shortage. This is measured by the exception class and the number of exceptions encountered by the transaction. The exception class records can be linked to the performance class records either by the transaction sequence number or by the network unit-of-work ID.
You can enable exception class monitoring by specifying the MNEXC=ON (together with MN=ON) system initialization parameter. Alternatively, you can use one of the following two commands to enable exception class monitoring dynamically:
CEMT SET MONITOR ON EXCEPTEXEC CICS SET MONITOR STATUS(ON) EXCEPTCLASS(EXCEPT)
Transaction resource class dataTransaction resource class data is a new CICS TS monitoring feature introduced by authorized program analysis report (APAR). Ensure that you apply the relevant program temporary fixes (PTFs) in Table 2-1 on page 26.
Transaction resource class data provides additional transaction-level information about individual resources accessed by a transaction. Currently, the transaction resource class covers file and temporary storage resources only. The maximum number of files and temporary storage queues monitored for each transaction is limited by the FILE and TSQUEUE parameters on the DFHMCT TYPE=INITIAL macro. The default is FILE=8 for files and TSQUEUE=4 for temporary storage queues. Therefore, you may need to assemble an monitoring control table (MCT) that specifies the FILE option, TSQUEUE option, or both options if the default values are insufficient, or if you do not want to collect transaction resource data for either files or temporary storage queues. One transaction resource record is written for each transaction that is being monitored. This happens provided that the transaction accesses at least one of the resources for which monitoring data is requested.
Performance class data also provides information about file and temporary storage queue accesses. However, this information in the performance record is given in total only for all files and all temporary storage queues. Transaction resource class data breaks down this information by individual file name and temporary storage queue name, up to the maximum number specified in the MCT. Transaction resource information is completed for each task when the task terminates.
You enable transaction resource class monitoring at startup by coding MNRES=ON (together with MN=ON) as a system initialization parameter. Alternatively, you can use one of the following two commands to enable transaction resource class monitoring dynamically:
CEMT SET MONITOR ON RESRCEEXEC CICS SET MONITOR STATUS(ON) RESRCECLASS(RESRCE)
Event monitoring pointsCICS monitoring data is collected at system-defined event monitoring points (EMPs) in the CICS code. Although you cannot relocate these monitoring points, you can choose which
12 CICS Performance Analyzer

classes of monitoring data you want to collect. For programming information about CICS monitoring, see CICS Transaction Server for z/OS CICS Customization Guide, SC34-5989.
If you want to gather more performance class data than is provided at the system-defined EMPs, you can code additional EMPs in your application programs. At these points, you can add or change up to 16384 bytes of user data in each performance record. Within this limit you can have, for each ENTRYNAME qualifier, any combination of:
� Between 0 and 256 counters� Between 0 and 256 clocks� A single 8192-byte character string
You can use these additional EMPs to count the number of times a certain event occurs, or to time the interval between two events. If the performance class was active when a transaction was started, but was not active when a user EMP was issued, the operations defined in that user EMP still execute on that transaction’s monitoring area. The DELIVER option results in a loss of data at this point, because the generated performance record cannot be output while the performance class is not active. If the performance class is not active when a transaction was started, the user EMP has no effect.
User EMPs are used in combination with the EXEC CICS MONITOR command. This command activates and deactivates them. For programming information about this command, refer to the CICS Transaction Server for z/OS CICS Application Programming Reference, SC34-5994.
Additional EMPs are provided in some IBM program products, such as database control (DBCTL). From the CICS point of view, these are like any other user-defined EMP. EMPs in user applications and in IBM program products are identified by a decimal number. The numbers 1 through 199 are available for EMPs in user applications. The numbers from 200 through 255 are for use in IBM program products. The numbers can be qualified with an entry name, so that you can use each number more than once. For example, PROGA.1, PROGB.1, and PROGC.1 identify three different EMPs because they have different entry names.
For each user-defined EMP, there must be a corresponding MCT entry, which has the same identification number and entry name as the EMP that it describes. You do not have to assign entry names and numbers to system-defined EMPs. Nor do you have to code MCT entries for them.
Here are some ideas for using the CICS and user fields provided with the CICS Monitoring Facility:
� If you want to time how long it takes to perform a table lookup routine within an application, code an EMP with, for instance ID=50, just before the table lookup routine and an EMP with ID=51 just after the routine. The system programmer codes a TYPE=EMP operand in the MCT for ID=50 to start user clock 1. You also code a TYPE=EMP operand for ID=51 to stop user clock 1. The application executes. When EMP 50 is processed, user clock 1 is started. When EMP 51 is processed, the clock is stopped.
� You can use one user field to accumulate an installation accounting unit. For example, you may count different amounts for different types of transaction. Or, in a browsing application, you may count one unit for each record scanned and not selected, and three for each record selected.
You can also treat the full word count fields as 32-bit flag fields to indicate special situations, for example, out-of-line situations in the applications, operator errors, and so on. CICS includes facilities to turn individual bits or groups of bits on or off in these counts.
� You can use the performance clocks to accumulate the time taken for I/O, DL/I scheduling, and so on. It usually includes any waiting for the transaction to regain control after the
Chapter 1. CICS performance management 13

requested operation has completed. Because the periods are counted as well as added, you can get the average time waiting for I/O as well as the total. If you want to highlight an unusually long individual case, set a flag on in a user count as explained earlier.
� A use of the performance character string is for systems in which one transaction ID is used for widely differing functions. The application can enter a subsidiary ID into the string to indicate which particular variant of the transaction applies in each case. This use of user EMPs is now catered for by the Application Naming function.
Some users have a single transaction ID so that all user input is routed through a common prologue program for security checking, for example. In this case, it is easy to record the subtransaction identifier during this prologue. However, it is equally possible to route transactions with different identifiers to the same program, in which case this technique is not necessary.
Monitoring control tableYou use the monitoring control table for the following reasons:
� To specify the type of resource for which you want to collect Transaction Resource Monitoring data (DFHMCT TYPE=INITIAL) and the maximum number of files (FILE= option) and temporary storage queues (TSQUEUE= option) for Transaction Resource Monitoring
� To enable Application Naming support, which makes available the CICS-generated DFHAPPL EMPs to your application programs (DFHMCT TYPE=INITIAL)
� To notify CICS about the EMPs that you coded in your application programs and about the data that is to be collected at these points (DFHMCT TYPE=EMP)
� To notify CICS that you do not want certain system-defined performance data to be recorded during a particular CICS run (DFHMCT TYPE=RECORD)
IMS DBCTL users can collect DBCTL statistics in the CMF performance class records by including the DFH$MCTD copy member in the MCT definition.
You can find full details about the MCT in the CICS Transaction Server for z/OS CICS Resource Definition Guide, SC34-5990. Examples of MCT coding are included with the programming information in the CICS Transaction Server for z/OS CICS Customization Guide, SC34-5989.
Four sample monitoring control tables are also provided in CICSTS22.CICS.SDFHSAMP:
� DFHMCTT$: For terminal-owning regions (TORs)� DFHMCTA$: For application-owning regions (AORs)� DFHMCTD$: For application-owning regions (AORs) with DBCTL� DFHMCTF$: For file-owning regions (FORs)
These samples show how to use the EXCLUDE and INCLUDE operands to reduce the size of the performance class record and reduce the volume of data written by CICS to SMF.
1.3.2 DB2 accounting data (SMF 101 records)DB2 accounting data is written as SMF type 101 records.
DB2 accounting traceThe DB2 accounting trace provides information related to application programs, including:
� Start and stop times � Number of commits and aborts
14 CICS Performance Analyzer

� The number of times certain SQL statements are issued � Number of buffer pool requests � Counts of certain locking events � Processor resources consumed � Thread wait times for various events � RID pool processing � Distributed processing � Resource limit facility statistics
The DB2 trace begins collecting this data at successful thread allocation to DB2. It writes a completed record when the thread terminates or when the authorization ID changes.
DB2 accounting records are produced when a thread is terminated or sign-on occurs. This means that the period reported in the DB2 accounting record is the time between start or user sign-on (if reusing a thread previously used by another user) and thread termination or another sign-on. You can use the ACCOUNTREC(TXID) parameter in the DB2ENTRY or DB2CONN to cause a DB2 accounting record to be produced when the transaction ID changes, and when the thread terminates or another sign-on occurs.
For thread reuse, this means that many users are included in the same record, which can cause difficulties for both accounting and problem determination. The ACCOUNTREC(TASK) or ACCOUNTREC(UOW) settings in a DB2ENTRY or DB2CONN provide more granularity. This is because a record is produced for each user. It involves the passing of a token between CICS and DB2, which is present in both CICS and DB2 traces.
ACCOUNTREC(TASK) ensures that there is a minimum of one accounting record for each task. There can be more depending on thread reuse.
For more information about accounting and monitoring in a CICS DB2 environment, refer to the CICS Transaction Server for z/OS CICS DB2 Guide, SC34-6014. For more information about setting up DB2 accounting, refer to the DB2 UDB for OS/390 and z/OS Administration Guide, SC26-9931.
Accounting CLASS 1 processor timeFor accounting CLASS 1, a task processor timer is created when the task control block (TCB) is attached. When a thread to DB2 starts, the timer value is saved. When the thread is terminated (or the authorization ID is changed), then the timer is checked again. Both the timer start and end values are recorded in the SMF 101 records (the DB2 accounting record).
Accounting CLASS 2 processor timeFor accounting CLASS 2, the timer is checked on every entry and exit from DB2 to record the “IN DB2” time in the SMF type 101 record. In this case, it is the difference that is stored in the record.
1.3.3 WebSphere MQ accounting data (SMF 116 records)WebSphere MQ accounting data is written as SMF type 116 records.
Accounting class 1 and class 3WebSphere MQ accounting information can be collected for three subtypes:
0 Message manager accounting records (how much of the central processing unit (CPU) was spent processing WebSphere MQ API calls and the number of MQPUT and MQGET calls)
Chapter 1. CICS performance management 15

This information is produced when a named task disconnects from WebSphere MQ. The information contained within the record may cover many hours.
1 Accounting data for each task, at thread and queue level
2 Additional queue-level accounting data (if the task uses more queues than can fit in the subtype 1 record)
Subtype 0 is produced with trace class 1. Subtypes 1 and 2 are produced with trace class 3.
MQ accounting traceYou can start the WebSphere MQ trace facility at any time by issuing the WebSphere MQ START TRACE command.
Accounting data can be lost if the accounting trace is started or stopped while applications are running. To collect accounting data successfully, the following conditions must apply:
� The accounting trace must be active when an application starts. It must still be active when the application finishes.
� If the accounting trace is stopped, any accounting data collection that was active stops.
You can also start collecting some MQ accounting data automatically if you specify YES in the SMFACCT (SMF ACCOUNTING) parameters of the CSQ6SYSP macro.
You cannot use this method to start collecting class 3 accounting information (thread-level and queue-level accounting). You must use the START TRACE command to do this. However, you can include the command in your CSQINP2 input data set so that the trace is started automatically when you start your queue manager.
For more information about setting up WebSphere MQ accounting, refer to the WebSphere MQ for z/OS System Setup Guide, SC34-6052.
1.3.4 MVS System Logger data (SMF 88 records)System Logger produces SMF record type 88 to record the System Logger activity of a single system in a sysplex. These records are written to the active SMF data set on the system.
Capacity planningFor capacity planning purposes, we recommend that you view the steady-state performance requirements of an application. Various flags in the SMF record type 88 highlight exception scenarios for additional analysis or changes in report processing.
Record type 88Record type 88 focuses on the logstream data for a system in a sysplex, including use of interim storage. Interim storage is where log data is initially written, before being written to direct access storage device (DASD) log data sets. You can quickly access data in interim storage without incurring DASD I/O. In a coupling facility log stream, interim storage for log data is in coupling facility list structures. In a DASD-only log stream, interim storage for log data is contained in local storage buffers on the system and duplexed to staging data sets. Using record type 88 can help an installation avoid the STRUCTURE FULL exception, and perform other tuning, capacity planning analysis, or both.
Given a specific log stream, a record type 88 summarizes all of that log stream's activity on that system, as long as at least one address space is connected to the log stream on that system. If no System Logger write activity is performed on the log stream during a particular
16 CICS Performance Analyzer

SMF interval, a record is produced showing zero for the various System Logger activity total fields.
The System Logger SMF record is cut for all log streams connected at the expiration of the SMF global recording interval. Record type 88 is also triggered by the disconnection of the last log stream on that system.
SMF fields relating to resource events, either structure full or staging data set full conditions, should be handled depending on:
� Whether the resource is shared sysplex-wide and each system will take action� Whether the resource is shared sysplex-wide but only one system will take action� Whether the resource is consumed on a system-local basis
To obtain a sysplex-wide view of System Logger activity, correct processing for most SMF 88 data fields is to sum the field contents for the target interval across all the SMF 88 records produced in the sysplex. There are, however, exceptions to this rule. Because each system must take its own action — that is, wait for an ENF signal indicating that System Logger is available — an analysis program should use the maximum value for these fields: SMF88ERI, SMF88ERC, and SMF88ESF. For example, if a structure rebuild is initiated in a sysplex with three systems, the event is recorded on all three systems. The correct number of structure rebuild initiations is not three, but one or the maximum number provided SMF88ERI.
For DASD-only log streams, staging data sets are a required part of the logstream configuration. For coupling facility log streams, use of staging data sets implies a trade-off between performance workload and data integrity. You should try to tune the staging data set size to minimize the number of Staging_Dataset_Threshold_Hit conditions. Without this type of tuning, such conditions can impact performance during staging data set processing. Only an installation can determine what the proper trade-off between performance and data integrity should be.
Because System Logger maintains interim storage differently for coupling facility based log stream versus DASD-only log streams, the difference is reflected in the SMF record 88 report:
� For a coupling facility based log stream, the Structure (Interim Storage) section of the record 88 report shows information about the usage of coupling facility structure space allocated for a log stream and the flow of log data through the structure.
� For a DASD-only log stream, the Structure (Interim Storage) section of the record 88 report shows information about usage of staging dataset space and the flow of data through the staging data set for the log stream.
Not all fields in the Structure (Interim Storage) section of the record 88 report apply to DASD-only log streams. For a DASD-only log stream, fields that do not apply contain zeros. The SMF88STN field contains *DASDONLY* for a DASD-only log stream because there is no structure name.
1.4 Other relevant CICS data and utilitiesOther CICS-provided tools can help you gather CICS performance data. They are not required by CICS PA, but they may assist your analysis and decision-making when using CICS PA and interpreting the output.
CICS provides two statistics utilities programs and two programs for processing CICS monitoring data written to SMF. In addition, you can use the DFHJUP utility to copy data from system SMF data sets.
Chapter 1. CICS performance management 17

1.4.1 CICS statistics CICS management modules control how events are managed by CICS. As events occur, CICS produces information that is available to you as system and resource statistics. The resources controlled by CICS include files, databases, journals, transactions, programs, and tasks. Resources that CICS manages, and values that CICS uses in its record-keeping role, are defined in one of the following ways:
� Online by the CICS CEDA transaction� Offline by the CICS system definition (CSD) utility program DFHCSDUP� Offline by CICS control table macros
Statistics are collected during CICS online processing for later offline analysis. The statistics domain writes statistics records to an SMF data set. The records are of SMF type 110, sub-type 002. Monitoring records and some journaling records are also written to the SMF data set as type 110 records. For programming information about SMF, DFHCSDUP, and about other SMF data set considerations, see the CICS Transaction Server for z/OS CICS Customization Guide, SC34-5989.
Types of statistics dataCICS produces five types of statistics:
� Interval statistics: These are gathered by CICS during a specified interval. You can change the interval value using the STATINT system initialization parameter, using CEMT SET STATISTICS, or using the EXEC CICS SET STATISTICS command.
� End-of-day statistics: These statistics are gathered on three occasions:
– At the end-of-day expiry time– When CICS becomes quiescent (normal shutdown)– When CICS terminates (immediate shutdown)
The end-of-day value defines a logical point in the 24-hour operation of CICS. You can change the end-of-day value using the STATEOD system initialization parameter, using CEMT SET STATISTICS, or using the EXEC CICS SET STATISTICS command.
� Requested statistics: These are statistics that the user requested by using one of the following three commands:
CEMT PERFORM STATISTICS RECORDEXEC CICS PERFORM STATISTICS RECORDEXEC CICS SET STATISTICS ON|OFF RECORDNOW
These commands cause the statistics to be written to the SMF data set immediately, instead of waiting for the current interval to expire. For more details about CEMT commands, see CICS Transaction Server for z/OS CICS Supplied Transactions, SC34-5992. For programming information about the equivalent EXEC CICS commands, see the CICS Transaction Server for z/OS CICS System Programming Reference, SC34-5995.
� Requested reset statistics: These statistics differ from requested statistics in that all statistics are collected and statistics counters are reset. You can reset the statistics counters using the CEMT or EXEC CICS PERFORM/SET commands.
� Unsolicited statistics: These statistics are automatically gathered by CICS for dynamically allocated and deallocated resources. CICS writes these statistics to SMF just before the resource is deleted regardless of the status of statistics recording.
18 CICS Performance Analyzer
Processing CICS statisticsYou may find it particularly useful to process the statistics records and the monitoring records together. This is because statistics provide resource and system information that is complementary to the transaction data produced by CICS monitoring.
There are several ways to process CICS statistics, including:
� Using the CICS DFHSTUP offline utility: For guidance about retrieving CICS statistics from SMF, and about running DFHSTUP, see the CICS Transaction Server for z/OS CICS Operations and Utilities Guide, SC34-5991.
� Writing your own program to report and analyze the statistics: For details about the statistics record types, see the assembler DSECTs named in each set of statistics. For programming information about the formats of CICS statistics SMF records, see the CICS Transaction Server for z/OS CICS Customization Guide, SC34-5989.
� Using the sample statistics program (DFH0STAT): You can use the statistics sample program, DFH0STAT, to produce online reports from the CICS statistics data. The program demonstrates the use of the EXEC CICS INQUIRE and EXEC CICS COLLECT STATISTICS commands to produce an analysis of a CICS system. You can use the sample program as provided or modify it to suit your needs.
� Using Tivoli® Decision Support to process CICS SMF records to produce joint reports with data from other SMF records.
1.4.2 The sample statistics program: DFH0STATThe sample statistics program, DFH0STAT, produces a report that shows comprehensive system information about CICS resources. It also shows an overview of the MVS storage in use. The program demonstrates how you can use EXEC CICS INQUIRE and EXEC CICS COLLECT STATISTICS commands to produce an analysis of your CICS regions. You can use the sample program as supplied, or modify it to suit your needs.
DFH0STAT does not report on terminals, DBCTL resources, front-end programming interface (FEPI) resources, dumps, the table manager, and the user domain. If you require statistical information about these areas, you can obtain it using DFHSTUP, the statistics utility program.
Keep in mind that DFH0STAT does not always report to the maximum capacity of certain large statistics fields. If your CICS system is unusually large or very busy, and you have a long statistics interval, check that the statistics values have not overflowed. To avoid this problem, reduce the length of your statistics interval, or use DFHSTUP.
1.4.3 Statistics utility program: DFHSTUPThe statistics utility program, DFHSTUP, prepares and prints reports offline, using the CICS statistics data recorded on the MVS system management facilities (SMF) SYS1.MANx data sets. To enable the CICS statistics domain to record interval statistics on these SMF data sets, you must specify the STATRCD=ON system initialization parameter. The other statistics record types (unsolicited, requested and end-of-day) are written regardless of the setting of the STATRCD option.
For information about the SMF data sets, see the OS/390 MVS System Management Facilities (SMF), GC28-1783. For information about what CICS data is recorded on the SMF data sets, and about interpreting CICS statistics output in the DFHSTUP report, see the CICS Transaction Server for z/OS Performance Guide, SC34-6009. For a description of the STATRCD system initialization parameter, see the CICS Transaction Server for z/OS CICS System Definition Guide, SC34-5988.
Chapter 1. CICS performance management 19

Use the version of the DFHSTUP program from the same release of CICS as the data that it is to process.
For more information about DFHSTUP, refer to CICS Transaction Server for z/OS CICS Operations and Utilities Guide, SC34-5991.
1.4.4 Monitoring dictionary utility program: DFHMNDUPDFHMNDUP is a utility program that generates a performance dictionary record, in a sequential data set, for use with monitoring data extracted from SMF data sets. When CICS monitoring is switched on, and you activate the monitoring performance class (MNPER=ON), CICS first writes a performance dictionary record to the current SMF data set. Then it begins to write the monitoring performance data records.
A new dictionary record, which always precedes the monitoring data it relates to, is written whenever you start CICS with the performance class active and CICS monitoring turned on. This record is also written when you change the status of the monitoring performance class from inactive to active, with CICS monitoring turned on. If monitoring is turned off and the monitoring performance class is switched from inactive to active, a dictionary record is scheduled from the next time monitoring is activated.
Any monitoring utility program that processes performance data must read the dictionary record that relates to the data being processed before it attempts to analyze the data. However, if SMF switches data sets during the period when CICS monitoring is writing performance data, CICS does not write a new dictionary record. Therefore a CICS performance dictionary record is not the first monitoring performance record on the new SMF data set. The DFHMNDUP program provides a solution to the problem posed by SMF data sets that do not contain a dictionary record.
The CICS PA System Definitions facility uses DFHMNDUP to create a Dictionary record on request.
1.4.5 Sample monitoring data print program: DFH$MOLSDFH$MOLS is a print program for CICS monitoring data. It is a sample program that you can modify or adapt to your own purposes. It is intended to show how you can code your own monitoring utility program to print CICS monitoring data.
The job tasks that are involved to process CICS monitoring data are:
1. Unload the SMF data set or sets so that the SMF data is available for processing by a CICS utility. For information about unloading SMF data sets, refer to OS/390 MVS System Management Facilities (SMF), GC28-1783.
2. Run the DFH$MOLS program to print monitoring records, which you can optionally select and sort by means of control statements.
The DFH$MOLS program is a data reduction program that is designed to produce reports from the data collected by the CICS monitoring domain (MN), and written to SMF data sets.
The CICS Transaction Server for z/OS, Version 2 Release 2, DFH$MOLS can process SMF 110 monitoring data records for earlier CICS Transaction Server versions and releases. However, DFH$MOLS cannot process monitoring data written by a release of CICS later than itself. Therefore, you should always use the DFH$MOLS from the highest version or release available to you.
20 CICS Performance Analyzer
You run the DFH$MOLS program in a batch region to process any CICS SMF type 110 monitoring records that are present in an unloaded SMF data set. You can write the data set to either a temporary or cataloged data set. You can determine the scope of the report or reports by supplying control statements in the SYSIN data set.
The program reads, formats, and prints the CICS monitoring data, which is packaged in the format:
[SMF HEADER ].[SMF PRODUCT SECTION ].[CICS DATA SECTION ]
The CICS data section in a monitoring record is one of the following types:
� A dictionary data section, consisting of a sequence of dictionary entries
� A performance data section, consisting of a sequence of field connectors followed by one or more performance records (monitoring record type 3)
� An exception data section, consisting of one exception record (monitoring record type 4)
� A transaction resource data section, consisting of one or more Transaction Resource Monitoring records (monitoring record type 5)
For programming information about the structure of CICS SMF type 110, and how the monitoring data is packaged within the SMF records, see the CICS Transaction Server for z/OS CICS Customization Guide, SC34-5989. The DFH$MOLS program reads the SMF data and formats and prints it. If you want to analyze the data using your own routines, this is the point at which you can link to a user-written analysis program.
The DFH$MOLS program prints about one page per task. Therefore, be sure to specify only those items that you need using the DFH$MOLS program control statements.
Note that the DFH$MOLS program requires a performance dictionary record to process monitoring performance data. When it locates a dictionary record, it builds an in-store dictionary and processes any subsequent performance data using this dictionary. Whenever it reads a new dictionary record, the current dictionary is released and a new in-store dictionary is built. The dictionary record must appear before any related performance data. Otherwise the DFH$MOLS program abends. Note that monitoring exception records does not require a dictionary, so they can precede the first dictionary record and still be successfully processed.
1.4.6 Journal utility program: DFHJUPIn general, this batch utility is used to read, process, copy, or print CICS log data in MVS System Logger log streams and SMF data sets. CICS can write user journal and autojournal data to SMF data sets rather than to log streams. It is useful to copy and print this data.
1.5 Other relevant information sources There are several tools for obtaining system performance data relevant to evaluating performance of the CICS system.
1.5.1 System Management FacilitySMF collects and records system and job-related information that you can use in:
� Billing users� Reporting reliability� Analyzing your configuration
Chapter 1. CICS performance management 21

� Scheduling jobs� Summarizing DASD activity� Evaluating data set activity� Profiling system resource use� Maintaining system security
CICS PA processes the following SMF record types:
� CICS Monitoring Facility (type 110)� DB2 accounting (type 101)� WebSphere MQ accounting (type 116)� System Logger (type 88)
1.5.2 Resource Management FacilityResource Management Facility collects system-wide data that describes the processor activity (WAIT time), I/O activity (channel and device usage), main storage activity (demand and swap paging statistics), and system resources manager (SRM) activity (workload).
RMF™ is a centralized measurement tool that monitors system activity to collect performance and capacity planning data. The analysis of RMF data provides the basis for tuning the system to user requirements. You can also use it to track resource usage.
You can also use RMF workload activity reports in conjunction with the CICS PA Workload Activity report. This combination helps you to understand from a CICS perspective how well your CICS transactions are meeting their response time goals.
1.5.3 Generalized Trace FacilityCICS trace entries can be recorded through Generalized Trace Facility (GTF), and reports produced with Interactive Program Control System (IPCS). GTF is an integral part of the z/OS system and traces the events of DASD seeking addresses on start I/O instructions, SRM activity, page faults, I/O activity, and supervisor services. Execution options specify the system events to be traced.
CICS GTF data can be combined with data for other components, for example, the data about use of VTAM buffers.
GTF is generally used to monitor short periods of system activity. You should run it accordingly. No data reduction programs are provided with GTF. To extract and summarize the data into a meaningful and manageable form, you can either write a data reduction program yourself or use one of the program offerings that are available.
1.5.4 Tivoli Decision Support for OS/390This product collects and analyzes data from CICS and other IBM systems and products. With Tivoli Decision Support, you can build reports that help you manage:
� Service levels� Availability� Performance and tuning� Capacity planning� Change and problem management� Accounting
Several ready-made reports are available. In addition, you can generate your own reports to meet specific needs.
22 CICS Performance Analyzer

Chapter 2. A quick start to CICS Performance Analyzer
This chapter introduces you to using the CICS Performance Analyzer (PA) screen. It also help you to understand the CICS PA concepts. Follow along if this is your first time using CICS PA.
We start with an overview of CICS PA operation, the system requirements, our Interactive System Productivity Facility (ISPF) setup, and preparing the system management facility (SMF) data. Then we show you how to:
� Start CICS PA� Use the Take-up facility to easily define CICS systems and SMF data files to CICS PA� Maintain system definitions� Define Report Sets to request reports and extracts from our defined systems and files� Submit report requests to run in batch� View report output� Tailor reports using Report Forms� Filter the data using selection criteria and Object Lists
This chapter introduces you to only a fraction of the CICS PA functionality. However, the other reports, extracts, and functions offered by CICS PA are essentially variations or extensions of what is covered here.
The Historical Database (HDB) facility employs much of this functionality. We recommend that you first become familiar with the CICS PA facilities described in this chapter before you explore Chapter 19, “Historical Database” on page 415.
2
© Copyright IBM Corp. 2003. All rights reserved. 23
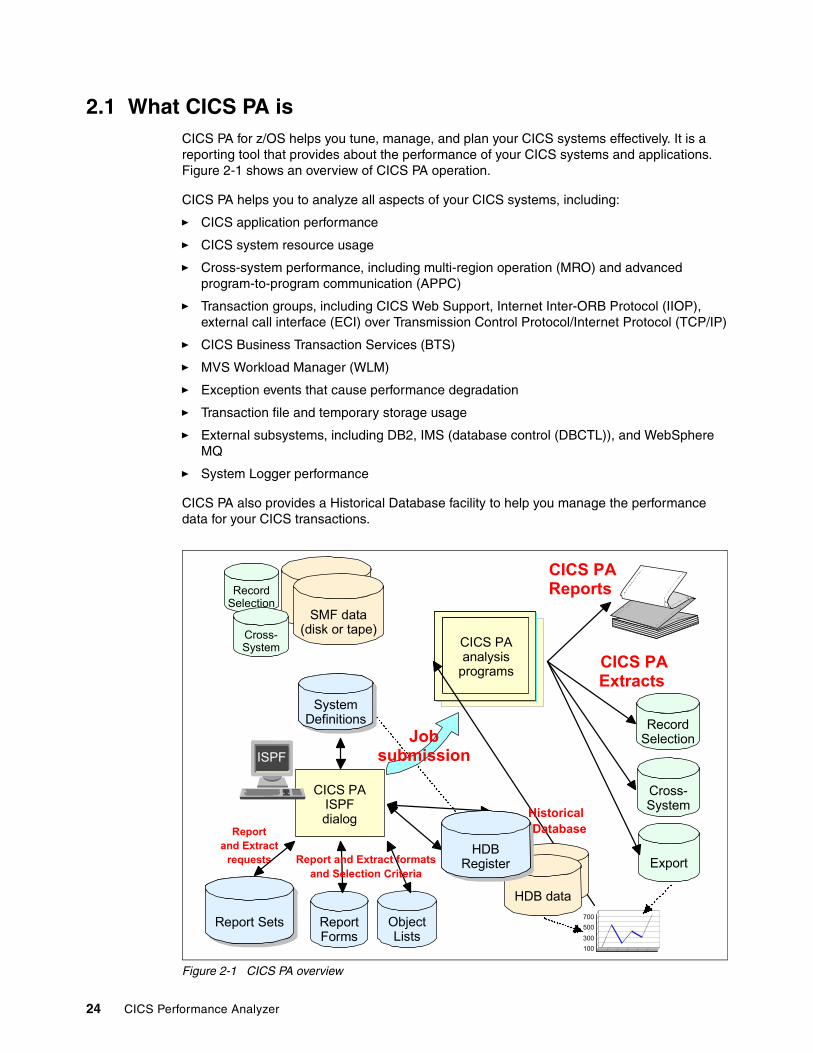
2.1 What CICS PA isCICS PA for z/OS helps you tune, manage, and plan your CICS systems effectively. It is a reporting tool that provides about the performance of your CICS systems and applications. Figure 2-1 shows an overview of CICS PA operation.
CICS PA helps you to analyze all aspects of your CICS systems, including:
� CICS application performance
� CICS system resource usage
� Cross-system performance, including multi-region operation (MRO) and advanced program-to-program communication (APPC)
� Transaction groups, including CICS Web Support, Internet Inter-ORB Protocol (IIOP), external call interface (ECI) over Transmission Control Protocol/Internet Protocol (TCP/IP)
� CICS Business Transaction Services (BTS)
� MVS Workload Manager (WLM)
� Exception events that cause performance degradation
� Transaction file and temporary storage usage
� External subsystems, including DB2, IMS (database control (DBCTL)), and WebSphere MQ
� System Logger performance
CICS PA also provides a Historical Database facility to help you manage the performance data for your CICS transactions.
Figure 2-1 CICS PA overview
Report Sets
CICS PAanalysis
programs
RecordSelection
Cross-System
Object Lists
CICS PAReports
CICS PAExtracts
Report Forms
SMF data(disk or tape)
Export
CICS PAISPFdialog
Report and Extract
requests
System Definitions
RecordSelection
Cross-System
Job submissionISPF
HDB data
HDB Register
Historical Database
100
300
500
700
Report and Extract formatsand Selection Criteria
24 CICS Performance Analyzer

CICS PA provides an ISPF-based menu-driven screen that helps you to create, maintain, and submit Report Sets for batch processing. A Report Set allows you to define a set of report and extract requests to run as a one-step job with one pass of the input data. You can define any number of Report Sets. You can also include any number of reports and extracts in a single Report Set. Plus, you can select report categories or individual reports for submission independent of the Report Set.
You can use Report Forms to tailor the format and content of reports and extracts. Specify selection criteria to filter the data on the value of particular fields. Object Lists provide a convenient way to specify lists of values under Selection Criteria.
CICS PA produces reports and extracts using data normally collected by your system in MVS SMF data sets. This includes:
� CICS Monitoring Facility (CMF) performance class, exception class, and transaction resource class data written as SMF type 110 records
� DB2 accounting data written as SMF type 101 records
� WebSphere MQ accounting data written as SMF type 116 records
� MVS System Logger data written as SMF type 88 records
The System Definitions facility allows you to define the systems, SMF data files and groups for reporting on. A Take-up facility is provided.
CICS PA can process Record Selection and Cross-System Work extract data sets in a similar way to the SMF data sets.
Export data sets contain extracts of CMF performance data that is suitable for further analysis and graphing by your favorite database or spreadsheet tools.
The HDB Register is an inventory of all information associated with the Historical Database Manager. HDBs save performance data in data sets that are managed from the screen. You can run reports on your HDB or export the HDB data to DB2 tables. Report Forms can be used to control the format and content of the reports. You can specify selection criteria to filter the data that is reported or exported.
There are two types of HDBs:
� List HDB data set: One record represents one transaction. Typically, List HDBs are used to analyze recent transaction events. Data is usually only required for a short period of time.
� Summary HDB data set: One record represents a summary of transaction activity over a user-specified time interval. Typically, Summary HDBs are used for long-term trend analysis and capacity planning. Data is retained for a longer period of time, sometimes years.
2.2 System requirementsRefer to the CICS Performance Analyzer for z/OS User’s Guide, SC34-6307, for the hardware, software, and storage requirements. In addition, there are several program temporary fixes (PTFs) that are required to support the workloads and CICS PA functions described in this book.
Chapter 2. A quick start to CICS Performance Analyzer 25

Apply the relevant PTFs in Table 2-1 to support the new CICS Transaction Server monitoring features:
� CMF Transaction resource class data for file and temporary storage queue usage� Application Naming (DFHAPPL)� CICS Resource Manager Interface (DFHRMI)
Table 2-1 PTFs to enable new monitoring features of CICS Transaction Server (TS)
Apply the PTFs in Table 2-2 for CICS Performance Analyzer.
Table 2-2 PTFs for CICS Performance Analyzer
Apply the PTFs in Table 2-3 for ISPF.
Table 2-3 PTFs for ISPF
2.3 Recommended ISPF setupThe CICS PA screen is an ISPF application that follows Common User Access (CUA) conventions. You can use ISPF standard facilities to customize the screen. This section contains some ISPF setup recommendations to help you use CICS PA efficiently.
Screen size and scrollingSet the screen size in your session parameters to 32 lines. CICS PA screens are optimized for 32 lines, but accommodate 24 lines by scrolling backward (F7) and forward (F8).
Function keysCICS PA uses standard conventions for function keys. You can use the ISPF commands KEYS and KEYLIST to assign alternative functions to the keys. For a list of the CICS PA default settings, select Help -> Keys Help in the action bar or enter KEYSHELP on the command line.
Product APAR PTF
CICS TS V2.2 PQ63143
PQ76701PQ76703
UQ68396,UQ68398,UQ68400
CICS TS V1.3 PQ63141
PQ76695PQ76698
UQ70905,UQ70908,UQ70913
Product APAR PTF
CICS PA V1.3 PQ77980PQ79058
UQ80393UQ81351
Product APAR PTF
ISPF OA04921 to be determined
26 CICS Performance Analyzer

If you are new to CICS PA, ensure that the function keys are displayed at the bottom of the screens. The ISPF command PFSHOW ON|OFF turns on and off the display of the function keys.
Prompt (F4)Input fields with a plus sign (+) to the right of the field, or to the right of the column heading, signify that Prompt is available. To use this facility, position the cursor on the input field and press Prompt (F4). A list of available values is displayed from which you can select one (then press Enter) or more (then press Exit) as appropriate.
Mouse optionsThe CICS PA Report Set panel is a tree structure of report categories and reports. The report categories act as folders that can expand (to show) and collapse (to hide) the reports contained within them. If your terminal emulation permits, configure your mouse options to activate the lightpen function. You can then use the left button of your mouse to click the plus sign (+) to expand and the minus sign (-) to collapse the report categories. Alternatively, you can enter line action S.
CUA attribute settingsThe CICS PA screen is designed to use the default CUA attributes. However, we recommend that you set the Point-and-Shoot field to easily distinguish Point-and-Shoot fields from other types of fields. You can use the ISPF CUAATTR command to change the attribute settings. As shown in Figure 2-2, we changed Point-and-Shoot to yellow (highlighted in bold). For better distinction, you can also set the highlight attribute to REVERSE (reverse video).
Figure 2-2 Recommended CUAATTR settings for CICS PA
Point-and-Shoot fieldsCICS PA employs the Point-and-Shoot field. For efficient use, enter the ISPF SETTINGS command to display the ISPF Settings screen. Then select Tab to point-and-shoot fields (highlighted in bold in Figure 2-3).
Long and short messagesCICS PA uses both long and short messages. Short messages display at the top right of the screen on the same line as the screen title. After a short message is displayed, you can press Help (F1) to display more information in a long message.
To display long messages in a pop-up window, enter the SETTINGS command and select Long message in pop-up (highlighted in bold in Figure 2-3). If it is a field in error, the pop-up window displays immediately above or below the field in error. If this option is not selected,
CUA Attribute Change Utility Command ===> ___________________________________________________ Defaults Panel Element Color Intensity Highlight More: + Choice Entry Field . . . . . . TURQ LOW USCORE List Entry Field . . . . . . . TURQ LOW USCORE List Item Description . . . . GREEN LOW NONE List Items . . . . . . . . . . WHITE LOW NONENormal Entry Field . . . . . . TURQ LOW USCORE Normal Text . . . . . . . . . GREEN LOW NONE Point-and-Shoot . . . . . . . YELLOW HIGH NONE Reference Phrase . . . . . . . WHITE HIGH NONE
Chapter 2. A quick start to CICS Performance Analyzer 27

long messages of less than the screen width display immediately above or below the command line.
Figure 2-3 Recommended ISPF settings for CICS PA
2.4 Preparing the SMF data for CICS PACICS PA processes non-active SMF data sets. There is no special preparation required for CICS PA other than to dump the active SMF data sets at an appropriate time.
CICS and other subsystems, such as DB2, WebSphere MQ, and the MVS System Logger, write their SMF records to the active SMF data set. In order for CICS PA to work with the inactive copy of this data, you need to perform several steps.
In a CICS region to ensure that all the current SMF data is available, you may need to flush the buffers within CICS that hold any SMF data. You can do this by turning off and on performance monitoring, using the CEMT SET MONITOR command. You only need to flush the buffers when the CICS region is not shut down.
After all the SMF data from the CICS region is on the active SMF data set, you need to dump this data to an inactive SMF data set. First you switch the recording of SMF data from one data set to another. All SMF data in storage is written out before the transfer is made. This switch is performed by issuing the /I SMF operator command. The switch of SMF data sets takes place automatically when the active SMF data set becomes full.
To dump the SMF data set, the SMF dump program (IFASMFDP) is provided. This program transfers the contents of the active SMF data set to an output data set. Then it resets the status of the dumped data set to empty so that SMF can use it again for recording data. CICS PA uses this output data set as the input data for its report processing. See z/OS V1R4.0 MVS System Management Facilities (SMF), SA22-7630, about dumping SMF data.
ISPF Settings Command ===> _________________________________________________________________ Options Print Graphics Enter "/" to select option Family printer type 2 _ Command line at bottom Device name . . . . _ / Panel display CUA mode Aspect ratio . . . 0 / Long message in pop-up _ Tab to action bar choices / Tab to point-and-shoot fields General / Restore TEST/TRACE options Input field pad . . N _ Session Manager mode Command delimiter . ; / Jump from leader dots _ Edit PRINTDS Command / Always show split line _ Enable EURO sign Terminal Characteristics Screen format 3 1. Data 2. Std 3. Max 4. Part
28 CICS Performance Analyzer
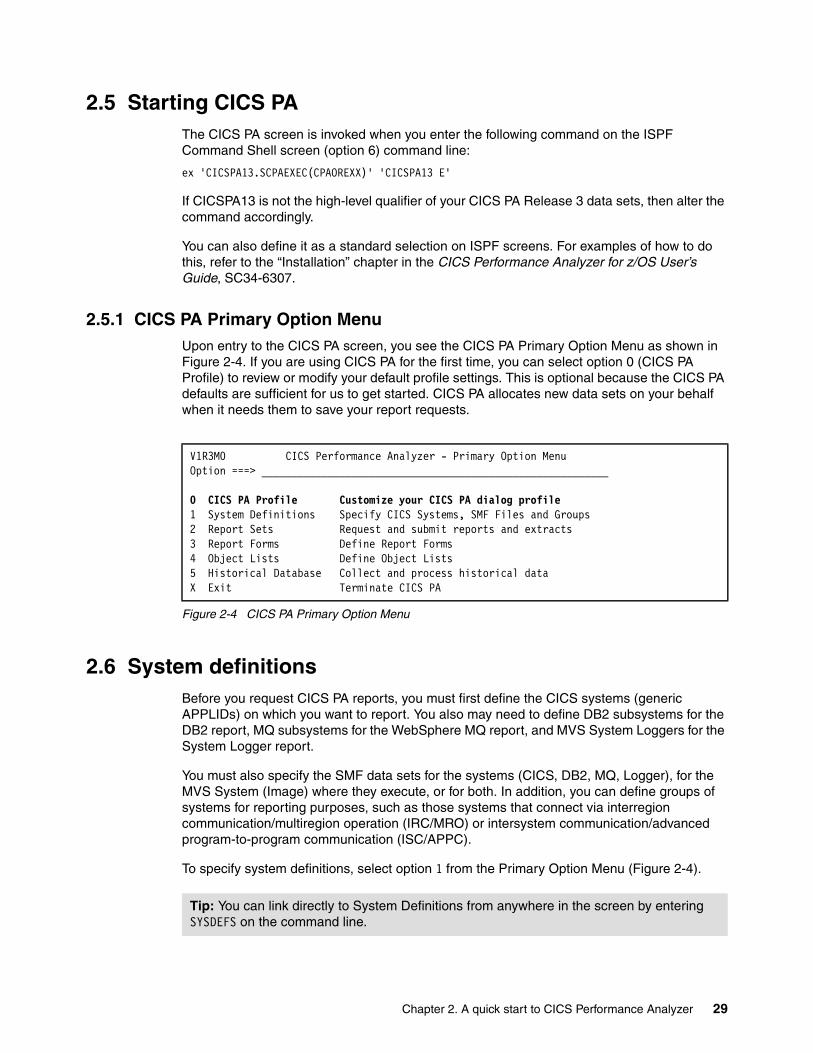
2.5 Starting CICS PAThe CICS PA screen is invoked when you enter the following command on the ISPF Command Shell screen (option 6) command line:
ex 'CICSPA13.SCPAEXEC(CPAOREXX)' 'CICSPA13 E'
If CICSPA13 is not the high-level qualifier of your CICS PA Release 3 data sets, then alter the command accordingly.
You can also define it as a standard selection on ISPF screens. For examples of how to do this, refer to the “Installation” chapter in the CICS Performance Analyzer for z/OS User’s Guide, SC34-6307.
2.5.1 CICS PA Primary Option MenuUpon entry to the CICS PA screen, you see the CICS PA Primary Option Menu as shown in Figure 2-4. If you are using CICS PA for the first time, you can select option 0 (CICS PA Profile) to review or modify your default profile settings. This is optional because the CICS PA defaults are sufficient for us to get started. CICS PA allocates new data sets on your behalf when it needs them to save your report requests.
Figure 2-4 CICS PA Primary Option Menu
2.6 System definitionsBefore you request CICS PA reports, you must first define the CICS systems (generic APPLIDs) on which you want to report. You also may need to define DB2 subsystems for the DB2 report, MQ subsystems for the WebSphere MQ report, and MVS System Loggers for the System Logger report.
You must also specify the SMF data sets for the systems (CICS, DB2, MQ, Logger), for the MVS System (Image) where they execute, or for both. In addition, you can define groups of systems for reporting purposes, such as those systems that connect via interregion communication/multiregion operation (IRC/MRO) or intersystem communication/advanced program-to-program communication (ISC/APPC).
To specify system definitions, select option 1 from the Primary Option Menu (Figure 2-4).
V1R3M0 CICS Performance Analyzer - Primary Option Menu Option ===> __________________________________________________________ 0 CICS PA Profile Customize your CICS PA dialog profile 1 System Definitions Specify CICS Systems, SMF Files and Groups 2 Report Sets Request and submit reports and extracts 3 Report Forms Define Report Forms 4 Object Lists Define Object Lists 5 Historical Database Collect and process historical data X Exit Terminate CICS PA
Tip: You can link directly to System Definitions from anywhere in the screen by entering SYSDEFS on the command line.
Chapter 2. A quick start to CICS Performance Analyzer 29

2.6.1 System Definitions MenuThe first time that you invoke System Definitions, you see the System Definitions Menu (Figure 2-5). From this menu, you can:
� Define systems, SMF files, and groups on which you want to report.
� Maintain SMF files for each system, for each MVS system (Image), or for both.
� Maintain group definitions for reporting purposes.
� Use the data Take-up facility to extract details of your systems from an SMF file for automatic take-up into your system definitions.
You can choose to bypass this menu in the future by selecting “Always go directly to Systems View” as shown in bold at the bottom of Figure 2-5. In this scenario, we select option 4.
Figure 2-5 System Definitions Menu
2.6.2 Take-Up from SMF An easy way for us to start is to let CICS PA set up our system definitions by using the Take-up facility. This facility populates the system and file definitions with details extracted from SMF files.
Since we selected option 4 on the System Definitions Menu screen, we now see the Data Take-Up from SMF screen as shown in Figure 2-6. Specify the details of the SMF file on which you want to report and then press Enter. CICS PA generates a batch job to extract the take-up details from the SMF data set.
Figure 2-6 System definitions: Data Take-Up from SMF screen
System Definitions Menu Command ===> ____________________________________________ Select an option then press Enter. 4 1. Define Systems, SMF Files and Groups 2. Maintain SMF Files 3. Maintain Group definitions 4. Take-up from SMF File Enter "/" to select option _ Always go directly to Systems View
Data Take-Up from SMF Command ===> _____________________________________________________ Specify the SMF File for data take-up and press Enter Data Set Name . . . 'CICSRS7.SMF110.TESTCASE'_____________________ Specify details if data set is not cataloged: UNIT . . . . . ________ + VOLSER . . . ______ + SEQ Number . . ___ (1 to 255) Execution Mode: 2 1. Submit Batch JCL 2. Edit Batch JCL
30 CICS Performance Analyzer
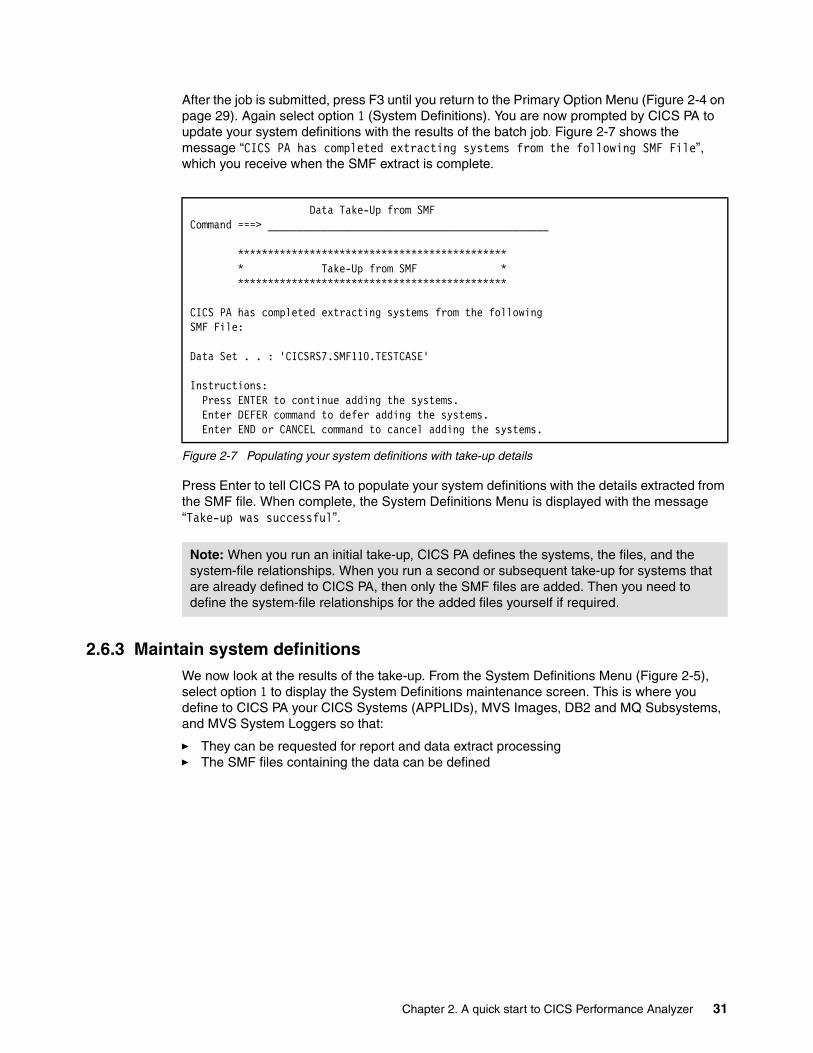
After the job is submitted, press F3 until you return to the Primary Option Menu (Figure 2-4 on page 29). Again select option 1 (System Definitions). You are now prompted by CICS PA to update your system definitions with the results of the batch job. Figure 2-7 shows the message “CICS PA has completed extracting systems from the following SMF File”, which you receive when the SMF extract is complete.
Figure 2-7 Populating your system definitions with take-up details
Press Enter to tell CICS PA to populate your system definitions with the details extracted from the SMF file. When complete, the System Definitions Menu is displayed with the message “Take-up was successful”.
2.6.3 Maintain system definitionsWe now look at the results of the take-up. From the System Definitions Menu (Figure 2-5), select option 1 to display the System Definitions maintenance screen. This is where you define to CICS PA your CICS Systems (APPLIDs), MVS Images, DB2 and MQ Subsystems, and MVS System Loggers so that:
� They can be requested for report and data extract processing� The SMF files containing the data can be defined
Data Take-Up from SMF Command ===> _______________________________________________ ********************************************* * Take-Up from SMF * ********************************************* CICS PA has completed extracting systems from the following SMF File: Data Set . . : 'CICSRS7.SMF110.TESTCASE' Instructions: Press ENTER to continue adding the systems. Enter DEFER command to defer adding the systems. Enter END or CANCEL command to cancel adding the systems.
Note: When you run an initial take-up, CICS PA defines the systems, the files, and the system-file relationships. When you run a second or subsequent take-up for systems that are already defined to CICS PA, then only the SMF files are added. Then you need to define the system-file relationships for the added files yourself if required.
Chapter 2. A quick start to CICS Performance Analyzer 31

Figure 2-8 System Definitions after Take-Up from SMF
CICS PA has automatically defined the MVS image, SC66. MVS Image entries are identifiable by Image in the Type column and the Image column is blank. APPLIDs are listed with a type of CICS and Image SC66.
You can see that the SMF Files System is the image SC66 for all systems. This means that files defined to SC66 are available to all systems defined to that Image. Therefore, you only need to define the files once.
Specifying SMF files is optional. If you do not specify them here, then when it comes time to submit your report request, CICS PA generates job control language (JCL) with the SMF File data set names unresolved. You have the option to edit the JCL at that time.
You can define new systems by entering the NEW command on the command line. Consider the following examples:
NEW CICSPAOR CICS NEW SC43 IMAGE
In this example, type line action S next to the SC66 Image entry (highlighted in bold in Figure 2-8) to select it from the System Definitions screen.
2.6.4 MVS image definitionLet’s look further at the results of the take-up. Now you see the MVS Image display as shown in Figure 2-9. Notice that the item in bold indicates the files for this system.
System Definitions Row 1 from 12 Command ===> ________________________________________________ Scroll ===> CSR Select a System to edit its definition, SMF Files and Groups. SMF Files / System Type Image Description System S SC66 Image System added by take-up SC66 _ SCSCPAA1 CICS SC66 System added by take-up SC66 _ SCSCPTA1 CICS SC66 System added by take-up SC66 _ SCSCPFA1 CICS SC66 System added by take-up SC66 _ SCSCPJA3 CICS SC66 System added by take-up SC66 _ SCSCPJA6 CICS SC66 System added by take-up SC66 _ SCSCPJA7 CICS SC66 System added by take-up SC66 _ SCSCPTA2 CICS SC66 System added by take-up SC66 _ SCSCPAA4 CICS SC66 System added by take-up SC66 _ SC66LOGR Logger SC66 System added by take-up SC66 _ D7Q2 DB2 SC66 System added by take-up SC66 _ SCSCPJA9 CICS SC66 System added by take-up SC66 ********************************* End of list *********************************
32 CICS Performance Analyzer

Figure 2-9 MVS Image definition: Files
SMF Files for this systemObserve that the SMF data set name listed is the one specified in the take-up job. You can specify as many files as you want. CICS PA processes them all (unless they are excluded). We recommend that you specify the files in time sequence (earliest first), since CICS PA processes them in the order that they are specified. Various line actions are available to help you do this: I (Insert), R (Repeat), C (Copy), M (Move), and D (Delete).
Deleting a file here only deletes the relationship, not the file itself. Also, you can use the X line action to exclude an SMF File from report processing. Excluded files are marked with an asterisk (*) in the Exc column.
To add a file to the list, you can type the data set name directly, or select from a list of available files by entering line action S or pressing F4 (Prompt) from the data set name field.
Groups this system belongs toPress F11 to scroll right. More: > is displayed in the top right corner to remind you that there is more information for this system. A screen like the example in Figure 2-10 is displayed where you can specify the groups to which this system belongs on the line under Group + and Description.
Figure 2-10 MVS Image definition: Groups
Groups enable you to connect systems together for consolidated (cross-system) reporting. This is especially useful for MRO, APPC or other systems that share workloads. For examples of grouping systems, see Figure 7-21 on page 189 and Figure 13-7 on page 289.
Press F3 to return to the System Definitions screen.
MVS Image Row 1 of 1 More: > Command ===> ___________________________________________ Scroll ===> CSR_ MVS Image definition: MVS Image . . . . . SC66 Description . . . . System added by take-up_____________ / Exc SMF Data Set Name + UNIT + SEQ VOLSER + _ 'CICSRS7.SMF110.TESTCASE'_____________________ DASD____ ___ ______********************************* End of list *****************************
MVS Image Row 1 of 1 More: > Command ===> ___________________________________________ Scroll ===> CSR_ MVS Image definition: MVS Image . . . . . SC66 Description . . . . System added by take-up_____________ / Group + Description _ ________ _____________________________________ ********************************* End of list *****************************
Chapter 2. A quick start to CICS Performance Analyzer 33

2.6.5 CICS System definitionFrom the list of System Definitions, you can select other system entries to review or modify. For example, select the first CICS system. Then you see a screen like the example in Figure 2-11.
Figure 2-11 CICS System definition
To define a CICS System for reporting, you only need to specify the APPLID. All other fields are optional.
Notice the MVS Image (SMF ID) to which this CICS System (APPLID) belongs. The MVS Image allows CICS PA to:
� Distinguish between multiple CICS systems that have the same APPLID but run on different MVS Images.
� Share SMF files that contain data for more than one system. By defining the SMF files to the MVS Image, you need only define your SMF files once.
� Request reporting by MVS Image. All CICS Systems (APPLIDs) belonging to that MVS Image are selected.
These other fields may be important to you in the future:
� MCT: You must specify the monitoring control table (MCT) suffix and MCT load library if you want to include CMF user fields in your reporting. Otherwise, CICS PA uses the system default MCT for the version of CICS you are reporting.
� Dictionary DSN: You can build a data set to contain the CMF dictionary record for those times when the SMF file does not contain one, so that CICS PA reporting can progress.
CICS System Row 1 of 1 More: > Command ===> ___________________________________________ Scroll ===> ____ CICS System definition: APPLID . . . . . . . . SCSCPAA1 MVS Image . . SC66____ Description . . . . . System added by take-up_______________ CICS Version (VRM) . . 620 MCT Suffix . . . . . . __ MCT Load Library . . . ______________________________________________ SDFHLOAD Library . . . ______________________________________________ Dictionary DSN . . . . ______________________________________________ Exc SMF Data Set Name + UNIT + SEQ VOLSER + _ _____________________________________________ ________ ___ ______ ******************************** End of list *****************************
Tips:
� You can specify a masked pattern for the name of your system. For example, you can define APPLID SCSCP*. This allows all CICS systems matching this pattern (SCSCPAA1, SCSCPTA1, and so on) to share the System definition, SMF files, and groups specified once for SCSCP*.
� CICS systems that are not defined to CICS PA can still be reported, but only if their Image is defined. For example, if CICSPFOR (your production file owning region) also runs on Image SC66, then at run report time, you can request reporting for this system. You specify a System Selection of CICSPFOR and SC66, even though CICSPFOR is not defined to CICS PA.
34 CICS Performance Analyzer

CMF uses a dictionary record to map the fields in the CMF performance class records. CICS writes a dictionary record when CMF starts, but not when SMF switches data sets. You only need to build a dictionary record if you want to include your CMF user fields (from user defined EMPs in the MCT) in your reporting. Otherwise, CICS PA uses the default dictionary record for the version of CICS that you are reporting.
If you want CICS PA to generate the Dictionary record for this CICS system, follow these steps:
a. Specify the Dictionary DSN.
b. Specify the SDFHLOAD Library so that CICS PA can use the DFHMNDUP utility to generate the Dictionary record.
c. Select Dictionary in the action bar. CICS PA immediately populates the specified data set with the Dictionary record for this CICS system. If the data set is not cataloged, CICS PA allocates it before writing the record. If the data set is cataloged, CICS PA overwrites its contents with the new Dictionary record.
At JCL generation time, CICS PA inserts the cataloged Dictionary DSN in the CPADICTR DD statement.
2.6.6 Other system definitions: DB2, WebSphere MQ, System LoggerOther systems are identified by their type, such as DB2, MQ, or LOGGER. To define them to CICS PA, the System Definitions facility is used in a similar way to CICS APPLIDs and MVS Images.
The initial system definition is complete. You can now move on to requesting reports. Press F3 until you return to the Primary Option Menu (Figure 2-4 on page 29).
2.7 Requesting reports and extractsTo build report and extract requests, select option 2 on the Primary Option Menu (Figure 2-4 on page 29).
2.7.1 Creating the Report Sets data setYou are prompted to create the Report Sets data set as shown in Figure 2-12. This is the data set in which CICS PA saves your report and extract requests.
Tip: If you are using an MCT to exclude CMF fields, you do not need to specify the MCT to CICS PA for that reason alone. Check that you did not exclude fields that CICS PA requires for your reporting. Refer to the CICS Performance Analyzer for z/OS Report Reference, SC34-6308, for the list of required CMF fields for:
� Cross-System Work report and extract� Transaction Group report� BTS report� Workload Activity report� DB2 report
Chapter 2. A quick start to CICS Performance Analyzer 35

Figure 2-12 Creating the Report Sets data set
Press Enter to create the Report Sets data set. Otherwise, cancel and from the Primary Options Menu (Figure 2-4 on page 29), select option 0.3 (option 0 and then option 3) to specify the data set name of your choice.
2.7.2 Report SetsThe Report Sets facility defines, maintains, and runs report and extract requests. A Report Set contains a set of report and extract requests to be submitted and run as a single job. You can define as many Report Sets as you want. You can also define any number of reports and extracts in a Report Set. Figure 2-13 shows the list of Report Sets, which initially is empty.
Figure 2-13 Report Sets: Defining a new Report Set
Use the NEW command to create your first Report Set. A Report Set is a member in the Report Sets data set.
2.7.3 Editing the Report SetYou can now start editing your Report Set shown in Figure 2-14. The list of available reports and extracts is presented as a tree structure where they are grouped by category. You can use line action S to expand and collapse the categories to show or hide the items within it. This is similar to the way some PC tools display folders and their contents. If your terminal emulation allows, you can set your mouse as a lightpen and then click the + to expand or - to collapse the category. Alternatively, you can use cursor selection. Position the cursor on the + or - sign and press Enter.
--------------------- Confirm Create ------------------- The Report Sets Data Set is not cataloged. xxxxxxxx.CICSPA.RSET Press ENTER to create the data set using default allocation characteristics. Use EXIT or CANCEL to return without creating the data set.
Tip: You may find it useful to keep separate CICS PA data sets for production and test environments.
Report Sets Command ===> NEW REDBOOK_____________________________________ Scroll ===> PAGE Report Sets Data Set . . . xxxxxxxx.CICSPA.RSET / Name Description Changed ID ********************************* End of list *********************************
36 CICS Performance Analyzer

Figure 2-14 Editing a Report Set
You can use line action S to select the reports and extracts that you want to edit, and the global options and selection criteria that you want to apply to them. You can also issue line actions on report categories and on ** Reports ** at the top of the tree. Enter the / line action next to an item in the tree to see the list of possible actions.
The selection criteria enables you to filter the CMF data for your reports and extracts using any field or combination of fields. For example, to include data only for a particular transaction ID, user ID, or only for a specific period of time.
Select the global options and then select the Performance List report. Type S next to both options and then press Enter.
EDIT Report Set - REDBOOK Row 1 of 34 Command ===> ________________________________________________ Scroll ===> CSR_ Description . . . Demonstration Report Set_________
Enter "/" to select action. ___ ** Reports ** Active - ___ Options No S__ Global No - ___ Selection Criteria No ___ Performance No ___ Exception No - ___ Performance Reports No S__ List No ___ List Extended No ___ Summary No ___ Totals No ___ Wait Analysis No ___ Cross-System Work No ___ Transaction Group No ___ BTS No ___ Workload Activity No - ___ Exception Reports No ___ List No ___ Summary No - ___ Transaction Resource Usage Reports No ___ File Usage Summary No ___ Temporary Storage Usage Summary No ___ Transaction Resource Usage List No - ___ Subsystem Reports No ___ DB2 No ___ WebSphere MQ No - ___ System Reports No ___ System Logger No - ___ Performance Graphs No ___ Transaction Rate No ___ Transaction Response Time No - ___ Extracts No ___ Cross-System Work No ___ Export No ___ Record Selection No ** End of Reports **
To expand or collapse categories, choose one of these options:
� Enter line action S
� Point and click - or + with your mouse as a lightpen
� Click - or + to select it
Global specifications
Chapter 2. A quick start to CICS Performance Analyzer 37

2.7.4 Global OptionsFigure 2-15 shows the Report Set Global Options. They define general control information that applies to all the reports and extracts in the Report Set.
Figure 2-15 Reviewing Global Options
Note the following points:
� To specify the systems (and inherently the files) on which you want to report, you can specify:
– A CICS APPLID– A DB2 subsystem ID– A WebSphere MQ subsystem ID– An MVS System Logger ID– An MVS Image ID– A Group ID
You can type the IDs directly or use Prompt (F4) to select from a list of predefined systems and groups.
� You can specify System Selection in one or more of the following ways:
– As a global option on the Global Options screen.
– As a local option on individual report or extract screens. Report-level specifications take precedence over the global specification.
– As a global option on the Run Report Set screen. The run-time global option overrides the Report Set global option and optionally the report-level specifications.
– By editing the JCL before submit.
� Print Lines per Page is the maximum number of report lines to print on each page. The default is 60. You can also specify this option for individual reports. Report-level specifications take precedence over the global specification.
� Date and Time delimiters specify the separator characters for the date and time-of-day in the reports and extracts. A slash (/) and a colon (:) are the defaults.
� The Time Zone specifies the number of hours east or west of Greenwich Mean Time (GMT). For example, to synchronize the CMF and DB2 time stamps, specify Time Zone to match the time zone of the SMF data. However, if you are correlating DB2 data between CICS PA and DB2 PM reports, then you may want the CICS PA DB2 time stamps to be reported in GMT so that they can be more easily matched. If Time Zone is not specified, or it is set to zero, all times (CMF and DB2) are reported in GMT.
REDBOOK - Global Options Command ===> ________________________________________________________________ System Selection: CICS APPLID . . ________ + Image . . ________ + Group . . ________ + DB2 SSID . . . ____ + Image . . ________ + Group . . ________ + MQ SSID . . . . ____ + Image . . ________ + Group . . ________ + Logger . . . . ________ + Image . . ________ + Group . . ________ + Report Formatting Options: Print Lines per Page . . 60_ (1-255) Time Zone . . . . . . . ___ (Blank for system default or -12 to +12 hours) Date Delimiter . . . . . / Time Delimiter . . . . . :
38 CICS Performance Analyzer

In this case, accept the default global options. Now you can exit or cancel to continue.
2.7.5 Specifying report optionsThe Performance List report gives the details of every transaction that executed. Figure 2-16 shows the screen where the Performance List report options are specified.
The report runs without you specifying any additional options. However, you may want to tailor it to help your analysis. If you want to specify a particular system that this report applies to, under System Selection, enter the System name (and optionally Image, Group, or both). Alternatively, you can select the required system from a list. To do this, position the cursor on the APPLID field (highlighted in bold) and press F4 (Prompt).
Figure 2-16 Specifying report options: Using F4 (Prompt) to select from a list of systems
A selection list of available systems is displayed as shown in Figure 2-17. Enter line action S (as shown in bold) to select the system that you want.
Figure 2-17 Selecting a system
Then CICS PA sets the information under System Selection as shown in Figure 2-18.
REDBOOK - Performance List Report Command ===> _________________________________________________________________ System Selection: Report Output: APPLID . . ________ + DDname . . . . . . . . . LIST0001 Image . . ________ + Print Lines per Page . . ___ (1-255) Group . . ________ + Report Format: Form . . . ________ + Title . . ________________________________________________________________ ________________________________________________________________ Selection Criteria: _ Performance
Select a System Row 1 to 8 of 8 Command ===> ____________________________________________ Scroll ===> PAGE Select a System then press Enter. System Image Files Description S SCSCPAA1 SC66 Yes System added by take-up . SCSCPTA1 SC66 Yes System added by take-up . SCSCPFA1 SC66 Yes System added by take-up . SCSCPJA3 SC66 Yes System added by take-up . SCSCPJA6 SC66 Yes System added by take-up . SCSCPJA7 SC66 Yes System added by take-up . SCSCPTA2 SC66 Yes System added by take-up . SCSCPAA4 SC66 Yes System added by take-up********************************* End of list ******************************
Chapter 2. A quick start to CICS Performance Analyzer 39

Figure 2-18 Specifying report options: System Selection information complete
If you decide not to specify the System Selection here, then you can do so when you run your Report Set and CICS PA prompts you.
Two important report options that we discuss later are the report format and selection criteria. They allow you to tailor the fields that appear in your reports and filter the data that is reported.
Exit to save your new report request.
2.7.6 Reports listAfter you exit from the report, the Reports list is presented (Figure 2-19). You can define as many reports of the same type in a Report Set as you want.
You can use line action I (Insert) to define a new Performance List report, D to delete a report, or X to exclude it from reporting. When you finish defining your Performance List reports, exit to save the reports and return to the main Report Set edit screen.
Figure 2-19 Reports list
2.8 Running your reportsYou must enter a SAVE command, select File->Save from the action bar, or press F3 (Exit) to save your Report Set definition in the Report Set data and exit. However, you do not need to save your Report Set before you run it.
To run the Report Set, enter the RUN command in the command line or select File->Run from the action bar. Alternatively, you can run individual reports or report categories by
REDBOOK - Performance List Report Command ===> _________________________________________________________________
System Selection: Report Output: APPLID . . SCSCPAA1 + DDname . . . . . . . . . LIST0001 Image . . SC66____ + Print Lines per Page . . ___ (1-255) Group . . ________ + Report Format: Form . . . ________ + Title . . ________________________________________________________________ ________________________________________________________________ Selection Criteria: _ Performance
REDBOOK - Performance List Reports Row 1 from 1 Command ===> ________________________________________________ Scroll ===> PAGE ---- System Selection ---- Selection / Exc APPLID + Image + Group + Output Form + Criteria _ SCSCPAA1 SC66____ ________ LIST0001 ________ NO ********************************* End of list *********************************
40 CICS Performance Analyzer

entering the RUN line action next to the particular ones that you want to run. Figure 2-20 shows both methods.
Figure 2-20 Using RUN
2.8.1 Active statusLooking at the Report Set in Figure 2-20, you can see that the Performance List report and the Performance Reports category are active. Observe also that the Global Options are automatically activated by CICS PA when there is at least one active report or extract.
The Active status controls which reports in the Report Set are run when you submit a RUN request. When you enter RUN in the command line to run the Report Set, only active reports within active categories are selected for JCL generation. You can temporarily override the active status by typing the RUN line action next to any required reports and categories.
You can use line action D to deactivate or A to activate particular reports and categories.
2.8.2 Run Report SetBefore CICS PA generates the JCL, you are prompted to supply run-time options as shown in Figure 2-21.
EDIT Report Set - REDBOOK Row 1 of 21 Command ===> RUN_____________________________________________ Scroll ===> CSR_ Description . . . Demonstration Report Set_________
Enter "/" to select action. ___ ** Reports ** Active - ___ Options Yes ___ Global Yes - ___ Selection Criteria No ___ Performance No ___ Exception No - ___ Performance Reports Yes RUN List Yes ___ List Extended No ___ Summary No ___ Totals No ___ Wait Analysis No ___ Cross-System Work No ___ Transaction Group No ___ BTS No ___ Workload Activity No + ___ Exception Reports No + ___ Transaction Resource Usage Reports No + ___ Subsystem Reports No + ___ System Reports No + ___ Performance Graphs No + ___ Extracts No ** End of Reports **
Global Options are automatically activated
Run report overriding Active status
Running Report Set
Chapter 2. A quick start to CICS Performance Analyzer 41

Figure 2-21 Run Report Set: Specifying run-time options
You can specify the following run-time options:
� The system or group of systems to be reported: CICS PA allows you to specify System Selection both in the Report Set and here at run-time. An Override System Selections option is provided to determine which specification takes precedence if both are specified:
– When the override option is not selected, the run-time System Selection overrides the Report Set Global options only. It does not override any System Selections specified in the individual reports within the Report Set.
– When the override option is selected, the run-time System Selection overrides all System Selections in the Report Set (Global Options and individual reports).
� The date and time range or “time slot” of the SMF data that you want to process: This reduces the volume of data and enables more efficient processing. If not specified, then CICS PA processes the entire SMF file or files. Any report intervals specified under Selection Criteria in your Report Set are then processed normally for this reduced period of data.
� Missing SMF Files Option: This specifies the remedial action to take if you have not defined SMF files for the systems to be reported (or they are all excluded).
� To edit the JCL before submit
From the Run Report Set screen, press Enter to generate the JCL.
2.8.3 JCL generationNow you see an ISPF Edit session with the JCL as shown in Figure 2-22. You can store the job stream in your JCL library to submit from there, or as part of a job automation process.
Note: Because we specified System Selection on the Performance List Reports screen (Figure 2-19 on page 40), specifying System Selection now at run-time has no effect on that report unless we select the Override System Selections option.
Run Report Set REDBOOK Command ===> ______________________________________________________________ Specify run Report Set options then press Enter to continue submit. System Selection: CICS APPLID . . ________ + Image . . ________ + Group . . ________ + DB2 SSID . . . ____ + Image . . ________ + Group . . ________ + MQ SSID . . . . ____ + Image . . ________ + Group . . ________ + Logger . . . . ________ + Image . . ________ + Group . . ________ + _ Override System Selections specified in Report Set ----- Report Interval ------ Missing SMF Files Option: MM/DD/YYYY HH:MM:SS.TH 1 1. Issue error message From __________ ___________ 2. Leave DSN unresolved in JCL To __________ ___________ 3. Disregard offending reports Enter "/" to select option / Edit JCL before submit
Only process SMF records with a time stamp within this date and time range or “time slot”
42 CICS Performance Analyzer

Make any necessary changes. Then type SUBMIT (or SUB) on the command line and press Enter to submit the job.
Figure 2-22 Edit the Report Set JCL and submit the job
After you submit the job, exit until you return to the CICS PA Primary Option Menu (Figure 2-4 on page 29).
2.9 Viewing the report outputYou can view the output using SDSF or ISPF option 3.8 Outlist Utility (from the Primary Options Menu, option 3 and then option 8). The CICS PA screen automatically assigns each report in the Report Set a unique DDname. In SDSF, you can each report separately by entering the question mark (?) action character in the NP column (Figure 2-23).
Figure 2-23 SDSF: Displaying the job output by DDname
Then enter the S action character to select your report output (Figure 2-24).
EDIT xxxxxxxx.SPFTEMP1.CNTL Columns 00001 00072 Command ===> SUB_____________________________________________ Scroll ===> PAGE ****** ***************************** Top of Data ****************************** 000001 //USERID JOB (ACCOUNT),'NAME' 000002 //* CICS PA V1R3 Report JCL 000003 //CICSPA EXEC PGM=CPAMAIN 000004 //STEPLIB DD DSN=CICSPA.V1R3M0.SCPALINK,DISP=SHR 000005 //SYSPRINT DD SYSOUT=* 000006 //* SMF Input Files 000007 //SMFIN001 DD DSN=CICSRS7.SMF110.TESTCASE, 000008 // DISP=SHR 000009 //* Command Input 000010 //SYSIN DD * 000011 * Report Set =REDBOOK 000012 * Description=Demonstration Report Set 000013 * Reports for System=SCSCPAA1 000014 * Image =SC66 000015 * Description=Demonstration Report Set 000016 CICSPA IN(SMFIN001), 000017 APPLID(SCSCPAA1), 000018 LINECNT(60), 000019 FORMAT(':','/'), 000020 LIST(OUTPUT(LIST0001)) 000021 /* ****** **************************** Bottom of Data ****************************
Edit the JCL if required and then enter SUB
SDSF STATUS DISPLAY ALL CLASSES COMMAND INPUT ===> SCROLL ===> PAGE NP JOBNAME JobID Owner Prty Queue C Pos SAff ASys Status PrtDest SecLabel TGNum TGPct OrigN ? CICSPAJ1 JOB29346 xxxxxxxx 1 PRINT A 3406 LOCAL 2 0.00 LOCAL
Chapter 2. A quick start to CICS Performance Analyzer 43

Figure 2-24 SDSF: Selecting the report output by DDname
Figure 2-25 shows what you may see when suitable input data is specified.
Figure 2-25 Sample report output
2.10 Tailoring report formatsReport Forms allow you to design your own reports and extracts to fully exploit the wealth of information contained in the CICS Transaction Server (TS) CMF performance records. For example, if you suspect that there is a performance problem with transient data, you can create a Report Form that focuses on that aspect of CICS performance.
To build Report Forms, select option 3 from the Primary Option Menu (Figure 2-4 on page 29).
2.10.1 Creating the Report Forms data setYou are prompted to create the Report Forms data set. CICS PA saves your Report Forms in this data set.
Press Enter to create the Report Forms data set. Otherwise, cancel and from the Primary Option Menu (Figure 2-4 on page 29), select 0.4 (option 0 and then option 4)) to specify the data set name of your choice.
2.10.2 Report Form typesThere are three types of Report Forms: LIST, LISTX and SUMMARY. You can tailor your reports and extracts using Report Forms of a compatible type:
� LIST: Specifies which fields are reported and the order of the columns. This type of form is applicable to:
– Performance List report– Cross-System Work (Extended) report
SDSF JOB DATA SET DISPLAY COMMAND INPUT ===> SCROLL ===> PAGE NP DDNAME StepName ProcStep DSID Owner C Dest Rec-Cnt Page-Cnt Byte-Cnt CC Rmt Node O-Grp-N SecLabel PrMod JESMSGLG JES2 2 xxxxxxxx S LOCAL 20 1,372 1 1 1 LINE JESJCL JES2 3 xxxxxxxx S LOCAL 23 1,053 1 1 1 LINE JESYSMSG JES2 4 xxxxxxxx S LOCAL 40 1,986 1 1 1 LINE SYSPRINT CICSPA 102 xxxxxxxx S LOCAL 70 5,409 1 1 1 LINE S LIST0001 CICSPA 103 xxxxxxxx S LOCAL 222 21,453 1 1 1 LINE
V1R3M0 CICS Performance Analyzer Performance List LIST0001 Printed at 17:20:04 3/29/2002 Data from 10:07:43 3/28/2002 APPLID SCSCPAA1 Page 1 Tran SC Term Userid RSID Program TaskNo Stop Response Dispatch User CPU Suspend DispWait FC Wait FCAMRq IR Wait Time Time Time Time Time Time Time Time CQRY S 0004 CICSUSER DFHQRY 26 10:09:37.011 .5971 .1371 .0341 .4600 .4553 .0000 0 .0000 CSGM S 0004 CICSUSER DFHGMM 27 10:09:37.506 .4864 .1624 .0245 .3239 .3234 .0000 0 .0000 CEDA TO 0004 CICSUSER DFHEDAP 28 10:10:04.867 22.3878 5.9004 1.0167 16.4873 .5643 .0674 1 .0000 CEDA TO 0004 CICSUSER DFHEDAP 29 10:11:21.675 75.8603 2.7834 .5313 73.0770 .0599 .1231 12 .0000 CEDA TO 0004 CICSUSER DFHEDAP 30 10:12:35.400 66.0356 1.8070 .4299 64.2286 .0160 .0650 12 .0000 CATR S CICSUSER DFHZATR 32 10:15:37.706 .4334 .1143 .0282 .3191 .3187 .0000 0 .0000 CEDA TO 0004 CICSUSER DFHEDAP 31 10:21:22.924 526.216 2.8898 .3436 523.326 .0217 .0154 1 .0000 CEDA TO 0004 CICSUSER DFHEDAP 33 10:22:15.994 39.9497 2.5449 .6930 37.4048 .0167 .1159 56 .0000 CEDA TO 0004 CICSUSER DFHEDAP 34 10:22:26.559 4.2486 1.7076 .7248 2.5411 .0275 .0198 26 .0000
44 CICS Performance Analyzer

– Export extract– List HDB reports
� LISTX: Specifies which fields are reported, the order of the columns, up to three sort fields (ascending or descending), and a processing limit on one of the sort fields. This type of form is applicable to:
– Performance List Extended report– Cross-System Work (Extended) report (sort sequence and limit ignored)– Export extract (sort sequence and limit ignored)
� SUMMARY: Specifies which fields are reported, the order of the columns, up to three sort fields (ascending), and numeric functions (average, standard deviation, total, minimum, maximum). This type of form is applicable to:
– Performance Summary report– Export extract– Summary HDB reports
2.10.3 Report Forms listThe Report Forms list displays all the Report Forms in the Report Forms data set and shows their type and description. The initial Report Forms list is empty as shown in Figure 2-26. You can use the NEW command to create your own Report Form or you can select from the many samples provided. We use the samples.
To display the list of Sample Report Forms, enter the SAMPLES command or select Samples in the action bar as shown in Figure 2-26.
Figure 2-26 Report Forms list: Requesting Sample Report Forms
2.10.4 Sample Report FormsOn the Sample Report Forms screen (Figure 2-27), scroll down until you find the Sample Report Forms that meet your requirements.
We selected two Report Forms for Transient Data Analysis:
� TDLST lists all transactions, showing their Transient Data usage � TDSUM summarizes Transient Data usage for each transaction ID
File Confirm Samples Options Help ------------------------------------------------------------------------------ Report Forms Command ===> SAMPLES_________________________________________ Scroll ===> PAGE Report Forms Data Set . . . xxxxxxxx.CICSPA.FORM / Name Type Description Changed ID ********************************* End of list *********************************
Chapter 2. A quick start to CICS Performance Analyzer 45

Figure 2-27 Selecting Sample Report Forms
Exit to add these Report Forms to your Report Forms data set. You can see them in the Report Forms list in Figure 2-28. They are now available for report processing.
Before we finish, let’s look at Report Form TDSUM to familiarize ourselves with the format of the report it will produce and introduce some of the features. Enter line action S to select TDSUM.
Figure 2-28 Report Forms list: Selecting a Report Form
2.10.5 Edit Report FormYou can now review or change the Report Form as shown in Figure 2-29.
--------------------- Sample Report Forms---------------------- Row 72 to 87 of 90 Command ===> _______________________________ Scroll ===> CSR_ Select one or more Sample Report Forms then press EXIT. Name Type Description S TDLST LIST Transient Data Activity S TDSUM SUMMARY Transient Data Activity_ TRAPLSUM SUMMARY Transactions by Application Tran _ TRARTSUM SUMMARY Transaction Routing Analysis (3) _ TRATDSUM SUMMARY Transactions by Applid and TOD _ TRRTESUM SUMMARY Transaction Routing Analysis (1) _ TRTCLSUM SUMMARY Transactions by Tranclass Name _ TRTESUM SUMMARY Transaction Usage by Terminal ID _ TRTODSUM SUMMARY Transactions by Time-of-Day _ TRTRASUM SUMMARY Transaction Routing Analysis (4) _ TSLST LIST Temporary Storage Activity _ TSSUM SUMMARY Temporary Storage Activity _ TSWTLST LIST Temporary Storage Wait Analysis _ TSWTSUM SUMMARY Temporary Storage Wait Analysis _ UOWLST LIST Transaction Network Unit-of-Work _ USTORLST LIST User (Task) Storage Analysis
File Confirm Samples Options Help ------------------------------------------------------------------------------ Report Forms 2 members added Command ===> ________________________________________________ Scroll ===> CSR_ Report Forms Data Set . . . xxxxxxxx.CICSPA.FORM / Name Type Description Changed ID
_ TDLST LIST Transient Data Activity 2003/07/25 00:00 CICSPA S TDSUM SUMMARY Transient Data Activity 2003/07/25 00:00 CICSPA ********************************* End of list *********************************
46 CICS Performance Analyzer

Figure 2-29 Editing a Report Form
Note the following points:
� You can specify selection criteria in the Report Form. If a report that uses this form also has selection criteria defined, then records are selected for reporting only if they satisfy both criteria.
� If the Report Form does not meet your reporting requirements, you can change it so that only the fields you require in your report are above the EOR line (limited to a page width of 132), and only those you require in your extract are above the EOX line (no limit).
The line actions that you can use to edit the Form include I (Insert), D or DD (Delete), C or CC (Copy), M or MM (Move), R or RR (Repeat).
� To add another field to the Form, you can either replace an existing field by overtyping it, or you can use line action I to insert a blank row to accept the new field. You can either type the field name (or first part of it) directly, or you can enter line action S to select the field name from a list of allowable fields.
We entered line action I (Insert) to add a new field named RESPONSE into the Form.
� You can enter a FIND command to locate a character string in the display. Then press F5 or use the RFIND command to locate the next occurrence.
� You can enter line action H (Help) to obtain a detailed description of a field.
� More: > indicates that you can scroll Right (F11) to view more information. This includes field length, Dictionary definition, User Field offset and length, and report title. The title appears at the top of each page of the report immediately below the date and time. The first line of the specified title appears on the left of the report, and the second line on the right. You can also specify a Title for individual reports. This takes precedence over that in the Report Form.
File Edit Confirm Upgrade Options Help ------------------------------------------------------------------------------ EDIT SUMMARY Report Form - TDSUM Row 1 of 11 More: >Command ===> f response______________________________________ Scroll ===> CSR_ Description . . . . Transient Data Activity_________ Version (VRM): 620 Selection Criteria:_ Performance
Field / Name + S Type Fn Description __ TRAN____ A _______ ___ Transaction identifier i_ TASKCNT_ _______ ___ Total Task count __ RESPONSE _______ AVE Transaction response time __ TDGET___ _______ AVE Transient data GET requests __ TDPURGE_ _______ AVE Transient data PURGE requests __ TDPUT___ _______ AVE Transient data PUT requests h_ TDTOTAL_ _______ AVE Transient data Total requests __ TDWAIT__ TIME___ AVE VSAM transient data I/O wait time __ TDWAIT__ COUNT__ AVE VSAM transient data I/O wait time __ EOR_____ _______ ___ ---------------- End of Report ---------------- __ EOX_____ _______ ___ ---------------- End of Extract --------------- ********************************* End of list *********************************
Chapter 2. A quick start to CICS Performance Analyzer 47

Our form indicates that:
� The report is summarized by TRAN, the transaction ID.
� Nine fields are shown in the report, from TRAN in the left-most report column to TDWAIT in the right-most column.
� Statistical averages for RESPONSE, TDGET, TDPURGE, and so on, are reported.
� TDWAIT is reported in two columns. TIME shows the average I/O Wait elapsed time. COUNT shows the average number of times transactions waited for TD.
� EOR indicates where the report line ends. CICS PA automatically adjusts this for you to ensure that the fields you specify fit across the page.
� EOX indicates where the extract record ends. There is no restriction on the record length. You can move EOX to the bottom of the Report Form to include all available fields in the extract.
Exit (F3) from the Report Form to save it.
2.10.6 New Report FormFrom the Report Forms list, you can create a new Report Form by entering the NEW command or selecting File->New from the action bar. The New Report Form screen is displayed as shown in Figure 2-30.
Figure 2-30 New Report Form
Report Form field categoriesWhen creating a Report Form, you can select fields from all the CMF data fields or just from specific field categories.
On the New Report Form screen, enter line action S next to Field Categories to display the list of categories defined in CICS PA (Figure 2-31).
Note: If you want to include user fields in your Report Form, you must specify the APPLID so that CICS PA can obtain the associated dictionary entries. Otherwise, simply specify the version (VRM) so that CICS PA can populate the form with the fields that are applicable to that release of CICS.
New Report Form
Command ===> ______________________________________________________ Specify the name of the new Report Form and its options. Name . . . . . . LIST2___ APPLID . . . . . SCSCPAA1 + Version (VRM) . . 620 MVS Image . . . . SC66____ S Field Categories Form Type or Model . . _ 1. List 2. List Extended (Sorted) 3. Summary 4. Model (specified below) Model _______________________________________________________
Select field categories from a list
Specify the APPLID for user fields and EMPs. Otherwise specify VRM.
48 CICS Performance Analyzer

Figure 2-31 New Report Form: Selecting Field Categories
Enter the SELECT command to select all categories (the default), or line action S to select particular categories. Then press F3 (Exit).
When all options on the New Report Form screen are specified, press Enter to proceed with creating the Form. Edit the Report Form as required (see Figure 2-29 on page 47). Then exit to save the form.
Exit Report Forms and return to the Primary Option Menu (Figure 2-4 on page 29).
2.10.7 Using the Report Form in your reportTo use the Report Forms in your report requests, again select option 2 (Report Sets) from the Primary Option Menu (Figure 2-4 on page 29). The list of Report Sets is displayed as shown in Figure 2-32. Enter line action S to resume editing your Report Set.
Figure 2-32 Report Sets list: Selecting a Report Set
A Report Set can include more than one report of each type. For example, you can request two List reports and three Summary reports.
Select the reports that you want to edit. Using the S line action as shown in Figure 2-33, we select the Performance List and Summary reports so that we can use our Report Forms.
Field Categories Row 1 to 14 of 25 Command ===> SELECT_________________________________ Scroll ===> PAGE Select one or more Categories then press EXIT. Category Description . AOR Application-owning region . FOR File-owning region . TOR Terminal-owning region . DB2 DB2 data-owning region . IMS DBCTL IMS DBCTL data-owning region . CROSSSYS Cross-System User Fields . DFHAPPL Application naming . DFHCBTS Business Transaction Services . DFHCICS CICS related task information . DFHDATA Data processing . DFHDEST Transient Data . DFHDOCH Document Handler . DFHFEPI Front End Programming Interface . DFHFILE File Control
Report Sets Row 1 to 1 of 1 Command ===> _______________________________________________ Scroll ===> PAGE Report Sets Data Set . . . xxxxxxxx.CICSPA.RSET / Name Description Changed ID
S__ REDBOOK Demonstration Report Set 2003/10/17 17:59 xxxxxxxx ********************************* End of list *********************************
Chapter 2. A quick start to CICS Performance Analyzer 49

Figure 2-33 Report Set: Selecting multiple reports to edit
Since we previously defined one List report, CICS PA presents the list of reports for you to review or update (Figure 2-34). You can add, delete, or exclude reports, or select reports to modify their options.
You can modify some options directly on this screen. We specify the Report Form now. You can either type the name, or press F4 (Prompt) to select a name from the list of available Report Forms for this type of report.
Figure 2-34 Reports list: Specifying the report format
This is all we need to do for the Performance List report. Now press F3 (Exit).
CICS PA continues to the next selected report, in this case the Summary report. This is our first Summary report, so we specify the report options (Figure 2-35).
EDIT Report Set - REDBOOK Row 1 of 31 Command ===> ________________________________________________ Scroll ===> CSR Description . . . Demonstration Report Set_________
Enter "/" to select action. ___ ** Reports ** Active + ___ Options Yes
+ ___ Selection Criteria No - ___ Performance Reports Yes
S__ List Yes ___ List Extended No S__ Summary No ___ Totals No ___ Wait Analysis No ___ Cross-System Work No ___ Transaction Group No
REDBOOK - Performance List Reports Row 1 from 1 Command ===> ________________________________________________ Scroll ===> PAGE
---- System Selection ---- Selection / Exc APPLID + Image + Group + Output Form + Criteria _ SCSCPAA1 SC66____ ________ LIST0001 TDLST___ NO ********************************* End of list *********************************
Position the cursor and press Prompt (F4)
50 CICS Performance Analyzer

Figure 2-35 Specifying report options: Report format
As for the previous List report, the Report Form name is specified in the Form field. Again, you can specify the name of the Report Form, or press F4 (Prompt) to select one from a list of available Report Forms for this type of report.
Note the following points:
� Since we have not specified System Selection in this report, we are prompted at submit time to specify the desired system.
� The time interval applies when you want to summarize transaction activity over time. It is used when you specify a Summary Report Form that has one or both sort fields START or STOP included.
Exit to save your report request. The Performance Summary Reports list is displayed. We have completed specifying our Performance Summary reports, so press F3 (Exit) again. You now see that both the Performance List and Summary reports are active (Active Yes).
2.11 Filtering the reportYou can specify selection criteria to filter the input records so that your CICS PA reports and extracts only include the data that you interested in. Exception selection criteria applies to the Exception reports and specifies the filtering options for CMF exception class records. performance selection criteria applies to all the other reports and extracts, except the System Logger report. It specifies filtering options for CMF performance class and transaction resource class records, and where applicable, DB2 and WebSphere MQ accounting records.
You can specify global selection criteria that applies to all the reports and extracts in a Report Set, or local selection criteria that applies to an individual report or extract. You can also specify selection criteria in Report Forms.
REDBOOK - Performance Summary Report
Command ===> _________________________________________________________________ System Selection: Report Output: APPLID . . ________ + DDname . . . . . . . . . SUMM0001 Image . . ________ + Print Lines per Page . . ___ (1-255) Group . . ________ + Report Format: Form . . . TDSUM___ + Title . . ________________________________________________________________ ________________________________________________________________ Processing Options: Reporting Options: Time Interval . . . 00:01:00 (hh:mm:ss) _ Exclude Totals Selection Criteria: _ Performance
Position the cursor and press Prompt (F4)
Chapter 2. A quick start to CICS Performance Analyzer 51

We select the global performance selection criteria as shown in Figure 2-36 so that we can filter both of our reports to see only the transactions that we are interested in.
Figure 2-36 Specifying global selection criteria
2.11.1 Selection criteriaSelection criteria enables you to specify report filtering options as shown in Figure 2-37.
Figure 2-37 Selection criteria: Specifying a select statement
Note the following points:
� You can specify one or more report intervals. Transactions that either start, stop, or are active during the report intervals can be included (INC) or excluded (EXC) from the report.
Notes:
� Report-level specifications take precedence over the global specifications.
� If a report has selection criteria defined and uses a Report Form that also has selection criteria defined, then records are selected for reporting only if they satisfy both criteria.
EDIT Report Set - REDBOOK Row 1 of 34 Command ===> ________________________________________________ Scroll ===> CSR_ Description . . . Demonstration Report Set_________
Enter "/" to select action. ___ ** Reports ** Active - ___ Options Yes ___ Global Yes - ___ Selection Criteria No S__ Performance No ___ Exception No - ___ Performance Reports Yes ___ List Yes ___ List Extended No ___ Summary Yes ___ Totals No
REDBOOK - Performance Select Statement Row 1 of 2 More: >Command ===> ________________________________________________ Scroll ===> CSR_ Active --------------- Report Interval ---------------- Inc Start -------- From --------- ---------- To --------- Exc Stop DD/MM/YYYY HH:MM:SS.TH DD/MM/YYYY HH:MM:SS.TH _ ___ ______ __________ ___________ __________ ___________ -----------------------------------------------------------------------------
Inc Field --- Value or Range --- Object / Exc Name + Type Value/From To List + _ INC TRAN____ ______ FIN*________ _________ ________ S EXC TDWAIT__ COUNT_ 0___________ _________ ________ ********************************* End of list *********************************
52 CICS Performance Analyzer

� You can specify one or more fields and a single value, a masking pattern (for character fields), a range of values (for numeric fields), or an Object List (see 2.12, “Maintaining Object Lists” on page 56). Records with data fields that match the specified values can be included (INC) or excluded (EXC) from the report.
For character fields, the masking characters % and * are allowed as well as the ability to select null fields by specifying ’ ’ (two single quotes).
For numeric fields (Count, Time, or Clock), you can precede the From value with a comparison operator. For example, specify >=1 for a comparison of greater than or equal to 1. Allowed operators are:
= > >= < <=
Specify time values in seconds using a decimal point. Otherwise, milliseconds is assumed. For example, specify 1.12 seconds or 1120 milliseconds.
� You can scroll right by pressing F11 to see more columns of information about the fields such as length and dictionary definition.
You can specify most of the CMF fields in selection criteria. Enter line action S to select from a list of available fields or press F4 (Prompt) on the Field Name. Figure 2-38 shows the field selection list.
Figure 2-38 Selecting a performance field
Note the following points:
� You can enter a FIND command to locate a character string in the display. Then use F5 or the RFIND command to locate the next occurrence.
� You can enter line action H (Help) to obtain a detailed description of a field.
� You can scroll right by pressing F11 to view more columns of information about the fields (Dictionary definition).
We will the field TDWAIT, and then type line action S (Select) and press Enter to insert this field into the select statement.
Complete the select statement to ensure that we only report our Finance transactions (transaction IDs that start with FIN) that waited for at least one Transient Data request.
Press F3 (Exit) to save your select statement. Figure 2-39 shows the select statements (rows) that define your selection criteria.
Select a Performance Field Row 208 of 236 More: >Command ===> f 'transient d'______________________ Scroll ===> PAGE
Field / Name Description _ TDGET Transient data GET requests _ TDPURGE Transient data PURGE requests h TDPUT Transient data PUT requests _ TDTOTAL Transient data Total requests s TDWAIT VSAM transient data I/O wait time _ TERM Terminal ID _ TERMCNNM Terminal session Connection name _ TRAN Transaction identifier _ TRANPRTY Transaction priority _ TSGET Temporary Storage GET requests _ TSPUTAUX Auxiliary TS PUT requests
Chapter 2. A quick start to CICS Performance Analyzer 53
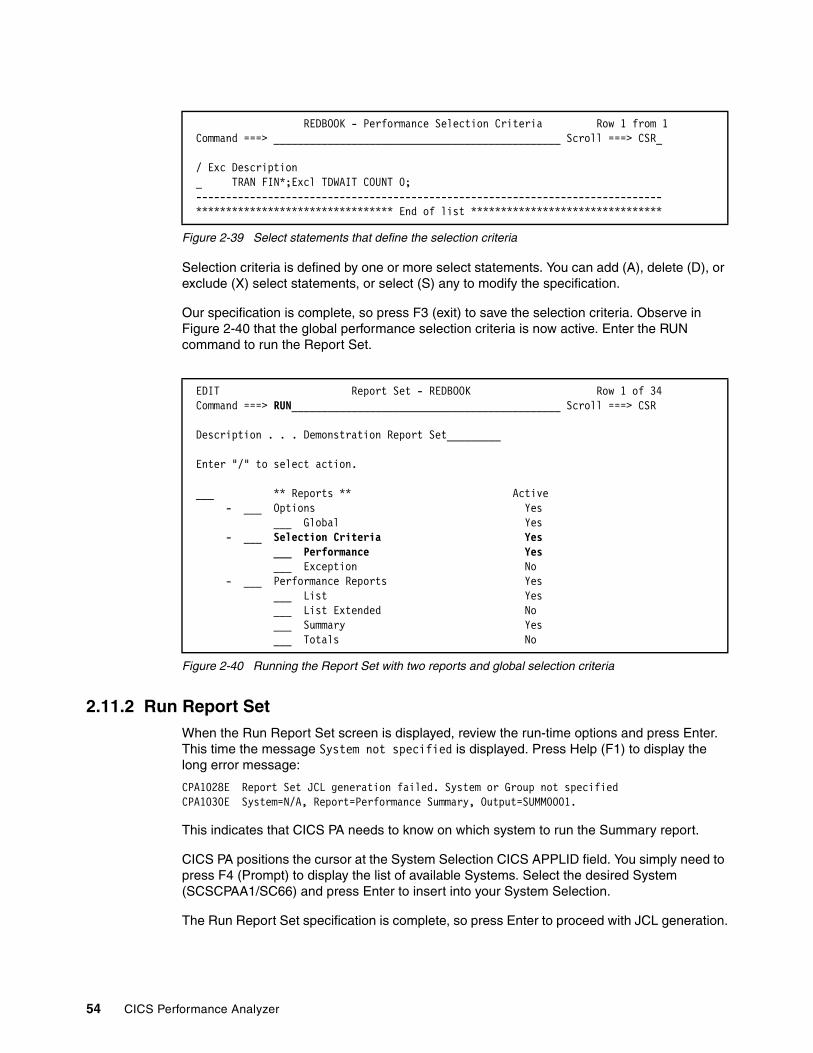
Figure 2-39 Select statements that define the selection criteria
Selection criteria is defined by one or more select statements. You can add (A), delete (D), or exclude (X) select statements, or select (S) any to modify the specification.
Our specification is complete, so press F3 (exit) to save the selection criteria. Observe in Figure 2-40 that the global performance selection criteria is now active. Enter the RUN command to run the Report Set.
Figure 2-40 Running the Report Set with two reports and global selection criteria
2.11.2 Run Report SetWhen the Run Report Set screen is displayed, review the run-time options and press Enter. This time the message System not specified is displayed. Press Help (F1) to display the long error message:
CPA1028E Report Set JCL generation failed. System or Group not specified CPA1030E System=N/A, Report=Performance Summary, Output=SUMM0001.
This indicates that CICS PA needs to know on which system to run the Summary report.
CICS PA positions the cursor at the System Selection CICS APPLID field. You simply need to press F4 (Prompt) to display the list of available Systems. Select the desired System (SCSCPAA1/SC66) and press Enter to insert into your System Selection.
The Run Report Set specification is complete, so press Enter to proceed with JCL generation.
REDBOOK - Performance Selection Criteria Row 1 from 1 Command ===> ________________________________________________ Scroll ===> CSR_ / Exc Description _ TRAN FIN*;Excl TDWAIT COUNT 0; ------------------------------------------------------------------------------ ********************************* End of list ********************************
EDIT Report Set - REDBOOK Row 1 of 34 Command ===> RUN_____________________________________________ Scroll ===> CSR Description . . . Demonstration Report Set_________
Enter "/" to select action. ___ ** Reports ** Active - ___ Options Yes ___ Global Yes - ___ Selection Criteria Yes ___ Performance Yes ___ Exception No - ___ Performance Reports Yes ___ List Yes ___ List Extended No ___ Summary Yes ___ Totals No
54 CICS Performance Analyzer

2.11.3 JCL generationThe Report Set JCL is similar to the JCL in Figure 2-22 on page 43. The difference is that additional commands are generated to honor the selection criteria and report forms that you since specified. This is shown in Figure 2-41.
Make any necessary changes. Then type SUBMIT (or SUB) on the command line and press Enter to submit the job.
Figure 2-41 Report Set JCL: Showing the selection criteria and report forms
After you submit the job, press Exit until you return to the CICS PA Primary Option Menu (Figure 2-4 on page 29).
. . . ===> SUB_____________________________________________ Scroll ===> PAGE . . . //* Command Input //SYSIN DD * * Report Set =REDBOOK CICSPA IN(SMFIN001), . . . SELECT(PERFORMANCE( INC(TRAN(FIN*)), EXC(TDWAIT(COUNT(0))))), LIST(OUTPUT(LIST0001), FIELDS(TRAN, USERID, TASKNO, STOP(TIMET), TDGET, TDPURGE, TDPUT, TDTOTAL, TDWAIT(TIME), TDWAIT(COUNT)), TITLE1( 'Transaction Transient Data Activity - Detail ')), SUMMARY(OUTPUT(SUMM0001), . . . BY(TRAN), FIELDS(TRAN, TASKCNT, RESPONSE(AVE), TDGET(AVE), TDPURGE(AVE), TDPUT(AVE), TDTOTAL(AVE), TDWAIT(TIME(AVE)), TDWAIT(COUNT(AVE))), TITLE1( 'Transaction Transient Data Activity - Summary ')) /*
Performance List report
Performance Summary report
Global selection criteria
Report Form TDLST
Report Form TDSUM
Chapter 2. A quick start to CICS Performance Analyzer 55

2.12 Maintaining Object ListsLet us now extend our use of selection criteria by employing an Object List. Object Lists enable you to define a group of related values once. Then you simply refer to the Object List name when specifying the record selection criteria in your Report Sets.
To define Object Lists for use in selection criteria, select option 4 from the Primary Option Menu (Figure 2-4 on page 29).
2.12.1 Creating the Object Lists data setYou are prompted to create the Object Lists data set. This is the data set in which CICS PA saves your report and extract requests.
Press Enter to create the Object Lists data set. Otherwise, cancel and from the Primary Option Menu (Figure 2-4 on page 29), select option 0.5 (option 0 and then option 5) to specify the data set name of your choice.
2.12.2 Object ListsThe Object Lists facility is used to create, modify, and view Object Lists. An Object List defines a list of field values that can be used when specifying record selection criteria, for example, to define all the transaction IDs that belong to a particular application system.
Object Lists enable you to define a group of related values once. Then you simply refer to the Object List name when specifying the record selection criteria in a Report Set. You can define your Object Lists hierarchically to eliminate duplication and improve the integrity of lists.
The initial list of Object Lists is empty. Use the NEW command to create your first Object List. An Object List is a member in the Object Lists data set.
2.12.3 Edit Object ListYou can now start editing your Object List. The example in Figure 2-42 shows a list of long running CICS internal transactions that you may commonly want to exclude from your reporting. For other examples of Object Lists, see Figure 13-44 on page 309 and Figure 18-6 on page 391.
In any row, you can specify:
� A single value� A pattern using masking characters % and * (character fields only)� A range (numeric fields only)� An Object List (sublist)
You can specify any number of values in an Object List. You can also specify any number of Object Lists as sublists.
The order of entries in the list is of no consequence to CICS PA reporting.
56 CICS Performance Analyzer

Figure 2-42 Editing an Object List: CICS internal transactions
When your Object List is complete, exit to save it and return to the Primary Option Menu (Figure 2-4 on page 29).
2.12.4 Using the Object List in your selection criteriaTo use the Object List in your selection criteria, follow these steps:
1. From the Primary Option Menu, select option 2 (Report Sets).
2. From the Report Sets list, select the Report Set that you want to edit.
3. From the Edit Report Set screen, select the Global selection criteria. Or, instead you may specify selection criteria for individual reports.
4. Specify the name of your Object List, which is highlighted in Figure 2-43. You can type the name directly, or press F4 (Prompt) to select from a list of available Object Lists.
5. Exit to save your selection criteria.
6. Run the Report Set or report as appropriate.
EDIT Object List - CICSEXCL Row 1 to 16 of 16 Command ===> _______________________________________________ Scroll ===> CSR_ Description . . . . CICS/CPSM trans to be excluded__ Specify the Object List values: / 1st Value 2nd Value Sublist _ CFQR_____ _________ ________ _ CFQS_____ _________ ________ _ CSHQ_____ _________ ________ _ CSNC_____ _________ ________ _ CSNE_____ _________ ________ _ CSOL_____ _________ ________ _ CSSY_____ _________ ________ _ CSTP_____ _________ ________ _ CSZI_____ _________ ________ _ COIE_____ _________ ________ _ COI0_____ _________ ________ _ CONL_____ _________ ________ _ CONM_____ _________ ________ _ COHT_____ _________ ________ _ CSKL_____ _________ ________ _ CKTI_____ _________ ________ ********************************* End of list *********************************
Chapter 2. A quick start to CICS Performance Analyzer 57

Figure 2-43 Selection criteria: Specifying an Object List in a select statement
This completes the introduction to CICS PA. To learn about the many additional features of CICS PA, refer to:
� Part 2, “CICS Performance Analyzer in action” on page 127, where the screen is used in particular scenarios
� CICS Performance Analyzer for z/OS User’s Guide, SC34-6307
� The CICS PA online Help and Tutorial
REDBOOK - Performance Select Statement Row 1 of 1 More: >Command ===> ________________________________________________ Scroll ===> CSR_ Active --------------- Report Interval ---------------- Inc Start -------- From --------- ---------- To --------- Exc Stop DD/MM/YYYY HH:MM:SS.TH DD/MM/YYYY HH:MM:SS.TH _ ___ ______ __________ ___________ __________ ___________ -----------------------------------------------------------------------------
Inc Field --- Value or Range --- Object / Exc Name + Type Value/From To List + _ EXC TRAN____ ______ ____________ _________ CICSEXCL********************************* End of list *********************************
58 CICS Performance Analyzer

Chapter 3. Reports and extracts
CICS Performance Analyzer (PA) provides a comprehensive suite of reports and extracts to help you analyze and tune the performance of your CICS systems. This chapter describes the purpose of each report and extract, the options that you can specify to tailor the output, and examples for you to see. For detailed descriptions of all the reports and extracts, refer to the CICS Performance Analyzer for z/OS Report Reference, SC34-6308.
To see how to use different tools to analyze the extract data produced by the CICS PA Export facility, refer to Chapter 4, “Processing extracts” on page 107.
Part 2 of this book draws it all together. It discusses a variety of scenarios that employ many of the CICS PA reports and extracts. It also describes how to use the CICS PA Historical Database (HDB) facility to maintain your CICS performance data.
3
© Copyright IBM Corp. 2003. All rights reserved. 59

3.1 CICS PA Report SetA Report Set contains your report and extract requests. The CICS PA screen presents the Report Set in a tree structure, as shown in Figure 3-1, where the available reports and extracts are grouped by category.
Figure 3-1 CICS PA Report Set showing available reports and extracts
This chapter discusses the reports and extracts in the same sequence as they are presented in the screen.
EDIT Report Set - REDBOOK Row 1 of 34 Command ===> Scroll ===> CSR Description . . . CICS PA Report Set Enter "/" to select action. ___ ** Reports ** Active - ___ Options No ___ Global No - ___ Selection Criteria No ___ Performance No ___ Exception No - ___ Performance Reports No ___ List No ___ List Extended No ___ Summary No ___ Totals No ___ Wait Analysis No ___ Cross-System Work No ___ Transaction Group No ___ BTS No ___ Workload Activity No - ___ Exception Reports No ___ List No ___ Summary No - ___ Transaction Resource Usage Reports No ___ File Usage Summary No ___ Temporary Storage Usage Summary No ___ Transaction Resource Usage List No - ___ Subsystem Reports No ___ DB2 No ___ WebSphere MQ No - ___ System Reports No ___ System Logger No - ___ Performance Graphs No ___ Transaction Rate No ___ Transaction Response Time No - ___ Extracts No ___ Cross-System Work No ___ Export No ___ Record Selection No ** End of Reports **
60 CICS Performance Analyzer

Performance reportsThe Performance reports are produced from CICS Monitoring Facility (CMF) performance class data. The reports in this category are:
� Performance List report
This is a detailed listing of the CMF performance class data.
� Performance List Extended report
This report provides a sorted, detailed listing of the CMF performance class data.
� Performance Summary report
This report summarizes the CMF performance class data.
� Performance Totals report
This report provides totals and averages of the CMF performance class data.
� Wait Analysis report
This report breaks down wait activity by transaction ID (or other ordering fields). You can see at a glance which CICS resources are causing your transactions to be suspended. This report can help you to quickly identify the possible source of a performance response time problem.
� Cross-System Work report
This report is a detailed listing of segments of work performed by a single CICS system or multiple CICS systems via transaction routing, function shipping, or distributed transaction processing on behalf of a single network unit-of-work ID. It provides a consolidated report that shows the complete transaction activity across connected systems. The format can be tailored to produce the Cross-System Work Extended report.
� Transaction Group report
This report offers a detailed listing of segments of work performed by the same or different CICS systems on behalf of a single transaction group ID.
� BTS report
This is a detailed listing that shows the correlation of the transactions performed by the same or different CICS systems on behalf of a single CICS Business Transaction Services (BTS) process.
� Workload Activity report
This report provides a transactions response time analysis by MVS Workload Manager (WLM) service and report class. You can use this in conjunction with the z/OS Resource Measurement Facility™ (RMF) workload activity reports to understand from a CICS perspective how well your CICS transactions are meeting their response time goals. The Workload Activity List report is a cross-system report that correlates CMF performance class data from single or multiple CICS systems for each network unit of work. Importantly, this report ties multiregion operation (MRO) and function shipping tasks to their originating task so that their impact on response time can be assessed. The Workload Activity Summary report summarizes response time by WLM service and report classes.
Exception reportsException reports are produced from CMF exception class data. The reports in this category are:
� Exception List: A detailed listing of the CMF exception class data
� Exception Summary: A summary of the CMF exception class data
Chapter 3. Reports and extracts 61

Transaction Resource Usage reportsThe Transaction Resource Usage reports are produced from CMF performance class and transaction resource class data. Currently, file and temporary storage usage are the only types of transaction resource data available. The reports in this category are:
� File Usage Summary report
This report provides a detailed analysis of CMF transaction resource class data for files. The Transaction File Usage Summary report summarizes file usage by transaction ID. For each transaction ID, it gives transaction identification and file control statistics followed by a breakdown of file usage for each file used by the transaction. The File Usage Summary report summarizes file activity. For each file, it gives a breakdown of file usage by transaction ID.
� Temporary Storage Usage Summary report
This report provides a detailed analysis of CMF transaction resource class data for temporary storage queues. The Transaction Temporary Storage Usage Summary report summarizes temporary storage usage by transaction ID. For each transaction ID, it gives transaction identification and temporary storage control statistics followed by a breakdown of temporary storage usage for each temporary storage queue used by the transaction. The Temporary Storage Usage Summary report summarizes temporary storage activity. For each temporary storage queue, it breaks down temporary storage usage by transaction ID.
� Transaction Resource Usage List report
This report provides a detailed list of CMF transaction resource class data. The records are reported in the sequence that they appear in the system management facility (SMF) file. The report gives transaction information together with statistics of file storage usage, temporary storage usage, or both by the transaction.
Subsystem reportsThe Subsystem reports are produced from subsystem accounting data stored in SMF files. The reports in this category are:
� DB2 report
This report correlates CICS CMF records and DB2 Accounting (SMF 101) records by network unit of work to produce a consolidated and detailed view of DB2 usage by your CICS systems. The DB2 report enables you to view CICS and DB2 resource usage statistics together in a single report. The DB2 List report shows detailed information of DB2 activity for each transaction. The DB2 Summary reports summarize DB2 activity by transaction.
� The WebSphere MQ report
Processes WebSphere MQ SMF accounting (SMF 116) records to produce a detailed view of WebSphere MQ usage by your CICS systems. The WebSphere MQ List reports display, depending on the WebSphere MQ accounting traces that are active, details about Transactions, WebSphere MQ Queues that were referenced, WebSphere MQ global (not transaction-specific or queue-specific) statistics and WebSphere queue-specific commands issued by transactions. These can be aggregated by transaction ID, queue name, or both.
System reportsThe System reports are produced from system data stored in SMF files. The report in this category is the System Logger report.
62 CICS Performance Analyzer

The System Logger report processes MVS System Logger (SMF 88) records. It does not process CMF data and the selection criteria does not apply. The report provides information about the System Logger log streams and coupling facility structures that are used by CICS Transaction Server (TS) for logging, recovery, and backout operations. The report can assist with measuring the effects of tuning changes and identifying logstream or structure performance problems. The System Logger List report shows information about logstream writes, deletes, and events, as well as Structure Alter events for each SMF recording interval.
The System Logger Summary report summarizes logstream and structure statistics so you can measure the System Logger performance over a longer period of time. These reports, when used in conjunction with the CICS Logger reports produced from the standard CICS statistics reporting utilities, provide a comprehensive analysis of the logstream activity for all your CICS systems.
Performance Graph reportsPerformance Graph reports are produced from CMF performance class data in graphical format. The reports in this category are:
� Transaction Rate Graph report
This report is a set of two graphs that illustrate the average response time and the number of transactions that completed in a specified time interval.
� Transaction Response Time Graph report
This report shows a set of two graphs that illustrate the average and maximum response time for all transactions that completed in a specified time interval.
ExtractsPerformance extracts produce extract data sets from CMF performance class data and create extract data sets in a format that is appropriate to their function. A Recap report is always produced to summarize the extract results. The extracts in this category are:
� Cross-System Work extract
This data set is useful for cross-system analysis. CICS PA allows you to merge CMF performance class data from segments of work performed by the same or different CICS systems via transaction routing, function shipping, or distributed transaction processing on behalf of a single network unit-of-work ID. You can use this Cross-System Work data set as input to CICS PA Performance reports such as the List, Summary, and Totals reports to monitor the total amount of resources used by a transaction within a single or across multiple CICS systems.
� Export extract
This data set is a subset of the CMF performance class data, extracted and formatted as a delimited text file. This data file can then be imported into PC spreadsheet or database tools such as Lotus 1-2-3 or Lotus Approach for further reporting and analysis. The extract records have a default format that includes all the clock fields. Or you can tailor the format like the Performance List or Performance Summary reports.
� Record Selection extract
This data set contains a small extract file with only the records that are of interest to you. The Record Selection Extract filters large SMF files, which can then be used as input to CICS PA. The reduced data volume enables more efficient reporting and analysis. The following record types are processed by this extract:
– SMF 110 CMF performance records– SMF 101 DB2 accounting records, if requested– SMF 116 WebSphere MQ accounting records, if requested
Chapter 3. Reports and extracts 63

3.2 CICS PA commandsCICS PA provides both an Interactive System Productivity Facility (ISPF) screen and a command interface. The CICS PA screen generates the batch job and commands to produce reports and extracts. CICS PA allows you to edit the generated JCL and commands before you submit a job.
The general format of the command as it appears in the SYSIN DD statement of your job is:
CICSPA operand(suboperand),...
3.2.1 Commands for reports and extractsThe operands to request the CICS PA reports and extracts are:
LIST Performance List report
LISTX Performance List Extended report
SUMMARY Performance Summary report
TOTAL Performance Totals report
WAITANAL Performance Wait Analysis report
CROSS Cross-System Work report and extract
TRANGROUP Transaction Group report
BTS CICS Business Transaction Services report
WORKLOAD Workload Activity report
LISTEXC Exception List report
SUMEXC Exception Summary report
RESUSAGE(FILESUM) File Usage Summary report
RESUSAGE(TSSUM) Temporary Storage Usage Summary report
RESUSAGE(TRANLIST)Transaction Resource Usage List report
DB2 DB2 report
MQ WebSphere MQ report
LOGGER System Logger report
GRAPH(TRANRATE) Transaction Rate Graph report
GRAPH(RESPONSE) Transaction Response Time Graph report
EXPORT Exported Performance Data extract
RECSEL Record Selection extract
You can specify global operands to apply to all reports and extracts. You can also specify report-specific operands to tailor individual reports and extracts to your particular needs.
3.2.2 Commands for HDB processingThe HDB facility is driven from the CICS PA screen. It has three associated batch processes. The operands are:
� HDB(LOAD(hdbname)): Load HDB container data sets with selected SMF performance data
64 CICS Performance Analyzer

� HDB(REPORT(hdbname)): HDB report
� HDB(HKEEP): HDB Housekeeping
3.3 Performance reportsThe reports in this category are:
� Performance List report� Performance List Extended report� Performance Summary report� Performance Totals report� Wait Analysis report� Cross-System Work report� Transaction Group report� BTS report� Workload Activity report
3.3.1 Performance List reportThe Performance List report provides a detailed list of the CMF performance class records. Figure 3-2 shows the options for this report.
Figure 3-2 Performance List report options
Default report formatObserve the columns of data in the Performance List report in Figure 3-3. This example shows the default format of the report when a Report Form is not specified. It details performance-related information for each transaction.
REDBOOK - Performance List Report Command ===> _________________________________________________________________ System Selection: Report Output: APPLID . . SCSCPAA5 + DDname . . . . . . . . . LIST0001 Image . . ________ + Print Lines per Page . . ___ (1-255) Group . . ________ + Report Format: Form . . . FCLIST__ + Title . . Transaction File Control Usage__________________________________ ________________________________________________________________ Selection Criteria: S Performance *
Show File Control (FC) request counts and elapsed times
Include only transaction IDs matching C* with a response time greater than 0.5 seconds
Chapter 3. Reports and extracts 65

Figure 3-3 Performance List default report
Report tailoringYou can easily change the format of the Performance List report by using a Report Form to display the performance related data in which you are interested. Many sample Report Forms of type LIST are provided with CICS PA for this purpose. The EOR marker in the Report Form defines the end of the print line. It must not exceed the maximum page width of 132. For more information about how to use Report Forms, see 2.10, “Tailoring report formats” on page 44.
Figure 3-4 shows how you can tailor the Performance List report using a Report Form. This example shows File Request activity for each transaction. Notice the File Request counts on the right side of the report.
Figure 3-4 Performance List: Tailored report showing File Control requests
Example 3-1 shows how you can use the FIELDS operand to tailor the Performance List report.
Example 3-1 Using commands to tailor the Performance List report
CICSPA LIST(FIELDS(TRAN,DBCTL(PSBNAME), RESPONSE,CPU,IMSREQCT,IMSWAIT(TIME,COUNT), DBCTL(SCHTELAP, POOLWAIT, INTCWAIT, DBIOELAP, PILOCKEL, THREDCPU,
V1R3M0 CICS Performance Analyzer Performance List LIST0001 Printed at 9:06:18 10/28/2002 Data from 11:10:51 10/27/2002 APPLID SCSCPAA5 Page 3
Tran SC Term Userid RSID Program TaskNo Stop Response Dispatch User CPU Suspend DispWait FC Wait FCAMRq IR Wait Time Time Time Time Time Time Time Time CSAC TO SAMA CICSLS1 DFHACP 36 11:11:17.120 .5150 .0011 .0011 .5139 .0001 .0000 0 .0000 CSTE U CICSLS1 DFHTACP 37 11:11:17.231 .1420 .1381 .0126 .0039 .0037 .0000 0 .0000 CATA U CICSLS1 DFHZATA 38 11:11:27.342 .0537 .0394 .0121 .0143 .0003 .0000 0 .0000 CQRY S S208 CICSLS1 DFHQRY 39 11:11:28.453 .3476 .0451 .0048 .3025 .0038 .0000 0 .0000 CQRY S S208 CICSLS1 DFHQRY 39 11:11:28.564 .4147 .0012 .0008 .4136 .0000 .0000 0 .0000 CESN S S208 CICSLS1 DFHSNP 40 11:11:28.675 .0806 .0770 .0102 .0036 .0036 .0000 0 .0000 CATA U CICSLS1 DFHZATA 41 11:11:28.786 .0309 .0048 .0045 .0261 .0003 .0000 0 .0000 CQRY S S23D CICSLS1 DFHQRY 42 11:11:29.897 .2951 .0013 .0008 .2938 .0000 .0000 0 .0000 CQRY S S23D CICSLS1 DFHQRY 42 11:11:29.908 .4037 .0012 .0008 .4024 .0000 .0000 0 .0000 CESN S S23D CICSLS1 DFHSNP 43 11:11:29.099 .0030 .0029 .0020 .0001 .0000 .0000 0 .0000 CESN TP S208 CICSLS1 DFHSNP 44 11:11:35.110 .0284 .0280 .0147 .0004 .0003 .0000 0 .0000 CESN TP S23D CICSLS1 DFHSNP 45 11:11:41.221 .0203 .0197 .0114 .0006 .0006 .0000 0 .000
V1R3M0 CICS Performance Analyzer Performance List LIST0001 Printed at 10:32:09 10/28/2002 Data from 11:17:21 10/27/2002 APPLID SCSCPAA5 Page 3 Transaction File Control Usage Tran Userid Stop Response Dispatch User CPU FC Wait FCAMRq FCADD FCBROWSE FCDELETE FCGET FCPUT FC Total Time Time Time Time Time TRUE EUGENED 11:17:23.394 2.0973 .0014 .0010 .0000 0 0 0 0 0 0 0 RED1 EUGENED 11:17:32.050 .5333 .0055 .0040 .0000 0 0 0 0 0 0 0 STOC EUGENED 11:17:32.053 .5145 .0033 .0030 .0000 0 0 0 0 0 0 0 SALE EUGENED 11:17:32.054 .5675 .0263 .0124 .0493 28 6 0 0 8 4 22 DEL1 EUGENED 11:17:33.286 1.2323 .0057 .0051 .0099 15 1 0 1 3 1 7 SALE EUGENED 11:17:33.309 1.2198 .0086 .0047 .0130 10 0 0 1 4 2 9 STAT CICSLS 11:17:35.081 1.8129 .0178 .0028 .0000 0 0 0 0 0 0 0
66 CICS Performance Analyzer

DLICALLS, DBIOCALL)), TITLE1('Analysis of Transaction IMS DBCTL Usage'))
Figure 3-5 shows the resulting report with transaction database control (DBCTL) usage.
Figure 3-5 Performance List report showing DBCTL activity
The DBCTL User Field is 256 bytes long and contains a wealth of IMS information that can be requested in your reports. This information includes:
� PSB name� Various IMS DBCTL internal elapsed times� Various IMS DBCTL CPU times� DLI and database call counts, including DEDB statistics� Enqueue statistics
List ExportYou can also write your Performance List report to an extract data set. You do this by using the Export facility with a LIST or LISTX Report Form to define the record layout. When you use LISTX, the sort is ignored. The EOX marker in the Report Form defines the end of the extract record. There is no limit on the record length, so you can export all available fields or a selection. For more information, see 3.9.2, “Export extract” on page 101.
3.3.2 Performance List Extended reportThe Performance List Extended report is similar to the Performance List report but allows you to sort the data. For example, you can specify:
� The transactions that have the longest response time� The transactions that use the most CPU time� The transactions that performed the most File requests
Figure 3-6 shows the report options.
V1R3M0 CICS Performance Analyzer Performance List LIST0001 Printed at 11:33:27 9/11/2001 Data from 12:17:43 2/04/1999 APPLID IYK2Z1V3 Page 9Analysis of Transaction IMS DBCTL Usage Tran PSB Response User CPU IMS Reqs IMS Wait IMS Wait SchedElp PoolWt IC WT DBIOEl PILockEl ThredCPU DLI DBIO Time Time Time Count Time Time Time Time Time Time Calls Calls DLI1 PSB001 5.9288 1.5556 3 1.5556 5 1.0004 .0000 .0000 .0023 .0000 .0041 2 1 DLI2 PSB001 3.5302 .2359 3 .2359 5 .0010 .0000 .0000 .0017 .0000 .0289 2 1 DLI3 PSB001 3.4382 .5010 3 .5010 5 .0010 .0000 .0000 .0018 .0000 .0289 2 1 DLI4 PSB001 1.0711 .7553 2 .7553 4 .0024 .0000 .0000 .0000 .0000 .0299 1 0 DLI5 PSB001 .2516 .2319 2 .2319 4 .0010 .0000 .0000 .0000 .0000 .0318 1 0 DLI6 PSB001 .3658 .3658 2 .3478 4 .0011 .0000 .0000 .0000 .0000 .0327 1 0 DLI2 PSB001 91.8213 1.8717 2 14.8960 4 .0010 .0000 .0000 .0000 .0000 .0286 1 0 DLI3 PSB001 156.501 1.9866 2 18.3825 4 .0055 .0000 .0000 .0019 .0000 .0298 1 1 DLI5 PSB001 233.355 1.9771 2 21.3535 4 .0049 .0000 .0000 .0000 .0000 .0293 1 0 DLI1 PSB001 95.2870 1.9511 2 21.4463 4 .0050 .0000 .0000 .0018 .0000 .0288 1 1
Tip: IMS DBCTL users can collect DBCTL statistics in CMF performance class records by including the DFH$MCTD copy member in the monitoring control table (MCT) definition.
Chapter 3. Reports and extracts 67

Figure 3-6 Performance List Extended report options
Default report formatIn Figure 3-7, observe the columns of data in the Performance List Extended report. This shows the default format of the report when a Report Form is not specified. It details performance-related information for each transaction, sorted by transaction ID.
Figure 3-7 Performance List Extended default report format
Report tailoringYou can easily change the format of the Performance List Extended report by using a Report Form to include information to meet your specific reporting and analysis requirements. You can also tailor the sorting criteria by specifying up to three sort fields (ascending or descending) with (optionally) a limit on one. Many sample Report Forms of type LISTX are provided with CICS PA for this purpose. For more information about how to use Report Forms, see 2.10, “Tailoring report formats” on page 44.
Figure 3-8 shows how you can tailor the Performance List Extended report using a Report Form like the example in Figure 3-9. This example highlights bad response times for transactions that use DB2. This enables you to quickly analyze response time problems by identifying:
� The worst performing transactions� The CICS internal and external resource that may have caused the problem
REDBOOK - Performance List Extended Report Command ===> _________________________________________________________________ Specify report details and press Enter to perform validation. System Selection: Report Output: APPLID . . SCSCPAA5 + DDname . . . . . . . . . LSTX0001 Image . . ________ + Print Lines per Page . . ___ (1-255) Group . . ________ + Report Format: Form . . . BADDB2__ + Title . . ________________________________________________________________ ________________________________________________________________ Selection Criteria: _ Performance
Show the 20 worst response times for each transaction ID
V1R3M0 CICS Performance Analyzer Performance List Extended LSTX0001 Printed at 16:15:19 11/05/2002 Data from 11:10:29 11/04/2002 to 11:33:51 11/04/2002 Page 2
Tran SC Userid RSID Program TaskNo Stop Response Dispatch User CPU Suspend DispWait FC Wait FCAMRq IR WaitTime Time Time Time Time Time Time Time
AADD TO EUGENED DFHSAALL 136 11:19:42.186 .0011 .0010 .0010 .0001 .0000 .0000 0 .0000 AADD TO EUGENED DFHSAALL 137 11:19:46.796 .0022 .0021 .0012 .0001 .0000 .0000 0 .0000 AADD TP EUGENED DFHSAALL 138 11:19:53.578 .0023 .0022 .0013 .0001 .0000 .0000 0 .0000 AADD TO EUGENED DFHSAALL 183 11:21:29.153 .0022 .0022 .0012 .0001 .0000 .0000 0 .0000 AADD TP EUGENED DFHSAALL 184 11:21:36.124 .0023 .0022 .0013 .0001 .0000 .0000 0 .0000 ABRW TO CICSLS DFHSABRW 206 11:24:12.124 .0052 .0021 .0021 .0031 .0000 .0000 0 .0030 ABRW TO EUGENED DFHSABRW 53 11:11:57.251 .5819 .0783 .0121 .5037 .0127 .0000 0 .4908 ABRW TP EUGENED DFHSABRW 59 11:12:55.460 .0070 .0034 .0029 .0036 .0000 .0000 0 .0036 ABRW TP EUGENED DFHSABRW 61 11:12:58.275 .0080 .0028 .0024 .0052 .0000 .0000 0 .0051 ABRW TP EUGENED DFHSABRW 62 11:12:59.332 .0064 .0027 .0023 .0036 .0000 .0000 0 .0036 ABRW TP EUGENED DFHSABRW 63 11:13:02.370 .0018 .0017 .0014 .0001 .0000 .0000 0 .0000 ABRW TO EUGENED DFH£ABRW 109 11:19:22.883 .0071 .0040 .0027 .0030 .0000 .0000 0 .0030
68 CICS Performance Analyzer

Figure 3-8 Performance List Extended tailored report: The worst performing DB2 transactions
Figure 3-9 Performance List Extended: LISTX Report Form
List ExportYou can also write your Performance List Extended report (unsorted) to an extract data set. You do this by using the Export facility with a LIST or LISTX Report Form to define the record layout. When LISTX is used, the sort is ignored. The EOX marker in the Report Form defines the end of the extract record. There is no limit on the record length, so you can export all available fields or a selection. For more information, see 3.9.2, “Export extract” on page 101.
V1R3M0 CICS Performance Analyzer Performance List Extended LSTX0001 Printed at 9:19:43 11/06/2002 Data from 12:10:51 11/04/2002 to 12:34:13 11/04/2002 Page 1Bad DB2 transaction response time Tran Response Userid Program Stop Dispatch User CPU Suspend DispWait DB2ConWt DB2ThdWT DB2 DB2SQLWt Time Time Time Time Time Time Time Time Reqs Time CRD4 114.574 JOHN CORD04P 12:26:25.765 4.9961 4.6084 109.578 3.7039 .0000 90.2326 9178 19.3442 CRD4 95.2259 STEVE CORD04P 12:26:04.243 5.1529 4.6320 90.0730 9.0971 .0000 .0000 8436 90.0727 CRD4 94.8672 CHRIS CORD04P 12:26:04.954 5.0842 4.6390 89.7829 8.0275 .0000 .0000 8574 89.7826 CRD4 93.6422 SHIRLEY CORD04P 12:26:01.425 5.1434 4.6228 88.4988 8.7084 .0000 .0000 8465 88.4984 CRD4 81.5987 DAVID CORD04P 12:22:21.938 4.9596 4.5885 76.6391 6.4075 .0000 .0000 8335 76.6388 CRD4 81.2668 KATH CORD04P 12:22:22.820 4.9766 4.5806 76.2901 6.3358 .0000 .0000 9346 76.2898 CRD4 80.0224 MIKE CORD04P 12:22:18.958 5.2067 4.6592 74.8158 6.0739 .0000 .0000 8690 74.8154 CRD4 38.3645 JAMES CORD04P 12:16:12.420 5.0326 4.6100 33.3319 5.4501 .0000 .0000 9124 33.3315 . . . CRD5 102.066 JOHN CORD05P 12:22:44.565 4.8183 4.4576 97.2478 4.4576 .0000 76.4557 6573 20.7892 CRD5 36.3721 CHRIS CORD05P 12:16:22.814 5.0605 4.5812 31.3116 4.4883 .0000 .0000 9102 31.3103 CRD5 23.2860 DAVID CORD05P 12:12:04.661 5.4456 4.6209 17.8404 3.9595 .0000 .0000 8221 17.7935 CRD5 1.0671 SHIRLEY CORD05P 11:49:21.077 .4447 .0405 .6223 .0037 .0000 .0000 1 .6192 CRD5 .6346 MIKE CORD05P 11:43:43.859 .1315 .0443 .5032 .3209 .0000 .0000 1 .1821 . . .
EDIT LISTX Report Form - BADDB2 Row 1 to 15 of 15 Command ===> ________________________________________________ Scroll ===> PAGE Description . . . . Bad DB2 transaction response____ Version (VRM): 620 Selection Criteria: _ Performance Field / Name + S Type Limit Description __ TRAN____ A _______ ________ Transaction identifier __ RESPONSE D _______ 20______ Transaction response time __ USERID__ * _______ ________ User ID __ PROGRAM_ _ _______ ________ Program name __ STOP____ * TIMET__ ________ Task stop time __ DISPATCH * TIME___ ________ Dispatch time __ CPU_____ * TIME___ ________ CPU time __ SUSPEND_ * TIME___ ________ Suspend time __ DISPWAIT * TIME___ ________ Redispatch wait time __ DB2CONWT _ TIME___ ________ DB2 Connection wait time __ DB2RDYQW _ TIME___ ________ DB2 Thread wait time __ DB2REQCT _ _______ ________ DB2 requests __ DB2WAIT_ _ TIME___ ________ DB2 SQL/IFI wait time __ EOR_____ _ _______ ________ ---------------- End of Report -------------- __ EOX_____ _ _______ ________ ---------------- End of Extract -------------
Sort the list by Tran ID, then descending response time
For each Tran ID, show only the worst 20
Include DB2 monitoring fields
Chapter 3. Reports and extracts 69

3.3.3 Performance Summary reportThe Performance Summary report provides a summary of the CMF performance class records. Figure 3-10 shows the options for this report.
Figure 3-10 Performance Summary report options
Default report formatObserve the columns of data in the Performance Summary report in Figure 3-11. This shows the default format of the report when a Report Form is not specified. It summarizes by transaction ID. The Task Count (#Tasks) shows the number of performance class records processed during the reporting period.
Figure 3-11 Performance Summary default report
Report tailoringUsing a Report Form, you can easily change the format of the Performance Summary report to display the performance-related data in which you are interested. You can also tailor the sorting criteria by specifying up to three sort fields (ascending). Clock and Count fields can be
REDBOOK - Performance Summary Report Command ===> _________________________________________________________________ System Selection: Report Output: APPLID . . SCSCPAA5 + DDname . . . . . . . . . SUMM0001 Image . . ________ + Print Lines per Page . . ___ (1-255) Group . . ________ + Report Format: Form . . . SUMBYATD + Title . . ________________________________________________________________ ________________________________________________________________ Processing Options: Reporting Options: Time Interval . . . 00:01:00 (hh:mm:ss) _ Exclude Totals Selection Criteria: _ Performance
Summarize by Application Tran ID within Tran ID by time of day
Specify time interval when summarizing by time of day (Start or Stop time)
V1R3M0 CICS Performance Analyzer Performance Summary SUMM0001 Printed at 7:06:59 10/28/2002 Data from 11:10:29 10/14/2002 to 08:10:06 10/26/2002 Page 1
Avg Max Avg Avg Avg Avg Avg Avg Avg Avg AvgTran #Tasks Response Response Dispatch User CPU Suspend DispWait FC Wait FCAMRq IR Wait SC24UHWM SC31UHWM
Time Time Time Time Time Time Time TimeAADD 5 .0035 .0108 .0019 .0014 .0015 .0001 .0006 0 .0000 934 0AADD 5 .0048 .0107 .0022 .0016 .0026 .0001 .0011 1 .0000 939 0AADD 5 .0330 .0945 .0303 .0035 .0028 .0027 .0000 1 .0000 979 0AADD 5 .0020 .0023 .0019 .0012 .0001 .0000 .0000 0 .0000 941 0AADD 18 .0115 .0945 .0099 .0020 .0016 .0008 .0003 1 .0000 949 0
ABRW 10 .0717 .6982 .0690 .0051 .0027 .0011 .0005 5 .0000 1011 0ABRW 424 .0504 10.3529 .0019 .0015 .0485 .0000 .0000 7 .0000 1007 1ABRW 1 .0052 .0052 .0021 .0021 .0031 .0000 .0000 0 .0030 976 0ABRW 284 .1928 36.6088 .0017 .0014 .1911 .0000 .0000 7 .0000 1008 0ABRW 191 .0182 2.9981 .0017 .0014 .0165 .0000 .0000 7 .0000 1008 0ABRW 5 .1210 .5819 .0178 .0042 .1032 .0026 .0000 0 .1006 1021 0ABRW 57 .0070 .0156 .0033 .0022 .0037 .0000 .0000 0 .0036 1005 0ABRW 61 .0030 .0120 .0029 .0016 .0001 .0000 .0000 7 .0000 1008 0ABRW 1033 .0789 36.6088 .0027 .0015 .0762 .0000 .0000 6 .0007 1008 0
70 CICS Performance Analyzer

summarized statistically by requesting any of these functions: Average, Minimum, Maximum, Standard Deviation, and Total. Many sample Report Forms of type SUMMARY are provided with CICS PA for this purpose. For more information about how to use Report Forms, see 2.10, “Tailoring report formats” on page 44.
Figure 3-12 shows how you can tailor the Performance Summary report using a Report Form as the one shown in Figure 3-13. This example shows the performance data summarized by Application Naming transaction ID within transaction ID by time of day. Note the following points:
� Transaction activity is summarized for each one-minute interval. The time interval defaults to one minute, but you can override this value and specify a time interval anywhere from one second to 24 hours (rounded down by CICS PA to align to the hour or day). This is an option on the report. It allows you to use the one Report Form for multiple reports with different report intervals.
� CICS Application Naming support allows you to monitor the performance of individual application transaction IDs (or programs) selected from a menu and run under one menu transaction ID. This is achieved by defining the field APPLTRAN (or APPLPROG) in the Report Form. This data is available under certain circumstances. For more information, see Chapter 14, “Application Naming support” on page 311.
Figure 3-12 Performance Summary report: Application Naming summarized by time of day
V1R3M0 CICS Performance Analyzer Performance Summary SUMM0001 Printed at 14:31:26 10/30/2002 Data from 11:07:20 10/30/2002 to 11:09:37 10/30/2002 Page 1Summary by Application Transaction ID within Transaction ID by Time-of-Day Avg Max Avg Avg Avg Avg Avg Avg MaxStop Tran Tran #Tasks Response Response Dispatch User CPU Suspend Suspend DispWait IR Wait IR WaitInterval Time Time Time Time Time Count Time Time Time11:07:00 MENU NAME 1 .0246 .0246 .0243 .0035 .0003 3 .0003 .0000 .000011:07:00 1 .0246 .0246 .0243 .0035 .0003 3 .0003 .0000 .0000
11:08:00 MENU PAYR 4 .0007 .0007 .0007 .0006 .0000 1 .0000 .0000 .000011:08:00 MENU QPAY 6 .0007 .0008 .0007 .0005 .0000 1 .0000 .0000 .000011:08:00 MENU TAXQ 12 .0008 .0010 .0008 .0006 .0000 1 .0000 .0000 .000011:08:00 MENU UTXC 1 .0007 .0007 .0007 .0006 .0000 1 .0000 .0000 .000011:08:00 23 .0008 .0010 .0007 .0006 .0000 1 .0000 .0000 .0000
11:09:00 MENU NAME 1 .0008 .0008 .0008 .0005 .0000 1 .0000 .0000 .000011:09:00 MENU PAYR 11 .0007 .0009 .0007 .0006 .0000 1 .0000 .0000 .000011:09:00 MENU QPAY 5 .0009 .0013 .0009 .0006 .0000 1 .0000 .0000 .000011:09:00 MENU TAXQ 2 .0007 .0007 .0006 .0006 .0000 1 .0000 .0000 .000011:09:00 MENU UTXC 6 .0007 .0008 .0007 .0006 .0000 1 .0000 .0000 .000011:09:00 25 .0008 .0013 .0007 .0006 .0000 1 .0000 .0000 .0000
Chapter 3. Reports and extracts 71

Figure 3-13 Performance Summary: SUMMARY Report Form
Summary ExportYou can also write your Performance Summary report to an extract data set. You can do this by using the Export facility with a SUMMARY Report Form to define the record layout and summarization criteria. The EOX marker in the Report Form defines the end of the extract record. There is no limit on the record length, so you can export all available fields or a selection. For more information, see 3.9.2, “Export extract” on page 101.
3.3.4 Performance Totals reportThe Performance Totals report (Figure 3-14) provides a comprehensive analysis of the resource usage of your CICS system. You can use this report to gain a system-wide perspective of CICS system performance. Alternatively, you can use selection criteria to narrow the scope of the report. For example, you can specify, “Show me the resource usage for a particular group of transaction IDs or a single transaction ID or a single task number”.
EDIT SUMMARY Report Form - SUMBYATD Row 1 to 15 of 15 Command ===> ________________________________________________ Scroll ===> CSR_ Description . . . . Summary by Application Tran ID__ Version (VRM): 620 Selection Criteria: _ Performance Field / Name + S Type Fn Description _ STOP____ A TIMES__ ___ Task stop time _ TRAN____ A _______ ___ Transaction identifier _ APPLTRAN A _______ ___ Application naming Tran ID _ TASKCNT_ _______ ___ Total Task count _ RESPONSE _______ AVE Transaction response time _ RESPONSE _______ MAX Transaction response time _ DISPATCH TIME___ AVE Dispatch time _ CPU_____ TIME___ AVE CPU time _ SUSPEND_ TIME___ AVE Suspend time _ SUSPEND_ COUNT__ AVE Suspend time _ DISPWAIT TIME___ AVE Redispatch wait time _ IRWAIT__ TIME___ AVE MRO link wait time _ IRWAIT__ TIME___ MAX MRO link wait time _ EOR_____ _______ ___ ---------------- End of Report ---------------- _ EOX_____ _______ ___ ---------------- End of Extract ---------------
Summarize by Stop time, Tran ID and Application Tran ID
Five statistical functions are available
72 CICS Performance Analyzer
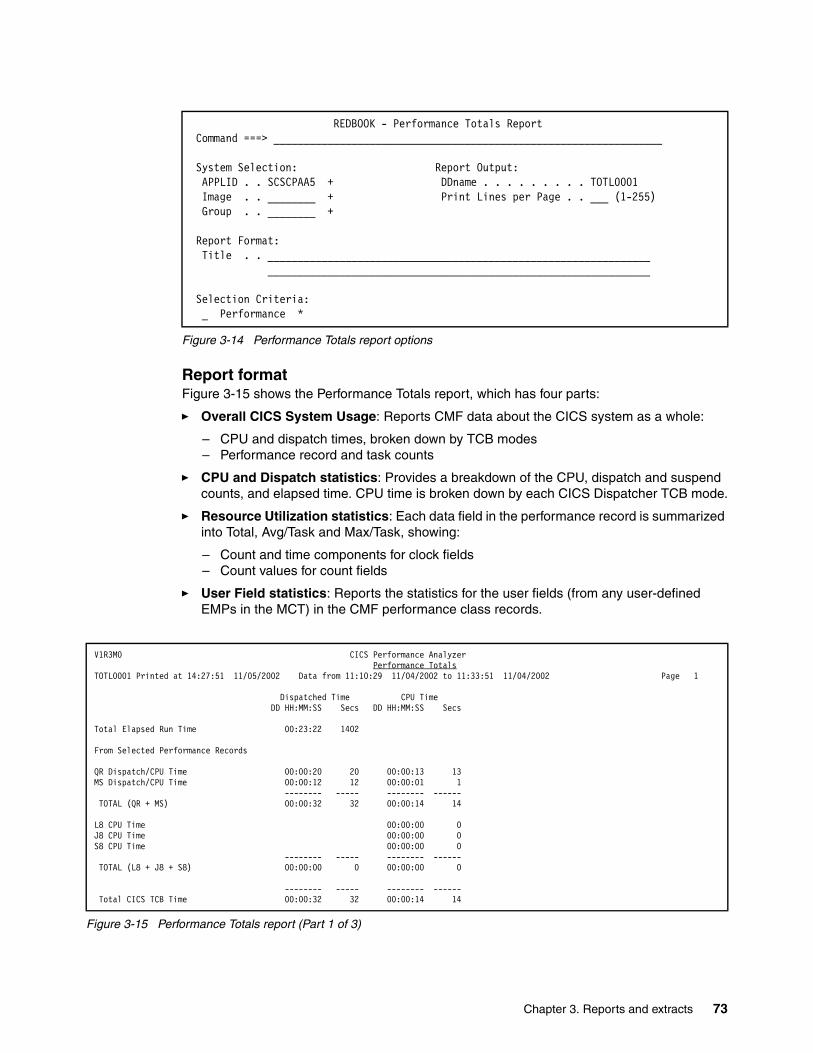
Figure 3-14 Performance Totals report options
Report formatFigure 3-15 shows the Performance Totals report, which has four parts:
� Overall CICS System Usage: Reports CMF data about the CICS system as a whole:
– CPU and dispatch times, broken down by TCB modes– Performance record and task counts
� CPU and Dispatch statistics: Provides a breakdown of the CPU, dispatch and suspend counts, and elapsed time. CPU time is broken down by each CICS Dispatcher TCB mode.
� Resource Utilization statistics: Each data field in the performance record is summarized into Total, Avg/Task and Max/Task, showing:
– Count and time components for clock fields– Count values for count fields
� User Field statistics: Reports the statistics for the user fields (from any user-defined EMPs in the MCT) in the CMF performance class records.
Figure 3-15 Performance Totals report (Part 1 of 3)
REDBOOK - Performance Totals Report Command ===> _________________________________________________________________ System Selection: Report Output: APPLID . . SCSCPAA5 + DDname . . . . . . . . . TOTL0001 Image . . ________ + Print Lines per Page . . ___ (1-255) Group . . ________ + Report Format: Title . . ________________________________________________________________ ________________________________________________________________ Selection Criteria: _ Performance *
V1R3M0 CICS Performance Analyzer Performance Totals TOTL0001 Printed at 14:27:51 11/05/2002 Data from 11:10:29 11/04/2002 to 11:33:51 11/04/2002 Page 1
Dispatched Time CPU Time DD HH:MM:SS Secs DD HH:MM:SS Secs
Total Elapsed Run Time 00:23:22 1402
From Selected Performance Records
QR Dispatch/CPU Time 00:00:20 20 00:00:13 13MS Dispatch/CPU Time 00:00:12 12 00:00:01 1 -------- ----- -------- ------ TOTAL (QR + MS) 00:00:32 32 00:00:14 14
L8 CPU Time 00:00:00 0J8 CPU Time 00:00:00 0S8 CPU Time 00:00:00 0 -------- ----- -------- ------ TOTAL (L8 + J8 + S8) 00:00:00 0 00:00:00 0
-------- ----- -------- ------ Total CICS TCB Time 00:00:32 32 00:00:14 14
Chapter 3. Reports and extracts 73

Figure 3-16 Performance Totals report (Part 2 of 3)
Total Performance Records (Type C) 338Total Performance Records (Type D) 36Total Performance Records (Type F) 0Total Performance Records (Type S) 0Total Performance Records (Type T) 270 -------- --------Total Performance Records (Selected) 644 Total Performance Records 644
V1R3M0 CICS Performance Analyzer Performance Totals TOTL0001 Printed at 14:27:51 11/05/2002 Data from 11:10:29 11/04/2002 to 11:33:51 11/04/2002 Page 2
...... C O U N T S ...... ........... T I M E ...........From Selected Performance Records Total Avg/Task Max/Task Total Avg/Task Max/Task
Dispatch Time 31294 48.6 3171 32 .049 9.349CPU Time 14 .022 2.343RLS CPU (SRB) Time 0 .000 .000Suspend Time 30921 48.0 3170 6587 10.229 1385.297Dispatch Wait Time 30650 47.6 3170 5 .008 1.165Dispatch Wait Time (QR Mode) 30223 46.9 3170 4 .006 1.086Response (-TCWait for Type C) 24 .070 2.139Response (All Selected Tasks) 5124 7.956 1386.703QR Dispatch Time 30831 47.9 3171 20 .030 3.705MS Dispatch Time 307 .5 64 12 .019 5.643RO Dispatch TimeQR CPU Time 13 .021 1.905MS CPU Time 1 .002 .438RO CPU TIMEL8 CPU Time 0 .000 .000J8 CPU Time 0 .000 .000S8 CPU Time 0 .000 .000
V1R3M0 CICS Performance Analyzer Performance Totals TOTL0001 Printed at 14:27:51 11/05/2002 Data from 11:10:29 11/04/2002 to 11:33:51 11/04/2002 Page 3
...... C O U N T S ...... ........... T I M E ...........From Selected Performance Records Total Avg/Task Max/Task Total Avg/Task Max/Task
FCWAIT File I/O wait time 293 .5 214 1 .002 .952RLSWAIT RLS File I/O wait time 1 .0 1 0 .000 .068TSWAIT VSAM TS I/O wait time 0 .0 0 0 .000 .000TSSHWAIT Asynchronous Shared TS wait time 0 .0 0 0 .000 .000JCWAIT Journal I/O wait time 12 .0 1 0 .000 .025TDWAIT VSAM transient data I/O wait time 0 .0 0 0 .000 .000
IRWAIT MRO link wait time 429 .7 7 9 .013 3.734
CFDTWAIT CF Data Table access requests wait time 0 .0 0 0 .000 .000CFDTSYNC CF Data Table syncpoint wait time 0 .0 0 0 .000 .000 ...... ......TCMSGIN1 Messages received count 537 .8 2TCCHRIN1 Terminal characters received count 6996 10.9 225TCMSGOU1 Messages sent count 541 .8 2TCCHROU1 Terminal characters sent count 358311 556.4 1865 ...... ......TCM62IN2 LU6.2 messages received count 0 .0 0TCC62IN2 LU6.2 characters received count 0 .0 0TCM62OU2 LU6.2 messages sent count 0 .0 0TCC62OU2 LU6.2 characters sent count 0 .0 0
FCADD File ADD requests 0 .0 0FCBROWSE File Browse requests 6556 10.2 1767FCDELETE File DELETE requests 0 .0 0FCGET File GET requests 177 .3 137FCPUT File PUT requests 0 .0 0
74 CICS Performance Analyzer

Figure 3-17 Performance Totals report (Part 3 of 3)
3.3.5 Wait Analysis reportThe Wait Analysis report provides a breakdown of wait activity by transaction ID (or other ordering fields). You can see at a glance which CICS resources are causing your transactions to be suspended. This report can help you to quickly identify the possible source of a performance response time problem. Figure 3-18 shows the options for this report.
Figure 3-18 Wait Analysis report options
Report formatFigure 3-19 shows the Wait Analysis (Bottleneck) report. The Wait Analysis report has two sections.
V1R3M0 CICS Performance Analyzer Performance Totals TOTL0001 Printed at 14:27:51 11/05/2002 Data from 11:10:29 11/04/2002 to 11:33:51 11/04/2002 Page 4
...... C O U N T S ...... ........... T I M E ...........From Selected User Records Total Avg/Task Max/Task Total Avg/Task Max/Task
TEST TEST S001 54 .1 1 20 .032 1.329TEST TEST S002 54 .1 1 0 .000 .002RMITOTAL ECPRMI A001 0 .0 0RMIOTHER ECPRMI A002 0 .0 0RMIDB2 ECPRMI A003 0 .0 0RMIDBCTL ECPRMI A004 0 .0 0RMIEXDLI ECPRMI A005 0 .0 0RMIMQM ECPRMI A006 0 .0 0RMITCPIP ECPRMI A007 0 .0 0ICTOTAL IC A001 0 .0 0ASKTIME IC A002 0 .0 0CANCEL IC A003 0 .0 0DELAY IC A004 0 .0 0INTERVAL IC A005 0 .0 0POST IC A006 0 .0 0RETRIEVE IC A007 0 .0 0START IC A008 0 .0 0
REDBOOK - Wait Analysis Report Command ===> _________________________________________________________________ System Selection: Report Output: APPLID . . SCSCPAA5 + DDname . . . . . . . . . WAIT0001 Image . . ________ + Print Lines per Page . . ___ (1-255) Group . . ________ + Order by: 1 . . ________ + 2 . . ________ + 3 . . ________ + Processing Options: Time Interval . . . ________ (hh:mm:ss) Report Format: Title . . ________________________________________________________________ ________________________________________________________________ Selection Criteria: _ Performance *
Chapter 3. Reports and extracts 75

The first section provides a summary of common performance metrics, including number of Tasks, Response Time, Dispatch Time, CPU Time, Suspend Wait Time, Dispatch Wait Time, RMI Elapsed Time, and RMI Suspend Time.
The ratio calculations on the right are particularly useful to see at a glance a possible direction to look where the response/wait times are bad. In particular, observe that:
� CPU Time is shown as a percentage of Dispatch Time. This may indicate a possible lack of CPU.
� Dispatch Wait Time is shown as a percentage of Suspend Time. This may also indicate a lack of CPU or that another task is consuming the QR TCB. For example, if the Dispatch Wait Time was a significant amount of the Suspend Time, that indicates that the task is ready for dispatch but cannot for some reason.
The second section provides a detailed breakdown of suspend time by component, such as dispatch wait, file wait, and so on. Components are reported in descending wait time order, thereby ensuring that the primary cause of task wait is at the top of the list.
You can sort the report by up to three fields. The default is to summarize by transaction ID.
Figure 3-19 Wait Analysis report
V1R3M0 CICS Performance Analyzer Wait Analysis Report WAIT0001 Printed at 16:02:13 8/06/2003 Data from 08:06:06 8/05/2003 to 08:13:33 8/05/2003 Page 1 ------------------------------------------------------------------------------------------------------------------------------------ Tran=CATA Start=08:00:00 Program=CATAPROG Interval=08:00:00 Summary Data -------- Time --------- ------ Count ------ ------ Ratio ------ Total Average Total Average # Tasks 1 Response Time 0.0038 0.0038 Dispatch Time 0.0022 0.0022 3 3.0 59.5% of Response CPU Time 0.0016 0.0016 3 3.0 70.0% of Dispatch Suspend Wait Time 0.0015 0.0015 3 3.0 40.0% of Response Dispatch Wait Time 0.0000 0.0000 2 2.0 1.1% of Suspend Resource Manager Interface (RMI) elapsed time 0.0001 0.0001 4 4.0 2.1% of Response Resource Manager Interface (RMI) suspend time 0.0000 0.0000 0 0.0 0.0% of Suspend Suspend Detail ------------------- Suspend Time ------------------- ----- Count ----- Total Average %age Graph Total Average N/A Other Wait Time 0.0014 0.0014 92.6% |****************** 2 2.0 DSPDELAY First dispatch wait time 0.0001 0.0001 7.4% |* 1 1.0 ------------------------------------------------------------------------------------------------------------------------------------ Tran=XVOJ Start=08:00:00 Program=XVOJPROG Interval=08:00:00 Summary Data -------- Time --------- ------ Count ------ ------ Ratio ------ Total Average Total Average # Tasks 261 Response Time 28.1101 0.1077 Dispatch Time 3.2940 0.0126 10578 40.5 11.7% of Response CPU Time 2.4824 0.0095 10578 40.5 75.4% of Dispatch Suspend Wait Time 24.8144 0.0951 10578 40.5 88.3% of Response Dispatch Wait Time 2.9375 0.0113 10317 39.5 11.8% of Suspend Resource Manager Interface (RMI) elapsed time 17.0496 0.0653 11365 43.5 60.7% of Response Resource Manager Interface (RMI) suspend time 16.8430 0.0645 10255 39.3 67.9% of Suspend Suspend Detail ------------------- Suspend Time ------------------- ----- Count ----- Total Average %age Graph Total Average IMSWAIT IMS (DBCTL) wait time 13.6869 0.0524 55.2% |*********** 9781 37.5 DSPDELAY First dispatch wait time 4.8588 0.0186 19.6% |*** 261 1.0 TCLDELAY > First dispatch TCLSNAME wait time 4.7523 0.0182 19.2% |*** 56 0.2 IRIOWTT MRO link wait time 3.0935 0.0119 12.5% |** 59 0.2 DB2WAIT DB2 SQL/IFI wait time 3.0747 0.0118 12.4% |** 389 1.5 N/A Other Wait Time 0.0828 0.0003 0.3% | 86 0.3 LMDELAY Lock Manager (LM) wait time 0.0177 0.0001 0.1% | 2 0.0
76 CICS Performance Analyzer

Recap reportThe Wait Analysis report is always followed by the Wait Analysis Recap report to provide a breakdown of the CMF input data. Figure 3-20 shows the Recap report. It provides an overview of system-wide wait time. All CMF suspend components are reported in descending wait time order, ensuring that the primary cause of system-wide task wait is at the top of the list.
The Recap report shows all wait clocks, and even clocks that accumulated no wait time. This allows you to see at a glance:
� All the individual suspend component clocks� Clocks that may be missing
Figure 3-20 Wait Analysis Recap report
3.3.6 Cross-System Work reportThe Cross-System Work report correlates CMF performance class data by network unit of work (UOW) ID for a single CICS system or multiple CICS systems. Figure 3-21 shows the report options.
To run the report for multiple systems, define them to a Group. Groups enable you to connect systems together for consolidated reporting. This is especially useful for MRO, advanced program-to-program communication (APPC), or other systems that share workloads. For information about how to do this, see “Groups this system belongs to” on page 33.
V1R3M0 CICS Performance Analyzer Wait Analysis Recap Report WAIT0001 Printed at 16:02:13 8/06/2003 Data from 08:06:06 8/05/2003 to 08:13:33 8/05/2003 Page 1 --------- Time -------- ------ Ratio ------ Total Average # Tasks 11768 Response Time 2156.6275 0.1833 Dispatch Time 136.3500 0.0116 6.3% of Response CPU Time 76.7092 0.0065 56.3% of Dispatch Suspend Wait Time 2020.1995 0.1717 93.7% of Response Dispatch Wait Time 52.9988 0.0045 2.6% of Suspend Resource Manager Interface (RMI) elapsed time 847.5371 0.0720 39.3% of Response Resource Manager Interface (RMI) suspend time 842.6671 0.0716 41.7% of Suspend ------------------- Suspend Time ------------------- Field Availability Total Average %age Graph Present Missing IRIOWTT MRO link wait time 835.9785 0.0710 41.4% |******** 11768 0 IMSWAIT IMS (DBCTL) wait time 477.9522 0.0406 23.7% |**** 11768 0 WTEXWAIT External ECB wait time 292.1129 0.0248 14.5% |** 11768 0 ICDELAY Interval Control (IC) wait time 275.9447 0.0234 13.7% |** 11768 0 DB2WAIT DB2 SQL/IFI wait time 70.8436 0.0060 3.5% | 11768 0 DSPDELAY First dispatch wait time 52.3120 0.0044 2.6% | 11768 0 TCLDELAY > First dispatch TCLSNAME wait time 46.5026 0.0040 2.3% | 11768 0 MXTDELAY > First dispatch MXT wait time 0.0000 N/C 0.0% | 11768 0 FCIOWTT File I/O wait time 8.1584 0.0007 0.4% | 11768 0 N/A Other Wait Time 3.0880 0.0003 0.2% | LU62WTT LU6.2 wait time 2.7382 0.0002 0.1% | 11768 0 WTCEWAIT CICS ECB wait time 0.5165 0.0000 0.0% | 11768 0 LMDELAY Lock Manager (LM) wait time 0.4619 0.0000 0.0% | 11768 0 TDIOWTT VSAM transient data I/O wait time 0.0530 0.0000 0.0% | 11768 0 GVUPWAIT Give up control wait time 0.0396 0.0000 0.0% | 11768 0 TCIOWTT Terminal wait for input time 0.0001 0.0000 0.0% | 11768 0 RQRWAIT Request Receiver wait Time 0.0000 0.0000 0.0% | 0 11768 TSIOWTT VSAM TS I/O wait time 0.0000 N/C 0.0% | 11768 0 ENQDELAY Local Enqueue wait time 0.0000 N/C 0.0% | 11768 0 DB2CONWT DB2 Connection wait time 0.0000 N/C 0.0% | 11768 0 DB2RDYQW DB2 Thread wait time 0.0000 N/C 0.0% | 11768 0
Chapter 3. Reports and extracts 77

Figure 3-21 Cross-System Work report options
Default report formatObserve the columns of data in the Cross-System Work report in Figure 3-22. This example shows the default format of the report when a Report Form is not specified. The default report includes only the performance class records that have the same network unit of work in multiple records (processing option 1).
Each line in the report is printed from a single CMF performance class record. Records that are part of the same network unit of work are printed sequentially in groups separated by a blank line.
The transaction Request Types are:
� AP: Application program request, including Distributed Program Link (DPL)
� FS: Function shipping request:
– File Control (F)– Interval Control (I)– Transient Data (D)– Temporary Storage (S)
� TR: Transaction routing request for Terminal-Owning Region (TOR)
REDBOOK - Cross-System Work Report Command ===> _________________________________________________________________ Specify report details and press Enter to perform validation. System Selection: Report Output: APPLID . . ________ + DDname . . . . . . . . . CROS0001 Image . . ________ + Print Lines per Page . . ___ (1-255) Group . . MROPROD_ + Processing Options: 1 1. UOWs with more than one record 2. UOWs with a single record 3. All UOWs Report Format: Form . . . ________ + Title . . ________________________________________________________________ ________________________________________________________________ Selection Criteria: _ Performance *
Specify a group of systems
78 CICS Performance Analyzer

Figure 3-22 Cross-System Work default report
Report tailoring (Cross-System Work Extended report)Using a Report Form, you can easily change the format of the report to produce the Cross-System Work Extended report showing only the performance-related data in which you are interested. Many sample Report Forms of type LIST or LISTX are provided with CICS PA for this purpose. For this report, a LISTX Form is used in the same way as a LIST Form. That is, the fields and the order of the columns are used, but the sort sequence is ignored. For more information about how to use Report Forms, see 2.10, “Tailoring report formats” on page 44.
Figure 3-23 shows the Cross-System Work Extended report, produced by specifying a LIST or LISTX Report Form including dispatch statistics. The records are sorted by:
� Network unit-of-work prefix (ascending)� Network unit-of-work suffix (ascending)� Syncpoint count concatenated with the task stop time (descending)� Generic APPLID (ascending)
Figure 3-23 Cross-System Work Extended tailored to shows dispatch statistics
V1R3M0 CICS Performance Analyzer Cross-System Work CROS0001 Printed at 12:09:28 10/27/2002 Data from 11:10:51 10/24/2002 to 08:10:28 10/26/2002 Page 3
Request Fcty Conn UOW R Response ATran Userid SC TranType Term LUName Type Program T/Name Name NETName Seq APPLID Task T Stop Time Time B
ABRW EUGENED TP U S23D SCSC23D AP: DFHúABRW T/S23D USIBMSC.SCSC23D 1 SCSCPAA5 61 T 11:13:20.275 .0080CSMI CICSLS TO UM R11 SCSCPAA5 FS:F--- DFHMIRS T/R11 CJB1 USIBMSC.SCSC23D 1 SCSCPAA5 57 T 11:13:20.274 .0044
ABRW EUGENED TP U S23D SCSC23D AP: DFHúABRW T/S23D USIBMSC.SCSC23D 1 SCSCPAA5 62 T 11:13:21.332 .0064CSMI CICSLS TO UM R11 SCSCPAA5 FS:F--- DFHMIRS T/R11 CJB1 USIBMSC.SCSC23D 1 SCSCPAA5 58 T 11:13:21.331 .0039
CEDA EUGENED TO U S23D SCSC23D AP: DFHEDAP T/S23D USIBMSC.SCSC23D 3 SCSCPAA5 72 T 11:16:28.284 1.1025CEDA EUGENED TO U S23D SCSC23D AP: DFHEDAP T/S23D USIBMSC.SCSC23D 1 SCSCPAA5 72 C 11:16:27.181 3.0046CEDA EUGENED TO U S23D SCSC23D AP: DFHEDAP T/S23D USIBMSC.SCSC23D 1 SCSCPAA5 72 C 11:16:24.177 2.2127CEDA EUGENED TO U S23D SCSC23D AP: DFHEDAP T/S23D USIBMSC.SCSC23D 1 SCSCPAA5 72 C 11:16:21.964 46.5125CEDA EUGENED TO U S23D SCSC23D AP: DFHEDAP T/S23D USIBMSC.SCSC23D 1 SCSCPAA5 72 C 11:15:35.451 .6794
RMST EUGENED TO U S23D SCSC23D TR:CJB3 T/S23D USIBMSC.SCSC23D 1 SCSCPAA5 178 T 11:22:38.447 48.9210STAT CICSLS TO U R11 SCSCPAA5 AP: DFH0STAT S/S23D CJB1 USIBMSC.SCSC23D 1 SCSCPAA5 349 T 11:22:38.433 66.7720RMST EUGENED TO U S23D SCSC23D TR:CJB3 T/S23D USIBMSC.SCSC23D 1 SCSCPAA5 178 C 11:21:49.526 10.0524RMST EUGENED TO U S23D SCSC23D TR:CJB3 T/S23D USIBMSC.SCSC23D 1 SCSCPAA5 178 C 11:21:39.473 7.8027RMST EUGENED TO U S23D SCSC23D TR:CJB3 T/S23D USIBMSC.SCSC23D 1 SCSCPAA5 178 C 11:21:31.671 .0110
STAT EUGENED TO U S23D SCSC23D AP: DFH0STAT T/S23D USIBMSC.SCSC23D 1 SCSCPAA5 195 T 11:22:52.663 2.0203STAT EUGENED TO U S23D SCSC23D AP: DFH0STAT T/S23D USIBMSC.SCSC23D 1 SCSCPAA5 195 C 11:22:50.642 8.9745
V1R3M0 CICS Performance Analyzer Cross-System Work Extended CROS0001 Printed at 0:56:39 10/23/2002 Data from 15:41:19 10/12/2002 to 16:19:15 10/12/2002 Page 1 Tran Response Userid TaskNo Stop Response Dispatch Dispatch User CPU Suspend Suspend DispWait DispWait IR Wait Time Time Time Time Count Time Time Count Time Count Time CPLT .3939 CICSUSER 6 15:41:19.419 .3939 .0782 3 .0325 .3158 3 .3149 2 .0000 CSSY 71.4053 CICSUSER III 15:42:30.828 71.4053 46.9670 401 17.6543 24.4382 401 9.9254 400 .0000 CSSY 4.9137 CICSUSER 12 15:41:24.346 4.9137 .4928 66 .0476 4.4209 66 2.5618 65 .0000 CSSY 5.3932 CICSUSER 10 15:41:24.822 5.3932 .8932 59 .2172 4.4999 59 2.7531 58 .0000 CSSY 5.6419 CICSUSER 9 15:41:25.069 5.6419 1.6045 75 .1472 4.0374 75 2.9273 74 .0000 CSSY 5.9801 CICSUSER 13 15:41:25.434 5.9801 .7826 87 .1627 5.1975 87 3.3042 86 .0000 CSSY 2.9653 CICSUSER 14 15:41:22.420 2.9653 1.2597 14 .0555 1.7056 14 .0393 13 .0000 CSSY .4372 CICSUSER 15 15:41:19.898 .4372 .0037 1 .0034 .4335 1 .0000 0 .0000 CSSY .5093 CICSUSER 16 15:41:19.977 .5093 .0065 3 .0084 .5028 3 .0103 2 .0000 CGRP 5.4980 CICSUSER 11 15:41:24.928 5.4980 .7931 69 .0613 4.7049 69 3.7141 68 .0000
Chapter 3. Reports and extracts 79

Cross-System Work extractYou can also request a Cross-System Work extract. This extract combines CMF performance class records that belong to the same network unit of work into a single CMF-format record to provide a complete view of a transaction’s CICS resource usage. You can then use the extract as input to CICS PA to produce any of the reports and extracts. For more information, see 3.9.1, “Cross-System Work extract” on page 99.
3.3.7 Transaction Group reportThe Transaction Group report is used to help you understand the correlation of the performance class records that are attached in a CICS assigned transaction group.
The Transaction Group ID (TRNGRPID) is assigned internally by CICS at transaction attach time. CICS PA uses this ID to correlate the transactions belonging to the same work request, such as the CWXN (Web Attach) and CWBA (Alias transaction). Figure 3-24 shows the report options.
Figure 3-24 Transaction Group report options
Report formatFigure 3-25 shows the format of the Transaction Group report. The Origin field can help you understand the flow of transactions through a CICS system when applied to transaction requests that originate through:
� CICS Web Support (CWS)� Internet Inter-ORB Protocol (IIOP)� External Call Interface (ECI) over TCP/IP� 3270 Bridge “two-task model”
The detailed report is followed by a Summary report that summarizes and groups the transactions by their origin.
REDBOOK - Transaction Group Report Command ===> _________________________________________________________________ System Selection: Report Output: APPLID . . SCSCPAA5 + DDname . . . . . . . . . TRGP0001 Image . . ________ + Print Lines per Page . . ___ (1-255) Group . . ________ + Processing Options: 1 1. Groups of more than one record 2. Groups of a single record 3. All Groups Report Format: Title . . ________________________________________________________________ ________________________________________________________________ Selection Criteria: _ Performance
80 CICS Performance Analyzer

Figure 3-25 Transaction Group report
3.3.8 BTS reportThe BTS report provides a detailed report of the transactions performed by the same or different CICS systems on behalf of a single CICS BTS process. Figure 3-26 shows the report options.
Figure 3-26 BTS report options
V1R3M0 CICS Performance Analyzer Transaction Group TRGP0001 Printed at 11:46:14 10/24/2002 Data from 11:10:29 10/14/2002 to 08:10:06 10/16/2002 Page 14
Brdg Client Request Fcty Conn R ResponseTran Userid SC Origin Tran IP Address Type Program Term LUName T/Name Name APPLID Task T Stop Time Time
CWBA CICSLS U WEB 9.20.45.17 AP: DFHWBTTA SCSCPAA5 618 T 11:30:11.51 .0385CWXN CICSLS U SOCKET 9.20.45.17 AP: DFHWBXN SCSCPAA5 617 T 11:30:11.47 .2545
CWBA CICSLS U WEB 9.20.45.17 AP: DFHWBTTA SCSCPAA5 620 T 11:30:21.67 .0289CWXN CICSLS U SOCKET 9.20.45.17 AP: DFHWBXN SCSCPAA5 619 T 11:30:21.65 .3538
CWBA CICSLS U WEB 9.20.45.17 AP: DFHWBTTA SCSCPAA5 622 T 11:30:29.44 1.4267CWXN CICSLS U SOCKET 9.20.45.17 AP: DFHWBXN SCSCPAA5 621 T 11:30:28.02 .3097
CWBA CICSLS U WEB 9.20.45.17 AP: DFHWBTTA SCSCPAA5 624 T 11:30:34.63 1.1731CWXN CICSLS U SOCKET 9.20.45.17 AP: DFHWBXN SCSCPAA5 623 T 11:30:33.46 .2828
CEDA CICSLS TO BRIDGE CWBA AP: DFHEDAP }AAJ }AAJ B/}AAJ SCSCPAA5 627 T 11:31:26.83 43.9778CWBA CICSLS U WEB 9.20.45.17 AP: DFHWBTTA SCSCPAA5 626 T 11:30:43.18 .3228CWXN CICSLS U SOCKET 9.20.45.17 AP: DFHWBXN SCSCPAA5 625 T 11:30:42.85 .0023
V1R3M0 CICS Performance Analyzer Transaction Group - Summary TRGP0001 Printed at 11:46:14 10/24/2002 Data from 11:10:29 10/14/2002 to 08:10:06 10/16/2002 Page 16
Origin Average Average Average Average Average Average Average Average Average Type Transactions Response Dispatch CPU Time Suspend DispWait IR Wait RMI Susp FC Wait SO Wait
BRIDGE 17 10.140 .000 .000 .010 .000 .000 .000 .000 .000MRO SESS 163 .634 .000 .000 .001 .000 .001 .000 .000 .000NONE 69 362.022 .301 .000 .061 .000 .000 .000 .000 .000SCHEDULE 62 .280 .000 .000 .000 .000 .000 .000 .000 .000SOCKET 50 44.630 .000 .000 .045 .000 .000 .000 .000 .045START 28 .261 .000 .000 .000 .000 .000 .000 .000 .000TDQUEUE 23 .012 .000 .000 .000 .000 .000 .000 .000 .000TERM START 17 .011 .000 .000 .000 .000 .000 .000 .000 .000TERMINAL 1818 2.468 .000 .000 .002 .000 .000 .000 .000 .000WEB 60 .154 .000 .000 .000 .000 .000 .000 .000 .000XM RUN 16 .424 .000 .000 .000 .000 .000 .000 .000 .000 ------------ -------- -------- -------- -------- -------- -------- -------- -------- --------TOTAL 2323 13.781 .009 .000 .005 .000 .000 .000 .000 .001
REDBOOK - BTS Report Command ===> _________________________________________________________________ System Selection: Report Output: APPLID . . SCSCPAA5 + DDname . . . . . . . . . CBTS0001 Image . . ________ + Print Lines per Page . . ___ (1-255) Group . . ________ + Report Format: Title . . ________________________________________________________________ ________________________________________________________________ Selection Criteria: _ Performance
Chapter 3. Reports and extracts 81

Report formatFigure 3-27 shows the format of the BTS report. The BTS report is similar to the Cross-System Work and Transaction Group reports in that it is a detailed report. However, this report shows the correlation of the transactions performed by the same or different CICS systems on behalf of a single CICS BTS process (root activity ID).
The records are sorted by:
� BTS Process ID (Root Activity ID)� Transaction Sequence Number� Transaction Stop Time (ascending order)
Figure 3-27 BTS report
3.3.9 Workload Activity reportThe Workload Activity report provides a detailed list, summary, or list and summary of the segments of work (transactions) performed by the same or different CICS systems through transaction routing, function shipping, or distributed transaction processing on behalf of a single network unit of work. Figure 3-28 shows the report options.
V1R3M0 CICS Performance Analyzer CICS Business Transaction Services (BTS) CBTS0001 Printed at 11:43:56 10/24/2002 Data from 11:10:29 10/14/2002 to 08:10:06 10/16/2002 Page 1
Process Pro/Act Cont'er Event R ResponseTran SC TranType Process Name Type Activity Name Reqs Reqs Reqs Task T Stop Time Time
SAL1 TP U 2 2 0 211 T 11:18:25.27 .1222
SAL1 TP U 2 2 0 239 T 11:19:18.33 .1835
PAY1 TP U 2 0 0 294 T 11:19:42.20 .1390
PAY1 TP U 2 0 0 305 T 11:19:57.64 .0747
RED1 U U R SALES111111 ORDER CREDIT-CHECK 0 2 1 176 T 11:17:32.05 .5333STOC U U R SALES111111 ORDER STOCK-CHECK 0 2 1 177 T 11:17:32.05 .5145SALE U U R SALES111111 ORDER DFHROOT 10 5 4 175 T 11:17:32.05 .5675INV1 U U SALES111111 ORDER INVOICE-BUILD 0 1 1 178 T 11:17:32.09 .0359DEL1 U U SALES111111 ORDER DELIV-NOTE 0 1 1 179 T 11:17:33.29 1.2323SALE U U SALES111111 ORDER DFHROOT 0 0 0 180 T 11:17:33.31 1.2198SALE U U SALES111111 ORDER DFHROOT 1 3 2 183 T 11:17:33.37 .0800SALE U U SALES111111 ORDER DFHROOT 1 3 5 184 T 11:17:33.42 .0519SALE U U SALES111111 ORDER DFHROOT 2 2 1 186 T 11:17:38.65 .0566REM1 U U SALES111111 ORDER SEND-REMINDER 0 1 1 187 T 11:17:38.68 .0243
82 CICS Performance Analyzer

Figure 3-28 Workload Activity report options
Report formatFigure 3-29 shows the Workload Activity report. This report highlights the MVS Workload Manager (WLM) service class and report class, and WLM reporting and completion phase (BTE or EXE) used for each transaction.
The Workload Activity Summary report summarizes response time by WLM service and report classes. The statistics it provides are Average, Standard Deviation, nn% Peak, and Maximum.
Figure 3-29 Workload Activity report
REDBOOK - Workload Activity Report Command ===> _________________________________________________________________ System Selection: Report Output: APPLID . . SCSCPAA5 + DDname . . . . . . . . . WKLD0001 Image . . ________ + Print Lines per Page . . ___ (1-255) Group . . ________ + Reports Required: Processing Options: _ List Peak Percentile . . . 90_ (50-100) / Summary _ Include EXE Y tasks Report Format: Title . . ________________________________________________________________ ________________________________________________________________ Selection Criteria: _ Performance
V1R3M0 CICS Performance Analyzer Workload Manager Activity List WKLD0001 Printed at 12:33:47 10/25/2002 Data from 13:31:17 10/24/2002 to 13:32:08 10/24/2002 Page 1
Request Fcty Conn Service Report R Response ATran Userid SC TranType Term LUName Type Program T/Name Name Class Class APPLID Task T P C Stop Time Time B
WROS CICSLS TP U 0081 LE000081 TR:IRA1 T/0081 STM4IRT1 69693 T BTE 13:31:34.99 13.4729WROS CICSLS TP U <ADQ STM4IRT1 AP: CRWWPPOS S/0081 IRT1 STM4IRA1 34695 T EXE Y 13:31:34.34 11.2956
TPME CICSLS TP U 0081 LE000081 AP: CRWWPAMU T/0081 STM4IRT1 70004 T BTE 13:31:36.90 1.5024
WRNO CICSLS TP U 0081 LE000081 TR:IRA1 T/0081 STM4IRT1 70078 T BTE 13:31:46.15 7.3057WRNO CICSLS TP U <ACY STM4IRT1 AP: CRWWPPNO S/0081 IRT1 STM4IRA1 34869 T EXE Y 13:31:45.87 7.0220
V1R3M0 CICS Performance Analyzer Workload Manager Activity Summary by Service ClassWKLD0001 Printed at 14:09:35 10/21/2002 Data from 10:49:57 10/20/2002 to 10:57:47 10/20/2002 Page 83
Service -------------- Response Time --------------Class APPLID Phase #Tasks Average Std Dev 90% Peak Maximum
*Other* STM4IRA1 BTE 105 .0009 .0007 .0018 .0072 STM4IRA2 BTE 174 .0008 .0002 .0010 .0019 STM4IRT0 BTE 589 1.1839 8.8946 12.5868 135.009 STM4IRT1 BTE 551 1.7020 9.7902 14.2531 133.831 STM4IRT2 BTE 570 2.1656 13.4634 19.4257 176.251 STM4IRT3 BTE 570 1.4052 9.6969 13.8366 149.703 STM4IRT4 BTE 570 1.4656 8.0848 11.8303 135.889 STM4IRT5 BTE 570 2.3631 14.1819 20.5443 179.756
Chapter 3. Reports and extracts 83

3.4 Exception reportsThe Exception reports are:
� Exception List� Exception Summary
3.4.1 Exception List reportThe Exception List report provides detailed analysis of the exception class records collected by the CICS Monitoring Facility (CMF). Figure 3-30 shows the report options.
Figure 3-30 Exception List report options
Report formatFigure 3-31 shows an example of the Exception List report. The Exception List report provides two types of information:
� The cause of the exception condition
� The information necessary to relate this record to the performance class record on the Performance List report
Figure 3-31 Exception List report
REDBOOK - Exception List Report Command ===> _________________________________________________________________ System Selection: Report Output: APPLID . . SCSCPAA5 + DDname . . . . . . . . . XLST0001 Image . . ________ + Print Lines per Page . . ___ (1-255) Group . . ________ + Report Format: Title . . ________________________________________________________________ ________________________________________________________________ Selection Criteria: _ Exception *
V1R3M0 CICS Performance Analyzer Exception List XLST0001 Printed at 9:51:50 10/22/2002 Data from 08:08:15 10/16/2002 APPLID SCSCPAA5 Page 1
Tran Service Report Exp ..... Time ..... Current Resource ExceptionTran Term LUName Userid SC Class Class Class Taskno Seq Start Elapsed Program Type Resource ID Type
ABRW P045 SCSCP045 CICSLS TP 834 1 08:08:15 10.189 DFHúABRW FILE FILEA STRINGABRW S205 SCSC205 EUGENED TP 835 1 08:08:25 7.245 DFHúABRW FILE FILEA STRINGABRW S220 SCSC220 EUGENED TP 837 1 08:08:30 2.996 DFHúABRW FILE FILEA STRINGCECI S220 SCSC220 EUGENED TO 1151 1 08:11:48 .005 DFHECID TEMPSTOR CACA BUFFERCECI S220 SCSC220 EUGENED TO 1151 2 08:11:48 .002 DFHECID TEMPSTOR CACA BUFFERCECI S220 SCSC220 EUGENED TO 1151 3 08:11:48 .002 DFHECID TEMPSTOR CACA BUFFERCECI P045 SCSCP045 CICSLS TO 1149 1 08:11:48 .004 DFHECID TEMPSTOR LONGTSNAME BUFFERCECI P045 SCSCP045 CICSLS TO 1149 2 08:11:48 .004 DFHECID TEMPSTOR LONGTSNAME BUFFERCECI P045 SCSCP045 CICSLS TO 1149 3 08:11:48 .002 DFHECID TEMPSTOR LONGTSNAME BUFFERCECI S220 SCSC220 EUGENED TO 1151 6 08:11:49 .003 DFHECID TEMPSTOR CACA BUFFERCECI S220 SCSC220 EUGENED TO 1151 7 08:11:49 .003 DFHECID TEMPSTOR CACA BUFFER
84 CICS Performance Analyzer

3.4.2 Exception Summary reportThe Exception Summary report summarizes the exception class records collected by the CICS Monitoring Facility (CMF). Figure 3-32 shows the report options.
Figure 3-32 Exception Summary report options
Report formatFigure 3-33 shows the Exception Summary report. The exception class records are summarized by transaction ID. The report provides the total number of exceptions for each transaction, according to:
� Auxiliary temporary storage Virtual Storage Access Method (VSAM) buffer and string wait conditions
� VSAM LSRPOOL buffer and string wait conditions� VSAM file string wait conditions� Temporary storage wait conditions� Main storage wait conditions� Coupling facility data table pool wait conditions
Figure 3-33 Exception Summary report
3.5 Transaction Resource Usage reportsThe Transaction Resource Usage reports are:
� File Usage Summary report � The Temporary Storage Usage Summary report � The Transaction Resource Usage List report
REDBOOK - Exception Summary Report Command ===> _________________________________________________________________ System Selection: Report Output: APPLID . . SCSCPAA5 + DDname . . . . . . . . . XSUM0001 Image . . ________ + Print Lines per Page . . ___ (1-255) Group . . ________ + Report Format: Title . . ________________________________________________________________ ________________________________________________________________ Selection Criteria: _ Exception
V1R3M0 CICS Performance Analyzer Exception Summary
XSUM0001 Printed at 9:57:34 10/22/2002 Data from 08:08:15 10/16/1999 to 08:12:14 10/16/1999 Page 1
Tran Total TS-Buffer-Wait TS-String-Wait Pool-Buffr-Wait Pool-Strng-Wait File-Strng-Wait ..Temp Storage. ..Main Storage. ID Excepts Average Count Average Count Average Count Average Count Average Count Average Count Average Count
ABRW 3 6.810 3CEBR 16 .003 16 CECI 257 .006 256 .003 1 ------- ------- ------- ------- ------- ------- ------- ------- ------- ------- ------- ------- ------- ------- -------TOTAL 276 .006 256 .003 17 6.810 3
Chapter 3. Reports and extracts 85

3.5.1 File Usage Summary reportThe Transaction File Usage Summary report summarizes file usage by transaction ID. For each transaction ID, it gives transaction information and file control statistics followed by a breakdown of file usage for each file used. Figure 3-34 shows the report options.
Figure 3-34 Transaction Resource Usage: File Usage Summary report options
Report formatFigure 3-35 shows an example of the File Usage Summary report. This report summarizes file activity. For each file, it gives a breakdown of file usage by transaction ID.
Figure 3-35 Transaction Resource Usage: File Usage Summary report
REDBOOK - File Usage Summary Report Command ===> _________________________________________________________________ System Selection: Report Output: APPLID . . SCSCPAA5 + DDname . . . . . . . . . FILE0001 Image . . ________ + Print Lines per Page . . ___ (1-255) Group . . ________ + Summary Reports Required: / Transaction File Usage / File Usage / Break down by Transaction ID / Include Transaction Totals Report Format: Title . . ________________________________________________________________ ________________________________________________________________ Selection Criteria: _ Performance
V1R3M0 CICS Performance Analyzer File Usage Summary FILE0001 Printed at 11:00:52 7/26/2003 Data from 07:30:47 5/29/2003 to 08:35:48 5/29/2003 APPLID CICSPA1 Page 2 ********************** FC Calls ********************* ******** I/O Waits ******* AccMeth File Tran #Tasks Get Put Browse Add Delete Total File RLS CFDT Requests -------- ---- ------- -------- -------- -------- -------- -------- -------- -------- -------- -------- -------- STOCK1 STOK 9 Elapse Avg .1907 .0045 .0170 .0154 .0094 .2544 .2452 .0000 .0000 Max 1.4601 .0110 .1195 .0458 .0358 1.6370 1.5718 .0000 .0000 Count Avg 48 0 506 2 1 568 65 0 0 595 Max 369 7 4354 9 4 4739 426 0 0 4925 ORDR 4 Elapse Avg .6174 .0000 10139.51 .0000 .0000 10140.44 1.2854 .0000 .0000 Max .8421 .0000 40557.78 .0000 .0000 40557.78 1.3365 .0000 .0000 Count Avg 162 0 3273 0 0 3600 356 0 0 3754 Max 217 0 3273 0 0 3710 356 0 0 3754 Totl 13 Elapse Avg .3220 .0031 3119.862 .0107 .0065 3120.313 .5653 .0000 .0000 Max 2.4697 .0401 40558.06 .1390 .0842 40561.78 5.1415 .0000 .0000 Count Avg 83 0 1357 1 0 1501 154 0 0 1567 Max 651 7 13092 23 12 14403 1424 0 0 15016
86 CICS Performance Analyzer

3.5.2 Temporary Storage Usage Summary reportThe Transaction Temporary Storage Usage Summary report summarizes temporary storage queue usage by transaction ID. For each transaction ID, it gives transaction information and temporary storage statistics followed by a breakdown of Tsqname usage for each temporary storage queue used.
The Temporary Storage Usage Summary report summarizes Tsqueue activity. For each Tsqueue, it gives a breakdown of Temporary Storage Queue usage by transaction ID. Figure 3-36 shows the report options.
Figure 3-36 Transaction Resource Usage: Temporary Storage Summary report options
Report formatFigure 3-37 shows the Temporary Storage Usage Summary report.
Figure 3-37 Transaction Resource Usage: Temporary Storage Summary report
REDBOOK - Temporary Storage Summary Report Command ===> _________________________________________________________________ System Selection: Report Output: APPLID . . SCSCPAA5 + DDname . . . . . . . . . FILE0001 Image . . ________ + Print Lines per Page . . ___ (1-255) Group . . ________ + Summary Reports Required: / Transaction Temporary Storage Usage / Temporary Storage Usage / Break down by Transaction ID / Include Transaction Totals Report Format: Title . . ________________________________________________________________ ________________________________________________________________ Selection Criteria: _ Performance
V1R3M0 CICS Performance Analyzer Temporary Storage Usage Summary TEMP0001 Printed at 11:00:52 7/26/2003 Data from 07:30:47 5/29/2003 to 08:35:48 5/29/2003 APPLID CICSPA1 Page 1 ************* TS Calls ************ *** I/O Waits *** ******** TS Item ********* TSQueue Tran #Tasks Get Put_Aux Put_Main Total TS Shr_TS Get Put_Aux Put_Main ---------------- ---- ------- -------- -------- -------- -------- -------- -------- -------- -------- -------- TS_QUEUE1 CEDA 9 Elapse Avg .0104 .0000 .0002 .0106 .0000 .0139 Max .0104 .0000 .0002 .0104 .0000 .0139 Count Avg 2 0 6 8 0 10 56 44 378 Max 3 0 12 12 0 17 Length 112 88 756 CSSY 4 Elapse Avg .0104 .0000 .0002 .0000 .0000 .0139 Max .0104 .0000 .0002 .0000 .0000 .0139 Count Avg 2 0 6 8 0 10 56 44 378 Max 3 0 12 12 0 17 Length 112 88 756 Totl 13 Elapse Avg .0104 .0000 .0002 .0000 .0000 .0139 Max .0104 .0000 .0002 .0000 .0000 .0139 Count Avg 2 0 6 8 0 10 56 44 378 Max 3 0 12 12 0 17 Length 112 88 756
Chapter 3. Reports and extracts 87

3.5.3 Transaction Resource Usage List reportThe Transaction Resource Usage List report provides a list of all transaction resource class records in the sequence that they appear in the SMF file. It gives transaction information, detailing their individual file and temporary storage queue usage. Figure 3-38 shows the report options.
Figure 3-38 Transaction Resource Usage List report options
Report formatFigure 3-39 shows an example of the Transaction Resource Usage List report.
REDBOOK - Transaction Resource Usage Report Command ===> _________________________________________________________________ System Selection: Report Output: APPLID . . ________ + DDname . . . . . . . . . RESU0001 Image . . ________ + Print Lines per Page . . ___ (1-255) Group . . + Detailed List Reports Required: / File Usage / Temporary Storage Report Format: Title . . ________________________________________________________________ ________________________________________________________________ Selection Criteria: _ Performance
88 CICS Performance Analyzer

Figure 3-39 Transaction Resource Usage: List report
3.6 Subsystem reportsThe Subsystem reports are:
� DB2 report� The WebSphere MQ report
3.6.1 DB2 reportThe CICS PA DB2 report combines the CICS CMF performance class records (SMF 110) with the DB2 Accounting records (SMF 101) that belong to the same network unit of work, including some DB2 activity. It can provide a detailed, summary, or detailed summary report showing DB2 usage for your CICS systems.
V1R3M0 CICS Performance Analyzer Transaction Resource Usage List RESU0001 Printed at 11:00:52 7/26/2003 Data from 07:30:47 5/29/2003 Page 1 Request Fcty Conn UOW R Response Tran Userid SC TranType Term LUName Type Program T/Name Name NETName APPLID Task Seq T Stop Time Time ---- -------- -- -------- ---- -------- ------- -------- ------ ---- ----------------- -------- ---- --- - ------------ -------- CEDA CBAKER TO U 0015 IG2Z0015 AP: DFHEDAP T/0015 GBIBMIYA.IG2Z0015 IYK2Z1V1 68 1 T 8:23:18.514 86.2698 ********************** FC Calls ********************* ******* I/O Waits ******** AccMeth File Get Put Browse Add Delete Total File RLS CFDT Requests -------- -------- -------- -------- -------- -------- -------- -------- -------- -------- -------- DFHCSD Elapse 1.4601 .0062 .1195 .0239 .0122 1.6370 1.5718 .0000 .0000 Count 369 1 4354 4 2 4739 426 0 0 4925 ************* TS Calls ************ *** I/O Waits *** ********* TS Item ******** TSQueue Get Put_Aux Put_Main Total TS Shr_TS Get Put_Aux Put_Main ---------------- -------- -------- -------- -------- -------- -------- -------- -------- -------- TS_QUEUE1 Elapse .0104 .0000 .0002 .0000 .0000 .0139 Count 3 0 12 0 0 17 Length 112 88 756 ---- -------- -- -------- ---- -------- ------- -------- ------ ---- ----------------- -------- ---- --- - ------------ -------- CEDA CBAKER TO U 0015 IG2Z0015 AP: DFHECIP T/0015 GBIBMIYA.IG2Z0015 IYK2Z1V1 83 1 T 8:27:58.141 103.0988 ********************** FC Calls ********************* ******* I/O Waits ******** AccMeth File Get Put Browse Add Delete Total File RLS CFDT Requests -------- -------- -------- -------- -------- -------- -------- -------- -------- -------- -------- CBFILEA Elapse .0000 .0000 .0000 .0000 .0000 .0000 .0000 .0000 .0000 Count 0 0 0 0 0 1 0 0 0 2 CBFILEB Elapse .0000 .0000 .0000 .0000 .0000 .0000 .0000 .0000 .0000 Count 0 0 0 0 0 1 0 0 0 2 CBFILEC Elapse .0000 .0000 .0000 .0000 .0000 .0000 .0000 .0000 .0000 Count 0 0 1 0 0 2 0 0 0 3 Total Elapse .0000 .0000 .0000 .0000 .0000 .0000 .0000 .0000 .0000 Count 0 0 1 0 0 4 0 0 0 7 ************* TS Calls ************ *** I/O Waits *** ********* TS Item ******** TSQueue Get Put_Aux Put_Main Total TS Shr_TS Get Put_Aux Put_Main ---------------- -------- -------- -------- -------- -------- -------- -------- -------- -------- TS_QUEUE2 Elapse .0104 .0000 .0002 .0000 .0000 .0139 Count 3 0 12 0 0 17 Length 112 88 756 TS_QUEUE3 Elapse .0104 .0000 .0002 .0000 .0000 .0139 Count 3 0 12 0 0 17 Length 100 10 700 Total Elapse .0208 .0000 .0004 .0000 .0000 .0278 Count 6 0 24 0 0 34 Length 212 98 1456
Chapter 3. Reports and extracts 89

The DB2 reports are:
� List� Summary (short or long)� Recap (record processing statistics)
To produce the DB2 reports, you need to accumulate DB2 accounting statistics (SMF 101 records) and define your CICS-DB2 resources with ACCOUNTREC(TASK) or ACCOUNTREC(UOW). CICS PA V1R3 supports the DB2 accounting statistics data from DB2 Version 5, Version 6, and Version 7.
You can use the information provided in the CICS PA DB2 reports to assist in further analysis using DB2 performance reporting tools such as the DB2 Performance Monitor (DB2 PM).
The CICS PA DB2 List report is most effective when used in conjunction with the CICS PA Cross-System Work report. Figure 3-40 shows the report options.
Figure 3-40 DB2 report options
Report formatFigure 3-41 shows the DB2 List report. This report provides a detailed list by transaction of all network units of work with DB2 activity. Records that are part of the same network unit of work are printed sequentially in groups with a blank line separator. A data line (column format) is presented for each CMF performance class record. A block of data lines (row format) is presented for each associated DB2 Accounting record.
The DB2 Long Summary report summarizes DB2 activity by transaction and program (CMF performance records), and SSID and Plan name (DB2 accounting records) within APPLID. Average and maximum values are reported for each. This report represents a subset of the total data presented in the DB2 List report. It includes DB2 data that can be matched within network unit of work to a single task, or to multiple tasks for the same transaction and program.
REDBOOK - DB2 Report Command ===> _________________________________________________________________ CICS System Selection: Report Output: APPLID . . SCSCPAA5 + DDname . . . . . . . . . DB2R0001 Image . . ________ + Print Lines per Page . . ___ (1-255) Group . . ________ + DB2 System Selection: Report Options: SSID . . . DB2P + / Process DB2 Accounting records Image . . ________ + _ List records with no DB2 activity Group . . ________ + / Long Summary with DB2 maximums Reports ----- DB2 Accounting data to include in report ------ Required: Class1 Class2 Class3 Buffer Locking DML 1 DML 2 _ List / / _ / / _ _ _ Long Summary / / _ / / _ _ / Short Summary Report Format: Title . . ________________________________________________________________ ________________________________________________________________ Selection Criteria: _ Performance
90 CICS Performance Analyzer

The DB2 Short Summary report is an abridged version of the Long Summary report. It provides averages only (no maximums). Both the CMF performance and DB2 accounting record details are presented in column format.
The DB2 Recap report is always produced at the end to provide an analysis of the CICS CMF performance class (SMF 110) and the DB2 Accounting (SMF 101) records processed.
Figure 3-41 DB2 List report
3.6.2 WebSphere MQ reportThe CICS PA MQ reports use the WebSphere MQ accounting data (SMF 116 records) to provide a detailed performance analysis of the CICS transactions that access an MQ queue manager. CICS PA Version 1 Release 3 supports the WebSphere MQ accounting statistics data from MQSeries for OS/390 Version 5.2, IBM WebSphere MQ for z/OS Version 5.3, and IBM WebSphere MQ for z/OS Version 5.3.1.
The CICS PA MQ List reports provide a detailed trace of the WebSphere MQ accounting records, reporting the comprehensive performance data contained in the Class 1 and Class 3 records:
� Class 1 (Subtype 0): Message manager accounting records, record how much CPU was spent processing WebSphere MQ API calls and the number of MQGET and MQPUT calls.
� Class 3 (Subtypes 1 and 2): Accounting data for each task, at thread and queue level.
The MQ Summary reports provide, summarized by either CICS transaction ID, MQ queue name, or both, an analysis of the MQ system and queue resources used and the transactions they service.
V1R3M0 CICS Performance Analyzer DB2 - List DB2R0001 Printed at 10:14:46 10/23/2002 Data from 13:31:17 10/22/2002 to 13:32:08 10/22/2002 Page 1
Tran/ Userid/ Program/ UOW R ..DB2 Wait Time.. DB2 User CPU Response ASSID Authid Planname APPLID Task Seq T Term LUName Connect Thread ReqCnt Time Start Time Stop Time Time B
WROS CICSLS CRWWPPOS STM4IRA1 34695 1 T <ADQ STM4IRT1 .0000 .0000 18 .3112 13:31:23.053 13:31:34.349 11.2956
CH1G STM4IRA1 CRWWPPOS STM4IRA1 34695 Thread Identification ID=ENTRWROS0037 NETName=USIBMSY.LE000081 UOWID=16372A6C7E14 Begin Time: 13:31:23.056 1/24/02 End Time: 13:31:35.378 1/24/02 Class1: Thread Time Elapsed= 12.3218 CPU= .310480 Class2: In-DB2 Time Elapsed= 11.2359 CPU= .309914 Class3: Suspend Time Total = 6.5988 I/O= 2.3726 Lock/Latch= 4.2262 Buffer Manager Summary GtPgRq= 8120 SyPgUp= 8 Locking Summary Suspnd= 11 DeadLk= 0 TmeOut= 0 MxPgLk= 1 SQL DML Query/Update Sel= 2 Ins= 0 Upd= 0 Del= 0 SQL DML 'Other' Des= 0 Pre= 0 Ope= 3 Fet= 13 Clo= 0
WRNO CICSLS CRWWPPNO STM4IRA1 34869 1 T <ACY STM4IRT1 .0000 .0000 67 .0114 13:31:38.853 13:31:45.875 7.0220
CH1G STM4IRA1 CRWWPPNO STM4IRA1 34869 Thread Identification ID=ENTRWRNO0051 NETName=USIBMSY.LE000081 UOWID=1637397E8927 Begin Time: 13:31:38.854 1/24/02 End Time: 13:31:45.808 1/24/02 Class1: Thread Time Elapsed= 6.9534 CPU= .010208 Class2: In-DB2 Time Elapsed= 6.8909 CPU= .008283 Class3: Suspend Time Total = 6.3783 I/O= .0000 Lock/Latch= 6.3783 Buffer Manager Summary GtPgRq= 173 SyPgUp= 36 Locking Summary Suspnd= 2 DeadLk= 0 TmeOut= 0 MxPgLk= 15 SQL DML Query/Update Sel= 1 Ins= 12 Upd= 11 Del= 0 SQL DML 'Other' Des= 0 Pre= 0 Ope= 12 Fet= 21 Clo= 10
Chapter 3. Reports and extracts 91

Figure 3-42 shows the WebSphere MQ report options.
Figure 3-42 WebSphere MQ report options
Report formatThe WebSphere MQ SupportPac MP1B: MQSeries for OS/390 V5.2 - Interpreting accounting and statistics data provides information about the use and interpretation of the accounting and statistics available in MQSeries for OS/390 Version 5.2 (and later). It also provides information about the layout of the SMF records and suggests ways to analyze the data.
Figure 3-43 shows the WebSphere MQ Class 1 List report.
Figure 3-43 WebSphere MQ Class 1 List report
REDBOOK - WebSphere MQ Report Command ===> _________________________________________________________________ More: + MQ System Selection: Report Output: SSID . . . ____ + DDname . . . . . . . . . DB2R0001 Image . . ________ + Print Lines per Page . . ___ (1-255) Group . . ________ + Reports Required: Process Accounting Class Records: _ List report 1 1. Class 1 / Summary report 2. Class 3 Sort Summary by: 1 1. Transaction 2. Queue 3. Transaction/Queue 4. Queue/Transaction Report Filter: Queue Name ___________________________________________ Report Format: Title . . ________________________________________________________________ ________________________________________________________________ Selection Criteria: _ Performance
V1R3M0 CICS Performance Analyzer WebSphere MQ Class 1 List MQ000001 Printed at 14:42:16 8/13/2003 Data from 14:50:34 07/13/2003 Page 1 SSID APPLID Tran Time Task CPU -------------- GET Counts ------------- ------------- PUTx Counts ------------- <=99 <=999 <=9999 >=10000 <=99 <=999 <=9999 >=10000 MQMD CICS53A1 CKCN 14:50:34.88 35 0.000747 0 0 0 0 0 0 0 0 MQMD CICS53A1 MQA1 14:51:13.27 41 0.064342 0 0 0 0 60 0 0 0 MQMD CICS53A1 CKTI 14:51:24.52 37 0.001541 0 0 0 0 0 0 0 0
92 CICS Performance Analyzer

Figure 3-44 shows the WebSphere MQ Class 1 Summary report.
Figure 3-44 WebSphere MQ Class 1 Summary report
Figure 3-45 shows the WebSphere MQ Class 3 List report.
Figure 3-45 WebSphere MQ Class 3 List report
V1R3M0 CICS Performance Analyzer WebSphere MQ Class 1 Summary MQ000003 Printed at 14:42:16 8/13/2003 Data from 14:50:34 07/13/2003 to 14:51:24 07/13/2003 Page 1 ----- Average ----- --------- Average GET Counts --------- -------- Average PUTx Counts --------- SSID APPLID TRAN Count CPU Calls <=99 <=999 <=9999 >=10000 <=99 <=999 <=9999 >=10000 MQMD CICS53A1 CKCN 1 0.000747 0.0 0.0 0.0 0.0 0.0 0.0 0.0 0.0 0.0 MQMD CICS53A1 CKTI 1 0.001541 0.0 0.0 0.0 0.0 0.0 0.0 0.0 0.0 0.0 MQMD CICS53A1 MQA1 1 0.064342 60.0 0.0 0.0 0.0 0.0 60.0 0.0 0.0 0.0
V1R3M0 CICS Performance Analyzer WebSphere MQ Class 3 ListMQ000002 Printed at 14:42:16 8/13/2003 Data from 14:51:13 07/13/2003 Page 1
SSID: MQMD APPLID: CICS53A1 Tran: MQA1 Task: 41 UserID: CICSUSER NetName: N/A UOWID: N/A Channel: Channel Connection: Start: 07/13/2003 14:51:13.12 Other Total Calls 1 Avg Elapsed 0.018721 Avg CPU 0.000258 #Old Pages 120 #New Pages 0 Queue: CPPX.MQS520.TEST.TEMPQUEUE.060 QType: LOCAL IType: NONE GDisp: Q_MGR Date: 07/13/2003 Time: 14:51:13 P/Set No: 4 BufferPool No: 3 First Opened: 07/13/2003 14:51:13.25 Last Closed: 07/13/2003 14:51:13.25 CF Structure Name: Count Elapsed CPU Susp Elp JnlWrt Elp PS Req's PS Rd Elp Expired Page Skip Msgs Skip _________ _________ _________ _________ __________ _________ _________ _________ _________ _________ OPEN 1 0.000332 0.000327 CLOSE 1 0.000113 0.000112 PUT 1 0.000567 0.000560 0.000000 0.000000 0.0 0.000000 PUT Total Bytes 10 #PUT w/Data 1 Min Msg Size 10 Max Msg Siz 10 Queue: CPPX.MQS520.TEST.TEMPQUEUE.059 QType: LOCAL IType: NONE GDisp: Q_MGR Date: 07/13/2003 Time: 14:51:13 P/Set No: 4 BufferPool No: 3 First Opened: 07/13/2003 14:51:13.25 Last Closed: 07/13/2003 14:51:13.25 CF Structure Name: Count Elapsed CPU Susp Elp JnlWrt Elp PS Req's PS Rd Elp Expired Page Skip Msgs Skip _________ _________ _________ _________ __________ _________ _________ _________ _________ _________ OPEN 1 0.000271 0.000267 CLOSE 1 0.000113 0.000112 PUT 1 0.000507 0.000500 0.000000 0.000000 0.0 0.000000 PUT Total Bytes 10 #PUT w/Data 1 Min Msg Size 10 Max Msg Siz 10
Chapter 3. Reports and extracts 93

Figure 3-46 shows the WebSphere MQ Class 3 Summary report sorted by TRAN and QUEUE.
Figure 3-46 WebSphere MQ Class 3 Summary report (by TRAN,QUEUE)
3.7 System reportsThe System report category includes the System Logger report.
3.7.1 System Logger reportThe System Logger reports process the System Logger (SMF 88) records to provide information about the System Logger log streams and coupling facility structures that are used by CICS Transaction Server for logging, recovery and backout operations.
The CICS PA System Logger reports, when used in conjunction with the CICS Logger reports produced by the standard CICS statistics reporting utilities, provide a comprehensive analysis of the logstream activity for all your CICS systems. They also provide a more extensive and flexible performance reporting solution than the IXGRPT1 sample program.
Figure 3-47 shows the report options.
V1R3M0 CICS Performance Analyzer WebSphere MQ Class 3 Summary (By TRAN,QUEUE)MQ000006 Printed at 14:42:16 8/13/2003 Data from 14:50:34 07/13/2003 to 14:51:24 07/13/2003 Page 1
SSID: MQMD APPLID: CICS53A1 Tran: CKTI Threads: 1 Other Avg Count 1.0 Avg Elapsed 0.000895 Avg CPU 0.000370 SSID: MQMD APPLID: CICS53A1 Tran: MQA1 Threads: 1 Other Avg Count 1.0 Avg Elapsed 0.018721 Avg CPU 0.000258 Avg #Old Pages 120.0 Avg #New Pages 0.0 Queue: CPPX.MQS520.TEST.TEMPQUEUE.001 QType: LOCAL IType: NONE GDisp: Q_MGR QCount: 1 Count Elapsed CPU Susp Elp JnlWrt Elp PS Req's PS Rd Elp Expired Page Skip Msgs Skip _________ _________ _________ _________ __________ _________ _________ _________ _________ _________ OPEN 1.0 0.000480 0.000472 CLOSE 1.0 0.000122 0.000121 PUT 1.0 0.000657 0.000562 0.000000 0.000000 0.0 0.000000 0.0 0.0 0.0 PUT Avg Bytes 10.0 Avg #PUT w/Data 1.0 Min Msg Size 10 Max Msg Size 10
94 CICS Performance Analyzer

Figure 3-47 System Logger report options
You can request a List report, a Summary report, or both. The System Logger List report shows information about logstream writes, deletes, and events (Subtype 1), as well as structure alter events (Subtype 11) for each SMF recording interval. Structure alter events apply to structures, not individual log streams. They are reported with a logstream name of *ALTER*. The report is sorted either on logstream name or structure name.
The System Logger (SMF 88) records can be filtered by logstream, structure, or both name patterns. The masking characters % and * are also supported.
The System Logger Summary report summarizes logstream and structure statistics so that you can measure logger performance over a longer period of time.
REDBOOK - System Logger Report Command ===> _________________________________________________________________ System Selection: Report Output: Logger . . SCSCPAA5 + DDname . . . . . . . . . LOGR0001 Image . . MVS1____ + Group . . ________ + Reports Required: Report Options: / Summary 1 1. Sort by Logstream Name _ List _ Include ALTER records 2. Sort by Structure Name _ Sort by Time Report Filter: Logstream Name . . . *.*.JOBS*_________________ Structure Name . . . ________________ Report Format: Title . . ________________________________________________________________ ________________________________________________________________
The masking characters % and * are allowed
Chapter 3. Reports and extracts 95

Report formatFigure 3-48 shows the System Logger - Logstream Summary report.
Figure 3-48 System Logger - Logstream Summary report
V1R3M0 CICS Performance Analyzer System Logger - Logstream Summary LOGR0001 Printed at 16:10:07 10/23/2002 Data from 22:55:00:00 10/22/2002 to 23:55:00:00 10/22/2002 Page 61
Logstream name MVSID Structure name First interval start Last interval stop Total IntervalIYOT1.DFHLOG SYSD LOG_JG_20M 23:00:00.00 1/05/2002 23:46:22.38 1/05/2002 0000:46:22
----------- IXGWRITES ---------- ---------------- DELETIONS ----------------- Bytes Count Count Bytes Bytes Writn to With Without After Int Stor Total Average Interim DASD DASD Offload w/o DASD Count Bytes Bytes Storage Write Write w. DASD Write -------- -------- -------- -------- -------- -------- -------- --------Total 628147 172706K 275 301535K 216244 467717 59484K 128572KRate(/Sec) 225 62080 108388 77 168 21382 46216Minimum 4 4292 4864 0 0 0 0Maximum 94200 25898K 45218K 32740 71810 9004730 19739K
------------------------------------------ EVENTS ------------------------------------------ Demand Demand Staging DASD Block Staging Entry Struct Init'd Offloads Threshld Shifts Length Full Full Full Offloads -------- -------- -------- -------- -------- -------- -------- --------Total 314 0 78 0 0 0 0Rate(/Sec) 0 0 0 0 0 0 0Minimum 0 0 0 116 0 0 0 0Maximum 48 0 12 1427 0 0 0 0
----------------------- EVENTS ------------------------- --------------- DASD Writes ---------------- Struct Struct Rebuilds Rebuilds Total Type1 Type2 Type3 Init'd Complt'd Count Bytes Average Waits -------- -------- -------- -------- -------- -------- -------- -------- --------Total 612865 15277 5 0 0 551 68133K 0 315Rate(/Sec) 220 5 0 0 0 0 24491 0Minimum 4 0 0 0 0 0 0 0Maximum 91995 2458 5 0 0 84 10314K 48
96 CICS Performance Analyzer

Figure 3-49 shows the System Logger - Structure Summary report.
Figure 3-49 System Logger - Structure Summary report
3.8 Performance Graph reportsThe Performance Graph reports are:
� Transaction Rate Graph report� Transaction Response Time Graph report
3.8.1 Transaction Rate Graph reportThe Transaction Rate Graph report shows, over the requested time interval, the average response time and the number of completed transactions. Figure 3-50 shows the report options.
V1R3M0 CICS Performance Analyzer System Logger - Structure Summary LOGR0001 Printed at 16:10:07 10/23/2002 Data from 22:55:00:00 10/22/2002 to 23:55:00:00 10/22/2002 Page 67
Structure name MVSID First interval start Last interval stop Total IntervalLOG_JG_20M SYSD 23:00:00.00 1/05/2002 23:46:45.67 1/05/2002 0000:46:45
----------- IXGWRITES ---------- ---------------- DELETIONS ----------------- Bytes Count Count Bytes Bytes Writn to With Without After Int Stor Total Average Interim DASD DASD Offload w/o DASD Count Bytes Bytes Storage Write Write w. DASD Write -------- -------- -------- -------- -------- -------- -------- --------Total 1895819 521260K 275 910084K 650666 1412682 179002K 388332KRate(/Sec) 675 185832 324450 231 503 63815 138443Minimum 0 0 0 0 0 0 0Maximum 95743 26322K 45959K 32740 71811 9004730 19740K
------------------------------------------ EVENTS ------------------------------------------ Demand Demand Staging DASD Block Staging Entry Struct Init'd Offloads Threshld Shifts Length Full Full Full Offloads -------- -------- -------- -------- -------- -------- -------- --------Total 948 0 235 0 0 0 0Rate(/Sec) 0 0 0 0 0 0 0Minimum 0 0 0 116 0 0 0 0Maximum 48 0 12 1427 0 0 0 0
----------------------- EVENTS ------------------------- --------------- DASD Writes ---------------- Struct Struct Rebuilds Rebuilds Total Type1 Type2 Type3 Init'd Complt'd Count Bytes Average Waits -------- -------- -------- -------- -------- -------- -------- -------- --------Total 1850214 45600 5 0 0 1651 205029K 0 942Rate(/Sec) 659 16 0 0 0 0 73094 0Minimum 0 0 0 0 0 0 0 0Maximum 93387 2508 5 0 0 84 10314K 48
Chapter 3. Reports and extracts 97

Figure 3-50 Transaction Rate Graph report options
Report formatFigure 3-51 shows the Transaction Rate Graph report.
Figure 3-51 Transaction Rate Graph report
3.8.2 Transaction Response Time Graph reportThe Transaction Response Time Graph report shows the average and maximum response time. Figure 3-52 shows the report options.
REDBOOK - Transaction Rate Graph Command ===> _________________________________________________________________ System Selection: Report Output: APPLID . . SCSCPAA5 + DDname . . . . . . . . . GRTE0001 Image . . ________ + Print Lines per Page . . ___ (1-255) Group . . ________ + Graph Options: Time Interval . . . . . . . . . . . 5____ (minutes) Average Response Time . . . . . . . _____ (seconds) Number of Transactions Completed . . _____ Report Format: Title . . ________________________________________________________________ ________________________________________________________________ Selection Criteria: _ Performance
V1R3M0 CICS Performance Analyzer Transaction Rate GRTE0001 Printed at 9:16:07 10/22/2002 Data from 11:10:29 10/21/2002 to 11:34:00 10/21/2002 Page 1 10/21/2002
Time Value | Average Response Time in Secs | Value | Number of Transactions completed |HH.MM.SS | 8 16 24 32 40 48 56 64 72 80 | 8 16 24 32 40 48 56 64 72 8011:10:30 |----|----|----|----|----|----|----|----|----|----| |----|----|----|----|----|----|----|----|----|----|11:15:00 4.2 |*** 52 |*********************************11:20:00 2.8 |** 70 |********************************************11:25:00 4.0 |*** 76 |************************************************11:30:00 3.6 |** 37 |***********************11:34:00 75.0 |*********************************************** 35 |**********************
98 CICS Performance Analyzer

Figure 3-52 Transaction Response Time Graph report options
Report formatFigure 3-53 shows the Transaction Response Time Graph report.
Figure 3-53 Transaction Response Time Graph report
3.9 Performance extractsThe Performance extracts are:
� Cross-System Work extract� Export extract� Record Selection extract
3.9.1 Cross-System Work extractThe Cross-System Work extract consolidates the CMF performance class records that belong to the same network unit of work into a single record in CMF performance record format. You can then use the extract data set as input to other CICS PA reports or extracts such as a Performance List report or a Performance Data extract. Figure 3-54 shows the extract options.
REDBOOK - Transaction Response Time Graph Command ===> _________________________________________________________________ System Selection: Report Output: APPLID . . SCSCPAA5 + DDname . . . . . . . . . GRSP0001 Image . . ________ + Print Lines per Page . . ___ (1-255) Group . . ________ + Graph Options: Time Interval . . . . . . 5____ (minutes) Average Response Time . . _____ (seconds) Maximum Response Time . . _____ (seconds) Report Format: Title . . ________________________________________________________________ ________________________________________________________________ Selection Criteria: _ Performance
V1R3M0 CICS Performance Analyzer Response Time GRSP0001 Printed at 9:16:07 10/22/2002 Data from 11:10:29 10/21/2002 to 11:34:00 10/21/2002 Page 1 10/21/2002
Time Value | Average Response Time in Secs | Value | Maximum Response Time in Secs |HH.MM.SS | 8 16 24 32 40 48 56 64 72 80 | 140 280 420 560 700 840 980 1120 1260 140011:10:30 |----|----|----|----|----|----|----|----|----|----| |----|----|----|----|----|----|----|----|----|----|11:15:00 4.2 |*** 81.3 |***11:20:00 2.8 |** 95.1 |***11:25:00 4.0 |*** 308.9 |***********11:30:00 3.6 |** 61.0 |**11:34:00 75.0 |*********************************************** 1,386.7 |**************************************************
Chapter 3. Reports and extracts 99

All CMF fields are available for inclusion in the extract. In addition, you can specify which user fields you want to include.
To run the report for multiple systems, define them to a group. For information about how to do this, see “Groups this system belongs to” on page 33.
Figure 3-54 Cross-System Work extract options
Extract record formatFigure 3-55 shows an example of the Cross-System Work extract record:
� The extract records are written for the specified APPLID/MVS ID. The default is MULTIPLE/CICS.
� Transactions are identified by the originating task.
� Counters and elapsed times are combined to provide a complete view of a transaction’s CICS resource usage.
REDBOOK - Cross-System Work Extract Command ===> _________________________________________________________________ System Selection: Extract Recap: APPLID . . ________ + DDname . . . CROX0001 Image . . ________ + Group . . MROPROD_ + Output Data Set . . 'MROPROD.CROSSWK'_____________________________ Disposition . . . 1 1. OLD 2. MOD (If cataloged) Processing Options: Record Formatting Options: 1 1. UOWs with more than one record APPLID . . MULTIPLE 2. UOWs with a single record MVS ID . . CICS 3. All UOWs Selection Criteria: Additional User Fields: S Performance * S User Fields *
Specify criteria to filter the data Select User Fields from a list
Specify a group of systems
100 CICS Performance Analyzer

Figure 3-55 Cross-System Work extract record format
Recap reportA Recap report is always produced to provide the total record count in the extract data set.
Using CICS PA to process the extractYou can input the Cross-System Work extract data set into CICS PA for further analysis. Figure 3-56 shows an example of the System Definitions screen after you define the Cross-System Work APPLID (MULTIPLE) and MVS ID (CICS) to CICS PA and associate the extract file with the APPLID. Then you can define report forms and report sets to run on this APPLID.
Figure 3-56 Cross-System Work extract replaying through CICS PA
3.9.2 Export extractThe Export extract is created as a delimited text file for the purpose of importing the CMF performance class data into PC spreadsheet or database tools for further analysis and reporting. CICS PA supplies the column headings (if requested). The fields are separated by
System Definitions Row 1 from 2 Command ===> ________________________________________________ Scroll ===> DATA Select a System to edit its definition, SMF Files and Groups. SMF Files System Type Image Description System _ MULTIPLE CICS CICS Cross-System Work Extract System____ MULTIPLE _ CICS Image Image inserted by System MULTIPLE___ ********************************* End of list *********************************
CICS Field CICS CMF Owner-Type-Id Length Informal Name ------------- ------ ------------- DFHTASK C001 4 TRAN DFHTERM C002 4 TERM DFHCICS C089 8 USERID DFHTASK C004 4 TTYPE DFHCICS T005 8 START DFHCICS T006 8 STOP . . . DFHTASK S273 8 JVMITIME DFHTASK S275 8 JVMRTIME DFHTASK S285 8 PTPWAIT CICSPA A001 4 TOTRECS CICSPA A002 4 APPLRECS CICSPA A003 4 TRANROUT CICSPA A004 4 FUNCSHIP CICSPA A005 4 DPLRECS . . .
Standard CICS monitoring fields
Special count fields added by CICS PA. They indicate the number of input records of each type that were combined to produce the extract record.
Any requested user fields are added here
Chapter 3. Reports and extracts 101

a delimiter character of your choosing (the default is the semi-colon (;)). Figure 3-57 shows the extract options.
Figure 3-57 Export: extract options
Default extract record formatWhen a Report Form is not specified, the default Export record format contains these fields:
� APPLID: Generic APPLID� Tran: Transaction ID� Term: Terminal ID� Userid: User ID� Taskno: Transaction sequence number� Stop Date: Transaction stop date (yyyy-mm-dd)� Stop Time: Transaction stop time (hh:mm:ss.thm)� Response: Transaction response time� Clocks: All 65 clocks as defined by CICS Transaction Server for z/OS, Version 2.2
Figure 3-58 shows an example of the first part of the default record layout. Note that the field labels (column headings) are included in this extract. Field labels are optional.
REDBOOK - Export Command ===> _________________________________________________________________ System Selection: Extract Recap: APPLID . . SCSCPAA5 + DDname . . . EXPT0001 Image . . ________ + Group . . ________ + Output Data Set . . . 'SCSCPAA5.EXPORT'_____________________________ Disposition . . . 1 1. OLD 2. MOD (If cataloged) Extract Format: Enter "/" to select option Form . . . . ________ + / Include Field Labels Delimiter . . ; _ Numeric Fields in Float format Selection Criteria: Summary Processing Options: _ Performance * Time Interval 00:01:00 (hh:mm:ss) LIST, LISTX or
SUMMARY Report Form
102 CICS Performance Analyzer

Figure 3-58 Export: Default extract record format
Extract record tailoring (LIST, LISTX)You can specify a LIST or LISTX Report Form to create an Export record in the same format as the corresponding Performance List report (see Figure 3-4 on page 66) or Performance List Extended report (see Figure 3-8 on page 69). Many sample Report Forms of type LIST or LISTX are provided with CICS PA for this purpose. Note that when you use a LISTX Form for the Export, it is used like a LIST Form. That is, the fields and the order of the columns are used, but the sort sequence is ignored. For more information about how to use Report Forms, see 2.10, “Tailoring report formats” on page 44.
Extract record tailoring (SUMMARY)You can specify a SUMMARY Report Form to create an Export record in the same format as the corresponding Performance Summary report (see Figure 3-12 on page 71). Many sample Report Forms of type SUMMARY are provided with CICS PA for this purpose. For more information about how to use Report Forms, see 2.10, “Tailoring report formats” on page 44.
Recap reportA Recap report is always produced to give the total record count in the extract data set.
Processing the extract using different toolsThe Export data set is a delimited text file. You can analyze this file further by using a program, such as DB2, or PC tools, such as Lotus 1-2-3 or Lotus Approach. Figure 3-59 is an example of a graph produced from the Summary Export data.
For more examples and descriptions of how to produce such graphs, see Chapter 4, “Processing extracts” on page 107.
APPLID ;TRAN;TERM;USERID ; TASKNO; STOP DATE; STOP TIME ;RESPONSE;DISPATCH;CPU ;SUSPEND ;DISPWAIT;QRDISPT ;QRCPU ;MSDISPTSCSCPAA5;CSSY; ;CICSLS ; 16;1999-02-04;11:10:29.803; .0139; .0007; .0006; .0133; .0000; .0007; .0006; .0000SCSCPAA5;CSSY; ;CICSLS ; 17;1999-02-04;11:10:29.809; .0185; .0010; .0014; .0175; .0001; .0010; .0014; .0000SCSCPAA5;CSSY; ;CICSLS ; 18;1999-02-04;11:10:29.861; .0674; .0196; .0027; .0479; .0269; .0047; .0019; .0149SCSCPAA5;CGRP; ;CICSLS ; 12;1999-02-04;11:10:30.194; .4123; .0420; .0074; .3702; .3223; .0177; .0037; .0243SCSCPAA5;CSSY; ;CICSLS ; 15;1999-02-04;11:10:30.207; .4204; .0568; .0100; .3636; .1744; .0177; .0064; .0391SCSCPAA5;CSSY; ;CICSLS ; 13;1999-02-04;11:10:30.456; .6743; .0728; .0134; .6015; .4000; .0215; .0029; .0512SCSCPAA5;CSSY; ;CICSLS ; 10;1999-02-04;11:10:30.531; .7498; .1910; .0228; .5588; .1997; .0673; .0089; .1237SCSCPAA5;CSSY; ;CICSLS ; 14;1999-02-04;11:10:31.121; 1.3344; .3202; .0378; 1.0142; .2626; .1978; .0282; .1224SCSCPAA5;CSSY; ;CICSLS ; 11;1999-02-04;11:10:31.211; 1.4292; .1497; .0313; 1.2794; .3461; .0595; .0216; .0903SCSCPAA5;CPLT; ;CICSLS ; 7;1999-02-04;11:10:45.642; 15.9915; .3383; .0369; 15.6532; .0155; .0143; .0108; .3240SCSCPAA5;CSSY; ;CICSLS ; III;1999-02-04;11:10:45.856; 16.0761; 9.3488; 2.3435; 6.7273; 1.1645; 3.7054; 1.9054; 5.6434SCSCPAA5;CWBG; ;CICSLS ; 24;1999-02-04;11:10:46.196; .0262; .0248; .0041; .0013; .0012; .0016; .0010; .0232SCSCPAA5;CRSQ; ;CICSLS ; 25;1999-02-04;11:10:46.856; .0818; .0449; .0040; .0369; .0367; .0012; .0008; .0438SCSCPAA5;CXRE; ;CICSLS ; 27;1999-02-04;11:10:47.134; .2255; .0243; .0049; .2011; .2009; .0037; .0016; .0206SCSCPAA5;CLR2;R11 ;CICSLS ; 29;1999-02-04;11:10:48.317; .0263; .0030; .0020; .0232; .0000; .0030; .0020; .0000SCSCPAA5;CSFU; ;CICSLS ; 26;1999-02-04;11:10:48.471; 1.6968; 1.5899; .1136; .1069; .0294; .2971; .0253; 1.2928SCSCPAA5;CSAC;SAMA;CICSLS ; 31;1999-02-04;11:10:51.227; .5217; .0028; .0011; .5189; .0002; .0028; .0011; .0000SCSCPAA5;CLQ2; ;CICSLS ; 28;1999-02-04;11:10:51.840; 3.8259; .0818; .0068; 3.7441; .0035; .0034; .0025; .0784SCSCPAA5;CEMT;SAMA;CICSLS ; 32;1999-02-04;11:10:51.942; .1877; .1842; .0264; .0035; .0030; .0041; .0028; .1801SCSCPAA5;CEMT;SAMA;CICSLS ; 33;1999-02-04;11:10:52.549; .0091; .0068; .0026; .0023; .0001; .0068; .0026; .0000SCSCPAA5;CEMT;SAMA;CICSLS ; 34;1999-02-04;11:10:53.074; .0092; .0068; .0025; .0024; .0000; .0068; .0025; .0000
Chapter 3. Reports and extracts 103

Figure 3-59 Export: Processing the extract data set using PC graphing tools
3.9.3 Record Selection extractThe Record Selection extract is a facility that allows you to create a smaller extract file containing only the CMF performance records (and optionally, the DB2 and WebSphere MQ accounting records) that are of interest to you. It is used to filter large SMF files. You can then use these files as input to CICS PA, for more efficient reporting and analysis. Figure 3-60 shows the extract options.
Figure 3-60 Record Selection Extract options
Extract record formatThe extract file contains CMF performance records (SMF 110) and, if requested, DB2 Accounting records (SMF 101).
7:107:11
7:147:16
7:177:18
7:197:19
7:207:21
7:227:23
7:237:23
7:237:24
7:257:27
7:297:29
7:307:34
Time of Day
0
10
20
30
40
50
60
Sec
onds
RESPONSEDISPATCHCPUSUSPENDDISPWAIT
Data from Spreadsheet
REDBOOK - Record Selection Extract Command ===> _________________________________________________________________ System Selection: CICS APPLID . . SCSCPAA5 + Image . . ________ + Group . . ________ + DB2 SSID . . . DB2P + Image . . ________ + Group . . ________ + MQ SSID . . . . ____ + Image . . ________ + Group . . ________ + Extract Recap: DDname . . . RSEL0001 Output Data Set: Data Set Name . . 'SCSCPAA5.DB2P.RECSEL'________________________ Disposition . . . _ 1. OLD 2. MOD (If cataloged) Selection Criteria: _ Performance
104 CICS Performance Analyzer

Recap reportA Recap report is always produced at the end of extract processing. Figure 3-61 shows how the Recap report summarizes the results of the extract processing.
Figure 3-61 Record Selection extract (Recap report)
3.10 Popular mixDo not be daunted. You will soon learn what mix of reports works best for you for your ongoing monitoring and tuning efforts and for your management reporting.
A suggestion for monthly reporting and beyond is to use the Historical Database facility to maintain a history of CMF performance data for reporting or export to DB2 tables. See Chapter 19, “Historical Database” on page 415.
For daily reporting, we recommend:
� Performance Summary (1): Use a SUMMARY Report Form to show transaction count, response time, CPU, and so on, summarized by transaction within APPLID.
� Performance Summary (2): The same as Performance Summary (1), but summarized by transaction within a group (production, test, etc).
� Performance List Extended: Showing the top 20 poor response times, and so on, by transaction within APPLID.
� Wait Analysis.
� Exception Summary.
� DB2 or WebSphere MQ Summary.
� Logstream Summary.
� Performance Export: Process the extract using PC tools to produce graphs.
For weekly reporting, we recommend:
� Performance Summary: As for daily reporting; summarized by transaction within a group.� Performance Totals: By Group.� DB2 or WebSphere MQ Summary.� Logstream Summary.� Performance Export. Process the extract using DB2 or PC tools to produce graphs.
For monthly reporting, we recommend:
� Performance Summary: As for daily reporting; summarized by transaction within a group� Performance Totals: By Group� DB2 or WebSphere MQ Summary
V1R3M0 CICS Performance Analyzer Record Selection Extract RSEL0001 Printed at 12:51:10 11/08/2002 Data from 10:21:56 11/07/2002 to 11:12:40 11/07/2002 Page 1 CPAORS01 Extract has completed successfully Data Set Name . . . . . CICSLS5.RECSEL.EXTRACT Record Counts: Performance Dictionary . 2 Performance Class . . 3,908 DB2 Accounting . . . . . 0 SMF Records . . . . . . . 208
Chapter 3. Reports and extracts 105

106 CICS Performance Analyzer
Chapter 4. Processing extracts
The CICS Performance Analyzer (PA) Export facility produces delimited text files of CICS Monitoring Facility (CMF) Performance and Transaction Resource Class data extracted from SMF data sets. The extract files are suitable for analysis by external programs such as DB2, or PC spreadsheet and graphing tools such as Lotus 1-2-3, Microsoft® Excel and Microsoft Access.
This chapter explains, by example, how to:
� Use the CICS PA Export facility to produce extract data sets in various formats� Use the following programs and tools to process the extract data sets:
– DB2– Lotus 1-2-3– Microsoft Excel– Microsoft Access
Methods such as these can enhance your understanding and interpretation of the data, facilitate comparisons, assist your analysis of trends, peaks and throughputs, help to isolate problems, and generally support your decision-making about the ongoing tuning and management of your CICS systems.
4
© Copyright IBM Corp. 2003. All rights reserved. 107

4.1 Processing extracts with DB2CICS Performance Analyzer 1.3 introduced an easy way to generate data from SMF records in a form that it is suitable to be used as input for a DB2 load utility and to be imported into a DB2 table. Furthermore CICS PA generates the Data Definition Language (DDL) statements to create the required DB2 database, tablespace, table, and an index. Also the load job is generated by CICS PA.
This function is part of the Historical Database and is demonstrated in 19.4.5, “Export HDB data sets to DB2” on page 441.
4.2 Processing extracts with Lotus 1-2-3A chart is an effective way to illustrate your performance data after it is placed in a spreadsheet. It can make relationships among numbers easy to see because it turns numbers into shapes. This section shows how to create a chart based on performance data that was extracted using the CICS Performance Analyzer.
4.2.1 Exporting performance extractsFrom the Primary Option Menu, select option 2 (Report Sets). The Report Sets screen shows a list of Report Sets that were already created. Refer to 2.7.2, “Report Sets” on page 36, for a description of how to create a Report Set.
We typed line action S next to Report Set VSAMSUM. This displays the Edit Report Set screen. Report Set VSAMSUM was created when we ran the VSAM performance scenario described in Chapter 6, “VSAM application performance analysis and Transaction Resource Monitoring support” on page 139.
On the Edit Report Set screen, we checked that no active reports were selected. Active reports are indicated by a yes after the report name. You can use line action D to deactivate the report. After that, we selected the item Export form the Extracts group. The Exports screen appears and displays a list of selections from our previous extract exports. Figure 4-1 shows the Export screen containing a list of systems to select from.
Figure 4-1 Performance extract export
VSAMSUM - Exports Row 1 from 3 Command ===> Scroll ===> CSR_
---- System Selection ----- Selection / Exc APPLID + Image + Group + Recap Form + Criteria
SCSCPAA1 SC66 EXPT0001 VSAMEL YES Output Data Set . . LOTUS123 ------------------------------------------------------------------------------ SCSCPAA1 SC66 EXPT0001 VSAMSUM YES Output Data Set . . MSACCESS ------------------------------------------------------------------------------ SCSCPAA1 SC66 EXPT0001 VSAM YES Output Data Set . . MSEXCEL ------------------------------------------------------------------------------
108 CICS Performance Analyzer

We selected system SCSCPAA1 using output data set LOTUS123. This opens an Export screen that allows you to edit export detail information. If you do not see a screen like the one shown in Figure 4-1, then this may be the first performance extract export that bypasses the list of previous exports and displays the screen shown in Figure 4-2 directly.
We updated the following information on the Export detail screen:
� CICS APPLID SCSCPAA1� Extract data set LOTUS123� Report form VSAMSUM
Figure 4-2 Extract details
CICS system definition SCSCPAA1 must specify a valid SMF data set name that contains some SMF records to produce a performance extract. Refer to “SMF Files for this system” on page 33 for a description about how to define SMF data sets on system definitions.
We used Report Form VSAMSUM. It was created during the VSAM performance scenario project described in Chapter 6, “VSAM application performance analysis and Transaction Resource Monitoring support” on page 139. To demonstrate how to create charts, you can use any Report Form that has time or count fields.
VSAMSUM - Export Command ===> System Selection: Extract Recap: APPLID . . SCSCPAA1 + DDname . . . EXPT0001 Image . . SC66 + Group . . + Output Data Set: Data Set Name . . LOTUS123 Disposition . . . 2 1. OLD 2. MOD (If cataloged) Extract Format: Enter "/" to select option Form . . . . VSAMSUM + / Include Field Labels Delimiter . . ; Numeric Fields in Float Format Selection Criteria: Summary Processing Options:
Performance Time Interval 00:01:00 (hh:mm:ss)
Chapter 4. Processing extracts 109
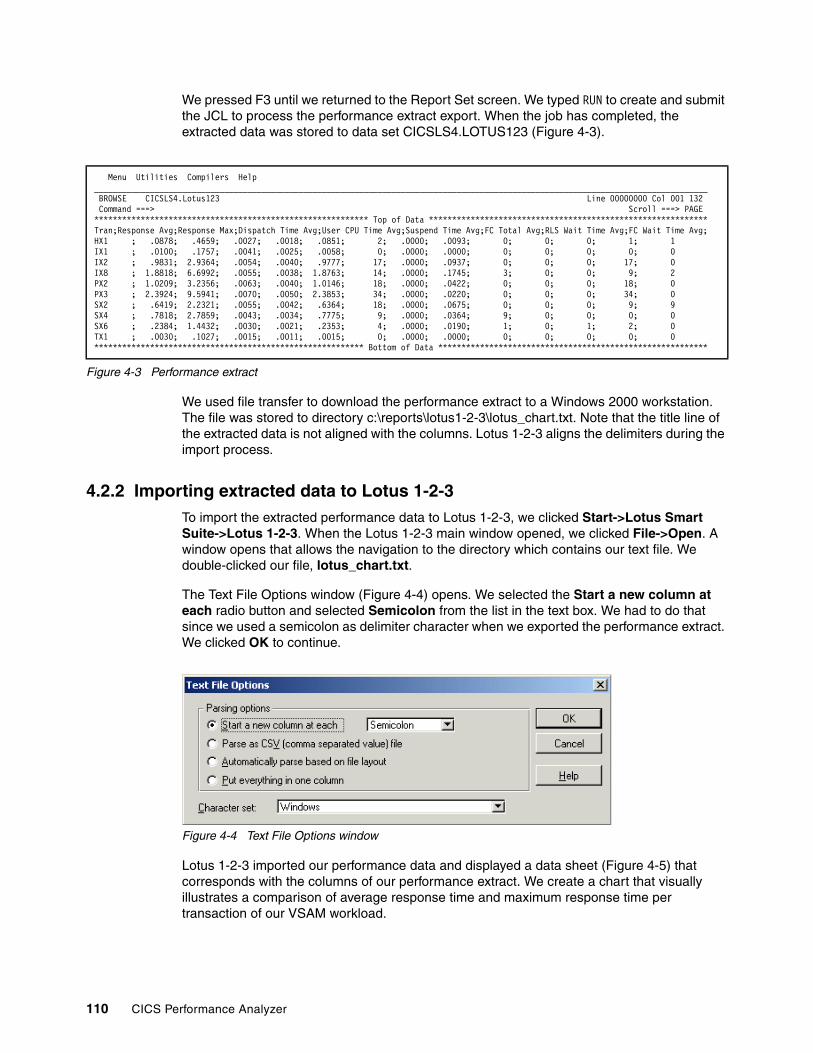
We pressed F3 until we returned to the Report Set screen. We typed RUN to create and submit the JCL to process the performance extract export. When the job has completed, the extracted data was stored to data set CICSLS4.LOTUS123 (Figure 4-3).
Figure 4-3 Performance extract
We used file transfer to download the performance extract to a Windows 2000 workstation. The file was stored to directory c:\reports\lotus1-2-3\lotus_chart.txt. Note that the title line of the extracted data is not aligned with the columns. Lotus 1-2-3 aligns the delimiters during the import process.
4.2.2 Importing extracted data to Lotus 1-2-3To import the extracted performance data to Lotus 1-2-3, we clicked Start->Lotus Smart Suite->Lotus 1-2-3. When the Lotus 1-2-3 main window opened, we clicked File->Open. A window opens that allows the navigation to the directory which contains our text file. We double-clicked our file, lotus_chart.txt.
The Text File Options window (Figure 4-4) opens. We selected the Start a new column at each radio button and selected Semicolon from the list in the text box. We had to do that since we used a semicolon as delimiter character when we exported the performance extract. We clicked OK to continue.
Figure 4-4 Text File Options window
Lotus 1-2-3 imported our performance data and displayed a data sheet (Figure 4-5) that corresponds with the columns of our performance extract. We create a chart that visually illustrates a comparison of average response time and maximum response time per transaction of our VSAM workload.
Menu Utilities Compilers Help ____________________________________________________________________________________________________________________________________ BROWSE CICSLS4.Lotus123 Line 00000000 Col 001 132 Command ===> Scroll ===> PAGE *********************************************************** Top of Data ************************************************************Tran;Response Avg;Response Max;Dispatch Time Avg;User CPU Time Avg;Suspend Time Avg;FC Total Avg;RLS Wait Time Avg;FC Wait Time Avg;HX1 ; .0878; .4659; .0027; .0018; .0851; 2; .0000; .0093; 0; 0; 0; 1; 1 IX1 ; .0100; .1757; .0041; .0025; .0058; 0; .0000; .0000; 0; 0; 0; 0; 0 IX2 ; .9831; 2.9364; .0054; .0040; .9777; 17; .0000; .0937; 0; 0; 0; 17; 0 IX8 ; 1.8818; 6.6992; .0055; .0038; 1.8763; 14; .0000; .1745; 3; 0; 0; 9; 2 PX2 ; 1.0209; 3.2356; .0063; .0040; 1.0146; 18; .0000; .0422; 0; 0; 0; 18; 0 PX3 ; 2.3924; 9.5941; .0070; .0050; 2.3853; 34; .0000; .0220; 0; 0; 0; 34; 0 SX2 ; .6419; 2.2321; .0055; .0042; .6364; 18; .0000; .0675; 0; 0; 0; 9; 9 SX4 ; .7818; 2.7859; .0043; .0034; .7775; 9; .0000; .0364; 9; 0; 0; 0; 0 SX6 ; .2384; 1.4432; .0030; .0021; .2353; 4; .0000; .0190; 1; 0; 1; 2; 0 TX1 ; .0030; .1027; .0015; .0011; .0015; 0; .0000; .0000; 0; 0; 0; 0; 0 ********************************************************** Bottom of Data **********************************************************
110 CICS Performance Analyzer
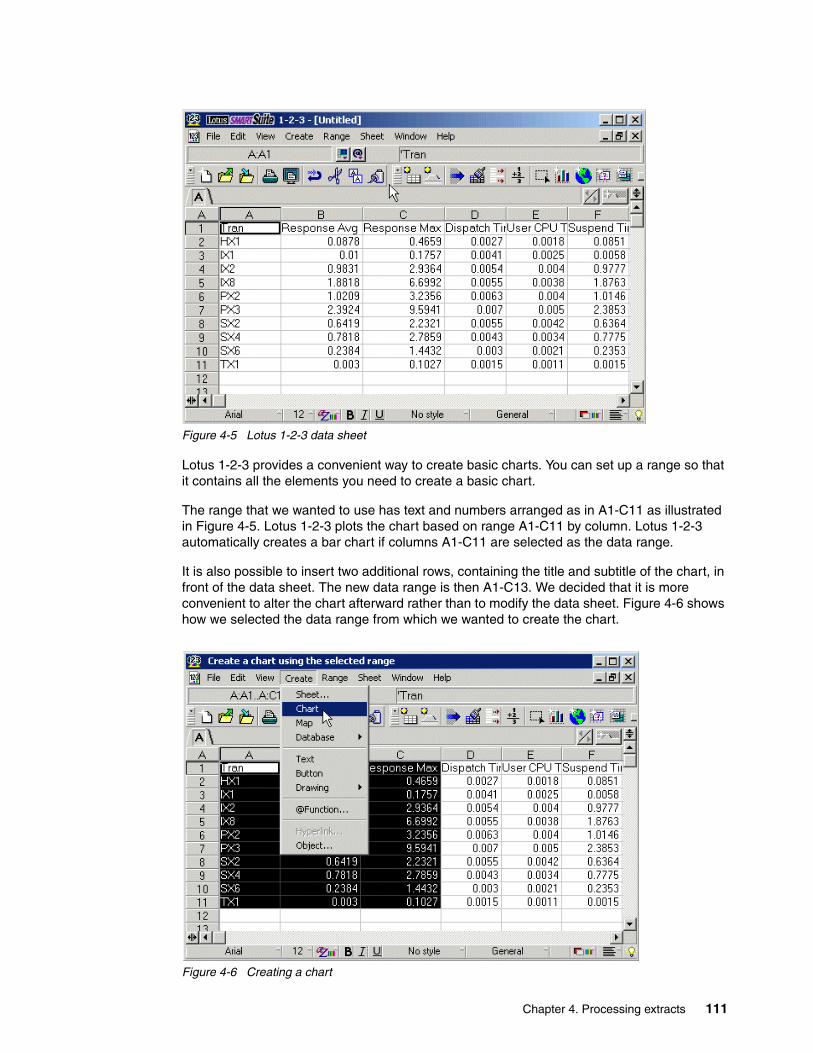
Figure 4-5 Lotus 1-2-3 data sheet
Lotus 1-2-3 provides a convenient way to create basic charts. You can set up a range so that it contains all the elements you need to create a basic chart.
The range that we wanted to use has text and numbers arranged as in A1-C11 as illustrated in Figure 4-5. Lotus 1-2-3 plots the chart based on range A1-C11 by column. Lotus 1-2-3 automatically creates a bar chart if columns A1-C11 are selected as the data range.
It is also possible to insert two additional rows, containing the title and subtitle of the chart, in front of the data sheet. The new data range is then A1-C13. We decided that it is more convenient to alter the chart afterward rather than to modify the data sheet. Figure 4-6 shows how we selected the data range from which we wanted to create the chart.
Figure 4-6 Creating a chart
Chapter 4. Processing extracts 111

The data range comprises A1 to C11, so we have more rows than columns. This influences the way the chart is built automatically. Lotus 1-2-3 builds charts automatically in the following ways:
� More columns than rows: By interpreting each row of values as a separate series, Lotus 1-2-3 uses the leftmost entry in each row as a legend label and the top entry in each column as an axis label.
� More rows than columns: By interpreting each column of values as a separate series, Lotus 1-2-3 uses the top entry in each column as a legend label and the leftmost entry in each row as an axis label.
� Equal rows and columns: This situation is handled in the same way as when there are more rows than columns.
We clicked Create->Chart and dropped the chart icon into the selected data range. The chart was built automatically as shown in Figure 4-7. The layout of the chart is still very basic, but can easily be improved. So far, we have not specified a specific chart type, axes and grids, chart style, or chart options. For simplicity, we only showed the basic technique to create charts using Lotus 1-2-3.
Figure 4-7 Lotus 1-2-3 chart
4.3 Processing extracts with Microsoft ExcelMicrosoft Excel allows the creation of charts by using a chart wizard. You can use any existing data sheet to start the chart wizard to create charts from selected columns.
4.3.1 Exporting a performance extractRefer to 4.2.1, “Exporting performance extracts” on page 108, for a description of how to export performance extracts from which to create a chart. After exporting the extract, we used
112 CICS Performance Analyzer

file transfer to store the extracted data as a text file. We created directory c:\reports\msexcel to store all files that belong to Microsoft Excel chart project.
4.3.2 Importing extracted data into Microsoft ExcelTo start Microsoft Excel, we clicked Start->Microsoft Excel. We wanted to import the text file that contains our delimited data to Microsoft Excel. To import the file, we clicked File->Open. The open window displays. We navigated to the directory that contains the file that we are going to open. The file is named excel_chart.txt.
We clicked Open. The Text Import Wizard window (Figure 4-8) opens.
Figure 4-8 Text Import Wizard (Part 1 of 3)
Since our extracted performance data is delimited by semicolon, we chose Delimited by selecting the radio button as shown in Figure 4-8. We wanted to start from row 1, which is specified by default. We clicked Next to continue.
The next Text Import Wizard window (Figure 4-9) opens. We selected the check box Semicolon and deselected the rest of the check boxes. When we selected check box Semicolon, the title line was aligned automatically by Microsoft Excel.
Chapter 4. Processing extracts 113

Figure 4-9 Text Import Wizard (Part 2 of 3)
We checked that the data of the imported columns appeared as expected. After that, we clicked Next. Then the third Text Import Wizard window (not shown) opens. It allows you to select each column and set the data format. The default is fine. Therefore, we clicked Finish to continue and create our chart. Microsoft Excel displays the excel_chart data sheet as shown in Figure 4-10.
Figure 4-10 Data sheet EXCEL_CHART
As shown in Figure 4-10, column B displays the average response time per transaction while column C displays the maximum response time per transaction. To create a visual comparison of average response time to maximum response time per transaction, we selected the area that is to be used as input data for the chart.
114 CICS Performance Analyzer

When we selected the area, we clicked the chart wizard icon as shown in Figure 4-11.
Microsoft Excel provides a chart wizard that guides you to create charts in four steps:
1. On the first window, you select the chart type. Each chart type has a number of sub types that you can select. You can also immediately see how your chart will look by clicking a sample button.
2. Specify the columns and labels you want to appear in your chart. If you already selected your columns and labels before you start the chart wizard, the preview of your chart may be correct so that you may not need to change anything.
3. Set standard option for your chart. You can check the effect of setting the options by looking at a preview chart.
4. Decide whether to place the newly created chart in a new sheet or as an object in a data sheet.
We clicked the chart wizard icon in the tool bar.
Figure 4-11 Starting the chart wizard
When the Chart Wizard window (Figure 4-12) opened, we selected a chart sub-type of clustered column with 3-D visual effect. You can select different chart types as well. We clicked Press and Hold to View Sample to check if the sub-type that we chose looks as expected. We clicked Next to continue.
Chapter 4. Processing extracts 115

Figure 4-12 Chart Wizard (step 1 of 4)
When we started to work with the chart wizard, we already selected the data range of average response time and maximum response time. Therefore, the preview chart shown in Figure 4-13 looks correct. The preview chart shows a comparison of the selected cells. If the preview chart did not look as expected, you can click the Data Range tab to select cells that contain the input data required.
We clicked the Series tab and modified the names of our series cells. To change the Series name, we clicked in the name box and cleared its contents. After that, we typed a new name, resp ave, for series one. The name changes when you click the item that you are about to change in Series pane. We repeated these steps to rename series 2 to resp max. We clicked Next to continue.
116 CICS Performance Analyzer

Figure 4-13 Chart Wizard (step 2 of 4)
The Chart Wizard window, step 3 of 4, opens. Step 3 of the chart wizard allows the setting of standard options for the chart that you created. For simplicity, we did not change anything during the process of step 3. The chart is therefore created as shown in the preview section of the Chart Wizard window in Figure 4-14.
Figure 4-14 Chart wizard (step 3 of 4)
Chapter 4. Processing extracts 117

We clicked Next to continue. Chart Wizard window (step 4 of 4) opens. During the process of step 4, we had to decide whether we wanted to place the chart as a new sheet or as an object on an existing data sheet. We kept the default and placed the chart as an object in the excel_chart data sheet. We clicked Finish to finally create our chart.
Figure 4-15 shows the chart that we created. The appearance of the chart can still be improved. You can change the way the data is shown, color, chart options, and chart type.
Figure 4-15 Microsoft Excel chart
4.4 Processing extracts with Microsoft AccessMicrosoft Access provides a chart wizard that you can use to create charts based on the data specified in a form or report. CICS Performance Analyzer allows you to export performance extracts that can be imported to Microsoft Access. To use the chart wizard, you must have Microsoft Graph 2000 installed. The following sections describe step-by-step how to:
� Export performance extract� Import extracted data to Microsoft Access� Create a form based on the extracted data� Use the chart wizard to create a chart in a form
4.4.1 Exporting performance extractRefer to 4.2.1, “Exporting performance extracts” on page 108, for a description about how to export performance extracts. After exporting the extract, we used file transfer to store the performance extract as a text file. We created directory c:\reports\msaccess for that.
4.4.2 Importing extracted data into Microsoft AccessWe clicked Start->Programs->Microsoft Access. When the main Create a New Database window opened, we clicked Cancel. To open our text file, we clicked File->Open and navigated to the directory that contains the c:\reports\msacces/acces_chart file. We clicked Open.
118 CICS Performance Analyzer

Figure 4-16 shows the Link Text Wizard window that opened. We made sure that radio button Delimited was selected since our test file is delimited by semicolons. We clicked Next, which opened another page of the link text wizard.
Figure 4-16 Link Text Wizard.
On the second page of the Link Text Wizard (Figure 4-17), we clicked the Semicolon radio button to specify which type of delimiter we used. It is important to select that the first row of our table contains field names. Otherwise Microsoft Access inserts a title line with generated field names. Therefore, we selected the First Row Contains Field Names option to avoid generating a second line of field names. We clicked Next.
Figure 4-17 Link text wizard 2
Chapter 4. Processing extracts 119

The next Link Text Wizard window allows the specification of information about the fields you are importing. You can associate field types, eliminate columns of the table, or do both. We kept the defaults and clicked Next.
On the last Link Text Wizard window we specified a name for the linked table and clicked Finish.
The Database window opened. On the left Object pane, we clicked Forms and then double-clicked Create form by using wizard.
The Form Wizard window (Figure 4-18) opened. We moved the fields we wanted in the form to the selected fields pane on the right in the window. All the fields can be moved, or only the ones that you want to use for the chart. We clicked Next.
Figure 4-18 Form Wizard
The second page of the Form Wizard appears. It allows the selection of a layout for the form. We selected the Data sheet radio button and clicked Next.
The third page of the Form wizard displays. We kept the standard style and clicked Next.
On the next Form Wizard window, we typed the name of the form and clicked Finish.
The Database window opens again (Figure 4-19). We double-clicked the form name that we created. Our form name was Access_chart.
120 CICS Performance Analyzer

Figure 4-19 Data sheet of Access_chart form
A data sheet window of form Access_chart opens. We can only use the chart wizard if the form will be displayed in design view mode. Therefore, while the form was still open, we clicked the Design View icon in the tool bar. The view of the form changed to design view.
Figure 4-20 shows the Access_chart form in design view mode. We clicked Insert->Chart while the form was displayed in design view.
Chapter 4. Processing extracts 121

Figure 4-20 Chart wizard invoked while in design view mode
The Chart Wizard window opened. We needed to specify which table or query we want to use to create the chart. Access_chart, the name of our table, is already selected. The radio button Tables is also selected. We made no further changes and clicked Next.
The second Chart Wizard window opened. Here, we selected which fields of the table contained the data for the chart. We moved the fields from which we wanted to create the chart to the right pane. We selected Tran, response time, and suspend time, which should allow a visual comparison of response time and suspend time per transaction. We selected the fields in the left pane and moved them to the right pane by clicking the button with the right arrow. When we finished moving the required fields to right pane, we clicked Next.
The third Chart Wizard window (Figure 4-21) opened. We selected a 3-D column chart. This allowed the comparison of data points along two axes and the comparison between items, dispatch time, and response time. When we chose the type of chart we wanted, we clicked Next.
122 CICS Performance Analyzer

Figure 4-21 Chart Wizard: Third window
The next chart wizard window was displayed. We used drag and drop to move field buttons, response time, and dispatch time, from the right to the data pane on the left of the chart. When both field buttons were moved, we double-clicked the Response time field button and selected Average from the list of options. Then we double-clicked the Dispatch time field button in the data pane and selected Average.
Next, we used drag and drop to move the Tran field button from the right to the Axis pane on the left of the chart wizard window. No further customization needed to be done to the Tran field button. We clicked the Preview Chart button in the upper left corner of the Chart Wizard window to check if the basic layout of the chart is displayed correctly. Then we clicked Next to continue creating our chart.
The next Chart Wizard window (Figure 4-22) opens. We did not want the chart to change from record to record, so we clicked Next.
Figure 4-22 Chart Wizard: Fourth window
Chapter 4. Processing extracts 123

The next Chart Wizard window that opened allowed the changing of the name of the chart title. We kept the name that was displayed, which is Access_chart. We clicked Finish to complete the Chart Wizard process.
We returned to the Form Design View window, which displayed the chart. The chart indeed shows sample data rather than what we expected. We discovered that if you are in a form design view when you first create a chart, you have to switch to form view to see current data. Therefore, we clicked View->Form View which displays the Access_chart form view window including the chart that we created.
Figure 4-23 shows the form view of our chart. The chart is displayed based on a single record. You can move from record to record and you see a chart that represents only the data in the current record. Based on the data you specify, the chart wizard determines whether it should display data from all fields in one global chart, or whether it is more appropriate to show a record-bound chart. We actually wanted a global chart. Therefore we switched the form view back to design view by clicking View->Design View.
Figure 4-23 Form view of a chart
The chart was displayed in design view mode (Figure 4-24). We selected the chart and clicked the Properties icon in the tool bar. You can also right-click the selected chart and then choose Properties.
When we clicked the Properties icon, the Properties window opened. We clicked data (only if it is not already open) and located the property boxes, LinkChildFields and LinkMasterFields. Both fields are linked to the Tran field of our table.
To create global chart, we unlinked the Tran field from the chart. To unlink the field, we clicked the Properties box for LinkChildFields. When a small pop-up box opened, we clicked it as well, which cleared the Properties box.
124 CICS Performance Analyzer

After that we unlinked the LinkMasterfields properties box in the same way. We closed the Properties window and verified that the chart layout changed from a record-bound chart to a global chart.
Figure 4-24 Design view of Access_chart
We changed the view back to form view by clicking View->Form View. You can customize the appearance of the chart by double-clicking the chart. The border of the chart changes to a bold light gray color. We then clicked Chart in the tool bar to see a list of options to choose from. After that, we saved the form containing the chart.
Chapter 4. Processing extracts 125

126 CICS Performance Analyzer

Part 2 CICS Performance Analyzer in action
This part goes through a sequence of scenarios that show how CICS Performance Analyzer (PA) reports and extracts can help you to analyze the behavior of your system or performance characteristics of specific applications. The scenarios we discuss cover traditional application workloads (Cobol, VSAM, DB2, MQ) as well as new Web-initiated or Java workloads.
This part also explains how you can use:
� CICS PA to evaluate the overall system performance� A series of CICS PA reports to drill down on particular problems� The Historical Database to maintain, report and export to DB2 CICS Monitoring Facility
(CMF) performance data
Part 2
© Copyright IBM Corp. 2003. All rights reserved. 127

128 CICS Performance Analyzer

Chapter 5. System setup and scenario overview
This chapter describe the ITSO CICSplex environment that we used to run our sample scenarios and generate performance data. To generate transaction workloads, we combined several applications that were used in the course of several residency projects and described in other Redbooks. Consequently, our CICSPlex configuration in this project is a combination of configurations used in other ITSO projects.
This chapter also introduces a set of scenarios that were used to demonstrate how you can use CICS Performance Analyzer (PA) to improve application performance, to verify application design, or to improve overall performance of a complex CICS system.
5
© Copyright IBM Corp. 2003. All rights reserved. 129

5.1 CICS region setupWe decided to build a configuration that would support a mixture of traditional (COBOL, VSAM, DB2) and new (Java, Enterprise JavaBean (EJB)) workloads. To simplify the CICSPlex System Manager (SM) setup, we built our CICSPlex using only one z/OS image, SC66, of the ITSO Parallel Sysplex®.
By convention, the APPLIDs of CICS regions are composed of an SCSC string concatenated with a SYSID. For example, our CICSPlex SM address space (CMAS) region has a SYSID of CMAS and the APPLID of SCSCCMAS. All CICS regions described in this chapter are connected and defined to our CMAS and run under its control.
5.1.1 Configuration for traditional workloadsTo run traditional 3270 workloads, we defined two CICS Terminal Owning Regions (TORs) with SYSIDs of PTA1 and PTA2. The workload was generated using the Teleprocessing Network Simulator (TPNS) running on another z/OS image of our Parallel Sysplex, SC47. Both TORs registered with the VTAM Generic Resource facility, so the 3270 workload was balanced between the two TORs. All transactions can also be run manually from 3270 emulation screens. The CICS level of the TOR regions was CICS Transaction Server 1.3.
Each TOR had MRO connectivity to four Application Owning Regions (AORs). AOR regions PAA1 and PAA4 were at CICS Transaction Server (TS) 2.2 level and were used to run VSAM workload. The VSAM data sets used by the workload can be opened in Record Level Sharing (RLS) mode to be accessible with update integrity from both AORs at the same time. They can also be opened in Local Shared Resource (LSR) mode. However, if one of the two AORs opened them for update, another can only open them for read and browse operations. Dynamic transaction routing under control of CICSPlex SM was used to forward the VSAM workload to AORs.
In the problem determination scenario described in Chapter 18, “Using CICS Performance Analyzer reports for problem determination” on page 385, we had TPNS create a workload as though users were signing on to PAA1 directly, and PTA1 was used as an FOR to function ship file requests, and tuned for file IO appropriately.
AOR regions PJA6 and PJA7 were at CICS TS 2.2 level, and they were used to run DB2, Java, and EJB workloads. The DB2 and Java simulated workloads were also generated by TPNS using the same 3270 network definitions as those used for the VSAM workload. We used static transaction routing definitions to forward transactions that access DB2 tables from PTA1 to PJA7 and from PTA2 to PJA6 (see Chapter 7, “Tuning the CICS DB2 attachment facility” on page 171). The Java transaction was routed in a similar way (see Chapter 12, “Java applications in CICS” on page 267).
5.1.2 Configuration for Enterprise JavaBean workloadsTo run EJB workloads, we built a logical EJB server composed of two Internet Inter-ORB Protocol (IIOP) listener regions, PLA1 and PLA2, and two Java AORs, PJA6 and PJA7. The workload was generated using a set of batch script files running on a workstation. All applications can also be run manually from a browser through a menu provided by a servlet that could be invoked in a WebSphere Application Server on a Windows 2000 workstation. In both cases, the client (command line client or servlet) invokes an Enterprise JavaBean running in CICS Java AORs. The CICS level of the IIOP listener regions and Java AORs was CICS TS 2.2.
130 CICS Performance Analyzer

To enable CICS to publish references to the home interfaces of enterprise beans and to enable enterprise bean clients to obtain these references using the Java Naming and Directory Interface (JNDI) API, we set up a name server using a z/OS Lightweight Directory Access Protocol (LDAP) server. This LDAP server can run on any MVS image, but we used it to start on the same image where our CICS regions ran.
Each of the listener regions had MRO connectivity to each of the Java AORs. There is also MRO connectivity between PJA6 and PJA7 because one of our enterprise bean applications required access to a partner AOR.
The listener regions used TCP/IP port sharing, so the IIOP inbound requests could be balanced between the listener regions. The distributed routing mechanism, implemented by CICSPlex SM provided EYU9XLOP program, was used to balance method requests across AORs PJA6 and PJA7.
The Java AORs are connected to a DB2 subsystem D7Q2 and they also share a set of VSAM data sets opened in RLS mode used by our enterprise bean application. There are two versions of an application that use VSAM RLS files and two versions using DB2 data (JDBC and SQLJ).
For a complete description of how to set up a CICS logical EJB server, refer to CICS Transaction Server for z/OS Java Applications in CICS, SC34-6000, and Chapter 5 in the IBM Redbooks publication Enterprise JavaBeans for z/OS and OS/390 CICS Transaction Server V2.2, SG24-6284. You can also refer to Chapters 10, 11, and 12 in the SG24-6284 book for a description of the ITSO enterprise bean Trader application.
5.1.3 CICS Web Support and 3270 Bridge setupTo demonstrate use of CICS PA in conjunction with CICS Web Support and 3270 Bridge, we used a stand-alone CICS TS V1.3 region PAA6 and the CICS TS V2.2 region PJA6. Applications were run manually from a browser window. Refer to Chapter 11, “CICS Web Support and 3270 Bridge” on page 257, for more details.
5.1.4 CICS Transaction Gateway setupWe also included two CICS Transaction Gateways in our configuration: one running on z/OS and another running on a Windows 2000 workstation. With the z/OS version of the gateway, an application can only use External CICS Interface (EXCI) to access CICS programs. With the distributed (Windows, for example) version of the gateway, an application can use External Call Interface (ECI) to access CICS programs or External Presentation Interface (EPI) to access CICS 3270 transactions. One of our applications running in WebSphere Application Server used ECI calls (not EPI) to invoke a CICS program. When the z/OS gateway is used, the ECI calls are mapped to EXCI calls that provide the same functionality, so our application could access CICS through either one of the gateways.
Both varieties of the CICS Transaction Gateway allow limited workload management between CICS regions to which the gateway is connected. We decided to define one upstream connection for each of the gateways. We connected the z/OS gateway to region PJA6 and the distributed gateway to region PJA7. The distributed gateway was connected using the new ECI over TCP/IP communication mechanism introduced in CICS TS V2.2.
As was the case with the IIOP workload, the workload through gateways was generated using a set of batch script files running on a workstation. The application can also be run manually from a browser through a menu provided by a servlet that can be invoked in a WebSphere Application Server on a Windows 2000 workstation. In both cases, an Enterprise
Chapter 5. System setup and scenario overview 131

JavaBean running in WebSphere Application Server on Windows 2000 invokes a CICS program through the gateway.
For a description of how to set up the CICS Transaction Gateway on various platforms, refer to CICS Transaction Gateway V5: The WebSphere Connector for CICS, SG24-6133. For a description of the ECIRequest version of the ITSO Trader application, refer to Chapter 10 of Enterprise JavaBeans for z/OS and OS/390 CICS Transaction Server V2.2, SG24-6284.
Figure 5-1 shows our connectivity setup. MRO connections from all the CICS regions to the CMAS, as well as IP connections between Java AORs (PJA6 and PJA7) and the LDAP server, are not shown on the chart.
Figure 5-1 CICS region setup
Figure 5-2 shows how our AORs accessed VSAM and DB2 data.
TPNS
PLA2
3270 VSAM/DB2 workload
z/OS CTG
PAA4
ECIRequestworkload
PTA2PTA1
PJA7PJA6
Browser
PAA1
IP port sharing
IIOP Trader workload
WebSphere Application Server V4.0
Web application
Batchclient
workload
PLA1
Non z/OS CTG
EXCI ECI over TCP/IP
SC66
SC47
ECIRequestworkload
CMAS
IIOP IIOP
PAA6BrowserHTTP
LDAP
132 CICS Performance Analyzer

Figure 5-2 VSAM and DB2 data access
Table 5-1 summarizes the functions of different CICS regions in our setup.
Table 5-1 CICS region summary
5.2 ScenariosThis section provide a brief description of scenarios that we used to demonstrate how you can use CICS PA to improve performance of a given application or analyze performance of a complex CICS system.
CICS APPLID CICS SYSID Function and CICS TS level
SCSCCMAS CMAS CICSPlex SM CMAS (2.2)
SCSCPTA1 PTA1 Terminal Owning Region (1.3)
SCSCPTA2 PTA2 Terminal Owning Region (1.3)
SCSCPLA1 PLA1 IIOP Listener Region (2.2)
SCSCPLA2 PLA2 IIOP Listener Region (2.2)
SCSCPAA1 PAA1 Application Owning Region (1.3)
SCSCPAA4 PAA4 Application Owning Region (1.3)
SCSCPAA6 PAA6 Application Owning Region (1.3)
SCSCPJA6 PJA6 Application Owning Region (2.2)
SCSCPJA7 PJA7 Application Owning Region (2.2)
PAA4
PJA7PJA6
PAA1
VSAM LSR
DB2
SC66
VSAM RLS
Note: The scenarios were used to provide situations that allow us to demonstrate the use of CICS Performance Analyzer reports and extracts. The CICS regions were not necessarily tuned for peak performance. And in some cases, a high level of tracing was active. Therefore, these scenarios and the results are provided for demonstration purposes only. They do not provide definitive results for a customer environment.
Chapter 5. System setup and scenario overview 133

5.2.1 VSAM application performance analysis and Transaction Resource Monitoring support
In this scenario (refer to Chapter 6, “VSAM application performance analysis and Transaction Resource Monitoring support” on page 139), we generate the following CICS PA reports:
� Performance Summary report� Performance List report � Performance List Extended report � Transaction Resource Usage report� Transaction File Usage Summary report
We use them to compare execution characteristics of an application that is composed of a set of nine transactions that access nine VSAM data sets. You can access the VSAM data sets in either Local Shared Resources (LSR) or Record Level Sharing (RLS) mode.
This approach can be useful if you want to determine whether LSR or RLS access will provide better response time in a case of a specific application in your environment. We also show how the CICS PA reports can help you tune your LSR pool.
5.2.2 Tuning the CICS-DB2 attachment facilityIn this scenario (refer to Chapter 7, “Tuning the CICS DB2 attachment facility” on page 171), we generate the following CICS PA reports:
� DB2 Short Summary report � DB2 Long Summary report � DB2 Recap report � DB2 List report
We use them to adjust values of parameters that influence performance of the CICS DB2 attachment facility. We also show the difference in usage of system resources between a threadsafe and a non-threadsafe environment.
5.2.3 WebSphere MQ In this scenario (refer to Chapter 8, “WebSphere MQ” on page 205), we focused on the following WebSphere MQ reports:
� Class 1 List and Summary reports� Class 3 List and Summary reports
We use these report to determine which kind of the MQ API requests are issued in CICS applications. We relate the WebSphere MQ reports to a CICS performance report and show the Transaction Temporary Storage Usage Summary report.
5.2.4 CICS use of MVS System LoggerIn this scenario (refer to Chapter 9, “CICS and MVS System Logger” on page 223), we generate the following CICS PA reports:
� System Logger Logstream Summary report� System Logger List report
We use these reports to identify possible areas of improvement with regards to allocation of a direct access storage device (DASD)-only log stream for use by the CICS logger component.
134 CICS Performance Analyzer

5.2.5 CICS access through CICS Transaction GatewayIn this scenario (refer to Chapter 10, “Scenarios with CICS Transaction Gateway” on page 241), we generate the following CICS PA reports:
� Performance Summary report� Performance List report
We use them to compare internal CICS response times and consumption of system resources by a CICS application that is invoked from the WebSphere Application Server environment in two cases:
� CICS Transaction Gateway for z/OS � CICS Transaction Gateway for Windows 2000 accessing CICS through ECI over TCP/IP
We also show how CICS PA can help us to determine how a CICS client application uses the ECI interface and suggest a possible improvement.
5.2.6 CICS Web Support and 3270 BridgeIn this scenario (refer to Chapter 11, “CICS Web Support and 3270 Bridge” on page 257), we generate the following CICS PA reports:
� Transaction Group report� Transaction Group Summary report
We use these reports to tune our CWS environment for better performance.
5.2.7 Java applications in CICSIn this scenario (refer to Chapter 12, “Java applications in CICS” on page 267), we generate the following CICS PA reports:
� Performance Summary report� Performance List report
We use these reports to:
� Compare behavior of a CICS Java application in the environment of a resettable Java Virtual Machine (JVM) to the behavior in the environment of a non-resettable JVM.
� Show the advantage of using shared application classpaths.
5.2.8 Enterprise JavaBeans in CICSIn this scenario (refer to Chapter 13, “Enterprise JavaBeans in CICS” on page 285), we generate the following CICS PA reports:
� Performance List report� Performance Summary report
We use these reports to determine the optimum number of JVMs to be run in our CICS regions. We also use these reports to compare consumption of system resources by the same CICS enterprise bean application in three different data access cases:
� Access to VSAM data sets through JCICS classes� Access to DB2 data through JDBC interface� Access to DB2 data through SQLJ interface
Chapter 5. System setup and scenario overview 135

5.2.9 Application Naming supportIn this scenario (refer to Chapter 14, “Application Naming support” on page 311), we show how to implement the new Application Naming support introduced by CICS TS V2.2 authorized program analysis report (APAR) PQ63143 and CICS TS V1.3 APAR PQ63141. We use the CICS PA Performance List report.
5.2.10 CALL and LINK performanceIn this scenario (refer to Chapter 15, “CALL and LINK performance” on page 319), we compare CPU consumption of an EXEC CICS LINK command to that of a CALL command when used in a COBOL language program in LE/370 environment. We also show how to use event monitoring points to add user fields to CMF performance records and how to handle these fields with CICS PA. We use the CICS PA Performance List report.
5.2.11 Exception reportingIn this scenario (refer to Chapter 16, “Exception reporting” on page 343), we show how to generate CICS PA exception reports:
� Exception List report� Exception Summary report
5.2.12 Analyzing overall CICS system performanceIn this scenario (refer to Chapter 17, “Analyzing overall system performance” on page 355), we use various CICS PA reports to analyze overall performance of a complex CICS system that runs a mix of transactions that have different execution characteristics. We generate the following CICS PA reports:
� Performance List report� Cross-System Work report� Workload Activity report
5.2.13 Using CICS Performance Analyzer reports for problem determinationIn this scenario (refer to Chapter 18, “Using CICS Performance Analyzer reports for problem determination” on page 385), we use various CICS PA reports to analyze the impact that an application change makes to our CICS system. We identify problems introduced by the change, and through a series of reports, can identify the program changes responsible for the problem. We generate the following CICS PA reports:
� Performance Summary report� Wait Analysis report� Cross-System report� Transaction Resource Usage List report� Performance List report
136 CICS Performance Analyzer

5.2.14 Historical Database (HDB)In this scenario (refer to Chapter 19, “Historical Database” on page 415), we show how to use all options from the Historical Database. A Summary HDB is used to demonstrate:
� Template� Define� Load� Report� Maintenance� Housekeeping
A List HDB is used to show the new export function for loading CICS performance data from SMF records into a DB2 table.
Chapter 5. System setup and scenario overview 137

138 CICS Performance Analyzer

Chapter 6. VSAM application performance analysis and Transaction Resource Monitoring support
This chapter demonstrates how we used the capabilities of CICS Performance Analyzer (PA) to measure the achieved performance objectives of a 3270 VSAM RLS/LSR application scenario. The various CICS Performance Analyzer tasks that are necessary to measure the performance data are described in detail.
It also discusses and uses the new Transaction Resource Monitoring feature introduced by CICS Transaction Server (TS) V2.2 authorized program analysis report (APAR) PQ63143. The equivalent CICS TS V1.3 APAR is PQ63141. For a description of Application Naming support, refer to Chapter 14, “Application Naming support” on page 311.
When the Transaction Resource Monitoring feature was introduced by APARs PQ63143 and PQ63141, the default for the DFHMCT TYPE=INITIAL FILE parameter was 0. The default value is now 8. This new default is introduced by CICS TS V2.2 APAR PQ76701. The equivalent CICS TS V1.3 APAR is PQ76695.
Transaction Resource monitoring is enhanced further with APARs PQ76703 and PQ76698 for CICS TS V2.2 and CICS TS V1.3 respectively. These APARs permit writing monitoring resource class records for resource managers such as DB2 and DBCTL used by transactions.
Refer to Table 2-1 on page 26 for a concise list of the enabling program temporary fixes (PTFs).
6
Note: These scenarios were used to provide situations that allow us to demonstrate the use of CICS Performance Analyzer reports when running with various VSAM workloads. The CICS regions were not necessarily tuned for peak performance. In some cases, they had a high level of tracing active. Therefore, these scenarios and the results provided for demonstration only. They do not provide definitive results for a customer environment.
© Copyright IBM Corp. 2003. All rights reserved. 139
6.1 CICS VSAM interfaceCICS file control supports three VSAM access modes:
� Local shared resources (LSR): These files share a common pool of buffers as well as a common pool of strings.
� Nonshared resources (NSR): CICS files that are defined as nonshared have their own buffers and strings.
� VSAM Record Level Sharing (RLS): Unlike LSR or NSR access modes, VSAM RLS allows multiple CICS TS regions to access VSAM files for update with full data integrity.
In a traditional CICSplex system setup consisting of Terminal Owning Regions (TORs), Application Owning Regions (AORs), and File Owning Regions (FORs), CICS LSR files and NSR files can be shared by using function shipping of file control requests to the FOR region. Function shipping to FOR regions can be processed with data integrity.
Using a single FOR in your CICSplex had some disadvantages. When you use an FOR, there is a single point of failure. If the FOR region is lost for whatever reason, you have no access to your VSAM data sets. FORs cannot help if you need to share data sets between CICS and batch regions.
RLS support was introduced by DFSMS 1.3, and CICS supports RLS access from CICS TS V1.1. VSAM RLS allows one to share VSAM files sysplex-wide among multiple CICS TS AOR regions with full update integrity. Nonrecoverable files can be read and updated by CICS and batch jobs concurrently.
We used the CICS Performance Analyzer to investigate the performance behavior of a set of CICS transactions that access VSAM data sets in LSR or RLS mode.
6.2 CICS VSAM RLS scenario descriptionTo produce useful and realistic performance data for the VSAM performance scenario project, we used a traditional 3270 COBOL VSAM application that was used previously in other Redbooks projects. The application is using nine VSAM files which can be opened in either RLS or LSR mode. Therefore, we investigated both an RLS and an LSR VSAM performance scenario. The 3270 VSAM application can be invoked using another complete set of definitions and resources. Therefore, each function of the application exists twice. All the resource definition names of the alternative set of definitions have an X character in their names. When we use both sets of definitions to invoke the VSAM application, we use eighteen VSAM files for the entire application.
We used the Teleprocessing Network Simulator (TPNS) to simulate a realistic 3270 workload environment.
The 3270 VSAM application workload consists of four business applications:
� Hotelres: This is a simple 3270 hotel reservation application using two VSAM data sets. There are four transactions available which drive the application: HR1, HR2, HX1, and HX2.
Important: A new function, Transaction Resource Monitoring, allows collection of information about individual files, and can give a breakdown of file usage by transaction ID. For more information about this new function and Application Naming support, refer to Chapter 14, “Application Naming support” on page 311, which describes these new functions in greater detail.
140 CICS Performance Analyzer

� Inventor: This is an inventory tracking application. It is mainly using four transactions to manage the inventory. Transactions IT8/IX8 update the inventory, and transactions IT2/IX2 are used to inquire about part locations within the inventory.
� Specification: This is a bill of material management application. It is using four transactions (PS2/PX2 and PS3/PX3) to inquire information about part lists.
� Stock: This is a stock control application. Transactions SC2/SX2 are used to update any inventory, transactions SC4/SX4 allow you to insert new vendors, and transaction SC6/SX6 is used to delete parts from the stock.
Figure 6-1 illustrates the VSAM RLS/LSR file usage of the entire workload. We do not describe non-VSAM-related aspects of the workload, such as program and map design, since they are not relevant to our VSAM performance scenario.
Refer to Chapter 5, “System setup and scenario overview” on page 129, for a full description of the CICS environment setup we used to run the workload in RLS or LSR mode.
Figure 6-1 3270 VSAM application workload
6.2.1 RLS workload generationWe used Teleprocessing Network Simulator (TPNS) to generate an appropriate 3270 VSAM workload. TPNS is a terminal and network simulation tool. Apart from a number of other functions, it can be used to simulate 3270 terminal operator input. This is done by arranging a TPNS script. A TPNS script consists of a message generation deck and a network definition. There is one message generation deck available for each transaction. It controls the messages from the simulated device to the subsystem. The network definition describes the terminal characteristics for each terminal that is to be simulated.
We arranged a message generation deck for each transaction as well as a network definition for two hundred 3270 terminals. This allows us to simulate two hundred 3270 terminals that
TPNS
HR1HR2
Hotel1 EMPACTDB ITEMACT LABOPSDB DEPSUMDB ITEMMAST COMPOSDB VENDOR INVENTOR
SC2SC4
SC6PS2PS3
IT2 IT8
HX1HX2
HOTEL1X EMPACTDX ITEMACTX LABOPSDX DEPSUMDX ITEMMASX COMPOSDX VENDORX INVENTOX
SX2SX4 SX6
PX2Px3
IX2 IX8
SC66
Chapter 6. VSAM application performance analysis and Transaction Resource Monitoring support 141

can invoke transactions that compose our VSAM application. To run some transactions more often than others, we used the PATH statement to define a sequence of transactions for each terminal to process. For each transaction in the path, we specified a number in a DIST statement that corresponds to the entry in the path.
Example 6-1 shows how we specified the probability of distribution for our workload scenario. TPNS adds all the numbers in the DIST statement. After that, it generates a random number between 1 and the sum. TPNS then chooses the deck that has the number in its range.
Example 6-1 Probability of distribution
1 PATH PS3,PS2,IT8,IT1,IT2,HR1, SC6,SC2,SC4,TS1, PX3,PX2,IX8,IX1,IX2,HX1, SX6,SX2,SX4,TX1 * 1 DIST 90,100,80,30,60,30, 100,30,20,40, 90,100,80,30,60,30, 100,30,20,40
6.2.2 Performance objectivesThe performance objectives and priorities depend very much on user expectations. From our previous experiences with the application, we know what average response times we can expect for different transactions. From the point of view of a terminal user, this is the most important characteristic. Another priority we have is that the application run without any resource constraints to avoid deadlocks, waits, or abends. We expect the workload we generate with TPNS to run smoothly and hope to achieve maximum throughput.
Figure 6-1 summarizes our performance objectives.
Table 6-1 VSAM scenario performance objectives
We are ready now to start the VSAM workload using TPNS. We gather the necessary performance data and analyze the results using a CICS Performance Analyzer summary report.
Application Transaction Response ave Response max
HOTEL HR1 HX1 < 0,05 0,1
INVENTOR IT8, IX8 <0,15 0,2
INVENTOR IT2, IX2 <0,015 0,02
SPECIFIC PS2,PS3,PX2,PX3
<0,015 0,05
STOCK SC2,SC4,SC6,SX2,SX4,SX6
<0,04 0,06
142 CICS Performance Analyzer

6.3 Running the VSAM RLS scenarioThis section describe the tasks that we performed to collect the performance data for our VSAM application. First we used CICS Performance Analyzer functionality to provide an overview of the performance behavior of the application. We performed the following steps:
1. Start TPNS and run the entire application for about 15 minutes. The application runs through TORs PTA1,PTA2 and AORs PAA1,PAA4.
2. Switch storage management subsystem (SMF) data sets. Note the name of the archived SMF data set that contains our performance data.
3. Create a summary performance report using CICS Performance Analyzer:
a. Create a Summary Report Formb. Create an Object Listc. Create a Report Set
4. Submit generated JCL and check the results.
6.3.1 Updating system definitionsAfter we ran TPNS for about 15 minutes, we switched SMF data sets and recorded the name of the archived SMF data set that contains the necessary performance records. The name of the data set is SMFDATA.ALLRECS.G8328V00.
CICS Performance Analyzer can automatically populate your systems definitions with details extracted from SMF files. To check that we are using the correct SMF data set and that we collected performance data for all the systems, we used the Take-up function first.
To perform the data Take-Up from SMF, we followed these steps:
1. From the CICS Performance Analyzer Primary Option Menu, we selected option 1.
2. Then the System Definitions menu opens. We selected option 4.
3. The Data Take-Up from SMF screen is displayed. We updated this screen with the SMF data set name as shown in Figure 6-2. Then, we pressed the Enter key to generate a batch job to extract the details from the SMF data set.
Figure 6-2 Data Take-Up from SMF screen
------------------------- System Definitions ------------------------- File Options Help ------------------------------------------------------------------- Data Take-Up from SMF Command ===> Specify the SMF File for data take-up. Data Set Name . . . 'SMFDATA.ALLRECS.G8328V00' Specify details if data set is not cataloged: UNIT . . . . . + VOLSER . . . + SEQ Number . . (1 to 255) Execution Mode: 1 1. Submit Batch JCL 2. Edit Batch JCL ----------------------------------------------------------------------
Chapter 6. VSAM application performance analysis and Transaction Resource Monitoring support 143

When the job completed, we were prompted to update your system definitions with the results of the batch job. The prompt opens when we reach the System Definitions screen the next time.
When the generated batch job has completed, we verified that we had SMF records for MVS image SC66 as well as for the CICS systems participating in the workload. We also checked that the time interval of our TPNS run was processed using this SMF data set. Figure 6-3 shows the output that was produced by the Take-up job.
Figure 6-3 Take-Up from SMF output
Take-up processing updates the system definitions automatically. We invoked the Systems Definitions screen by selecting option 1 from the System Definitions Menu. Figure 6-4 shows the System Definition screen after processing Take-Up from SMF. It shows that the CICS systems we used were added automatically during take-up processing.
Figure 6-4 System definitions after Take-Up from SMF
After that, we looked at the CICS System Definition entry for one of our AORs. We entered the S line command next to our AOR SCSCPAA1 listed on the System Definition screen.
V1R3M0 13:28:14 10/09/2003 CICS Performance Analyzer Page 1 Take-up from SMF ________________ CPA2012I Processing started for SMF file SMFIN001 CPA2017I SMF records for System SC66 start at 10/07/2003 17:39:08.14 CPA2016I MVS System Logger record found, System=SC66LOGR CPA2014I CMF record for CICS system found, APPLID=SCSCPAA1 Release=5.3.0 CPA2014I CMF record for CICS system found, APPLID=SCSCPJA6 Release=6.2.0 CPA2015I DB2 Accounting record found, DB2 SSID=D7Q2 Release=7.1 CPA2014I CMF record for CICS system found, APPLID=SCSCPTA2 Release=5.3.0 CPA2014I CMF record for CICS system found, APPLID=SCSCPJA7 Release=6.2.0 CPA2014I CMF record for CICS system found, APPLID=SCSCPTA1 Release=5.3.0 CPA2014I CMF record for CICS system found, APPLID=SCSCPAA4 Release=5.3.0 CPA2013I Processing ended for SMF file SMFIN001 - 8 system(s) found CPA2000I Take-up processing has completed, RC=0
File Edit Filter View Options Help ------------------------------------------------------------------------------ System Definitions Row 1 from 15 Command ===> Scroll ===> CSR Select a System to edit its definition, SMF Files and Groups. SMF Files / System Type Image Description System SC66 Image System added by take-up SC66 SCSCPAA1 CICS SC66 System added by take-up SCSCPAA1 SCSCPTA1 CICS SC66 System added by take-up SCSCPTA1 SCSCPTA2 CICS SC66 System added by take-up SCSCPTA2 SCSCPAA4 CICS SC66 System added by take-up SCSCPAA4 SC66LOGR Logger SC66 System added by take-up SC66LOGR SCSCPJA7 CICS SC66 System added by take-up SCSCPJA7 SCSCPAA6 CICS SC66 System added by take-up SCSCPLA1 CICS SC66 System added by take-up SCSCPJA6 CICS SC66 System added by take-up SCSCPJA6 SCSCPAME CICS SC66 System added by take-up SCSCPLA2 CICS SC66 System added by take-up SCSCLSA5 CICS SC66 System added by take-up SCSCCMAS CICS SC66 System added by take-up
144 CICS Performance Analyzer

The CICS System screen opens. We did not change any information on the CICS System screen. The name of the SMF data set was added to the screen automatically. For the moment, we did not want to process any user fields in our reporting. Therefore we did not need to specify further information like the name of an MCT or MCT load library. The default MCT is sufficient for now so all the information that was set by Take-Up from SMF processing is fine.
6.3.2 Creating a Summary Report FormTo see an overview of the performance behavior of our VSAM application, we had to arrange a Summary Report Form to view a performance summary of average response time, suspend time, and VSAM wait time. The format and content of the Summary Report can be customized using the Summary Report Form screen. Refer to 2.10.1, “Creating the Report Forms data set” on page 44, for a complete description of how to use Report Forms.
Figure 6-5 shows the fields that we moved above the end of report line. These are the fields that will fit in the report title line. They are included in the same order as they appear in the list. All the fields below the end of report line are ignored.
Figure 6-5 VSAM application Performance Summary fields
We created a new Report Form by selecting option 3 from the Primary Option Menu. In the command line, we typed NEW to create a new Report Form. The New Report Form screen opens, as shown in Figure 6-6. We entered a new name for the Report Form which is VSAMSUM. Then we typed the CICS APPLID. The CICS version was updated automatically.
File Edit Confirm Upgrade Options Help ------------------------------------------------------------------------------ EDIT SUMMARY Report Form - VSAMSUM Row 1 of 195 More: > Command ===> Scroll ===> CSR Description . . . Summary Report Form Version (VRM): 530 Selection Criteria: Performance Field / Name + S Type Fn Description TRAN A Transaction identifier RESPONSE AVE Transaction response time DISPATCH TIME AVE Dispatch time CPU TIME AVE CPU time SUSPEND TIME AVE Suspend time FCTOTAL AVE File Control requests RLSWAIT TIME AVE RLS File I/O wait time FCWAIT TIME AVE File I/O wait time FCADD AVE File ADD requests FCBROWSE AVE File Browse requests FCDELETE AVE File DELETE requests FCGET AVE File GET requests FCPUT AVE File PUT requests EOR ---------------- End of Report ---------------- EOX ---------------- End of Extract --------------- SC24UHWM AVE UDSA HWM below 16MB SC31UHWM AVE EUDSA HWM above 16MB ........ ........
Chapter 6. VSAM application performance analysis and Transaction Resource Monitoring support 145

Fields from CICS versions higher than 130 will not be available so use care as to which report is to be used when there are SMF records from mixed environments (refer to 17.2, “Working with different CICS system releases” on page 358, for further discussion).
We completed the new Report Form screen and pressed Enter. The Summary Report Form screen opens. A set of line commands can be used now to move fields that should appear in the summary report above the end of report line. Unwanted fields can be either deleted or moved below the end of report line. The end of extract line shown in Figure 6-5 is not used for Performance Summary reports.
Figure 6-6 New Report Form screen
6.3.3 Creating an Object ListObject Lists are introduced in 2.12, “Maintaining Object Lists” on page 56. This section describes how we created an Object List definition for the VSAM application. For the VSAM application scenario, we use 20 transaction definitions. Object Lists allow us to define a set of values that we can use to specify selection criteria for filtering SMF data for your reports. Therefore an Object List can be used to define all the transactions that belong to the VSAM application and use it as selection criteria in all reports that we will process to investigate the application performance.
To create an Object List for the VSAM application, we completed these steps:
1. From the Primary Option Menu, we selected option 4 (Object Lists).
2. The Object Lists screen opens. We entered the NEW command to create a new Object List. Figure 6-7 shows the new Object List screen we used to create the VSAMTRAN Object List. We pressed Enter to create the Object List and display the edit screen.
---------------------------- Report Forms ----------------------------- File Systems Options Help -------------------------------------------------------------------- New Report Form Command ===> Specify the name of the new Report Form and its options. Name . . . . . . VSAMSUM APPLID . . . . . SCSCPAA1 + Version (VRM) . . 530 MVS Image . . . . Field Categories Form Type or Model . . 3 1. List 2. List Extended (Sorted) 3. Summary 4. Model (specified below) Model
146 CICS Performance Analyzer

Figure 6-7 New Object List screen
3. We added the first transaction name in the first Value field. Line action I can be used to insert another line for entry of the second transaction.
4. We continued until we added all transactions that belong to the VSAM application.
5. We pressed PF3 to save the new Object List.
6.3.4 Creating a Report SetFinally, we needed to create a Report Set to run the performance summary process. From the Primary Option Menu, we typed option 2. The Reports Sets screen opens. In the command line, we typed NEW to create a new Report Set. The New Report Set screen opens. In the name field, we typed a new name for the Report Set which is VSAMSUM. Figure 6-8 shows the Edit Report Set screen.
Figure 6-8 Edit Report Set screen
We type line action S next to the Summary Report field. Figure 6-9 shows the Performance Summary Report screen.
---------------------------- Object Lists ----------------------------- New Object List Enter required field Command ===> Specify the name of the new Object List and optional model. Name . . . VSAMTRAN Model . .
File Systems Confirm Options Help ------------------------------------------------------------------------------ EDIT Report Set - VSAMSUM Row 1 of 34 Command ===> Scroll ===> CSR Description . . . CICS PA Report Set Enter "/" to select action. ** Reports ** Active - Options No Global No - Selection Criteria No Performance No Exception No - Performance Reports No List No List Extended No S Summary No Totals No Wait Analysis No Cross-System Work No Transaction Group No BTS No ..........
Chapter 6. VSAM application performance analysis and Transaction Resource Monitoring support 147
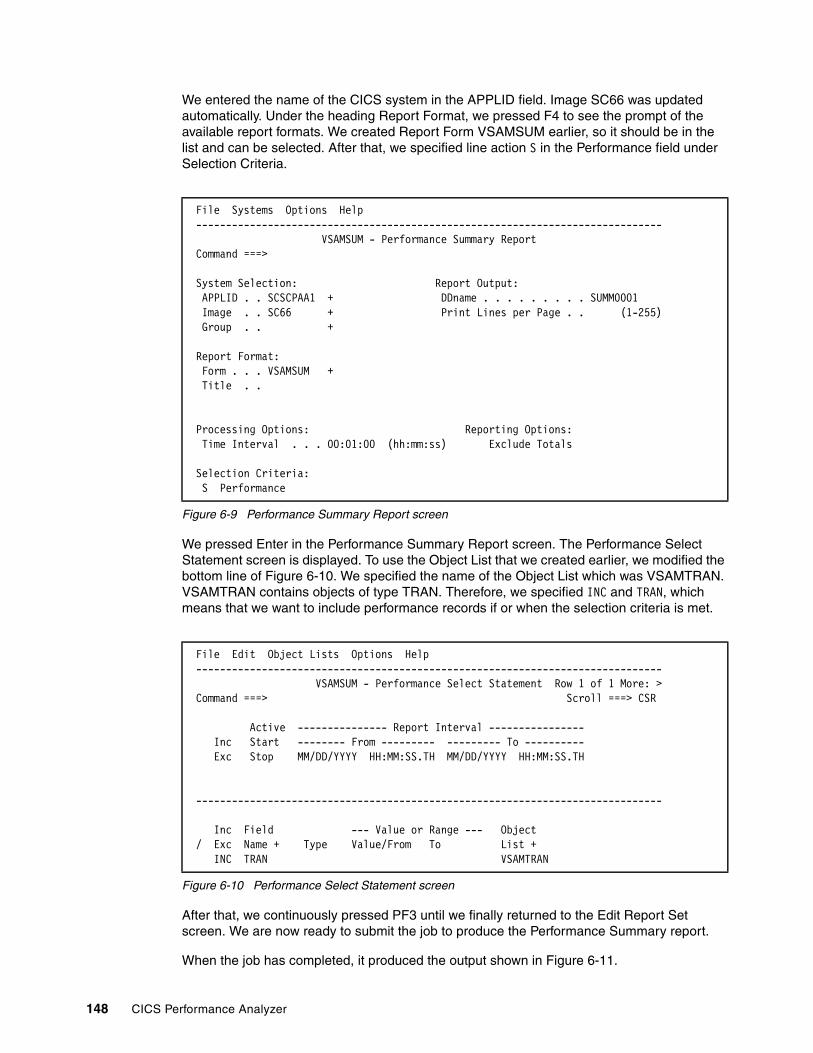
We entered the name of the CICS system in the APPLID field. Image SC66 was updated automatically. Under the heading Report Format, we pressed F4 to see the prompt of the available report formats. We created Report Form VSAMSUM earlier, so it should be in the list and can be selected. After that, we specified line action S in the Performance field under Selection Criteria.
Figure 6-9 Performance Summary Report screen
We pressed Enter in the Performance Summary Report screen. The Performance Select Statement screen is displayed. To use the Object List that we created earlier, we modified the bottom line of Figure 6-10. We specified the name of the Object List which was VSAMTRAN. VSAMTRAN contains objects of type TRAN. Therefore, we specified INC and TRAN, which means that we want to include performance records if or when the selection criteria is met.
Figure 6-10 Performance Select Statement screen
After that, we continuously pressed PF3 until we finally returned to the Edit Report Set screen. We are now ready to submit the job to produce the Performance Summary report.
When the job has completed, it produced the output shown in Figure 6-11.
File Systems Options Help ------------------------------------------------------------------------------ VSAMSUM - Performance Summary Report Command ===> System Selection: Report Output: APPLID . . SCSCPAA1 + DDname . . . . . . . . . SUMM0001 Image . . SC66 + Print Lines per Page . . (1-255) Group . . + Report Format: Form . . . VSAMSUM + Title . . Processing Options: Reporting Options: Time Interval . . . 00:01:00 (hh:mm:ss) Exclude Totals Selection Criteria: S Performance
File Edit Object Lists Options Help ------------------------------------------------------------------------------ VSAMSUM - Performance Select Statement Row 1 of 1 More: > Command ===> Scroll ===> CSR Active --------------- Report Interval ---------------- Inc Start -------- From --------- --------- To ---------- Exc Stop MM/DD/YYYY HH:MM:SS.TH MM/DD/YYYY HH:MM:SS.TH ------------------------------------------------------------------------------ Inc Field --- Value or Range --- Object / Exc Name + Type Value/From To List + INC TRAN VSAMTRAN
148 CICS Performance Analyzer

Figure 6-11 Performance Summary RLS
When we looked at the output that was produced by the CICS Performance Analyzer Performance Summary report, we found that it pretty much complied with the expectations documented in 6.2.2, “Performance objectives” on page 142. There was one exception. The average response time of transaction IX8 was longer than expected. The average RLS wait time of 0,1139 seconds is more or less as expected but the average suspend time seems to be above our expectations. The average RLS wait time is a component of the average suspend time. We compared average RLS wait time with average suspend time of the other transactions that are part of the VSAM application. The average suspend time of transaction IX8 is worth a closer look.
Before we produced further reports to find the reasons for the increased suspend time, we wanted to produce a chart of the performance behavior first. If you have to present the results of your application performance tests, charts are visually appealing and make it easier for people to compare the performance behavior. It may be easier to look at charts to see whether performance improved rather than investigate many rows and columns of a large performance report.
We created a chart that displays average response time, average dispatch time, and average suspend time per transaction. We performed the following steps to create the chart that is shown in Figure 6-14.
1. Create a Report Set to export a performance extract.2. Download the extract data set to a workstation as a text file.
The text file was imported to Microsoft Excel.
We created a chart based on the imported extract. From the CICS Performance Analyzer Primary Options Menu, we typed option 2 (Report Sets). In the command line, we typed NEW to create a new Report Set. We give our new report set a name, then press the Enter key. The Edit Report Set screen appears. Under heading Extracts, we typed line action S next to the Export option. The Export screen is shown in Figure 6-12.
V1R3M0 CICS Performance Analyzer Performance Summary __________________________________________________ SUMM0001 Printed at 17:43:59 10/07/2003 Data from 16:47:59 10/07/2003 to 17:37:24 10/07/2003 Page 1 Avg Avg Avg Avg Avg Avg Avg Avg Avg Avg Avg Avg Tran Response Dispatch User CPU Suspend FC Total RLS Wait FC Wait FCADD FCBROWSE FCDELETE FCGET FCPUT Time Time Time Time Time Time HR1 .0073 .0034 .0017 .0039 2 .0033 .0000 0 0 0 1 1 HX1 .0088 .0033 .0017 .0054 2 .0041 .0000 0 0 0 1 1 IT1 .0102 .0045 .0025 .0057 0 .0000 .0000 0 0 0 0 0 IT2 .0088 .0066 .0030 .0023 17 .0016 .0000 0 0 0 17 0 IT8 .0170 .0071 .0030 .0099 14 .0092 .0000 3 0 0 9 2 IX1 .0104 .0046 .0025 .0058 0 .0000 .0000 0 0 0 0 0 IX2 .0110 .0061 .0030 .0048 17 .0042 .0000 0 0 0 17 0 IX8 .2001 .0078 .0033 .1922 14 .1139 .0000 3 0 0 9 2 PS2 .0075 .0066 .0032 .0008 18 .0002 .0000 0 0 0 18 0PS3 .0106 .0095 .0045 .0011 34 .0001 .0000 0 0 0 34 0 PX2 .0073 .0063 .0032 .0010 18 .0003 .0000 0 0 0 18 0 PX3 .0102 .0095 .0045 .0007 34 .0002 .0000 0 0 0 34 0 SC2 .0324 .0071 .0034 .0253 18 .0246 .0000 0 0 0 9 9 SC4 .0099 .0072 .0027 .0027 9 .0020 .0000 9 0 0 0 0 SC6 .0161 .0053 .0019 .0108 4 .0100 .0000 1 0 1 2 0 SX2 .0354 .0078 .0034 .0276 18 .0273 .0000 0 0 0 9 9 SX4 .0078 .0052 .0027 .0025 9 .0011 .0000 9 0 0 0 0 SX6 .0156 .0044 .0019 .0112 4 .0104 .0000 1 0 1 2 0 TS1 .0025 .0020 .0012 .0005 0 .0000 .0000 0 0 0 0 0 TX1 .0025 .0017 .0012 .0007 0 .0000 .0000 0 0 0 0 0
Chapter 6. VSAM application performance analysis and Transaction Resource Monitoring support 149

Figure 6-12 Export performance extract
We specified the CICS APPLID SCSCPAA1 because we used the region in our previous performance summary report. An output data set must be specified. We used EXTVSM1 and specified disposition 2. Under heading Extract Format, we pressed PF4 to see a list of available Report Forms. We used Report Form VSAMSUM that we created earlier. We kept the semicolon as a delimiter since it works well with Microsoft Excel. After that, we typed line action S next to the Performance option under Selection Criteria. We specified the same selection criteria that we used in Figure 6-10 to select all transactions that belong to the VSAM application. We then pressed PF3 until we returned to the Edit Report Set screen. After that, we typed RUN in the command line to generate the performance extract JCL. When the job completed, we had the extracted performance data available in the EXTVSM1 data set.
The data set can be downloaded to the workstation using the File Transfer utility of Personal Communications emulator or using FTP. We used the File Transfer utility to download the extracted data as a text file to the workstation.
Figure 6-13 shows the extracted performance data of our VSAM application which can be imported into any spreadsheet application in order to produce meaningful charts. Note that the header line is not aligned with the rest of the data. We found that the spreadsheet applications we used were able to align them automatically.
File Systems Options Help ------------------------------------------------------------------------------ EXT - Export Command ===> System Selection: Extract Recap: APPLID . . SCSCPAA1 + DDname . . . EXPT0001 Image . . SC66 + Group . . + Output Data Set: Data Set Name . . EXTVSM1 Disposition . . . 2 1. OLD 2. MOD (If cataloged) Extract Format: Enter "/" to select option Form . . . . VSAMSUM + / Include Field Labels Delimiter . . ; Numeric Fields in Float format Selection Criteria: Summary Processing Options: S Performance Time Interval 00:01:00 (hh:mm:ss)
150 CICS Performance Analyzer

Figure 6-13 Performance extract of our VSAM application
We used Microsoft Excel to create the chart shown in Figure 6-14 from the spreadsheet. It illustrates average dispatch time versus average suspend time per transaction. Average suspend time plus average dispatch time is the average response time as shown in the chart. The spreadsheet illustrates visually that there appears to be a problem with transaction IX8.
Figure 6-14 VSAM RLS application performance chart
Next, we wanted to look more closely at the performance behavior of transaction IX8. To do that, we wanted to create a CICS Performance Analyzer Performance List report. The necessary steps to get such a report are very similar to ones we performed to create a Performance Summary report.
We wanted to keep the sequence of the performance fields that we specified in our summary Report Form VSAMSUM as shown in Figure 6-5 on page 145. We cannot use a summary form to format Performance List reports. Therefore we selected option 3 (Report Forms) from
Tran;Response Avg;Dispatch Time Avg;User CPU Time Avg;Suspend Time Avg;FC Total Avg;RLS Wait Time Avg;FC Wait Time Avg;FCADD Avg;FCBROWSE Avg;FCDELETE Avg;FCGET Avg;FCPUT AvgHR1 ; .0073; .0034; .0017; .0039; 2; .0033; .0000; 0; 0; 0; 1; 1HX1 ; .0088; .0033; .0017; .0054; 2; .0041; .0000; 0; 0; 0; 1; 1IT1 ; .0102; .0045; .0025; .0057; 0; .0000; .0000; 0; 0; 0; 0; 0IT2 ; .0088; .0066; .0030; .0023; 17; .0016; .0000; 0; 0; 0; 17; 0IT8 ; .0170; .0071; .0030; .0099; 14; .0092; .0000; 3; 0; 0; 9; 2IX1 ; .0104; .0046; .0025; .0058; 0; .0000; .0000; 0; 0; 0; 0; 0IX2 ; .0110; .0061; .0030; .0048; 17; .0042; .0000; 0; 0; 0; 17; 0IX8 ; .2001; .0078; .0033; .1922; 14; .1139; .0000; 3; 0; 0; 9; 2PS2 ; .0075; .0066; .0032; .0008; 18; .0002; .0000; 0; 0; 0; 18; 0PS3 ; .0106; .0095; .0045; .0011; 34; .0001; .0000; 0; 0; 0; 34; 0PX2 ; .0073; .0063; .0032; .0010; 18; .0003; .0000; 0; 0; 0; 18; 0PX3 ; .0102; .0095; .0045; .0007; 34; .0002; .0000; 0; 0; 0; 34; 0SC2 ; .0324; .0071; .0034; .0253; 18; .0246; .0000; 0; 0; 0; 9; 9SC4 ; .0099; .0072; .0027; .0027; 9; .0020; .0000; 9; 0; 0; 0; 0SC6 ; .0161; .0053; .0019; .0108; 4; .0100; .0000; 1; 0; 1; 2; 0SX2 ; .0354; .0078; .0034; .0276; 18; .0273; .0000; 0; 0; 0; 9; 9SX4 ; .0078; .0052; .0027; .0025; 9; .0011; .0000; 9; 0; 0; 0; 0SX6 ; .0156; .0044; .0019; .0112; 4; .0104; .0000; 1; 0; 1; 2; 0TS1 ; .0025; .0020; .0012; .0005; 0; .0000; .0000; 0; 0; 0; 0; 0TX1 ; .0025; .0017; .0012; .0007; 0; .0000; .0000; 0; 0; 0; 0; 0
0
0.05
0.1
0.15
0.2
0.25
HR1 HX1 IT1 IT2 IT8 IX1 IX2 IX8 PS2 PS3 PX2 PX3 SC2 SC4 SC6 SX2 SX4 SX6 TS1 TX1
Response Avg
Dispat ch Time Avg
Suspend Time Avg
Chapter 6. VSAM application performance analysis and Transaction Resource Monitoring support 151
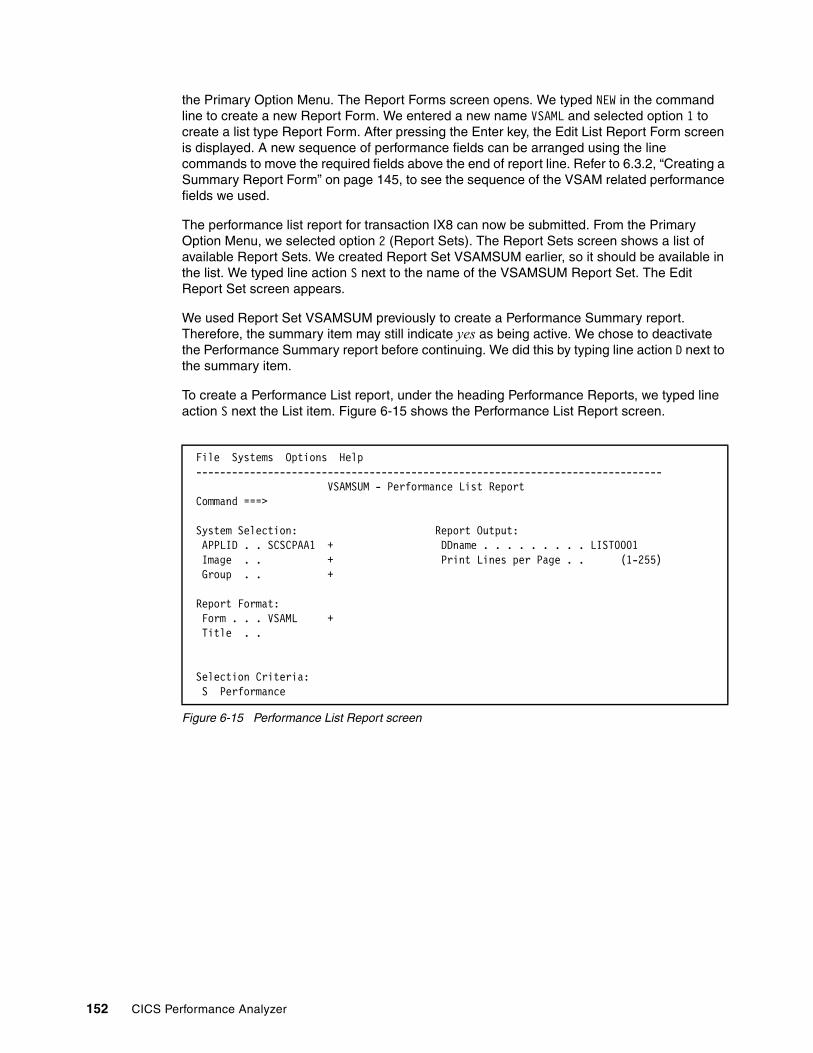
the Primary Option Menu. The Report Forms screen opens. We typed NEW in the command line to create a new Report Form. We entered a new name VSAML and selected option 1 to create a list type Report Form. After pressing the Enter key, the Edit List Report Form screen is displayed. A new sequence of performance fields can be arranged using the line commands to move the required fields above the end of report line. Refer to 6.3.2, “Creating a Summary Report Form” on page 145, to see the sequence of the VSAM related performance fields we used.
The performance list report for transaction IX8 can now be submitted. From the Primary Option Menu, we selected option 2 (Report Sets). The Report Sets screen shows a list of available Report Sets. We created Report Set VSAMSUM earlier, so it should be available in the list. We typed line action S next to the name of the VSAMSUM Report Set. The Edit Report Set screen appears.
We used Report Set VSAMSUM previously to create a Performance Summary report. Therefore, the summary item may still indicate yes as being active. We chose to deactivate the Performance Summary report before continuing. We did this by typing line action D next to the summary item.
To create a Performance List report, under the heading Performance Reports, we typed line action S next the List item. Figure 6-15 shows the Performance List Report screen.
Figure 6-15 Performance List Report screen
File Systems Options Help ------------------------------------------------------------------------------ VSAMSUM - Performance List Report Command ===> System Selection: Report Output: APPLID . . SCSCPAA1 + DDname . . . . . . . . . LIST0001 Image . . + Print Lines per Page . . (1-255) Group . . + Report Format: Form . . . VSAML + Title . . Selection Criteria: S Performance
152 CICS Performance Analyzer

When we pressed Enter, the Performance Select Statement screen is displayed. It allows the specification of selection criteria for the performance list report. We selected transaction IX8 and a response time range of 2 - 10 seconds. This should result in a performance report that shows just transactions IX8 that have a response time longer than 2 and shorter than 10 seconds (Figure 6-16).
Figure 6-16 Selection criteria for IX8 and the response time
We returned to the Edit Report Set screen. We used the RUN line action command next to the List report to submit the job. Using the selection criteria shown in Figure 6-16, we produced the Performance List report shown in Figure 6-17. The Performance List report shows two IX8 tasks with bad response and suspend times. These tasks are likely responsible for the increased average response time that we discovered in our Performance Summary report.
Figure 6-17 Performance list report using selection criteria
So far, we knew that there was no general performance degradation. Just two transactions were suspended for a number of seconds. We wanted more detailed information about the reason for the suspension. We created a Performance List Extended report to collect further information about the situation.
The Performance List Extended report provides a detailed list of the CMF performance class records. It differs from the Performance List report in that you can specify the sorting criteria for the performance class records.
Before a Report Set can be submitted to request a Performance List Extended report, we had to create a new Report Form of the extended list type. From the Primary Option Menu, we selected option 3 (Report Forms). The Report Forms screen is displayed. We typed NEW in the command line to create a new Report Form for Extended List reports. The List Extended
File Edit Object Lists Options Help ------------------------------------------------------------------------------ VSAMSUM - Performance Select Statement Row 1 of 10 More: > Command ===> Scroll ===> CSR Active --------------- Report Interval ---------------- Inc Start -------- From --------- --------- To ---------- Exc Stop MM/DD/YYYY HH:MM:SS.TH MM/DD/YYYY HH:MM:SS.TH ------------------------------------------------------------------------------ Inc Field --- Value or Range --- Object / Exc Name + Type Value/From To List + INC TRAN IX8 INC RESPONSE 2000 10000 Milliseconds
V1R3M0 CICS Performance Analyzer Performance List __________________________________________________ LIST0001 Printed at 14:51:54 10/10/2003 Data from 17:04:02 10/07/2003 APPLID SCSCPAA1 Page 1 Tran Response Dispatch User CPU Suspend FC Total RLS Wait FC Wait FCADD FCGET FCBROWSE FCDELETE FCPUT Time Time Time Time Time Time IX8 8.0064 .0835 .0651 7.9229 0 .0000 .0000 0 0 0 0 0 IX8 5.8168 .0769 .0654 5.7399 0 .0000 .0000 0 0 0 0 0
Chapter 6. VSAM application performance analysis and Transaction Resource Monitoring support 153

Report Form screen is displayed. We arranged the sequence of the performance fields that we wanted to fit in the title line of the report as illustrated in Figure 6-18.
Figure 6-18 Sequence of performance fields for extended list reports
After that we went back to the Primary Option Menu. From the Primary Option Menu, we selected option 2 (Report Sets). The Report Sets screen shows a list of the available Report Sets. We used line action S next to Report Set VSAMSUM to display the Edit Report Set screen. We deactivated any active reports by typing line action D next to them.
Figure 6-19 shows the Performance List Extended report screen we used to create an extended list report of our VSAM application. We updated the screen with information about the APPLID and the form name that we are going to use. Then we pressed Enter and the Performance Select Statement screen is displayed. We defined selection criteria for transaction ID IX8 and performance field TRAN.
For detailed information about how to specify a selection criteria on the Performance Select Statement screen, see 6.3.4, “Creating a Report Set” on page 147.
File Edit Confirm Upgrade Options Help ------------------------------------------------------------------------------ EDIT LISTX Report Form - VSAMEL Row 1 of 220 More: > Command ===> Scroll ===> CSR Description . . . List Extended Report Form Version (VRM): 530 Selection Criteria: Performance Field / Name + S Type Limit Description TRAN A Transaction identifier TASKNO * Transaction identification number RESPONSE * Transaction response time DISPATCH * TIME Dispatch time ABCODEO * Original ABEND Code CPU * TIME CPU time SUSPEND * TIME Suspend time ABCODEC * Current ABEND code COMMWAIT * Communications wait time IOWAIT * Total IO wait time MXTDELAY * TIME First dispatch MXT wait time ICDELAY * TIME Interval Control (IC) wait time DSPDELAY * TIME First dispatch wait time MSCPU * TIME CICS TCBs CPU time TCWAIT * TIME Terminal wait for input time EOR ---------------- End of Report -------------- EOX ---------------- End of Extract -------------
154 CICS Performance Analyzer

Figure 6-19 Performance List Extended Report screen
We pressed the PF3 key repeatedly to return to the Edit Report Set screen. We then entered the RUN line action command next to the List Extended report to submit the job.
Figure 6-20 shows the output of the Performance List extended process. Tasks #67075 and #67098 used additional resources because of the overhead of the abend processing for abend AEI9. It turned out that, while TPNS was running, two IX8 transactions were started manually. Since a MAPFAIL condition was not handled by the application, the tasks abended eventually.
Figure 6-20 Performance List Extended report
We corrected the problem and started the VSAM RLS workload again using TPNS. The workload was running again for about 15 minutes when we switched SMF data sets and achieved a copy of the relevant SMF records. After that, we processed a Performance Summary report to check the average response time of all transactions that belong to the VSAM application workload.
We used the existing Report Set VSAMSUM to produce the Performance Summary report. We performed again the steps in 6.3.4, “Creating a Report Set” on page 147, to create the Performance Summary report using Object List VSAMTRAN and Report Form VSUMSUM.
File Systems Options Help ------------------------------------------------------------------------------ VSAMSUM - Performance List Extended Report Command ===> System Selection: Report Output: APPLID . . SCSCPAA1 + DDname . . . . . . . . . LSTX0001 Image . . + Print Lines per Page . . (1-255) Group . . + Report Format: Form . . . VSAMEL + Title . . Selection Criteria: S Performance
V1R3M0 CICS Performance Analyzer Performance List Extended __________________________________________________ LSTX0001 Printed at 9:55:35 10/09/2003 Data from 17:03:54 10/07/2003 to 17:37:24 10/07/2003 Tran TaskNo Response Dispatch ABor User CPU Suspend ABcu CommWait I/O Wait MXTDelay IC Delay Disp1Dly MS CPU TC Wait Time Time Time Time Time Time Time Time Time Time Time IX8 67075 8.0064 .0835 AEI9 .0651 7.9229 AEI9 .0021 .0000 .0000 .0000 .0000 .0000 .0000 IX8 67098 5.8168 .0769 AEI9 .0654 5.7399 AEI9 .0048 .0000 .0000 .0000 .0000 .0000 .0000 IX8 67110 .1750 .0053 .0034 .1697 .0000 .0000 .0000 .0000 .0002 .0000 .0000 IX8 67266 .1695 .0056 .0034 .1639 .0000 .0000 .0000 .0000 .0000 .0000 .0000 IX8 67281 .0854 .0084 .0034 .0770 .0000 .0000 .0000 .0000 .0000 .0000 .0000 IX8 67329 .1487 .0072 .0034 .1416 .0000 .0000 .0000 .0000 .0004 .0000 .0000 IX8 67350 .1465 .0101 .0034 .1364 .0000 .0000 .0000 .0000 .0000 .0000 .0000 IX8 67366 .0816 .0066 .0034 .0750 .0000 .0000 .0000 .0000 .0000 .0000 .0000 IX8 67434 .0956 .0065 .0036 .0891 .0000 .0000 .0000 .0000 .0000 .0000 .0000 IX8 67491 .0905 .0058 .0031 .0847 .0000 .0000 .0000 .0000 .0000 .0000 .0000 IX8 67529 .0936 .0063 .0035 .0873 .0000 .0000 .0000 .0000 .0000 .0000 .0000 IX8 67638 .0952 .0064 .0033 .0888 .0000 .0000 .0000 .0000 .0000 .0000 .0000 IX8 67665 .1586 .0070 .0032 .1516 .0000 .0000 .0000 .0000 .0000 .0000 .0000
Chapter 6. VSAM application performance analysis and Transaction Resource Monitoring support 155
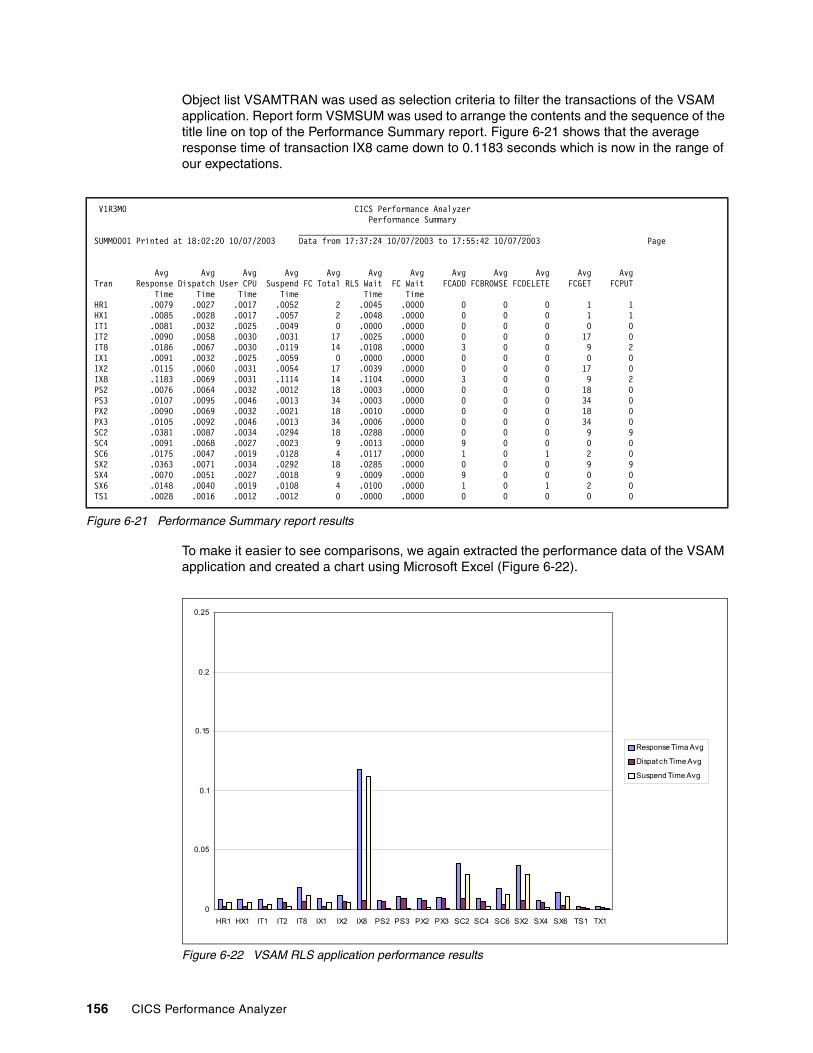
Object list VSAMTRAN was used as selection criteria to filter the transactions of the VSAM application. Report form VSMSUM was used to arrange the contents and the sequence of the title line on top of the Performance Summary report. Figure 6-21 shows that the average response time of transaction IX8 came down to 0.1183 seconds which is now in the range of our expectations.
Figure 6-21 Performance Summary report results
To make it easier to see comparisons, we again extracted the performance data of the VSAM application and created a chart using Microsoft Excel (Figure 6-22).
Figure 6-22 VSAM RLS application performance results
V1R3M0 CICS Performance Analyzer Performance Summary __________________________________________________ SUMM0001 Printed at 18:02:20 10/07/2003 Data from 17:37:24 10/07/2003 to 17:55:42 10/07/2003 Page Avg Avg Avg Avg Avg Avg Avg Avg Avg Avg Avg Avg Tran Response Dispatch User CPU Suspend FC Total RLS Wait FC Wait FCADD FCBROWSE FCDELETE FCGET FCPUT Time Time Time Time Time Time HR1 .0079 .0027 .0017 .0052 2 .0045 .0000 0 0 0 1 1 HX1 .0085 .0028 .0017 .0057 2 .0048 .0000 0 0 0 1 1 IT1 .0081 .0032 .0025 .0049 0 .0000 .0000 0 0 0 0 0 IT2 .0090 .0058 .0030 .0031 17 .0025 .0000 0 0 0 17 0 IT8 .0186 .0067 .0030 .0119 14 .0108 .0000 3 0 0 9 2 IX1 .0091 .0032 .0025 .0059 0 .0000 .0000 0 0 0 0 0 IX2 .0115 .0060 .0031 .0054 17 .0039 .0000 0 0 0 17 0 IX8 .1183 .0069 .0031 .1114 14 .1104 .0000 3 0 0 9 2 PS2 .0076 .0064 .0032 .0012 18 .0003 .0000 0 0 0 18 0 PS3 .0107 .0095 .0046 .0013 34 .0003 .0000 0 0 0 34 0 PX2 .0090 .0069 .0032 .0021 18 .0010 .0000 0 0 0 18 0 PX3 .0105 .0092 .0046 .0013 34 .0006 .0000 0 0 0 34 0 SC2 .0381 .0087 .0034 .0294 18 .0288 .0000 0 0 0 9 9 SC4 .0091 .0068 .0027 .0023 9 .0013 .0000 9 0 0 0 0 SC6 .0175 .0047 .0019 .0128 4 .0117 .0000 1 0 1 2 0 SX2 .0363 .0071 .0034 .0292 18 .0285 .0000 0 0 0 9 9 SX4 .0070 .0051 .0027 .0018 9 .0009 .0000 9 0 0 0 0 SX6 .0148 .0040 .0019 .0108 4 .0100 .0000 1 0 1 2 0 TS1 .0028 .0016 .0012 .0012 0 .0000 .0000 0 0 0 0 0
0
0.05
0.1
0.15
0.2
0.25
HR1 HX1 IT1 IT2 IT8 IX1 IX2 IX8 PS2 PS3 PX2 PX3 SC2 SC4 SC6 SX2 SX4 SX6 TS1 TX1
Response Tima Avg
Dispat ch Time Avg
Suspend Time Avg
156 CICS Performance Analyzer

6.4 CICS VSAM LSR scenario descriptionWhen we finished analyzing the performance of the VSAM RLS application, we had to change the design of our environment slightly to perform a comparable performance analysis using LSR data sets (see Figure 6-23).
Since we do not use FORs anymore in our VSAM RLS environment, we eliminated AOR SCSCPAA4 from the LSR test environment. We did that because non-RLS files cannot be shared among CICS regions with update integrity. The environment we were going to use for the LSR performance scenario consists of TOR regions PTA1 and PTA2 and a single AOR PAA1. All VSAM application files will be allocated to AOR PAA1.
We logged on to AOR SCSCPAA1 and closed all VSAM application files that were still open in RLS access mode. To re-open them in non-RLS access mode, we entered the following command first:
CEMT SET DSN QUIESCE ALL
We installed a second set of the VSAM application file resource definitions which defined the files using the non-RLS access mode.
As we did for the RLS performance scenario, we used CICSPlex System Manager (SM) to manage our workload. The workload was generated using TPNS.
Figure 6-23 VSAM LSR application scenario
6.5 Running the VSAM LSR scenarioThis section explains how we ran the LSR access mode scenario.
6.5.1 LSR workload generationWe used TPNS again to generate workload for the LSR performance scenario. The network deck had to be modified slightly to avoid generating transactions that belong to the first set of the VSAM application resource definitions as shown in Example 6-2. The second set of definitions can be used to invoke the application in RLS access mode as well as in LSR access mode. After modifying the TPNS network deck, a workload can be generated for transactions HX1, IX8, IX2, PX2, PX3, SX2, SX4, and SX8.
TPNS
HX1HX2
HOTEL1X EMPACTDX ITEMACTX LABOPSDX DEPSUMDX ITEMMASX COMPOSDX VENDORX INVENTOX
SX2SX4 SX6
PX2Px3
IX2 IX8
SC66 LSR application scenario
Chapter 6. VSAM application performance analysis and Transaction Resource Monitoring support 157

Example 6-2 Modified TPNS path and distribution probability
PATH PX3,PX2,IX8,IX1,IX2,HX1, SX6,SX2,SX4,TX1
* DIST 90,100,80,30,60,30,
100,30,20,40
TPNS starts the workload through TORs PTA1 and PTA2. Both TORs route the transactions to AOR PAA1.
6.5.2 LSR application performance objectivesThe VSAM LSR application that we plan to use for the CICS VSAM LSR performance scenario was already used for a number of other projects. Therefore, we already had some experience with its performance behavior. We never claimed that it was tuned to the maximum performance, but we had some expectations about its response time and suspend time. Since there is no service level agreement available for the application, we summarized our expectations regarding the performance behavior, based on our previous experience, in Table 6-2.
We expect the response times to be lower when the very same application is using LSR files rather than RLS files. When we document the results of this scenario, we create a chart that allows visual comparison between RLS and LSR response time.
Table 6-2 Performance expectations for an LSR scenario
6.5.3 Analyzing the current average response time We started the TPNS workload and kept it running for about fifteen minutes. It takes about three minutes for the TPNS CICS terminals to log on. While terminals are still in the process of logging on to CICS, the first transactions of the workload started running. To find the average response time of a smooth run, we used a time selection criteria to select performance data after all terminals had completed logging on. Thus, we do not measure our application performance data while additional CICS resources are consumed by the terminal logon process.
After about 15 minutes, we stopped TPNS and issued an /I SMF command to switch the active SMF data set. When the SMF data set was archived, we performed the following steps to provide a CICS Performance Analyzer Performance Summary report:
1. Update system definitions.2. Select Report Set VSAMSUM.3. Deactivate any active reports.
Application Transaction Response average Response maximum
HOTEL HX1 < 0,05 0,1
INVENTOR IX8 <0,15 0,2
INVENTOR IX2 <0,015 0,02
SPECIFIC PX2,PX3 <0,015 0,05
STOCK SX2,SX4,SX6 <0,04 0,06
158 CICS Performance Analyzer

4. Edit the performance summary report we used during the RLS scenario.
a. Use existing Report Form VSAMSUM.
b. Add a report interval to the performance select statement.
c. Use Object List VSAMTRAN as a selection criteria to filter VSAM application transactions.
5. Run the Performance Summary report.
Updating system definitionsOn the Primary Option Menu screen, we selected option 1 (System Definitions). The System Definition Menu opens. We selected option 4 (Take-Up from SMF file) and pressed Enter. On the next screen, we entered the name of the archived SMF data set and pressed Enter to submit the job.
Figure 6-24 Take-Up from SMF update information
When we return to the System Definition Menu, a screen opens indicating that system definitions were updated by the Take-Up from SMF function. Figure 6-24 shows the information screen of the take-up system update process. On the System Definition Menu, we selected option 1 (Define Systems, SMF Files and Groups) and pressed Enter. On the next screen, we typed line action S next to the system entry for AOR SCSCPAA1. We checked that the SMF data set was updated correctly. If it was not updated, we could insert it manually.
Figure 6-25 shows the CICS system definition after running Take-Up from SMF.
---------------------- System Definitions ---------------------- Data Take-Up from SMF Command ===> ********************************************* * Take-Up from SMF * ********************************************* CICS PA has completed extracting systems from the following SMF File: Data Set . . : 'SMFDATA.ALLRECS.G8446V00' Instructions: Press ENTER to continue adding the systems. Enter DEFER command to defer adding the systems. Enter END or CANCEL command to cancel adding the systems.
Chapter 6. VSAM application performance analysis and Transaction Resource Monitoring support 159
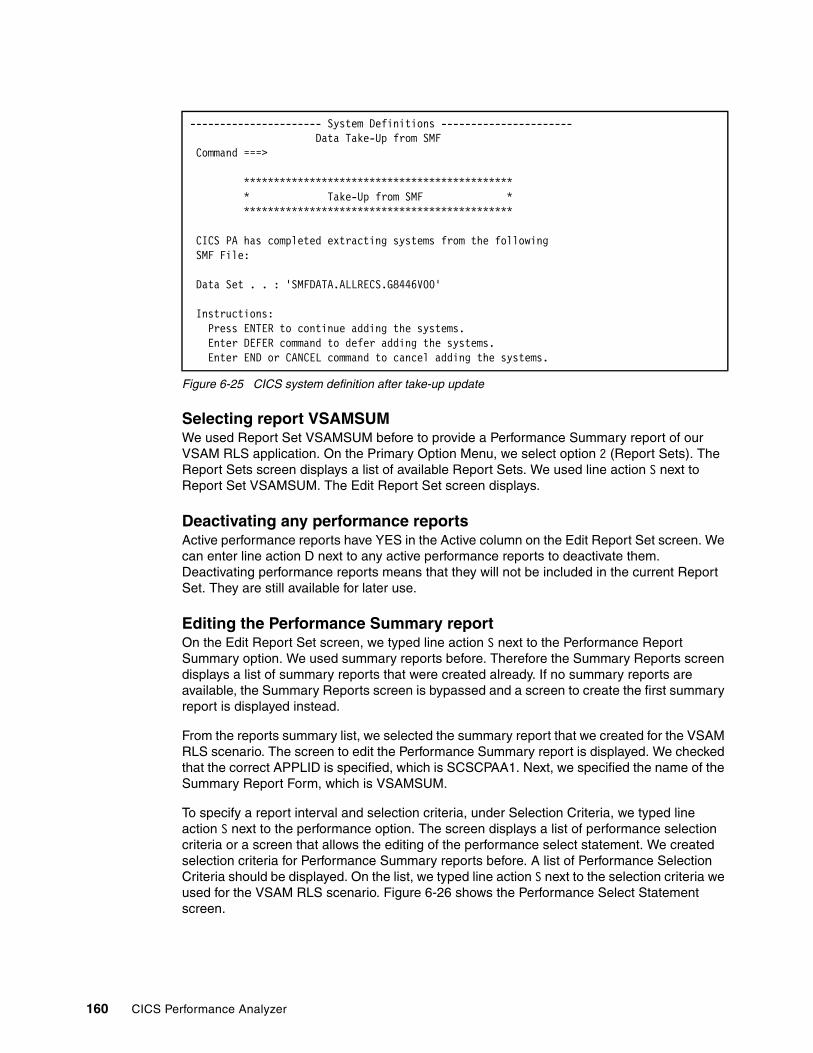
Figure 6-25 CICS system definition after take-up update
Selecting report VSAMSUMWe used Report Set VSAMSUM before to provide a Performance Summary report of our VSAM RLS application. On the Primary Option Menu, we select option 2 (Report Sets). The Report Sets screen displays a list of available Report Sets. We used line action S next to Report Set VSAMSUM. The Edit Report Set screen displays.
Deactivating any performance reportsActive performance reports have YES in the Active column on the Edit Report Set screen. We can enter line action D next to any active performance reports to deactivate them. Deactivating performance reports means that they will not be included in the current Report Set. They are still available for later use.
Editing the Performance Summary reportOn the Edit Report Set screen, we typed line action S next to the Performance Report Summary option. We used summary reports before. Therefore the Summary Reports screen displays a list of summary reports that were created already. If no summary reports are available, the Summary Reports screen is bypassed and a screen to create the first summary report is displayed instead.
From the reports summary list, we selected the summary report that we created for the VSAM RLS scenario. The screen to edit the Performance Summary report is displayed. We checked that the correct APPLID is specified, which is SCSCPAA1. Next, we specified the name of the Summary Report Form, which is VSAMSUM.
To specify a report interval and selection criteria, under Selection Criteria, we typed line action S next to the performance option. The screen displays a list of performance selection criteria or a screen that allows the editing of the performance select statement. We created selection criteria for Performance Summary reports before. A list of Performance Selection Criteria should be displayed. On the list, we typed line action S next to the selection criteria we used for the VSAM RLS scenario. Figure 6-26 shows the Performance Select Statement screen.
---------------------- System Definitions ---------------------- Data Take-Up from SMF Command ===> ********************************************* * Take-Up from SMF * ********************************************* CICS PA has completed extracting systems from the following SMF File: Data Set . . : 'SMFDATA.ALLRECS.G8446V00' Instructions: Press ENTER to continue adding the systems. Enter DEFER command to defer adding the systems. Enter END or CANCEL command to cancel adding the systems.
160 CICS Performance Analyzer

Figure 6-26 Performance Select Statement screen
We included the start and stop time of the report interval that we were going to monitor. We started investigating SMF records when all terminals were logged on and the entire workload was running. After that, we included selection criteria specifying all the transactions that we used in the workload. We specified Object List VSAMTRAN that still contains all of the transactions of the workload. During the VSAM LSR performance scenario, we simply used the second set of transactions, which are the ones that have X characters in the middle of their name. We only had SMF records for the second set of transaction, so we can still use the Object List VSAMTRAN. There will not be any filter matches for the first set of transactions. We then pressed F3 repeatedly until we returned to the Edit Report Set screen.
Running the Report SetOn the Edit Report Set screen, we entered the RUN line action next to the Summary report and pressed Enter to display the Run Report Set screen. We did not change any information on the screen, and pressed Enter again to submit the job to generate the report.
Figure 6-27 LSR Performance Summary report
6.5.4 Tuning changes to LSRAs you can see in Figure 6-27, response times are far higher than we expected. When we installed the CICS file resource definitions, we had to set up an LSRPOOL definition to share strings and buffers among the LSR files. We did not specify enough strings and buffers to run
File Edit Object Lists Options Help ------------------------------------------------------------------------------ VSAMSUM - Performance Select Statement Row 1 of 9 More: > Command ===> Scroll ===> CSR Active --------------- Report Interval ---------------- Inc Start -------- From --------- --------- To ---------- Exc Stop MM/DD/YYYY HH:MM:SS.TH MM/DD/YYYY HH:MM:SS.TH INC ACTIVE 10/11/2003 18:00:00.00 10/11/2003 18:08:00.00 ------------------------------------------------------------------------------ Inc Field --- Value or Range --- Object / Exc Name + Type Value/From To List + INC TRAN VSAMTRAN ********************************* End of list *********************************
Performance Summary Report __________________________________________________ SUMM0001 Printed at 18:17:13 10/11/2003 Data from 18:00:17 10/11/2003 to 18:08:00 10/11/2003 Page 1
Avg Max Avg Avg Avg Avg Avg Avg Avg Avg Avg Avg Avg Tran Response Response Dispatch User CPU Suspend FC Total RLS Wait FC Wait FCADD FCBROWSE FCDELETE FCGET FCPUT Time Time Time Time Time Time Time HX1 .0878 .4659 .0027 .0018 .0851 2 .0000 .0093 0 0 0 1 1 IX1 .0100 .1757 .0041 .0025 .0058 0 .0000 .0000 0 0 0 0 0 IX2 .9831 2.9364 .0054 .0040 .9777 17 .0000 .0937 0 0 0 17 0 IX8 1.8818 6.6992 .0055 .0038 1.8763 14 .0000 .1745 3 0 0 9 2 PX2 1.0209 3.2356 .0063 .0040 1.0146 18 .0000 .0422 0 0 0 18 0 PX3 2.3924 9.5941 .0070 .0050 2.3853 34 .0000 .0220 0 0 0 34 0 SX2 .6419 2.2321 .0055 .0042 .6364 18 .0000 .0675 0 0 0 9 9 SX4 .7818 2.7859 .0043 .0034 .7775 9 .0000 .0364 9 0 0 0 0 SX6 .2384 1.4432 .0030 .0021 .2353 4 .0000 .0190 1 0 1 2 0 TX1 .0030 .1027 .0015 .0011 .0015 0 .0000 .0000 0 0 0 0 0
Chapter 6. VSAM application performance analysis and Transaction Resource Monitoring support 161
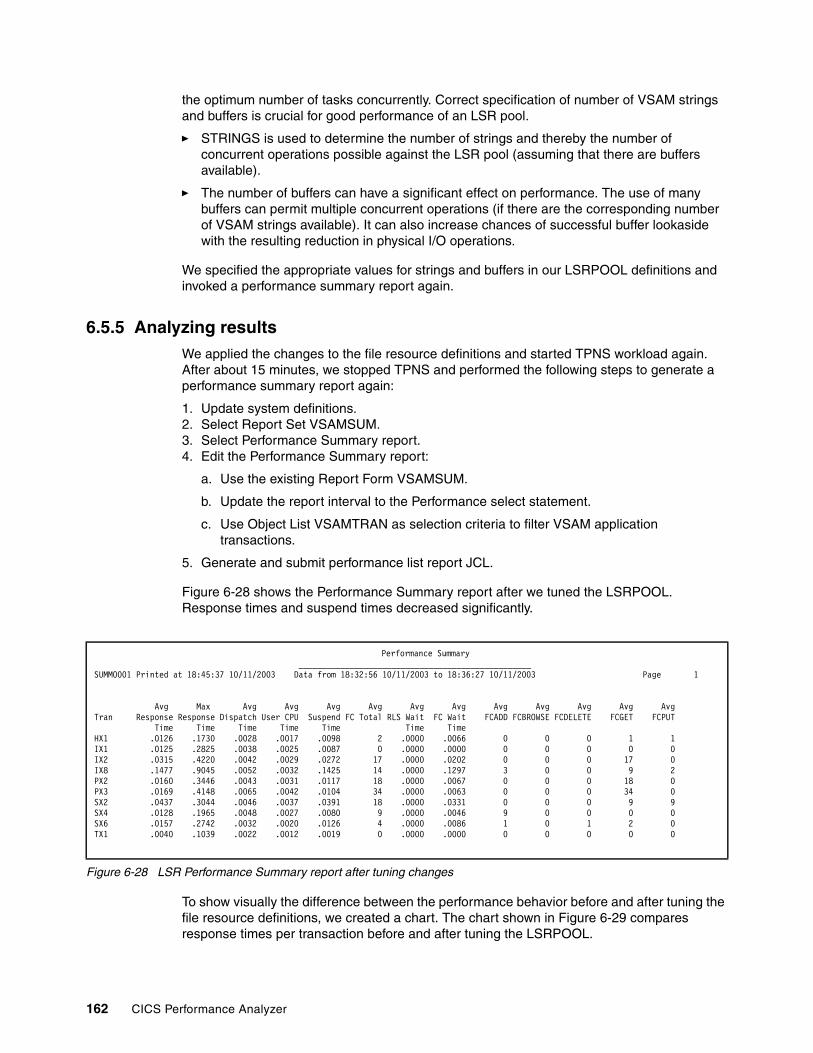
the optimum number of tasks concurrently. Correct specification of number of VSAM strings and buffers is crucial for good performance of an LSR pool.
� STRINGS is used to determine the number of strings and thereby the number of concurrent operations possible against the LSR pool (assuming that there are buffers available).
� The number of buffers can have a significant effect on performance. The use of many buffers can permit multiple concurrent operations (if there are the corresponding number of VSAM strings available). It can also increase chances of successful buffer lookaside with the resulting reduction in physical I/O operations.
We specified the appropriate values for strings and buffers in our LSRPOOL definitions and invoked a performance summary report again.
6.5.5 Analyzing resultsWe applied the changes to the file resource definitions and started TPNS workload again. After about 15 minutes, we stopped TPNS and performed the following steps to generate a performance summary report again:
1. Update system definitions.2. Select Report Set VSAMSUM. 3. Select Performance Summary report.4. Edit the Performance Summary report:
a. Use the existing Report Form VSAMSUM.
b. Update the report interval to the Performance select statement.
c. Use Object List VSAMTRAN as selection criteria to filter VSAM application transactions.
5. Generate and submit performance list report JCL.
Figure 6-28 shows the Performance Summary report after we tuned the LSRPOOL. Response times and suspend times decreased significantly.
Figure 6-28 LSR Performance Summary report after tuning changes
To show visually the difference between the performance behavior before and after tuning the file resource definitions, we created a chart. The chart shown in Figure 6-29 compares response times per transaction before and after tuning the LSRPOOL.
Performance Summary __________________________________________________ SUMM0001 Printed at 18:45:37 10/11/2003 Data from 18:32:56 10/11/2003 to 18:36:27 10/11/2003 Page 1 Avg Max Avg Avg Avg Avg Avg Avg Avg Avg Avg Avg Avg Tran Response Response Dispatch User CPU Suspend FC Total RLS Wait FC Wait FCADD FCBROWSE FCDELETE FCGET FCPUT Time Time Time Time Time Time Time HX1 .0126 .1730 .0028 .0017 .0098 2 .0000 .0066 0 0 0 1 1 IX1 .0125 .2825 .0038 .0025 .0087 0 .0000 .0000 0 0 0 0 0 IX2 .0315 .4220 .0042 .0029 .0272 17 .0000 .0202 0 0 0 17 0 IX8 .1477 .9045 .0052 .0032 .1425 14 .0000 .1297 3 0 0 9 2 PX2 .0160 .3446 .0043 .0031 .0117 18 .0000 .0067 0 0 0 18 0 PX3 .0169 .4148 .0065 .0042 .0104 34 .0000 .0063 0 0 0 34 0 SX2 .0437 .3044 .0046 .0037 .0391 18 .0000 .0331 0 0 0 9 9 SX4 .0128 .1965 .0048 .0027 .0080 9 .0000 .0046 9 0 0 0 0 SX6 .0157 .2742 .0032 .0020 .0126 4 .0000 .0086 1 0 1 2 0 TX1 .0040 .1039 .0022 .0012 .0019 0 .0000 .0000 0 0 0 0 0
162 CICS Performance Analyzer

Figure 6-29 VSAM LSR performance scenario before and after tuning
6.6 Application performance RLS versus LSRFinally, we used the Performance Summary reports for both of our scenarios (RLS and LSR) to extract data and create a chart that visually shows the comparison between response times in the case of RLS and LSR access mode. As we used the same application, data sets, and the same CICS environment for both scenarios, we can conclude that in our case the response times provided by RLS access are better than those provided by LSR access. The chart shown in Figure 6-30 illustrates the difference.
Figure 6-30 VSAM RLS versus LSR
6.7 Transaction Resource MonitoringTransaction Resource is a new class of data for the CICS Monitoring Facility. The Transaction Resource data is collected at transaction termination for each resource specified in the MCT on the TYPE=INITIAL macro. A new system initialization parameter, MNRES=(OFF | ON),
0
0.5
1
1.5
2
2.5
Response time
HX1 IX1 IX2 IX8 PX2 PX3 SX2 SX4 SX6 TX1
Transactions
tuned LSR pool
untuned LSR pool
0
0.02
0.04
0.06
0.08
0.1
0.12
0.14
0.16
Re sponse t i me
HX1 IX1 IX2 IX8 PX2 PX3 SX2 SX4 SX6
Tr a nsa c t i on I D
RLS response t ime
LSR response t ime
Chapter 6. VSAM application performance analysis and Transaction Resource Monitoring support 163

specifies whether Transaction Resource Monitoring is to be made active during CICS initialization.
A new parameter has been added to the DFHMCT TYPE=INITIAL macro, FILE=(8 | number). This FILE option specifies the maximum number of files for which you want CICS to perform Transaction Resource Monitoring. This option is applicable only if Transaction Resource Monitoring is enabled, either by specifying MNRES=ON as a system initialization parameter (together with MN=ON), or by enabling it dynamically using either of the following commands:
EXEC CICSCEMT SET MONITOR CICS
CICS standard monitoring performance class data includes totals for all files accessed by a transaction. Transaction Resource Monitoring collects information about individual files, up to the number of files specified. When the FILE parameter was first introduced, the default was FILE=0. With the code implemented by APARs PQ76701 and PQ76695, the default is now FILE=8.
The data collected is:
� File name� Number and total time of file get requests� Number and total time of file put requests� Number and total time of file browse requests� Number and total time of file add requests� Number and total time of file delete requests� Total number and total time of all requests against the file� File access method request count� File I/O wait time and number of waits� RLS-mode file I/O wait time� Coupling facility data table (CFDT) I/O wait time
The default value is 8 (eight).
Number specifies the maximum number of files, in the range 1 through 64, for which CICS is to perform Transaction Resource Monitoring. CICS collects monitoring performance data at the resource level for each file accessed by a transaction, up to the maximum specified by number. If the transaction accesses more files than the number specified, any files over the maximum are ignored, but a flag is set to indicate that the transaction has exceeded the file limit.
If you specify FILE=0, specifying MNRES=ON either as a system initialization parameter or dynamically while CICS is running, has no effect and Transaction Resource Monitoring data is not collected for files.
The monitoring domain exit, XMNOUT, is invoked at a new event point before a Transaction Resource Monitoring record is written to the transaction resource record buffer. This new invocation means that if performance class and Transaction Resource Monitoring are both active in your CICS region, XMNOUT can be invoked twice for the same event.
You can map the new transaction resource data using the new CICS monitoring domain copybook, DFHMNRDS.
The RESRCECLASS option (RESRCE | NORESRCE) was added to the CEMT INQUIRE and CEMT SET MONITOR commands to support the transaction resource class. The RESRCECLASS option has also been added to the EXEC CICS INQUIRE and SET MONITOR commands.
164 CICS Performance Analyzer

CICS PA and Transaction Resource MonitoringYou can use CICS PA to report on the new Transaction Resource Monitoring class records. We describe the process we went through to obtain a CICS PA Transaction Resource Usage Report.
We used TPNS to run our VSAM workload as discussed in Chapter 6, “VSAM application performance analysis and Transaction Resource Monitoring support” on page 139. After the workload completed, we switched the SMF data sets using the I SMF command. We took the copied SMF data set and added it to CICS PA. Figure 6-31 shows the data set added to the CICS regions SCSCPAA1 System Definition.
Figure 6-31 SCSCPAA1 System Definition
We also included the MCT Suffix (I3), which was used at CICS Initialization. Example 6-3 shows the DFHMCT TYPE=INITIAL statement which includes the new option FILE.
Example 6-3 DFHMCT
I3 DFHMCT TYPE=INITIAL, * APPLNAME=YES, * FILE=9, * SUFFIX=I3
We then needed to create a new Report Set to report on the transaction resource data. We did this by specifying NEW TRANSREP on the Report Sets screen. When the new Report Set was displayed, we selected the File Usage Summary Report option (Figure 6-32).
---------------------------- System Definitions ----------------------------- File Edit Dictionary View Options Help -------------------------------------------------------------------------- CICS System Row 1 of 1 More: > Command ===> Scroll ===> CSR CICS System definition: APPLID . . . . . . . . SCSCPAA1 MVS Image . . SC66 Description . . . . . System added by take-up CICS Version (VRM) . . 620 MCT Suffix . . . . . . I3 MCT Load Library . . . 'CICSSYSF.APPL62.LOADLIB' SDFHLOAD Library . . . 'CICSTS22.CICS.SDFHLOAD' Dictionary DSN . . . . 'CICSLS5.DFHMNREC' / Exc SMF Data Set Name + UNIT + SEQ VOLSER + 'SMFDATA.ALLRECS.G8885V00' DASD ********************************* End of list *****************************
Chapter 6. VSAM application performance analysis and Transaction Resource Monitoring support 165

Figure 6-32 Select Transaction Resource Usage: File Usage Summary
On the next screen, the File Usage Summary Report, we selected the default options, that is, Summary Reports for Transaction File Usage, File Usage broken down by transaction IDs and transaction totals (Figure 6-33).
Figure 6-33 File Usage Summary Report options
File Systems Confirm Options Help ------------------------------------------------------------------------------ EDIT Report Set - TRANSREP Row 15 of 34 Command ===> Scroll ===> CSR Description . . . CICS PA Report Set Enter "/" to select action. ** Reports ** Active Workload Activity No - Exception Reports No List No Summary No - Transaction Resource Usage Reports No S File Usage Summary No Temporary Storage Usage Summary No Transaction Resource Usage List No - Subsystem Reports No DB2 No WebSphere MQ No - System Reports No System Logger No - Performance Graphs No
File Systems Options Help ------------------------------------------------------------------------------ TRANSREP - File Usage Summary Report Command ===> System Selection: Report Output: APPLID . . + DDname . . . . . . . . . FILE0001 Image . . + Print Lines per Page . . (1-255) Group . . + Summary Reports Required: / Transaction File Usage / File Usage / Break down by Transaction ID / Include Transaction Totals Report Format: Title . . Selection Criteria: Performance
166 CICS Performance Analyzer

We pressed the PF3 key until we returned to the Edit Report Set screen, used the RUN line action command on the Transaction Resource Usage List report, added the CICS APPLID to the Run Report Set screen, and submitted the job. Figure 6-34 shows part of the report produced from this run. It shows two transaction (HX2 and IT2). HX2 made file requests to file HOTEL1X and IT2 made file requests to something called *CTLACB* and ITEMACT. The *CTLACB* indicates that we suffered a file control wait. The resource name of *CTLACB* shows that the resource being waited for is the RLS ConTroL ACB.
Figure 6-34 Transaction File Usage Summary report
Figure 6-35 shows the File Usage Summary report, a summary of File usage broken down by transaction ID.
Figure 6-35 File Usage Summary report
V1R3M0 CICS Performance Analyzer Transaction File Usage Summary __________________________________________________ RESU0001 Printed at 17:11:33 11/05/2003 Data from 13:07:37 11/05/2003 to 17:05:35 11/05/2003 APPLID SCSCPAA1 Page 3 ********************* FC Calls ********************** ******* I/O Waits ******** AccMeth Tran File #Tasks Get Put Browse Add Delete Total File RLS CFDT Requests ---- -------- ------- -------- -------- -------- -------- -------- -------- -------- -------- -------- -------- HX2 HOTEL1X 2 Elapse Avg .0003 .0000 .0000 .0002 .0000 .0005 .0000 .0000 .0000 Max .0004 .0000 .0000 .0002 .0000 .0006 .0000 .0000 .0000 Count Avg 1 0 0 1 0 2 0 0 0 3 Max 1 0 0 1 0 2 0 0 0 3 ********************* FC Calls ********************** ******* I/O Waits ******** AccMeth Tran #Tasks Get Put Browse Add Delete Total File RLS CFDT Requests ---- ------- -------- -------- -------- -------- -------- -------- -------- -------- -------- -------- IT2 7 Elapse Avg .0000 .0017 .0000 Max .0000 .0119 .0000 Count Avg 17 0 0 0 0 17 0 0 0 18 Max 17 0 0 0 0 17 0 1 0 18
********************* FC Calls ********************** ******* I/O Waits ******** AccMeth File #Tasks Get Put Browse Add Delete Total File RLS CFDT Requests -------- ------- -------- -------- -------- -------- -------- -------- -------- -------- -------- -------- *CTLACB* 6 Elapse Avg .0000 .0000 .0000 .0000 .0000 .0000 .0000 .0000 .0000 Max .0000 .0000 .0000 .0000 .0000 .0000 .0000 .0000 .0000 Count Avg 0 0 0 0 0 0 0 0 0 1 Max 0 0 0 0 0 0 0 0 0 1 ITEMACT 6 Elapse Avg .0040 .0000 .0000 .0000 .0000 .0040 .0000 .0020 .0000 Max .0140 .0000 .0000 .0000 .0000 .0140 .0000 .0119 .0000 Count Avg 17 0 0 0 0 17 0 0 0 17 Max 17 0 0 0 0 17 0 1 0 17
V1R3M0 CICS Performance Analyzer File Usage Summary __________________________________________________ RESU0001 Printed at 17:11:33 11/05/2003 Data from 13:07:37 11/05/2003 to 17:05:35 11/05/2003 APPLID SCSCPAA1 Page 14 ********************* FC Calls ********************** ******* I/O Waits ******** AccMeth File Tran #Tasks Get Put Browse Add Delete Total File RLS CFDT Requests -------- ---- ------- -------- -------- -------- -------- -------- -------- -------- -------- -------- -------- HOTEL1X HX1 3 Elapse Avg .0003 .0044 .0000 .0000 .0000 .0047 .0000 .0022 .0000 Max .0004 .0054 .0000 .0000 .0000 .0057 .0000 .0025 .0000 Count Avg 1 1 0 0 0 2 0 1 0 2 Max 1 1 0 0 0 2 0 1 0 2 HX2 2 Elapse Avg .0003 .0000 .0000 .0002 .0000 .0005 .0000 .0000 .0000 Max .0004 .0000 .0000 .0002 .0000 .0006 .0000 .0000 .0000 Count Avg 1 0 0 1 0 2 0 0 0 3 Max 1 0 0 1 0 2 0 0 0 3 Totl 5 Elapse Avg .0003 .0026 .0000 .0001 .0000 .0030 .0000 .0013 .0000 Max .0010 .0132 .0000 .0004 .0000 .0141 .0000 .0066 .0000
Count Avg 1 0 0 0 0 2 0 0 0 2 Max 3 3 0 2 0 6 0 3 0 6
Chapter 6. VSAM application performance analysis and Transaction Resource Monitoring support 167

In this report, we the file HOTEL1X is displayed with the two transactions, HX1 and HX2, which made a sort of file request to the file. Following is the total of all transactions file requests for the file being reported.
We then ran the Transaction Resource Usage List report by selecting it from the Report Set screen. When we did this, the Transaction Resource Usage Report screen (Figure 6-36) is displayed. We selected the File Usage report in the Detailed List Reports Required section, pressed F3 until we returned to the Reports Set screen, and then used the RUN line action on the report to submit the job.
Figure 6-36 Select Transaction Resource Usage List: File Usage
When the job completed, we received the report shown in Figure 6-37.
Figure 6-37 Usage List
File Systems Options Help ------------------------------------------------------------------------------ TRANSREP - Transaction Resource Usage Report Command ===> System Selection: Report Output: APPLID . . + DDname . . . . . . . . . RESU0001 Image . . + Print Lines per Page . . (1-255) Group . . + Detailed List Reports Required: / File Usage Temporary Storage Report Format: Title . . Selection Criteria: Performance
V1R3M0 CICS Performance Analyzer Transaction Resource Usage List __________________________________________________ RESU0001 Printed at 18:13:47 11/05/2003 Data from 13:07:37 11/05/2003 Page 3 Request Fcty Conn UOW R ResponseTran Userid SC TranType Term LUName Type Program T/Name Name NETName APPLID Task Seq T Stop Time Time ---- -------- -- -------- ---- -------- ------- -------- ------ ---- ----------------- -------- ---- --- - ------------ --------PX3 CICSUSER TP U T11 SCSCPTA1 AP: DSWPX3VV S/P082 PTA1 USIBMSC.SCSTP082 SCSCPAA1 106 1 T 16:58:44.821 .0083 ********************* FC Calls ********************** ******* I/O Waits ******** AccMeth File Get Put Browse Add Delete Total File RLS CFDT Requests -------- -------- -------- -------- -------- -------- -------- -------- -------- -------- -------- PRODCONX Elapse .0003 .0000 .0000 .0000 .0000 .0003 .0000 .0000 .0000 Count 2 0 0 0 0 2 0 0 0 2 ITEMMASX Elapse .0003 .0000 .0000 .0000 .0000 .0003 .0000 .0000 .0000 Count 2 0 0 0 0 2 0 0 0 2 LABOPSDX Elapse .0027 .0000 .0000 .0000 .0000 .0027 .0000 .0000 .0000
Count 30 0 0 0 0 30 0 0 0 30 *CTLACB* Elapse .0000 .0000 .0000 .0000 .0000 .0000 .0000 .0000 .0000 Count 0 0 0 0 0 0 0 0 0 1
168 CICS Performance Analyzer

The Transaction Resource Usage List report provides a detailed list of transaction resource class records. The report consists of two sections:
� The Task Identification section that identifies the CICS task� The Resource section(s) associated with the CICS task immediately above it
This report can be very useful for analyzing transaction resource usage.
6.8 ConclusionUsing CICS PA reports and extracts, we tuned our LSR pool. We also compared performances of a set of VSAM applications running in our environment when VSAM data sets were open in either LSR or RLS mode.
Chapter 6. VSAM application performance analysis and Transaction Resource Monitoring support 169

170 CICS Performance Analyzer

Chapter 7. Tuning the CICS DB2 attachment facility
This chapter provides a brief overview of the CICS DB2 attachment facility and CICS DB2 accounting and monitoring. Then it describes the use of CICS Performance Analyzer (PA) and the reports it can produce for a CICS region running with a DB2 workload.
Two scenarios in this chapter demonstrate CICS PA reports for CICS regions running a CICS Transaction Server for OS/390 V1.3 and CICS Transaction Server for z/OS V2.2. The CICS regions are connected to DB2 V7.1 subsystem.
This chapter also discusses the system setup of the CICS regions and describes the changes provided in CICS Transaction Server for z/OS V2.2 and the Open Transaction Environment (OTE).
7
Note: These scenarios were used to provide situations that allow us to demonstrate the use of CICS PA reports when running with a CICS DB2 workload. The CICS regions were not necessarily tuned for peak performance. In some cases, they had a high level of tracing active. Therefore, these scenarios and the results provided are for demonstration purposes only. They do not provide definitive results for a customer environment.
© Copyright IBM Corp. 2003. All rights reserved. 171

7.1 CICS and DB2This section describe functions provided by the CICS DB2 Attachment Facility. For more information, refer to the “Accounting and monitoring in a CICS DB2 environment” chapter in the CICS Transaction Server for z/OS CICS DB2 Guide, SC34-6014.
7.1.1 Overview of the CICS DB2 Attachment FacilityThe CICS DB2 Attachment Facility provides a multithread connection between the two environments. The architecture allows a CICS task to access both DB2 and CICS recoverable resources with data integrity. Each CICS transaction accessing DB2 uses a different MVS task control block (TCB), thus exploiting a multiprocessor’s capability for overlapped processing.
The CICS DB2 Attachment Facility enables application programs running under CICS to forward DB2 commands from CICS, by establishing a connection and a communication path between CICS and DB2 subsystems.
DB2 provides attachment facilities for MVS subsystems and batch address spaces to access DB2 resources through connections established by using the MVS Subsystem Interface (SSI) protocol. The CICS connection allows access to DB2 resources from a transaction that is also accessing DLI and VSAM resources. Before a CICS subsystem can access DB2 resources, it must establish a connection to DB2 and then create one or more threads on the connection. The connection establishes a communication path between the subsystem or address space and the DB2 subsystem.
7.1.2 FunctionsThe CICS DB2 attachment facility provides three major functions:
� Application programming interface (API)
DB2 provides a language interface module that allows a CICS application written in Assembler, C, COBOL, PL/I, or Java to access DB2 databases by using the data manipulation language (DML) subset of SQL. It also allows you to define DB2 objects and control authority (GRANT and REVOKE) by using the data description language (DDL) subset of SQL. Updates to DB2 resources are fully synchronized with updates to CICS-protected resources such as file control, temporary storage, intrapartition transient data, and DL/I databases. The CICS Attachment Facility controls the routing of SQL statements to DB2 and the synchronization of commit processing between the two subsystems through the CICS task-related user exit (TRUE) function.
� Attachment commands
Attachment commands display and control the status of the attachment facility and are issued through the supplied CICS transaction, DSNC. You can use the attachment commands to start the connection to DB2 (STRT), stop the connection to DB2 (STOP), display CICS-DB2 thread status and statistics (DISP), and modify the characteristics of the connection to DB2 (MODI). You control the use of these CICS attachment facility commands through the standard CICS security mechanisms. The commands are not routed to DB2, so there is no DB2 authorization checking.
� DB2 commands
After a connection between CICS and DB2 is established, you can use the CICS-supplied transaction, DSNC, to issue DB2 commands to the DB2 system. The DB2 commands are routed to DB2 for processing. DB2 checks that the user has DB2 authority to issue the commands. The commands are used to display and control the status of the DB2 system.
172 CICS Performance Analyzer

All DB2 commands that you enter through CICS must start with a dash (-) to show that the command is a DB2 command rather than an attachment command.
7.1.3 CICS and DB2 connectivityTwo or more CICS systems can share the same DB2 subsystem. However, each CICS system can be connected to only one DB2 subsystem at the same time. When an application program operating in the CICS environment issues its first SQL request, CICS and DB2 process the request as follows:
� A language interface, or stub, DSNCLI, that is link-edited with the application program calls the CICS resource manager interface (RMI).
� The RMI processes the request, and passes control to the CICS DB2 Attachment Facility’s task-related user exit (TRUE), the module that invokes DB2 for each task.
� The CICS DB2 Attachment Facility schedules a thread for the transaction. At this stage, DB2 checks authorization, and locates the correct application plan.
� DB2 takes control, and the CICS DB2 Attachment Facility waits while DB2 services the request.
� When the SQL request completes, DB2 passes the requested data back to the CICS DB2 Attachment Facility.
� CICS now regains control, and the CICS DB2 Attachment Facility passes the data and returns control to the CICS application program.
Within the connection, a thread establishes a bidirectional path between a user in a subsystem or batch address space and specific DB2 resources (application plan or command processor). Multiple threads can be established between a connected CICS and DB2. In CICS, there is a thread for each active CICS transaction accessing DB2.
The types of thread provided by the CICS DB2 attachment facility are:
� Command threads: These threads are reserved by the CICS DB2 attachment facility for issuing commands to DB2 using the DSNC transaction.
� Entry threads: These threads are specially defined threads intended for transactions with special requirements. You can instruct the CICS DB2 attachment facility to give entry threads to particular CICS transactions. DB2 entry threads can be protected. This is achieved by specifying PROTECTNUM(x) and THREADLIMIT(x) in the DB2ENTRY definition. A new protected thread is only created if an existing one is not available for reuse. A thread is protected, if at thread termination the number of protected threads is less than the PROTECTNUM value (and no new work is queued). After the thread is marked as protected, it is terminated, if it is unused for two consecutive purge cycles.
� Pool threads These threads are used for all transactions and commands that are not using an entry or DB2 command thread.
Each CICS transaction that accesses DB2 needs a thread, an individual connection into DB2. Each thread runs under a thread task control block (thread TCB) that belongs to CICS. CICS and DB2 both have connection control blocks linked to the thread TCB. The nature of the thread TCBs, and the way in which they are linked to the DB2 connection control block (and therefore the thread), differs depending on the version of DB2 to which CICS is connected.
While CICS is connecting to a DB2 subsystem, it checks the DB2 release level of the subsystem. If CICS is connecting to DB2 Version 6 or later, the CICS DB2 task-related user exit (TRUE, the module that invokes DB2 for each task) is automatically enabled as open API, so it can use the CICS OTE. If CICS is connecting to DB2 Version 5 or earlier, the TRUE is not enabled as open API, and does not use OTE.
Chapter 7. Tuning the CICS DB2 attachment facility 173

Thread TCBs in a non-Open Transaction EnvironmentWhen CICS is not using the OTE, the thread TCBs are subtasks created by the CICS DB2 Attachment Facility to run each thread that is requested by transactions or DB2 commands. The TRUE itself remains on the CICS main TCB, the QR TCB.
Figure 7-1 summarizes how thread TCBs operate in a non-Open Transaction Environment. Here we can see CICS using a thread to access DB2. The application has invoked the RMI, which invokes the CICS DB2 Attachment Facility’s TRUE. The CICS DB2 TRUE, operating on the CICS main TCB, uses an assembly consisting of a subtask TCB, a CSUB, and a DB2 connection control block to run a thread into DB2. The plan associated with the thread is held in DB2. The second thread in the diagram is one that is not currently in use, but is protected.
Figure 7-1 Thread TCBs in a non-OTE
For a CICS DB2 application to run on a thread TCB, a TCB switch is required from the CICS main TCB (QR TCB) onto the thread TCB. On the return from DB2, another switch is required back to the QR TCB. See Figure 7-2 for an example.
CICS
Thread
CSub
SubtaskTCB
CSub
SubtaskTCB
CICS DB2True
ApplicationProgram
Resource ManagerInterface
CICS DB2TRUE
Resource ManagerInterface
ApplicationProgram
CICS Main TCB
DB2
Plan
Plan
DB2 ConnectionControl Block
DB2 ConnectionControl Block
Thread
174 CICS Performance Analyzer

Figure 7-2 TCB Switching in CICS Transaction Server (TS) V1.3
Thread TCBs in Open Transaction EnvironmentWhen CICS is using the OTE, the CICS DB2 Attachment Facility uses open TCBs (L8 mode) as the thread TCBs. Open TCBs perform other tasks besides accessing DB2 resources. In the Open Transaction Environment, the CICS DB2 TRUE runs on an open TCB rather than on the CICS main TCB.
An application can also be defined as threadsafe, in which case it can continue to run on the L8 TCB after the DB2 SQL request has completed, including running EXEC CICS commands that normally run on the QR TCB. A threadsafe application must provide serialization of shared resources so they cannot be accessed by other user tasks at the same time. If the application is determined to be threadsafe, then you can define it using the CONCURRENCY(THREADSAFE) attribute on the PROGRAM definition. Note that some EXEC CICS commands are non-threadsafe.
Before the first SQL request, the application program runs on the CICS main TCB, the QR TCB. When it makes an SQL request and invokes the TRUE, control passes to the L8 TCB, and DB2 processing is carried out. On return from DB2, if the application program is threadsafe, it now continues to run on the L8 TCB, avoiding an expensive TCB switch.
Refer to the CICS Transaction Server for z/OS CICS Application Programming Reference, SC34-5994, for a more detailed explanation of threadsafe programs.
Figure 7-3 shows CICS using a thread to access DB2 in the Open Transaction Environment. The CICS DB2 TRUE was invoked by the RMI, and is operating on an open TCB. The CICS DB2 Attachment Facility has associated a CSUB and a DB2 connection control block with the open TCB. The DB2 connection control block has a thread into DB2. The plan associated with the thread is held in DB2. The diagram also shows a thread that is not currently in use, but is protected, and two open TCBs that are available for reuse.
If an application program in the OTE is not threadsafe, the CICS DB2 TRUE still runs on an L8 TCB, but the application program runs on the QR TCB throughout the task. Every time the program makes an SQL request, CICS switches from the QR TCB to the L8 TCB and back again.
QR TCB DB2 Attach TCB
Application
EXEC SQL
EXEC SQL
EXEC CICS
EXEC CICS
EXEC CICS
EXEC SQL
EXEC SQL
EXEC CICS RETURN
DB2 Attach code
Chapter 7. Tuning the CICS DB2 attachment facility 175

Figure 7-3 Thread TCBs in the Open Transaction Environment
Executing a CICS application which has been defined with the CONCURRENCY(THREADSAFE) attribute on the PROGRAM definition, but contains a non-threadsafe EXEC CICS command, is considered threadsafe (and continues to execute on the L8 open TCB) until the time when control is switched to the QR TCB to execute the non-threadsafe EXEC CICS command. See Figure 7-4 for an example.
Figure 7-4 TCB Switching in CICS TS V2.2 using open TCBs
To define the number of open TCBs (L8) that are available to CICS, you use the SIT parameter MAXOPENTCBS. The DB2CONN parameter, TCBLIMIT specifies how many of these will be used by DB2.
CICS
DB2
CICS DB2TRUE
CSubDB2 Connection
Control Block
OpenTCB
OpenTCB
PlanDB2 Connection
Control BlockCSub
Plan
Thread
Thread
QR TCB Open TCB
Application
EXEC CICS
Non ThreadsafeEXEC CICS
EXEC SQL
EXEC SQL
EXEC CICS RETURN
EXEC SQL
Threadsafe EXEC CICS
Application andDB2 Attach code
EXEC SQL
176 CICS Performance Analyzer

7.2 CICS DB2 accounting and monitoringTo obtain the complete picture of a CICS DB2 system environment, we need to capture storage management subsystem (SMF) records from both CICS and DB2. From CICS, we need the CMF records (SMF 110) and from DB2, we need the DB2 Accounting records (SMF 101).
The information about CPU accounting in DB2 is collected by activating DB2 Accounting trace Class 1 and Class 2. Refer to 1.3.2, “DB2 accounting data (SMF 101 records)” on page 14.
Class 1 results in accounting data being accumulated by several DB2 components. The elapsed time of a DB2 thread is included in this data. Class 2 collects the elapsed and processor times spent in DB2. It is important to remember that with CICS TS V2.2 connected to DB2 V6 or later, the DB2 Class 1 time is included in the CICS CPU time and the DB2Wait field shows zero.
Figure 7-5 shows each period of processor time that is reported by CICS and DB2 when CICS is connected to DB2 Version 5 or earlier.
Figure 7-5 CPU accounting for DB2 Version 5 or earlier
CICS Address Space DB2
DB2 Class-1 CPU = 2+3+4+6+7+8 Class-2 CPU = 3+7
CICS MAIN TCB Attach TCB
3
7
5
9
1
8
6
4
2
CICS CMF CPU = 1+5+9
Chapter 7. Tuning the CICS DB2 attachment facility 177

Figure 7-7 shows each period of processor time that is reported by CICS and DB2 when CICS is connected to DB2 Version 6 or later.
Figure 7-6 CPU accounting for DB2 Version 6 or later
Using CICS PA to analyze the CICS performance class records, you can check the elapsed time a transaction spends waiting for a DB2 request. Also, you can check the attach overhead on the CICS side. The CICS PA fields used are:
� RMISUSP: The total elapsed time the task was suspended by the CICS dispatcher while in the CICS RMI.
� DISPWAIT: The time the task waited to resume execution.
� RMITIME: The amount of elapsed time spent in the RMI.
Also, in the CICS performance class, you have DB2 statistics that can be very useful:
� DB2CONWT: The elapsed time during which the user task waited for a CICS or DB2 subtask to become available.
� DB2RDYQW: The elapsed time during which the user task waited for a DB2 thread to become available.
� DB2REQCT: The total number of DB2 EXEC SQL and Instrumentation Facility Interface (IFI) requests issued by the user task.
178 CICS Performance Analyzer
� DB2WAIT: The elapsed time during which the user task waited for DB2 to service the DB2 EXEC SQL and IFI requests issued by the user task.
7.3 CICS PA reporting CICS DB2 Attachment FacilityThe CICS PA DB2 reports combine the CICS CMF performance class records (SMF 110) with the DB2 Accounting records (SMF 101) to produce a consolidated and detailed view of DB2 usage by your CICS systems. The DB2 report enables you to view CICS and DB2 resource usage statistics together in a single report.
The DB2 List report shows detailed information about DB2 activity for each transaction. The DB2 Summary reports summarize DB2 activity by transactions.
The reports can include the following DB2 information:
� DB2 Thread Identification� Class 1 Thread elapsed and CPU times� Class 2 In-DB2 elapsed and CPU times� Class 3 Suspend times� Buffer Manager statistics� Locking statistics� SQL DML statistics
The DB2 report matches CICS Monitoring Facility Performance records with the DB2 Accounting records by network unit of work (UOW) ID. Your CICS-DB2 resources must be defined with the DB2ENTRY attribute ACCOUNTREC(TASK) or ACCOUNTREC(UOW) for matching to occur.
CICS PA supports DB2 Accounting statistics data from DB2 Version 5, Version 6, and Version 7, although we only use DB2 Version 7 in our scenarios.
A Recap report showing processing statistics is always printed at the end.
7.4 CICS PA example reports CICS PA provides DB2 Performance reports. These reports capture both the CMF and DB2 Accounting records. We show here several CICS PA reports which are used to demonstrate the various options available when using DB2 reports. Refer also to Figure 19-18 on page 428 and Figure 19-19 on page 429, which show using the Historical Database for DB2 reporting.
First, we needed to acquire the SMF data into CICS PA. We obtained the SMF data in data set SMFDATA.ALLRECS.G8429V00. This data set contained the data for both SMF 110 and SMF 101 records. We then used the Take-up function, by selecting option 4 (Take-up) from SMF File from the System Definition Menu. This function automatically adds any systems to CICS PA that are found within SMF records on this data set.
Chapter 7. Tuning the CICS DB2 attachment facility 179

An example of the System Definitions screen is shown in Figure 7-7 after the take-up.
Figure 7-7 System Definitions screen
We then needed to create a report set for the DB2 reports. We requested the creation of a new Report Set DB2REPS (Figure 7-8).
Figure 7-8 Creating a new report set
File Edit Filter View Options Help ------------------------------------------------------------------------------ System Definitions Row 1 from 7Command ===> Scroll ===> CSR Select a System to edit its definition, SMF Files and Groups.
SMF Files / System Type Image Description System SC66 Image System added by take-up SC66 SCSCPJA6 CICS SC66 System added by take-up SCSCPJA6 D7Q2 DB2 SC66 System added by take-up D7Q2 SCSCPTA2 CICS SC66 System added by take-up SC66 SCSCPJA7 CICS SC66 System added by take-up SCSCPJA7 SCSCPTA1 CICS SC66 System added by take-up SC66 SC66LOGR Logger SC66 System added by take-up SC66
File Systems Confirm Options Help ------------------------------------------------------------------------------ Report Sets Command ===> new db2reps Scroll ===> CSR Report Sets Data Set . . : CICSLS5.CICSPA.RSET / Name Description Changed ID
180 CICS Performance Analyzer

As shown in Figure 7-9, we selected DB2 to create the DB2 reports.
Figure 7-9 Selecting DB2 for DB2 reports
File Systems Confirm Options Help ------------------------------------------------------------------------------ EDIT Report Set - DB2REPS Row 1 of 21 Command ===> Scroll ===> CSR Description . . . CICS PA Report Set Enter "/" to select action. ** Reports ** Active + Options No
+ Selection Criteria No - Performance Reports No List No List Extended No Summary No Totals No Wait Analysis No Cross-System Work No Transaction Group No BTS No Workload Activity No + Exception Reports No + Transaction Resource Usage Reports No - Subsystem Reports No
s DB2 No WebSphere MQ No + System Reports No + Performance Graphs No + Extracts No ** End of Reports **
Chapter 7. Tuning the CICS DB2 attachment facility 181

As shown in Figure 7-10, we specified a CICS APPLID and a DB2 SSID, all other options we left at the default.
Figure 7-10 Specifying the system requirements
The report produced is a short summary. When we returned to the Report Sets screen, both the Global and DB2 options were activated, this is indicated by the Yes in the Active column following the option. From there, we enter RUN to run the report (Figure 7-11).
Figure 7-11 Submitting the DB2 report set
File Systems Options Help ------------------------------------------------------------------------------ DB2REPS - DB2 Report Command ===> More: + CICS System Selection: Report Output: APPLID . . SCSCPJA6 + DDname . . . . . . . . . DB2R0001 Image . . SC66 + Print Lines per Page . . (1-255) Group . . + DB2 System Selection: Report Options: SSID . . . D7Q2 + / Process DB2 Accounting records Image . . SC66 + List records with no DB2 activity Group . . + / Long Summary with DB2 maximums Reports ----- DB2 Accounting data to include in report ------ Required: Class1 Class2 Class3 Buffer Locking DML 1 DML 2 List / / / / Long Summary / / / / / Short Summary Report Format: Title . . CICS PA example DB2 report Selection Criteria:
Performance
File Systems Confirm Options Help ------------------------------------------------------------------------------ Report Sets Row 1 to 1 of 1 Command ===> Scroll ===> CSR Report Sets Data Set . . : CICSLS5.CICSPA.RSET / Name Description Changed ID RUN DB2REPS CICS PA Report Set 2003/10/19 13:16 CICSLS5
182 CICS Performance Analyzer

We could have overridden the system selection criteria that we specified earlier, as well as the date and time we wanted to start and stop reporting (Figure 7-12).
Figure 7-12 Run Report Set screen
Example 7-1 shows the report options that were generated from this Report Set.
Example 7-1 Report Set options generated
* Report Set =DB2REPS * Description=CICS PA Report Set * Reports for System=SCSCPJA6 * Image =SC66 * Description=System added by take-up CICSPA IN(SMFIN001), APPLID(SCSCPJA6), LINECNT(60), FORMAT(':','/'), DB2(OUTPUT(DB2R0001), EXTERNAL(CPAXW001), SSID(D7Q2), SHORTSUM, MAXLONGSUM, TITLE1( 'CICS PA example DB2 report ')) /*
File Systems Options Help ------------------------------------------------------------------------------ Run Report Set DB2REPS Command ===> Specify run Report Set options then press Enter to continue submit. System Selection: CICS APPLID . . SCSCPJA6 + Image . . SC66 + Group . . + DB2 SSID . . . D7Q2 + Image . . SC66 + Group . . + MQ SSID . . . . + Image . . + Group . . + Logger . . . . + Image . . + Group . . + / Override System Selections specified in Report Set ----- Report Interval ------ Missing SMF Files Option: MM/DD/YYYY HH:MM:SS.TH 1 1. Issue error message From 2. Leave DSN unresolved in JCL To 3. Disregard offending reports Enter "/" to select option / Edit JCL before submit
Chapter 7. Tuning the CICS DB2 attachment facility 183

The listing output from the run of these report options is shown in Figure 7-13.
Figure 7-13 Short Summary report
In the DB2 Short Summary report, for each APPLID, a data line is presented for the CMF performance class data summarized by transaction and program, and a data line is presented for the associated DB2 Accounting data summarized by the SSID and plan name.
We repeat the same exercise, but this time we are going to request the Long Summary report from the DB2 Report Set screen as shown in Figure 7-14.
Figure 7-14 Request Long Summary report
V1R3M0 CICS Performance Analyzer DB2 - Short Summary __________________________________________________ DB2R0001 Printed at 15:07:27 10/08/2003 Data from 14:07:41 10/07/2003 to 16:10:15 10/07/2003 APPLID SCSCPJA6 Page 1 CICS PA example DB2 report Tran/ Program/ #Tasks/ ............Average Elapsed Time............ .....Average CPU Time..... .....Average Count....... #Abends SSID Planname #Threads Response Thread In-DB2 DB2ConWt DB2ThdWt User Thread In-DB2 DB2Reqs GetPage SysPgUpd DB2N PROGDB2N 1433 .0115 .0000 .0000 .002568 17.0 0D7Q2 PROGDB2N 1433 .0081 N/P .001648 N/P 3.0 .0 DB2R PROGDB2R 1330 .6412 .0918 .0000 .002458 17.0 0D7Q2 PROGDB2R 1330 .5400 N/P .001319 N/P 3.0 .0
File Systems Options Help ------------------------------------------------------------------------------ DB2REPS - DB2 Report Command ===> More: + CICS System Selection: Report Output: APPLID . . SCSCPJA6 + DDname . . . . . . . . . DB2R0001 Image . . SC66 + Print Lines per Page . . (1-255) Group . . + DB2 System Selection: Report Options: SSID . . . D7Q2 + / Process DB2 Accounting records Image . . SC66 + List records with no DB2 activity Group . . + / Long Summary with DB2 maximums Reports ----- DB2 Accounting data to include in report ------ Required: Class1 Class2 Class3 Buffer Locking DML 1 DML 2 List / / / / / Long Summary / / / / Short Summary Report Format: Title . . CICS PA example DB2 report
Selection Criteria:Performance
184 CICS Performance Analyzer

Figure 7-15 shows the report the Long Summary option provides.
Figure 7-15 Long Summary report
A DB2 report list was then produced. To produce a report list, we needed to choose the List option from the DB2 Report screen as shown in Figure 7-16.
Figure 7-16 Requesting the List report
V1R3M0 CICS Performance Analyzer DB2 - Long Summary __________________________________________________ DB2R0001 Printed at 11:11:17 10/09/2003 Data from 14:07:41 10/07/2003 to 16:10:15 10/07/2003 APPLID SCSCPJA6 Page 1CICS PA example DB2 report Avg Max Avg Max Avg Max Avg Max Avg Max Tran/ Program/ #Tasks/ DB2ConWt DB2ConWt DB2ThdWt DB2ThdWt DB2Rqst DB2Rqst UserCPU UserCPU Response Response #Abends SSID Planname #Threads Time Time Time Time Count Count Time Time Time Time DB2N PROGDB2N 1433 .0000 .0000 .0000 .0000 17.0 17 .002568 .007760 .0115 .3789 0 D7Q2 PROGDB2N 1433 Thread Utilization Entry= 1433 Pool= 0 Command= 0 Class1: Thread Time Avg: Elapsed= .0081 CPU= .001648 Max: Elapsed= .3704 CPU= .002559 Class2: In-DB2 Time Avg: Elapsed= N/P CPU= N/P Max: Elapsed= N/P CPU= N/P Buffer Manager Summary Avg: GtPgRq= 3.0 SyPgUp= .0 Max: GtPgRq= 3 SyPgUp= 0 Locking Summary Avg: Suspnd= .0 DeadLk= .0 TmeOut= .0 MxPgLk= 1.0 Max: Suspnd= 0 DeadLk= 0 TmeOut= 0 MxPgLk= 1
File Systems Options Help ------------------------------------------------------------------------------ DB2REPS - DB2 Report Command ===> More: + CICS System Selection: Report Output: APPLID . . SCSCPJA6 + DDname . . . . . . . . . DB2R0001 Image . . SC66 + Print Lines per Page . . (1-255) Group . . + DB2 System Selection: Report Options: SSID . . . D7Q2 + / Process DB2 Accounting records Image . . SC66 + List records with no DB2 activity Group . . + / Long Summary with DB2 maximums Reports ----- DB2 Accounting data to include in report ------ Required: Class1 Class2 Class3 Buffer Locking DML 1 DML 2 / List / / / / Long Summary / / / / Short Summary Report Format: Title . . CICS PA example DB2 report Selection Criteria:
Performance
Chapter 7. Tuning the CICS DB2 attachment facility 185

The DB2 List report provided a detailed list of all network UOWs with DB2 activity. This report consolidates CICS CMF performance class records and DB2 accounting statistics from a single or multiple CICS systems. Figure 7-17 shows an example of this report.
Figure 7-17 List report
In the DB2 List report, a data line is presented for each CMF performance class record, and a block of data lines is presented for each associated DB2 Accounting record. Records that are part of the same network UOW are sequentially in groups separated by blank lines. A network UOW will only be presented if it involved some DB2 activity.
A Recap report showing processing statistics is always printed at the end (Figure 7-18). The recap statistics that are shown can be useful in seeing where the records that were processed came from.
V1R3M0 CICS Performance Analyzer DB2 - List __________________________________________________ DB2R0001 Printed at 16:10:01 10/09/2003 Data from 14:07:41 10/07/2003 to 16:10:15 10/07/2003 Page 1 CICS PA example DB2 report Tran/ Userid/ Program/ UOW R ..DB2 Wait Time.. DB2 User CPU Response ASSID Authid Planname APPLID Task Seq T Term LUName Connect Thread ReqCnt Time Start Time Stop Time Time B DB2N CICSUSER PROGDB2N SCSCPJA6 234 1 T <AY1 SCSCPTA2 .0000 .0000 17 .0023 15:37:40.165 15:37:40.176 .0105 D7Q2 CICSUSER PROGDB2N SCSCPJA6 234 Thread Identification ID=ENTRDB2N0003 NETName=USIBMSC.SCSTP002 UOWID=57FB359D00ED Begin Time: 15:37:40.173 10/07/02 End Time: 15:37:40.175 10/07/02 Class1: Thread Time Elapsed= .0022 CPU= .001444 Class2: In-DB2 Time Elapsed= N/P CPU= N/P Buffer Manager Summary GtPgRq= 3 SyPgUp= 0 Locking Summary Suspnd= 0 DeadLk= 0 TmeOut= 0 MxPgLk= 1
186 CICS Performance Analyzer

Figure 7-18 Recap report
If the DB2 Accounting records have a large number of excluded records, then it is a good indication that the DB2ENTRY definitions do not have ACCOUNTREC(TASK) or (UOW) set.
7.5 CICS TS V1.3 and DB2 V7 scenarioThis scenario shows how you can use CICS PA to produce several DB2 reports from SMF data for CICS TS V1.3 and DB2 V7.1 systems.
DB2N transaction performs the same 15 fetches from the DSN8710.EMP table, but between each fetch there is a non-threadsafe EXEC CICS command. In this scenario, we use the reports CICS PA generates to monitor the number of times the transaction DB2N overflows to the POOL.
The workload was generated using Teleprocessing Network Simulator (TPNS). We used TPNS to simulate a realistic 3270 workload environment. The SIT parameter, TCBLIMIT is 12 and the DB2ENTRY parameter, THREADLIMIT for DB2N is 10.
V1R3M0 CICS Performance Analyzer DB2 - Recap __________________________________________________ DB2R0001 Printed at 17:58:10 10/10/2003 Data from 15:55:27 10/10/2003 to 16:02:06 10/10/2003 Page 1 CICS PA CICS TS V2.2 and DB2 V7.1 Records processed by the DB2 report processor: Count % of Total CMF performance class records: --------- ---------- Included . . . . . . . . . . . . . . . . . . . . 49 .1% Excluded: CICS PA record selection . . . . . . . . . . . 80,829 99.9% No DB2 activity . . . . . . . . . . . . . . . . 0 .0% Other . . . . . . . . . . . . . . . . . . . . . 0 .0% Total . . . . . . . . . . . . . . . . . . . . . . 80,878 DB2 accounting records: Included . . . . . . . . . . . . . . . . . . . . 3,371 97.4% Excluded: CICS PA record selection . . . . . . . . . . . 0 .0%
Not CICS Attach . . . . . . . . . . . . . . . . 89 2.6% Accounting Token not set . . . . . . . . . . . 0 .0% Other . . . . . . . . . . . . . . . . . . . . . 0 .0% Total . . . . . . . . . . . . . . . . . . . . . . 3,460 Network units-of-work with DB2 activity: Count % of Total Network units-of-work where: --------- ---------- DB2 accounting records were resolved . . . . . . 49 100.0% DB2 accounting records were not resolved . . . . 0 .0% DB2 accounting records were not present . . . . . 0 .0% Total . . . . . . . . . . . . . . . . . . . . . . 49 CMF performance class records with DB2 activity: Matched to a DB2 accounting record . . . . . . . 49 100.0% Not matched to any DB2 accounting records . . . . 0 .0% Total . . . . . . . . . . . . . . . . . . . . . . 49 CMF performance class records with no DB2 activity: Total . . . . . . . . . . . . . . . . . . . . . . N/A
DB2 accounting records: Eligible for summary reporting . . . . . . . . . 49 100.0% Matched to a single CICS task . . . . . . . . . 49 100.0% Matched to two or more CICS tasks . . . . . . . . 0 .0% Not matched to any CICS tasks . . . . . . . . . . 0 .0% Total . . . . . . . . . . . . . . . . . . . . . . 49
Chapter 7. Tuning the CICS DB2 attachment facility 187

To start, we added the CICS TS V1.3 CICS system. We already added the DB2 system using the Take-up command in the example reports chapter. The name of this CICS system is SCSCPAA1. To add the new system we had a number of ways of doing this. In this case, we went to the System Definitions menu and enter I (insert) to add a new line (Figure 7-19).
Figure 7-19 Inserting a new system
We were then presented with a pop-up screen to add the new system; we entered the CICS system name and then a 1 to indicate that it is a CICS system. The next screen was then displayed. Here we added the SMF data set we wanted to use to obtain the performance records (Figure 7-20).
Figure 7-20 Adding SMF data sets
We then changed the DB2 system definition, to change the SMF data sets it used. To do this, we selected D7Q2 from the Systems Definitions menu and then added the same SMF data sets that we had added for the CICS system.
We then used the Report Set DB2REPS that we set up earlier.
File Edit Filter View Options Help ------------------------------------------------------------------------------ System Definitions Row 1 from 7 Command ===> Scroll ===> CSR Select a System to edit its definition, SMF Files and Groups. SMF Files / System Type Image Description System SC66 Image System added by take-up SC66
SCSCPJA6 CICS SC66 System added by take-up SCSCPJA6 i D7Q2 DB2 SC66 System added by take-up D7Q2 SCSCPTA2 CICS SC66 System added by take-up SC66 SCSCPJA7 CICS SC66 System added by take-up SCSCPJA7 SCSCPTA1 CICS SC66 System added by take-up SC66 SC66LOGR Logger SC66 System added by take-up SC66
---------------------------- System Definitions ----------------------------- File Edit Dictionary View Options Help -------------------------------------------------------------------------- CICS System Row 1 of 3 More: > Command ===> Scroll ===> CSR CICS System definition: APPLID . . . . . . . . SCSCPAA1 MVS Image . . Description . . . . . CICS TS V1.3 CICS Version (VRM) . . MCT Suffix . . . . . . MCT Load Library . . . SDFHLOAD Library . . . Dictionary DSN . . . . / Exc SMF Data Set Name + UNIT + SEQ VOLSER + 'SMFDATA.ALLRECS.G8484V00' 'SMFDATA.ALLRECS.G8485V00' 'SMFDATA.ALLRECS.G8486V00' ********************************* End of list *****************************
188 CICS Performance Analyzer

For this scenario, we put the CICS system and the DB2 system into a group. For this, we selected option 3 on the Systems Definition menu. We set up a new group by specifying new DB2GROUP, we then needed to add the systems we were interested in obtaining performance records for. Figure 7-21 shows the group that contains our CICS system and our DB2 system.
Figure 7-21 Adding systems to a group
We then went to the Report Set DB2REPS and added the group (Figure 7-22).
Figure 7-22 Using groups
---------------------------- System Definitions ---------------------------- File Edit Options Help -------------------------------------------------------------------------- Systems in this Group Row 1 to 2 of 2 Command ===> Scroll ===> CSR Group . . . . . . DB2GROUP Description . . . / System + Type Image Description SCSCPAA1 CICS CICS TS V1.3 D7Q2 DB2 SC66 System added by take-up ********************************* End of list ****************************
File Filter Edit Systems Options Help ------------------------------------------------------------------------------ DB2REPS - DB2 Reports Row 1 from 1 Command ===> Scroll ===> CSR Select to edit report options. ---- System Selection ----- Selection / Exc APPLID + Image + Group + Output Criteria DB2GROUP DB2R0001 NO ********************************* End of list *********************************
Chapter 7. Tuning the CICS DB2 attachment facility 189

The first report we wanted to run is the short summary as shown in Figure 7-23.
Figure 7-23 Request Short Summary report
File Systems Options Help ------------------------------------------------------------------------------ DB2REPS - DB2 Report Command ===> More: + CICS System Selection: Report Output: APPLID . . + DDname . . . . . . . . . DB2R0001 Image . . + Print Lines per Page . . (1-255) Group . . DB2GROUP + DB2 System Selection: Report Options: SSID . . . + / Process DB2 Accounting records Image . . + List records with no DB2 activity Group . . + / Long Summary with DB2 maximums Reports ----- DB2 Accounting data to include in report ------ Required: Class1 Class2 Class3 Buffer Locking DML 1 DML 2 List / / / / Long Summary / / / / / Short Summary Report Format: Title . . CICS PA example DB2 report Selection Criteria:
Performance
190 CICS Performance Analyzer

We were then ready to RUN the Report Set. You can do this in several places. Here we entered the RUN command from the Report Set as shown in Figure 7-24.
Figure 7-24 Submitting the report set
File Systems Confirm Options Help ------------------------------------------------------------------------------ EDIT Report Set - DB2REPS Row 1 of 20 Command ===> RUN Scroll ===> CSR Description . . . CICS PA Report Set Enter "/" to select action. ** Reports ** Active - Options Yes Global Yes + Selection Criteria No - Performance Reports No List No List Extended No Summary No Totals No Wait Analysis No Cross-System Work No Transaction Group No BTS No Workload Activity No + Exception Reports No + Transaction Resource Usage Reports No - Subsystem Reports Yes
DB2 Yes WebSphere MQ No + System Reports No + Performance Graphs No + Extracts No ** End of Reports **
Chapter 7. Tuning the CICS DB2 attachment facility 191

We then received another screen which allowed the changing of various options, such as the systems we wish to collect performance data from, the option to edit the JCL that will be submitted or specify a date and time we want to collect the performance data. What we requested is shown in Figure 7-25.
Figure 7-25 Selecting records by date and time
We then looked at the output, shown in Figure 7-26, from the Report Set.
Figure 7-26 Short Summary report of the DB2N transaction
Here, we had an average response time of .0581 and the CICS PA field DB2ConWt of .0040. The DB2ConWt field indicates the DB2 Connection Wait time, the wait for a DB2 subtask to become available. We then ran the DB2 Report Set with the Long Summary option. We also requested DB2 Accounting data to be included in the report. The data we requested is the Class 1, Class 2, Buffer and Locking, as shown in Figure 7-27.
File Systems Options Help ------------------------------------------------------------------------------ Run Report Set DB2REPS Command ===> Specify run Report Set options then press Enter to continue submit. System Selection: CICS APPLID . . + Image . . + Group . . + DB2 SSID . . . + Image . . + Group . . + MQ SSID . . . . + Image . . + Group . . + Logger . . . . + Image . . + Group . . + / Override System Selections specified in Report Set ----- Report Interval ------ Missing SMF Files Option: MM/DD/YYYY HH:MM:SS.TH 1 1. Issue error message From 10/14/2003 10:44:00.00 2. Leave DSN unresolved in JCL To 10/14/2003 10:49:00.00 3. Disregard offending reports Enter "/" to select option / Edit JCL before submit
V1R3M0 CICS Performance Analyzer DB2 - Short Summary __________________________________________________ DB2R0001 Printed at 10:58:24 10/14/2003 Data from 10:43:59 10/14/2003 to 10:48:59 10/14/2003 APPLID SCSCPAA1 Page 1 CICS PA CICS TS V1.3 and DB2 V7.1 Tran/ Program/ #Tasks/ ............Average Elapsed Time............ .....Average CPU Time..... .....Average Count....... #Abends SSID Planname #Threads Response Thread In-DB2 DB2ConWt DB2ThdWt User Thread In-DB2 DB2Reqs GetPage SysPgUpd DB2N PROGDB2N 51545 .0581 .0040 .0000 .001007 17.0 0D7Q2 PROGDB2N 51545 .0107 .0011 .000991 .000800 3.0 .0
192 CICS Performance Analyzer

Figure 7-27 Request Long Summary report
We then looked at the Long Summary report listing, as shown in Figure 7-28. We overflowed to the pool 2089 times.
Figure 7-28 Long Summary report of DB2N transaction
In conclusion, we could deduce from the CICS PA long summary report that we should think about increasing the THREADLIMIT parameter for the DB2ENTRY for DB2N, in an effort to reduce the number of pool overflows.
File Systems Options Help ------------------------------------------------------------------------------ DB2REPS - DB2 Report Command ===> More: + CICS System Selection: Report Output: APPLID . . + DDname . . . . . . . . . DB2R0001 Image . . + Print Lines per Page . . (1-255) Group . . DB2GROUP + DB2 System Selection: Report Options: SSID . . . + / Process DB2 Accounting records Image . . + List records with no DB2 activity Group . . + / Long Summary with DB2 maximums Reports ----- DB2 Accounting data to include in report ------ Required: Class1 Class2 Class3 Buffer Locking DML 1 DML 2 List / / / / / Long Summary / / / / Short Summary Report Format: Title . . CICS PA CICS TS V1.3 and DB2 V7.1
Selection Criteria:Performance
V1R3M0 CICS Performance Analyzer DB2 - Long Summary __________________________________________________ DB2R0001 Printed at 12:00:07 10/14/2003 Data from 10:43:59 10/14/2003 to 10:48:59 10/14/2003 APPLID SCSCPAA1 Page 1 CICS PA CICS TS V1.3 and DB2 V7.1 Avg Max Avg Max Avg Max Avg Max Avg Max Tran/ Program/ #Tasks/ DB2ConWt DB2ConWt DB2ThdWt DB2ThdWt DB2Rqst DB2Rqst UserCPU UserCPU Response Response #Abends SSID Planname #Threads Time Time Time Time Count Count Time Time Time Time DB2N PROGDB2N 51545 .0040 .1771 .0000 .0000 17.0 17 .001007 .001552 .0581 1.2871 0 D7Q2 PROGDB2N 51545 Thread Utilization Entry= 49456 Pool= 2089 Command= 0 Class1: Thread Time Avg: Elapsed= .0107 CPU= .000991 Max: Elapsed= 1.2759 CPU= .002685 Class2: In-DB2 Time Avg: Elapsed= .0011 CPU= .000800 Max: Elapsed= .5341 CPU= .002499 Buffer Manager Summary Avg: GtPgRq= 3.0 SyPgUp= .0 Max: GtPgRq= 3 SyPgUp= 0 Locking Summary Avg: Suspnd= .0 DeadLk= .0 TmeOut= .0 MxPgLk= 1.0 Max: Suspnd= 1 DeadLk= 0 TmeOut= 0 MxPgLk= 1
Chapter 7. Tuning the CICS DB2 attachment facility 193

7.6 CICS TS V2.2 and DB2 V7 scenarioThe goal of this scenario is to show the difference in system resources used by a non-threadsafe and a threadsafe application running in CICS TS V2.2 and connected to DB2 V7.1. The CICS PA is used to produce reports using the various options available to the DB2 Report Set.
To show the difference in a threadsafe and a non-threadsafe environment, we use two simple transactions.
� The DB2R transaction which performs 15 fetches from DSN8710.EMP, the sample employee table supplied with DB2 V7.1. This application is threadsafe and was defined as such, with the program attribute, CONCURRENCY(THREADSAFE).
� The DB2N performs the same 15 fetches from DSN8710.EMP, but between each fetch there is a non-threadsafe EXEC CICS command. This application is non-threadsafe and was defined with the program attribute, CONCURRENCY(QUASIRENT).
The workload was generated using Teleprocessing Network Simulator (TPNS). We used TPNS to simulate a realistic 3270 workload environment. Two separate runs were carried out, one with just DB2R transactions running, and one with just DB2N transactions running.
Running the non-threadsafe scenarioThe SIT parameter MAXOPENTCBS value was 15, the DB2CONN TCBLIMIT parameter value was 12 and the DB2ENTRY attribute, THREADLIMIT for DB2N was 10.
For this scenario, we set up another CICS PA group selecting option 3 from the System Definitions Menu. On the Group screen, we requested a new group called db2grp as shown in Figure 7-29.
Figure 7-29 Groups
File Edit Filter View Options Help ------------------------------------------------------------------------------ Groups Row 1 from 1 Command ===> new db2grp Scroll ===> CSR Select to review the Systems in the Group. / Use Group Description 2 DB2GROUP ********************************* End of list *********************************
194 CICS Performance Analyzer

After the new group was created, we added the systems that we were interested in. Here we were interested in SCSCPJA6, a CICS TS V2.2 system, and D7Q2, a DB2 V7.1 system. The screen shown in Figure 7-30 shows the two systems added to our new group.
Figure 7-30 Systems added to group
To select the transactions we wanted, DB2N and DB2R, we used an Object List. We needed to create one first. We did this by accessing option of the main screen. We then specified new DB2TRAN on the Objects Lists screen. The screen in Figure 7-31 was then displayed.
Figure 7-31 Object List
---------------------------- System Definitions ---------------------------- File Edit Options Help -------------------------------------------------------------------------- Systems in this Group Row 1 to 2 of 2 Command ===> Scroll ===> CSR Group . . . . . . DB2GRP Description . . . / System + Type Image Description SCSCPJA6 CICS SC66 System added by take-up D7Q2 DB2 SC66 System added by take-up ********************************* End of list ****************************
File Edit Confirm Options Help ------------------------------------------------------------------------------ EDIT Object List - DB2TRAN Row 1 to 1 of 1 Command ===> Scroll ===> CSR Description . . . . CICS PA Object List Specify the Object List values: / 1st Value 2nd Value Sublist DB2* ********************************* End of list *********************************
Chapter 7. Tuning the CICS DB2 attachment facility 195

On this screen, we entered a value of DB2*. We could use the Object List as the selection criteria for a Report Set. First we ran a short summary report as shown in Figure 7-32. We also selected the Performance selection criteria.
Figure 7-32 Request Short Summary report
On the Performance Selection Statement screen (Figure 7-33), we specified an Object List of DB2TRAN.
Figure 7-33 Performance Select Statement screen
We then submitted the Report Set. Part of the listing of the short summary is shown in Figure 7-34. From this report, we could see that the average response time for the DB2N transaction was .0410, and that we had an average wait for an open TCB to become available
File Systems Options Help ------------------------------------------------------------------------------ DB2REPS - DB2 Report Command ===> More: + CICS System Selection: Report Output: APPLID . . + DDname . . . . . . . . . DB2R0001 Image . . + Print Lines per Page . . (1-255) Group . . DB2GRP + DB2 System Selection: Report Options: SSID . . . + / Process DB2 Accounting records Image . . + List records with no DB2 activity Group . . + / Long Summary with DB2 maximums Reports ----- DB2 Accounting data to include in report ------ Required: Class1 Class2 Class3 Buffer Locking DML 1 DML 2 List / / / / Long Summary / / / / / Short Summary Report Format: Title . . CICS PA CICS TS V1.3 and DB2 V7.1 Selection Criteria:
s Performance
File Edit Object Lists Options Help ------------------------------------------------------------------------------ DB2REPS - Performance Select Statement Row 1 of 9 More: > Command ===> Scroll ===> CSR Active --------------- Report Interval ---------------- Inc Start -------- From --------- --------- To ---------- Exc Stop MM/DD/YYYY HH:MM:SS.TH MM/DD/YYYY HH:MM:SS.TH ------------------------------------------------------------------------------ Inc Field --- Value or Range --- Object / Exc Name + Type Value/From To List + INC TRAN DB2TRAN
196 CICS Performance Analyzer

of .0020. This indicates that may be we should increase the value of the DB2CONN parameter, TCBLIMIT.
Figure 7-34 Short Summary report of DB2N transaction
We then created a Long Summary report (Figure 7-35) to provide more details about the DB2N transaction. From the Long Summary report, we could see the maximum time our transaction waited to obtain an open TCB. We could also see that we had overflowed into the pool 953 times, showing that we should think about increasing the THREADLIMIT value for the DB2N transaction, if this overflowing to the pool is not expected.
Figure 7-35 Long Summary report of DB2N transaction
The DB2 Accounting record Class1: Thread Time is now included in the CICS CPU time. Therefore, the CICS PA field, UserCPU time will be greater than or equal to the Class 1 time.
Finally, we produced a DB2 List report. The List report shows a detailed list of all network UOWs with DB2 activity (Figure 7-36).
V1R3M0 CICS Performance Analyzer DB2 - Short Summary __________________________________________________ DB2R0001 Printed at 10:17:42 10/11/2003 Data from 09:08:01 10/11/2003 to 09:09:59 10/11/2003 APPLID SCSCPJA6 Page 1 CICS PA CICS TS V2.2 and DB2 V7.1 Tran/ Program/ #Tasks/ ............Average Elapsed Time............ .....Average CPU Time..... .....Average Count....... #Abends SSID Planname #Threads Response Thread In-DB2 DB2ConWt DB2ThdWt User Thread In-DB2 DB2Reqs GetPage SysPgUpd DB2N PROGDB2N 11178 .0410 .0020 .0000 .002269 17.0 0D7Q2 PROGDB2N 11165 .0255 .0021 .001457 .000804 3.0 .0
V1R3M0 CICS Performance Analyzer DB2 - Long Summary __________________________________________________ DB2R0001 Printed at 11:42:22 10/11/2003 Data from 09:08:01 10/11/2003 to 09:09:59 10/11/2003 APPLID SCSCPJA6 Page 1CICS PA CICS TS V2.2 and DB2 V7.1 Avg Max Avg Max Avg Max Avg Max Avg Max Tran/ Program/ #Tasks/ DB2ConWt DB2ConWt DB2ThdWt DB2ThdWt DB2Rqst DB2Rqst UserCPU UserCPU Response Response #Abends SSID Planname #Threads Time Time Time Time Count Count Time Time Time Time DB2N PROGDB2N 11178 .0020 .2020 .0000 .0000 17.0 17 .002269 .004864 .0410 .3034 0 D7Q2 PROGDB2N 11165 Thread Utilization Entry= 10212 Pool= 953 Command= 0 Class1: Thread Time Avg: Elapsed= .0255 CPU= .001457 Max: Elapsed= .2294 CPU= .002361 Class2: In-DB2 Time Avg: Elapsed= .0021 CPU= .000804 Max: Elapsed= .1113 CPU= .001617 Buffer Manager Summary Avg: GtPgRq= 3.0 SyPgUp= .0 Max: GtPgRq= 3 SyPgUp= 0 Locking Summary Avg: Suspnd= .1 DeadLk= .0 TmeOut= .0 MxPgLk= 1.0 Max: Suspnd= 1 DeadLk= 0 TmeOut= 0 MxPgLk= 1
Chapter 7. Tuning the CICS DB2 attachment facility 197

Figure 7-36 List report of the DB2N transaction
We changed the SIT parameter, MAXOPENTCBS to 20, the DB2CONN parameter, TCBLIMIT to 20 and the DB2ENTRY attribute, THREADLIMIT for DB2N to 20. We ran the tests again and collected the SMF records. We used the Long Summary report to display the results of this new test (Figure 7-37).
Figure 7-37 Long Summary report of the DB2N transaction
From this report, we could see that we had reduced the DB2ConWt to 0 and the number of overflows to the pool to 0.
V1R3M0 CICS Performance Analyzer DB2 - List __________________________________________________ DB2R0001 Printed at 12:11:04 10/11/2003 Data from 09:08:01 10/11/2003 to 09:09:59 10/11/2003 Page 1 CICS PA CICS TS V2.2 and DB2 V7.1 Tran/ Userid/ Program/ UOW R ..DB2 Wait Time.. DB2 User CPU Response ASSID Authid Planname APPLID Task Seq T Term LUName Connect Thread ReqCnt Time Start Time Stop Time Time B DB2N CICSUSER PROGDB2N SCSCPJA6 63747 1 T <AY4 SCSCPTA2 .0000 .0000 17 .0024 9:08:02.154 9:08:02.244 .0900 D7Q2 CICSUSER PROGDB2N SCSCPJA6 63747 Thread Identification ID=ENTRDB2N0009 NETName=USIBMSC.SCSTP000 UOWID=5CAB94729676 Begin Time: 9:08:02.158 10/11/02 End Time: 9:08:02.243 10/11/02 Class1: Thread Time Elapsed= .0845 CPU= .001541 Class2: In-DB2 Time Elapsed= .0105 CPU= .000892 Buffer Manager Summary GtPgRq= 3 SyPgUp= 0 Locking Summary Suspnd= 1 DeadLk= 0 TmeOut= 0 MxPgLk= 1 DB2N CICSUSER PROGDB2N SCSCPJA6 63867 1 T <AY3 SCSCPTA2 .0000 .0000 17 .0022 9:08:03.145 9:08:03.165 .0199 D7Q2 CICSUSER PROGDB2N SCSCPJA6 63867 Thread Identification ID=ENTRDB2N0012 NETName=USIBMSC.SCSTP000 UOWID=5CAB95649CE6 Begin Time: 9:08:03.146 10/11/02 End Time: 9:08:03.164 10/11/02 Class1: Thread Time Elapsed= .0185 CPU= .001447 Class2: In-DB2 Time Elapsed= .0009 CPU= .000775 Buffer Manager Summary GtPgRq= 3 SyPgUp= 0 Locking Summary Suspnd= 0 DeadLk= 0 TmeOut= 0 MxPgLk= 1 DB2N CICSUSER PROGDB2N SCSCPJA6 63973 1 T <AY4 SCSCPTA2 .0000 .0000 17 .0022 9:08:03.997 9:08:04.015 .0186 D7Q2 CICSUSER PROGDB2N SCSCPJA6 63973 Thread Identification ID=ENTRDB2N0012 NETName=USIBMSC.SCSTP000 UOWID=5CAB9634A394 Begin Time: 9:08:03.998 10/11/02 End Time: 9:08:04.014 10/11/02 Class1: Thread Time Elapsed= .0160 CPU= .001432 Class2: In-DB2 Time Elapsed= .0009 CPU= .000782 Buffer Manager Summary GtPgRq= 3 SyPgUp= 0 Locking Summary Suspnd= 0 DeadLk= 0 TmeOut= 0 MxPgLk= 1
V1R3M0 CICS Performance Analyzer DB2 - Long Summary __________________________________________________ DB2R0001 Printed at 13:29:57 10/11/2003 Data from 12:25:59 10/11/2003 to 12:28:43 10/11/2003 APPLID SCSCPJA6 Page 1CICS PA CICS TS V2.2 and DB2 V7.1 Avg Max Avg Max Avg Max Avg Max Avg Max Tran/ Program/ #Tasks/ DB2ConWt DB2ConWt DB2ThdWt DB2ThdWt DB2Rqst DB2Rqst UserCPU UserCPU Response Response #Abends SSID Planname #Threads Time Time Time Time Count Count Time Time Time Time DB2N PROGDB2N 15436 .0000 .0000 .0000 .0000 17.0 17 .002276 .006128 .0410 .7160 0 D7Q2 PROGDB2N 15436 Thread Utilization Entry= 15436 Pool= 0 Command= 0 Class1: Thread Time Avg: Elapsed= .0297 CPU= .001458 Max: Elapsed= .6947 CPU= .002273 Class2: In-DB2 Time Avg: Elapsed= .0028 CPU= .000807 Max: Elapsed= .1031 CPU= .001649 Buffer Manager Summary Avg: GtPgRq= 3.0 SyPgUp= .0 Max: GtPgRq= 3 SyPgUp= 0 Locking Summary Avg: Suspnd= .1 DeadLk= .0 TmeOut= .0 MxPgLk= 1.0 Max: Suspnd= 1 DeadLk= 0 TmeOut= 0 MxPgLk= 1
198 CICS Performance Analyzer

Running the threadsafe scenarioWe then ran the DB2R transaction with the same system setup. The SIT parameter, MAXOPENTCBS parameter was 15, the DB2CONN parameter, TCBLIMIT was 12 and the DB2ENTRY attribute, THREADLIMIT for DB2R was 10.
The Short Summary report is shown in Figure 7-38.
Figure 7-38 Short Summary report of the DB2R transaction
Looking at this report, we could see that the average response time is .0150. Even though we used the same number of open TCBs, we had a much smaller value for the CICS PA field, DB2ConWt. We then looked at the Long Summary report as shown in Figure 7-39.
Figure 7-39 Long Summary report of DB2R transaction
The number of transactions that overflowed to the pool were reduced without the need to change any other parameters.
In conclusion, we could see the improvement in CICS DB2 performance and system resources when running in a threadsafe environment quickly with the use of the CICS PA DB2 reports.
V1R3M0 CICS Performance Analyzer DB2 - Short Summary __________________________________________________ DB2R0001 Printed at 13:59:48 10/11/2003 Data from 13:40:59 10/11/2003 to 13:43:33 10/11/2003 APPLID SCSCPJA6 Page 1 CICS PA CICS TS V2.2 and DB2 V7.1 Tran/ Program/ #Tasks/ ............Average Elapsed Time............ .....Average CPU Time..... .....Average Count....... #Abends SSID Planname #Threads Response Thread In-DB2 DB2ConWt DB2ThdWt User Thread In-DB2 DB2Reqs GetPage SysPgUpd DB2R PROGDB2R 14346 .0150 .0001 .0000 .001958 17.0 0D7Q2 PROGDB2R 14346 .0066 .0023 .001096 .000691 3.0 .0
V1R3M0 CICS Performance Analyzer DB2 - Long Summary __________________________________________________ DB2R0001 Printed at 14:08:55 10/11/2003 Data from 13:40:59 10/11/2003 to 13:43:33 10/11/2003 APPLID SCSCPJA6 Page 1 CICS PA CICS TS V2.2 and DB2 V7.1 Avg Max Avg Max Avg Max Avg Max Avg Max Tran/ Program/ #Tasks/ DB2ConWt DB2ConWt DB2ThdWt DB2ThdWt DB2Rqst DB2Rqst UserCPU UserCPU Response Response #Abends SSID Planname #Threads Time Time Time Time Count Count Time Time Time Time DB2R PROGDB2R 14346 .0001 .0295 .0000 .0000 17.0 17 .001958 .005792 .0150 .2570 0 D7Q2 PROGDB2R 14346 Thread Utilization Entry= 14309 Pool= 37 Command= 0 Class1: Thread Time Avg: Elapsed= .0066 CPU= .001096 Max: Elapsed= .2064 CPU= .004563 Class2: In-DB2 Time Avg: Elapsed= .0023 CPU= .000691 Max: Elapsed= .1983 CPU= .004140 Buffer Manager Summary Avg: GtPgRq= 3.0 SyPgUp= .0 Max: GtPgRq= 3 SyPgUp= 0 Locking Summary Avg: Suspnd= .0 DeadLk= .0 TmeOut= .0 MxPgLk= 1.0 Max: Suspnd= 1 DeadLk= 0 TmeOut= 0 MxPgLk= 1
Chapter 7. Tuning the CICS DB2 attachment facility 199

7.7 Extracting CICS DB2 recordsTo extract CICS DB2 performance records, we need to define a Report Form. We selected option 3 on the Primary Options Menu, and then arrived at the Report Forms screen. As shown in Figure 7-40, we created a new Report Form called db2perf.
Figure 7-40 Creating a report form
We were then given the option of which APPLIDs we are interested in extracting. We requested an APPLID of SCSCPAA1 and a form type of List (Figure 7-41).
Figure 7-41 List type of Report Form
The List Report Form screen (Figure 7-42) was displayed. From here, we chose which fields we wanted to extract. Since we were interested in CICS DB2 performance, we needed to move the DB2 fields we had available before the EOX line.
File Confirm Samples Options Help ------------------------------------------------------------------------------ Report Forms Row 1 to 1 of 1 Command ===> new db2perf Scroll ===> CSR Report Forms Data Set . . : CICSLS5.CICSPA.FORM / Name Type Description Changed ID
---------------------------- Report Forms ----------------------------- File Systems Options Help -------------------------------------------------------------------- New Report Form Command ===> Specify the name of the new Report Form and its options. Name . . . . . . DB2PERF APPLID . . . . . SCSCPAA1 + Version (VRM) . . 530 MVS Image . . . . Field Categories Form Type or Model . . 1 1. List 2. List Extended (Sorted) 3. Summary 4. Model (specified below) Model
200 CICS Performance Analyzer

Figure 7-42 List Report Form screen
We created another report set. Here we chose Export. The next screen showed the Exports screen, where we specified the Form we just created (Figure 7-42), along with the data set we were using to export the data (Figure 7-43).
Figure 7-43 Exports screen
We were only interested in the CICS transactions DB2N and DB2R, so we selected them in the Performance select statement as shown in Figure 7-44.
File Edit Confirm Upgrade Options Help ------------------------------------------------------------------------------ EDIT LIST Report Form - DB2PERF Row 1 of 220 More: > Command ===> Scroll ===> CSR Description . . . List Report Form Version (VRM): 530 Selection Criteria: Performance Field / Name + Type Description TRAN Transaction identifier PROGRAM Program name RESPONSE Transaction response time CPU TIME CPU time DB2CONWT TIME DB2 Connection wait time DB2RDYQW TIME DB2 Thread wait time DB2REQCT DB2 requests DB2WAIT TIME DB2 SQL/IFI wait time RMIOTIME Resource Manager Interface (RMI) other time RMISUSP TIME Resource Manager Interface (RMI) suspend time RMITIME TIME Resource Manager Interface (RMI) elapsed time EOX ---------------- End of Extract ---------------
File Filter Edit Systems Options Help ------------------------------------------------------------------------------ DB2REP2 - Exports Row 1 from 1 Command ===> Scroll ===> CSR ---- System Selection ----- Selection / Exc APPLID + Image + Group + Recap Form + Criteria DB2GROUP EXPT0001 DB2PERF NO Output Data Set . . 'CICSLS5.DB2.EXPORT' ------------------------------------------------------------------------------ ********************************* End of list *********************************
Chapter 7. Tuning the CICS DB2 attachment facility 201

Figure 7-44 Performance Select Statement screen
We then submitted this Report Set and then viewed the job output. The extract informed us of how many records we had extracted. In Figure 7-45, you see that we extracted 11,855 records.
Figure 7-45 Record count of extracted records
We then viewed the output data set using ISPF. Figure 7-46 shows the output.
Figure 7-46 Extract of CICS DB2 data
We then transferred the data set down to a PC using the Personal Communications emulation program file transfer.
File Edit Object Lists Options Help ------------------------------------------------------------------------------ DB2REP2 - Performance Select Statement Row 1 of 10 More: > Command ===> Scroll ===> CSR Active --------------- Report Interval ---------------- Inc Start -------- From --------- --------- To ---------- Exc Stop MM/DD/YYYY HH:MM:SS.TH MM/DD/YYYY HH:MM:SS.TH ------------------------------------------------------------------------------ Inc Field --- Value or Range --- Object / Exc Name + Type Value/From To List + INC TRAN DB2N INC TRAN DB2R
V1R3M0 CICS Performance Analyzer Performance List __________________________________________________ EXPT0001 Printed at 16:43:42 10/14/2003 Data from 13:41:59 10/11/2003 APPLID SCSCPJA7 Page 1 CPAOEX01 Extract has completed successfully Data Set Name . . . . CICSLS5.DB2.EXPORT Record count . . . . 11,855
Tran;Program;Response;User CPU Time;DB2ConWt Time;DB2ThdWt Time;DB2 Reqs;DB2SQLWt Time;RMIOther;RMI Susp Time;RMI Elap TimeDB2R;PROGDB2R; .0036; .0018; .0000; .0000; 17; .0000; .0000; .0000; .0017 DB2R;PROGDB2R; .0035; .0017; .0000; .0000; 17; .0000; .0000; .0000; .0015 DB2R;PROGDB2R; .0046; .0017; .0000; .0000; 17; .0000; .0000; .0000; .0017 DB2N;PROGDB2N; .0119; .0027; .0000; .0000; 17; .0000; .0000; .0000; .0020 DB2R;PROGDB2R; .0028; .0018; .0000; .0000; 17; .0000; .0000; .0000; .0014 DB2N;PROGDB2N; .0068; .0020; .0000; .0000; 17; .0000; .0000; .0000; .0022 DB2R;PROGDB2R; .0042; .0020; .0000; .0000; 17; .0000; .0000; .0000; .0021 DB2R;PROGDB2R; .0036; .0020; .0000; .0000; 17; .0000; .0000; .0000; .0024 DB2R;PROGDB2R; .0026; .0019; .0000; .0000; 17; .0000; .0000; .0000; .0016 DB2R;PROGDB2R; .0090; .0018; .0000; .0000; 17; .0000; .0000; .0000; .0018 DB2R;PROGDB2R; .0092; .0022; .0000; .0000; 17; .0000; .0000; .0000; .0052 DB2R;PROGDB2R; .0094; .0021; .0000; .0000; 17; .0000; .0000; .0000; .0019 DB2R;PROGDB2R; .0056; .0018; .0000; .0000; 17; .0000; .0000; .0000; .0022 DB2R;PROGDB2R; .0083; .0019; .0000; .0000; 17; .0000; .0000; .0000; .0036 DB2R;PROGDB2R; .0084; .0018; .0000; .0000; 17; .0000; .0000; .0000; .0018 DB2R;PROGDB2R; .0076; .0019; .0000; .0000; 17; .0000; .0000; .0000; .0034 DB2N;PROGDB2N; .0267; .0029; .0000; .0000; 17; .0000; .0000; .0000; .0030 DB2R;PROGDB2R; .0044; .0020; .0000; .0000; 17; .0000; .0000; .0000; .0017 DB2R;PROGDB2R; .0042; .0017; .0000; .0000; 17; .0000; .0000; .0000; .0021 DB2R;PROGDB2R; .0073; .0019; .0000; .0000; 17; .0000; .0000; .0000; .0045
202 CICS Performance Analyzer

The transfer options we used in Personal Communications were the name of the host file and the name for the PC file that should be placed in the appropriate directory and should be called .TXT. The transfer type was text. We imported the data into Microsoft Excel.
We started Microsoft Excel and clicked File -> Open. We selected the file we wanted to open. Then the Text Import Wizard screen opened. Here, we chose Delimited and then Semicolon. Semicolon was the delimiter we used when creating the extract file in CICS PA.
After we had the data in Microsoft Excel, we created a chart. As shown in Figure 7-47, we produced a graph that shows the average CPU Time for the DB2N and the DB2R transactions we ran earlier. It also shows the improvement in CPU times for DB2R over DB2N.
Figure 7-47 CPU Time by transaction
7.8 ConclusionUsing a set of CICS PA reports and extracts, we showed the performance advantages of using the threadsafe environment as opposed to a non-threadsafe. We also showed how you can tune the MAXOPENTCBS SIT parameter, TCBLIMIT DB2CONN parameter, and THREADLIMIT DB2Entry parameter to improve overall performance or the performance of a specific transaction.
Avg CPU Time
0
0.0005
0.001
0.0015
0.002
0.0025
0.003
DB2N DB2R
Transactions
Tim
e
Avg CPU Time
Chapter 7. Tuning the CICS DB2 attachment facility 203

204 CICS Performance Analyzer

Chapter 8. WebSphere MQ
With the new WebSphere MQ report, CICS Performance Analyzer (PA) 1.3 offers the possibility to produce comprehensive reports containing detailed information about the MQ application programming interface (API) calls that are executed in CICS transactions. This chapter provides an overview of the new reports that can be produced from the MQ storage management subsystem (SMF) 116 accounting records written only from CICS transactions.
First we give a brief overview of MQ accounting trace records and describe the MQ provided sample transactions that we used. Then we go through a scenario. We show the content of MQ list and summary reports and how CICS performance data can be related to MQ reports. We also provide a sample of a Transaction Temporary Storage Usage Summary report.
8
© Copyright IBM Corp. 2003. All rights reserved. 205

8.1 Overview CICS PA MQ reports use the WebSphere MQ accounting data included in an SMF type 116 record to provide a performance analysis of the CICS transactions that access an MQ queue manager. WebSphere MQ accounting records are produced when the Accounting Trace component of WebSphere MQ is activated. MQ traces can be selected by class. There are two possible classes for an MQ accounting record:
� Class 1 records contain the CPU time spent processing WebSphere MQ API calls and the count of MQGET and MQPUT calls.
� Class 3 records contain enhanced accounting and statistical data for each task at thread and queue level.
There are two types of CICS PA MQ reports:
� CICS PA MQ List report: This report provides a detailed trace of the WebSphere MQ accounting records, reporting the comprehensive performance data contained in the Class 1 and Class 3 records.
� CICS PA MQ Summary report: This report provides an analysis of the MQ system and queue resources used and the transactions they service. The data can be summarized by CICS transaction ID or MQ queue name or both.
CICS PA 1.3 supports the WebSphere Accounting and statistical data from MQSeries for OS/390 Version 5.2 and from IBM WebSphere MQ for z/OS Version 5.3 and 5.3.1.
8.2 EnvironmentWe started CICS region CICSLSA5 that connects to a WebSphere MQ queue manager. The SSID of the MQ subsystem is MQFI. The name of the queue that we used is CICSPA.MQ. We did not run a workload but decided to use the MQ provided sample transactions to see the result of the execution of these transactions in the CICS PA MQ reports.
The sample MQ transactions are:
� MVPT executes program CSQ4CVK1 that is a sample program to put a number of messages to a queue.
� MVGT executes program CSQ4CVJ1 that is a sample program to get a number of messages from a queue. These messages are written to a CICS temporary storage queue.
The transaction syntax is:
MVPT,nummsgs,padchar,msglength,persistence,qname
MVGT,nummsgs,gettype,syncpoint,qname
Note the following explanation:
� nummsgs is the number of messages written to or read from the queue.� padchar is the character that will be written to the message buffer.� msglength is the length of the message.� persistence is P for a persistent message or N for a non-persistent message.� qname is the name of the queue.� gettype is B for a BROWSE-GET or D for a DESTRUCTIVE-GET.� syncpoint is S for a SYNCPOINT or N for NO-SYNCPOINT.
206 CICS Performance Analyzer

8.3 CICS changesAuthorized program analysis report (APAR) PQ76703 adds some new monitoring and statistics functions to CICS TS 2.2. Refer to the list of enabling PTFs in Table 2-1 on page 26. One of the new options specifies whether you want additional monitoring performance class data to be collected for the resource managers used by your transactions. This way, the time spent in the External Resource Managers (ERM) is added in different new Resource Manager Interface (RMI) fields in the CMF Performance class record. This option is activated via a new RMI parameter on the TYPE=INITIAL macro of the MCT.
Before running this scenario, we assembled the MCT that is shown in Example 8-1. It shows the specification of the RMI=YES parameter and the suffix that we specified for the MCT parameter in the SIT or SYSIN overriding at CICS initialization.
Example 8-1 MCT with RMI=YES
// JOB /*JOBPARM SYSAFF=SC66 //PLEASE EXEC DFHAUPLE,INDEX='CICSTS22.CICS', // INDEX2='CICSTS22.CICS' //ASSEM.SYSUT1 DD * RMI DFHMCT TYPE=INITIAL, * APPLNAME=YES, * FILE=10, * RMI=YES, * SUFFIX=RM * DFHMCT TYPE=FINAL END //LNKEDT.SYSLMOD DD DISP=SHR,DSN=CICSSYSF.APPL62.LOADLIB //LNKEDT.SYSIN DD * NAME DFHMCTRM(R)
This scenario includes the MQ RMI field in the reports that we print with CICS PA.
8.4 MQ accounting traceBefore we ran the sample MQ transactions, we started the MQ traces by entering the command:
- MQFI START TRACE(ACCTG) DEST(SMF) CLASS(01:03)
From a CICS terminal, we ran the following transactions:
� MVPT,500,*,40,P,CICSPA.MQ� MVPT,100,*,400,N,CICSPA.MQ� MVGT,100,B,N,CICSPA.MQ� MVGT,100,D,N,CICSPA.MQ� MVPT,50,*,50,P,CICSPA.MQ� MVPT,50,*,1400,P,CICSPA.MQ� MVGT,100,D,N,CICSPA.MQ� MVGT,100,D,N,CICSPA.MQ� MVGT,100,D,N,CICSPA.MQ� MVGT,100,D,N,CICSPA.MQ
Chapter 8. WebSphere MQ 207

� MVGT,100,D,N,CICSPA.MQ� MVGT,102,D,N,CICSPA.MQ
On the run of the last transaction, the MVGT transaction returned following message on the screen:
MQGET 000000101 failed * CC : 000000002 * RC : 000002033 *
We received a return code of 2033 indicating that no messages were available.
We switched the SMF data sets and copied the CICS and MQ records to a separate data set called BARI.SMFDATA.MQ4. We used this data set as input for the CICS PA Take-up function. From the CICS PA Primary Option Menu, we selected option 1 (System Definitions), and then option 4 (Take-up). Next, we entered the data set name as shown in Figure 8-1.
Figure 8-1 System Definitions Take-up function
We returned to the CICS PA Primary Option Menu and selected again the System Definitions option. A screen is displayed indicating that the system definitions were updated by the Take-up function. Figure 8-2 shows the System Definitions screen.
------------------------- System Definitions ------------------------- File Options Help ------------------------------------------------------------------- Data Take-Up from SMF Command ===> Specify the SMF File for data take-up. Data Set Name . . . BARI.SMFDATA.MQ4 Specify details if data set is not cataloged: UNIT . . . . . + VOLSER . . . + SEQ Number . . (1 to 255) Execution Mode: 1 1. Submit Batch JCL 2. Edit Batch JCL
208 CICS Performance Analyzer
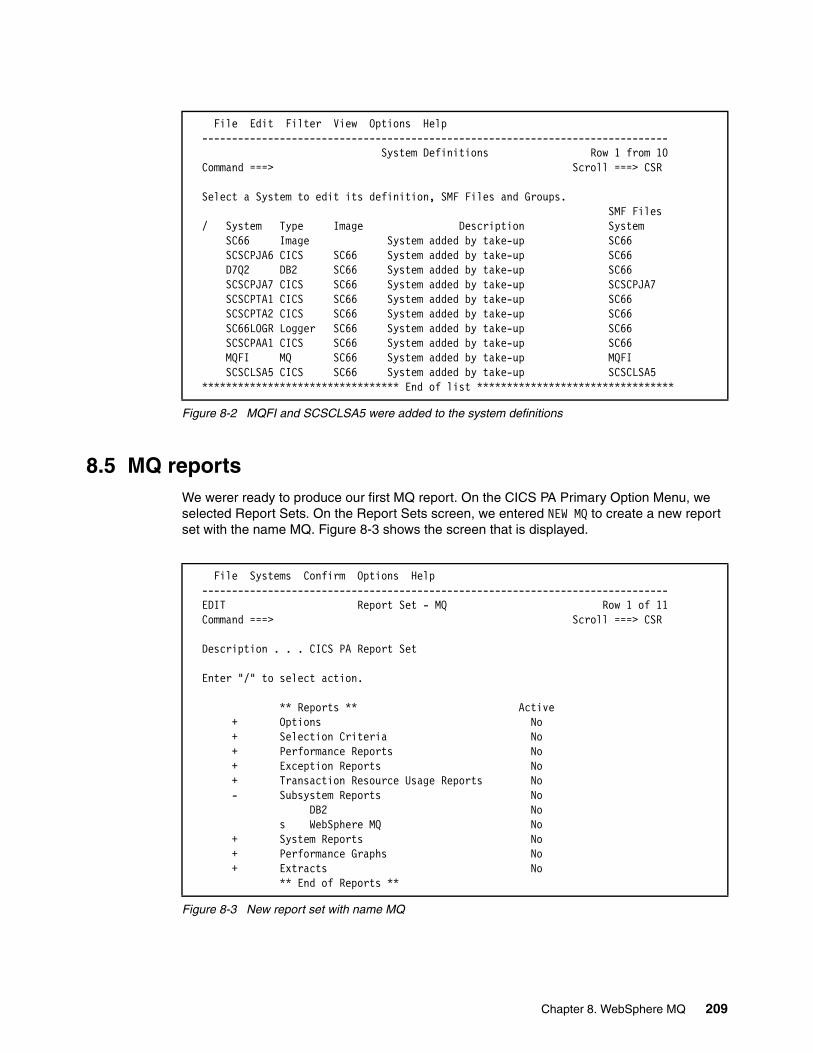
Figure 8-2 MQFI and SCSCLSA5 were added to the system definitions
8.5 MQ reportsWe werer ready to produce our first MQ report. On the CICS PA Primary Option Menu, we selected Report Sets. On the Report Sets screen, we entered NEW MQ to create a new report set with the name MQ. Figure 8-3 shows the screen that is displayed.
Figure 8-3 New report set with name MQ
File Edit Filter View Options Help ------------------------------------------------------------------------------ System Definitions Row 1 from 10 Command ===> Scroll ===> CSR Select a System to edit its definition, SMF Files and Groups. SMF Files / System Type Image Description System SC66 Image System added by take-up SC66 SCSCPJA6 CICS SC66 System added by take-up SC66 D7Q2 DB2 SC66 System added by take-up SC66 SCSCPJA7 CICS SC66 System added by take-up SCSCPJA7 SCSCPTA1 CICS SC66 System added by take-up SC66 SCSCPTA2 CICS SC66 System added by take-up SC66
SC66LOGR Logger SC66 System added by take-up SC66 SCSCPAA1 CICS SC66 System added by take-up SC66
MQFI MQ SC66 System added by take-up MQFI SCSCLSA5 CICS SC66 System added by take-up SCSCLSA5
********************************* End of list *********************************
File Systems Confirm Options Help ------------------------------------------------------------------------------ EDIT Report Set - MQ Row 1 of 11 Command ===> Scroll ===> CSR Description . . . CICS PA Report Set Enter "/" to select action. ** Reports ** Active + Options No + Selection Criteria No + Performance Reports No + Exception Reports No + Transaction Resource Usage Reports No - Subsystem Reports No DB2 No s WebSphere MQ No + System Reports No + Performance Graphs No + Extracts No ** End of Reports **
Chapter 8. WebSphere MQ 209
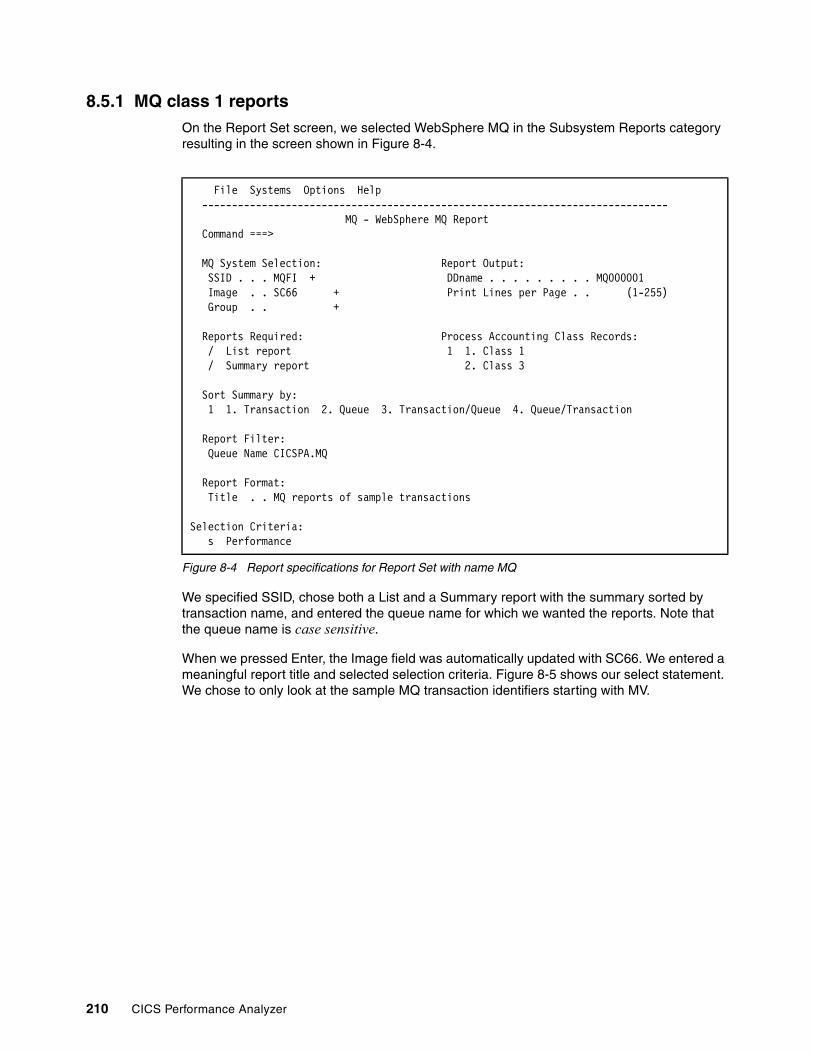
8.5.1 MQ class 1 reportsOn the Report Set screen, we selected WebSphere MQ in the Subsystem Reports category resulting in the screen shown in Figure 8-4.
Figure 8-4 Report specifications for Report Set with name MQ
We specified SSID, chose both a List and a Summary report with the summary sorted by transaction name, and entered the queue name for which we wanted the reports. Note that the queue name is case sensitive.
When we pressed Enter, the Image field was automatically updated with SC66. We entered a meaningful report title and selected selection criteria. Figure 8-5 shows our select statement. We chose to only look at the sample MQ transaction identifiers starting with MV.
File Systems Options Help ------------------------------------------------------------------------------ MQ - WebSphere MQ Report Command ===> MQ System Selection: Report Output: SSID . . . MQFI + DDname . . . . . . . . . MQ000001 Image . . SC66 + Print Lines per Page . . (1-255) Group . . + Reports Required: Process Accounting Class Records: / List report 1 1. Class 1 / Summary report 2. Class 3 Sort Summary by: 1 1. Transaction 2. Queue 3. Transaction/Queue 4. Queue/Transaction Report Filter: Queue Name CICSPA.MQ Report Format: Title . . MQ reports of sample transactions
Selection Criteria: s Performance
210 CICS Performance Analyzer

Figure 8-5 Selection criteria for the MQ report set
We returned to the Report Set panel where we entered the RUN line action on the WebSphere MQ report. The resulting reports are shown in Figure 8-6.
This report lists the transactions that we executed. Tasks 55 and 56 are adding respectively 500 and 100 messages of 40 and 400 bytes to the queue making a total of 600 messages on the queue. Task 57 reads 100 messages. However, in a Class 1 report, we cannot see that these are non-destructive browse operations. The Class 3 report allows us to distinguish between a browse and a destructive get. Task 58 also does 100 reads but these are destructive, bringing the number of messages to 500. Tasks 59 and 60 add each 50 messages, also with different lengths. The queue depth again is 600 messages. Tasks 61, 62, 63, and 64 each read 100 messages, thus removing the 400 remaining messages with a length of 40. Task 65 also reads 100 messages and removes the 100 messages with a length of 400 bytes. Task 66 asked to get 102 messages but only 100 were left, 50 with length of 50 and 50 with length 1400. After these were read, we received the reason code of 2033 telling that there were no more messages.
The Class 1 Summary report gives an overview per transaction code. It calculates an average value for all fields.
For a more detailed look at the MQ activity, we requested a Class 3 List report. This produces a list of extended information per transaction. The Class 3 report contains information in five sections. For detailed information about these five sections and the fields that these contain, see “WebSphere MQ report” in the CICS Performance Analyzer for z/OS Report Reference, SC34-6308.
File Edit Object Lists Options Help ------------------------------------------------------------------------------ MQ - Performance Select Statement Row 1 of 8 More: > Command ===> Scroll ===> CSR Active --------------- Report Interval ---------------- Inc Start -------- From --------- --------- To ---------- Exc Stop MM/DD/YYYY HH:MM:SS.TH MM/DD/YYYY HH:MM:SS.TH ------------------------------------------------------------------------------ Inc Field --- Value or Range --- Object / Exc Name + Type Value/From To List + INC TRAN MV* ********************************* End of list *********************************
Chapter 8. WebSphere MQ 211

Figure 8-6 MQ Class 1 List and Summary reports
Being interested in tasks 55, 57, and 66, we changed the selection criteria before requesting a Class 3 report. Figure 8-7 shows our Performance select statement where we added the three task numbers.
Figure 8-7 Updated selection criteria for selected tasks
V1R3M0 CICS Performance Analyzer WebSphere MQ Class 1 List __________________________________________________ MQ000001 Printed at 11:54:45 10/17/2003 Data from 11:45:55 10/17/2003 Page 1 MQ reports of sample transactions SSID APPLID Tran Time Task CPU -------------- GET Counts ------------- ------------- PUTx Counts ------------- <=99 <=999 <=9999 >=10000 <=99 <=999 <=9999 >=10000 MQFI SCSCLSA5 MVPT 11:45:55.52 55 0.076172 0 0 0 0 500 0 0 0MQFI SCSCLSA5 MVPT 11:46:41.38 56 0.016301 0 0 0 0 0 100 0 0MQFI SCSCLSA5 MVGT 11:47:06.38 57 0.013788 100 0 0 0 0 0 0 0MQFI SCSCLSA5 MVGT 11:47:19.69 58 0.023252 100 0 0 0 0 0 0 0MQFI SCSCLSA5 MVPT 11:47:54.55 59 0.007991 0 0 0 0 50 0 0 0MQFI SCSCLSA5 MVPT 11:48:23.83 60 0.010075 0 0 0 0 0 0 50 0MQFI SCSCLSA5 MVGT 11:48:46.67 61 0.022940 100 0 0 0 0 0 0 0MQFI SCSCLSA5 MVGT 11:48:53.58 62 0.023049 100 0 0 0 0 0 0 0MQFI SCSCLSA5 MVGT 11:48:59.14 63 0.023461 100 0 0 0 0 0 0 0MQFI SCSCLSA5 MVGT 11:49:05.95 64 0.023257 100 0 0 0 0 0 0 0MQFI SCSCLSA5 MVGT 11:49:11.90 65 0.016019 0 100 0 0 0 0 0 0MQFI SCSCLSA5 MVGT 11:49:19.85 66 0.022962 50 0 50 0 0 0 0 0
V1R3M0 CICS Performance Analyzer WebSphere MQ Class 1 Summary __________________________________________________ MQ000001 Printed at 11:54:45 10/17/2003 Data from 11:45:55 10/17/2003 to 11:49:31 10/17/2003 Page 1 MQ reports of sample transactions ----- Average ----- --------- Average GET Counts --------- -------- Average PUTx Counts ---------SSID APPLID TRAN Count CPU Calls <=99 <=999 <=9999 >=10000 <=99 <=999 <=9999 >=10000 MQFI SCSCLSA5 MVGT 8 0.021091 100.0 81.3 12.5 6.3 0.0 0.0 0.0 0.0 0.0MQFI SCSCLSA5 MVPT 4 0.027635 175.0 0.0 0.0 0.0 0.0 137.5 25.0 12.5 0.0
File Edit Object Lists Options Help ------------------------------------------------------------------------------ MQ - Performance Select Statement Row 1 of 4 More: > Command ===> Scroll ===> CSR Active --------------- Report Interval ---------------- Inc Start -------- From --------- --------- To ---------- Exc Stop MM/DD/YYYY HH:MM:SS.TH MM/DD/YYYY HH:MM:SS.TH ------------------------------------------------------------------------------ Inc Field --- Value or Range --- Object / Exc Name + Type Value/From To List + INC TRAN MV* INC TASKNO 55 INC TASKNO 57 INC TASKNO 66 ********************************* End of list *********************************
212 CICS Performance Analyzer

8.5.2 MQ Class 3 reportsWe then changed the WebSphere MQ report options to request a Class 3 List report sorted by transaction. Figure 8-8 shows this.
Figure 8-8 Request for Class 3 List report sorted by transaction
The resulting report is shown in Figure 8-9.
Task 55 shows the detail about an MVPT transaction. Tasks 57 and 66 are MVGT transactions. In this Class 3 report, we see for task 57 that after the GET count, there is a breakdown of GET request sub-types. Here we see that all GET requests were browse any requests. Other possibilities are browse specific, destructive any and destructive specific. They only appear if the count is non-zero. For task 66, we see that all GET requests were destructive.
For task 66 we also see that the GET count here is 101. We requested to read 102 messages. The Class 1 record tells that 100 messages were read, the Class 3 record tells that 101 GET requests were issued. Unfortunately, the Class 3 data does not include the reason code for an API request so we cannot see from this report that the last GET returned a reason code of 2033.
File Systems Options Help ------------------------------------------------------------------------------ MQ - WebSphere MQ Report Command ===> MQ System Selection: Report Output: SSID . . . MQFI + DDname . . . . . . . . . MQ000001 Image . . SC66 + Print Lines per Page . . (1-255) Group . . + Reports Required: Process Accounting Class Records: / List report 2 1. Class 1 Summary report 2. Class 3 Sort Summary by: 1 1. Transaction 2. Queue 3. Transaction/Queue 4. Queue/Transaction Report Filter: Queue Name Report Format: Title . . MQ reports of sample transactions
Selection Criteria: Performance *
Chapter 8. WebSphere MQ 213

Figure 8-9 MQ Class 3 report
We removed the selection for the three transactions before selecting a summary report. Figure 8-10 shows that we asked for a Class 3 Summary report sorted first by queue and then by transaction.
V1R3M0 CICS Performance Analyzer WebSphere MQ Class 3 List __________________________________________________ MQ000001 Printed at 11:57:17 10/17/2003 Data from 11:45:55 10/17/2003 Page 1 MQ reports of sample transactions SSID: MQFI APPLID: SCSCLSA5 Tran: MVPT Task: 55 UserID: CICSUSER NetName: N/A UOWID: N/A Channel: Channel Connection: Start: 10/17/2003 11:45:55.29 Other Total Calls 1 Avg Elapsed 0.048655 Avg CPU 0.000121 #Old Pages 1,222 #New Pages 56 Queue: CICSPA.MQ QType: LOCAL IType: NONE GDisp: Q_MGR Date: 10/17/2003 Time: 11:45:55 P/Set No: 4 BufferPool No: 3 First Opened: 10/17/2003 11:45:55.29 Last Closed: 10/17/2003 11:45:55.48 CF Structure Name: Count Elapsed CPU Susp Elp JnlWrt Elp PS Req's PS Rd Elp Expired Page Skip Msgs Skip _________ _________ _________ _________ __________ _________ _________ _________ _________ _________ OPEN 1 0.000151 0.000149 CLOSE 1 0.000102 0.000050 PUT 500 0.000154 0.000135 0.000000 0.000000 0.0 0.000000
PUT Total Bytes 20,000 #PUT w/Data 500 Min Msg Size 40 Max Msg Siz 40 SSID: MQFI APPLID: SCSCLSA5 Tran: MVGT Task: 57 UserID: CICSUSER NetName: N/A UOWID: N/A Channel: Channel Connection: Start: 10/17/2003 11:46:41.39 Other Total Calls 1 Avg Elapsed 0.000214 Avg CPU 0.000103 #Old Pages 211 #New Pages 0 Queue: CICSPA.MQ QType: LOCAL IType: NONE GDisp: Q_MGR Date: 10/17/2003 Time: 11:46:41 P/Set No: 4 BufferPool No: 3 First Opened: 10/17/2003 11:47:06.31 Last Closed: 10/17/2003 11:47:06.38 CF Structure Name: Count Elapsed CPU Susp Elp JnlWrt Elp PS Req's PS Rd Elp Expired Page Skip Msgs Skip _________ _________ _________ _________ __________ _________ _________ _________ _________ _________ OPEN 1 0.000168 0.000166 CLOSE 1 0.000062 0.000062 GET 100 0.000140 0.000115 0.000000 0.000000 0.0 0.000000 0.0 0.1 0.0 BRW ANY 100 GET Total Bytes 4,000 #GET w/Data 100 Min Msg Size 40 Max Msg Siz 40 SSID: MQFI APPLID: SCSCLSA5 Tran: MVGT Task: 66 UserID: CICSUSER NetName: N/A UOWID: N/A Channel: Channel Connection: Start: 10/17/2003 11:49:11.90 Other Total Calls 1 Avg Elapsed 0.000137 Avg CPU 0.000063 #Old Pages 230 #New Pages 0 Queue: CICSPA.MQ QType: LOCAL IType: NONE GDisp: Q_MGR Date: 10/17/2003 Time: 11:49:11 P/Set No: 0 BufferPool No: 0 First Opened: 10/17/2003 11:49:19.22 Last Closed: 10/17/2003 11:49:19.85 CF Structure Name: Count Elapsed CPU Susp Elp JnlWrt Elp PS Req's PS Rd Elp Expired Page Skip Msgs Skip _________ _________ _________ _________ __________ _________ _________ _________ _________ _________ OPEN 1 0.000169 0.000168 CLOSE 1 0.000042 0.000042 GET 101 0.005375 0.000204 0.005147 0.009894 0.0 0.000000 0.0 0.3 0.0 DES ANY 101
GET Total Bytes 72,500 #GET w/Data 100 Min Msg Size 50 Max Msg Siz 1,400
214 CICS Performance Analyzer

Figure 8-10 Request for Class 3 Summary report
The resulting report is shown in Figure 8-11. The first part of the report gives calculated averages about the total activity on queue CICSPA.MQ, in this case for 12 tasks. The second part of the report gives a task identification and a summary of the task-related statistics.
Figure 8-11 Class 3 Summary report sorted by transaction and by queue
File Systems Options Help ------------------------------------------------------------------------------ MQ - WebSphere MQ Report Command ===> MQ System Selection: Report Output: SSID . . . MQFI + DDname . . . . . . . . . MQ000001 Image . . SC66 + Print Lines per Page . . (1-255) Group . . + Reports Required: Process Accounting Class Records: List report 2 1. Class 1 / Summary report 2. Class 3 Sort Summary by: 4 1. Transaction 2. Queue 3. Transaction/Queue 4. Queue/Transaction Report Filter: Queue Name CICSPA.MQ Report Format: Title . . MQ reports of sample transactions Selection Criteria: Performance *
V1R3M0 CICS Performance Analyzer WebSphere MQ Class 3 Summary (By QUEUE,TRAN) __________________________________________________ MQ000001 Printed at 11:58:58 10/17/2003 Data from 11:45:55 10/17/2003 to 11:49:31 10/17/2003 Page 1 MQ reports of sample transactions Queue: CICSPA.MQ QType: LOCAL IType: NONE GDisp: Q_MGR QCount: 12 Count Elapsed CPU Susp Elp JnlWrt Elp PS Req's PS Rd Elp Expired Page Skip Msgs Skip _________ _________ _________ _________ __________ _________ _________ _________ _________ _________ OPEN 1.0 0.000527 0.000172 CLOSE 1.0 0.000056 0.000046 GET 66.8 0.004780 0.000188 0.004566 0.008849 0.0 0.000000 0.0 0.1 0.0 BRW ANY 8.3 DES ANY 58.4 PUT 58.3 0.000169 0.000139 0.000000 0.000000 0.0 0.000000 0.0 0.0 0.0 GET Avg Bytes 11375.0 Avg #GET w/Data 66.7 Min Msg Size 40 Max Msg Size 1,400 PUT Avg Bytes 11041.7 Avg #PUT w/Data 58.3 Min Msg Size 40 Max Msg Size 1,400 SSID: MQFI APPLID: SCSCLSA5 Tran: MVGT Threads: 8
Other Avg Count 1.0 Avg Elapsed 0.000176 Avg CPU 0.000072 Avg #Old Pages 289.4 Avg #New Pages 0.0 SSID: MQFI APPLID: SCSCLSA5 Tran: MVPT Threads: 4 Other Avg Count 1.0 Avg Elapsed 0.031832 Avg CPU 0.000100 Avg #Old Pages 455.0 Avg #New Pages 26.5
Chapter 8. WebSphere MQ 215

8.5.3 Performance List reportThe CICS PA MQ reports give CICS task numbers. With this information we can list the corresponding CICS transaction information and look for the CICS resources that were used by these transactions. In our case, we can use a CICS PA List report to see the temporary storage usage of the MQ sample transactions.
We created a new report form that contains the fields that we were interested in for the analysis of the MVPT and MVGT transactions. This report form in Figure 8-12 shows that we selected to have the TIME and COUNT values of the RMIMQM field. It also shows that we moved the field that contains the number of TS requests to auxiliary storage before the end of report indicator.
Figure 8-12 Report form to analyze the CICS part of the MQ transactions
In the MQ Report Set, we deactivated the WebSphere MQ Subsystem report and selected the List Performance report. The same way as we did for the WebSphere MQ report, we selected to have a report only for the transactions with an ID starting with MV.
Figure 8-13 shows the report that we obtained. The RMI MQ time field gives an approximation of how long the tasks were in the RMI for executing the MQ calls. This is not exactly the suspend time as some RMI code is executed before the MQ timer starts. This means that the RMI MQ time contains a small part of dispatch time plus suspend time.
We made the following observations:
� The RMI count for MVPT transactions is three more than the number of PUT requests. This is due to issuing three MQ API calls for OPEN, CLOSE, and sync point. For the MVGT transactions, it is two more than the number of GET requests, because no sync point is issued.
� For task 66, we know that the application was to read up to 102 messages from the queue. One hundred were read successfully and message 101 gave reason code 2033 for no
File Edit Confirm Upgrade Options Help ------------------------------------------------------------------------------ EDIT LIST Report Form - MQ Row 1 of 263 More: > Command ===> Scroll ===> CSR Description . . . List Report Form Version (VRM): 620 Selection Criteria: Performance
Field / Name + Type Description TRAN Transaction identifier PROGRAM Program name TASKNO Transaction identification number STOP TIMET Task stop time RESPONSE Transaction response time DISPATCH TIME Dispatch time CPU TIME CPU time SUSPEND TIME Suspend time RMIMQM TIME RMI elapsed time for WebSphere MQ requests RMIMQM COUNT RMI elapsed time for WebSphere MQ requests TSPUTAUX Auxiliary TS PUT requests
TSTOTAL TS Total requests EOR ---------------- End of Report ----------------
216 CICS Performance Analyzer

messages available. Task 66 entered the RMI once more than the other MVGT tasks which successfully read their requested 100 messages.
� The TSPUTAux column shows that each message read was written to auxiliary temporary storage. The additional TS request that appears in TS Total is a DELETEQ TS.
Figure 8-13 Performance List report for MVPT and MVGT
Tip: We showed how to relate CICS SMF record information to MQ information based on transaction IDs. This was easy to do since we were looking at a limited number of transactions. This can be less evident when recording over long intervals where multiple different transactions can have the same task number. In this case, we recommend that you also compare the time stamp of both records.
V1R3M0 CICS Performance Analyzer Performance List __________________________________________________ LIST0001 Printed at 20:28:54 10/17/2003 Data from 11:45:55 10/17/2003 APPLID SCSCLSA5 Page 1 CICS records for MQ transactions Tran Program TaskNo Stop Response Dispatch User CPU Suspend RMI MQ RMI MQ TSPUTAux TS Total Time Time Time Time Time Time Count MVPT CSQ4CVK1 55 11:45:55.528 .2709 .1018 .0583 .1691 .2298 503 0 0 MVPT CSQ4CVK1 56 11:46:41.391 .0711 .0197 .0126 .0514 .0678 103 0 0 MVGT CSQ4CVJ1 57 11:47:06.382 .1015 .0715 .0255 .0300 .0511 102 100 100 MVGT CSQ4CVJ1 58 11:47:19.693 1.0679 .0310 .0232 1.0369 1.0579 102 100 101 MVPT CSQ4CVK1 59 11:47:54.551 .0420 .0077 .0063 .0343 .0404 53 0 0 MVPT CSQ4CVK1 60 11:48:23.833 .0834 .0081 .0067 .0753 .0814 53 0 0 MVGT CSQ4CVJ1 61 11:48:46.674 .6047 .0270 .0226 .5777 .5966 102 100 101 MVGT CSQ4CVJ1 62 11:48:53.582 .5172 .0287 .0229 .4884 .5086 102 100 101 MVGT CSQ4CVJ1 63 11:48:59.141 .6645 .0279 .0231 .6366 .6566 102 100 101 MVGT CSQ4CVJ1 64 11:49:05.953 .6142 .0273 .0229 .5868 .6066 102 100 101 MVGT CSQ4CVJ1 65 11:49:11.901 .0747 .0263 .0222 .0484 .0458 102 100 101 MVGT CSQ4CVJ1 66 11:49:19.852 .6289 .0320 .0245 .5969 .5757 103 100 101
Chapter 8. WebSphere MQ 217

8.5.4 Transaction Resource Usage Temporary Storage reportWe also asked for a summary of the Temporary Storage usage of our transactions. To do so, we selected Temporary Storage Usage Summary in the category Transaction Resource Usage Reports as shown in Figure 8-14.
Figure 8-14 Selecting Temporary Storage Usage Summary
File Systems Confirm Options Help ------------------------------------------------------------------------------ EDIT Report Set - MQ Row 1 of 14
Command ===> Scroll ===> CSR Description . . . CICS PA Report Set Enter "/" to select action. ** Reports ** Active + Options No + Selection Criteria No + Performance Reports No + Exception Reports No - Transaction Resource Usage Reports No File Usage Summary No s Temporary Storage Usage Summary No Transaction Resource Usage List No - Subsystem Reports No DB2 No WebSphere MQ No + System Reports No + Performance Graphs No + Extracts No ** End of Reports **
218 CICS Performance Analyzer

Two reports can be requested. We first asked for the Transaction Temporary Storage Usage report that summarizes Temporary Storage usage by transaction ID. Figure 8-15 shows the Temporary Storage Summary Report where we selected the Transaction Temporary Storage Usage report.
Figure 8-15 Selecting Transaction Temporary Storage Usage
File Systems Options Help ------------------------------------------------------------------------------
MQ - Temporary Storage Summary Report Command ===> System Selection: Report Output: APPLID . . + DDname . . . . . . . . . TEMP0001 Image . . + Print Lines per Page . . (1-255) Group . . + Summary Reports Required: / Transaction Temporary Storage Usage Temporary Storage Usage Break down by Transaction ID Include Transaction Totals Report Format: Title . .
Selection Criteria: Performance
Chapter 8. WebSphere MQ 219

Notice that there is no asterisk after the Performance selection Criteria. Indeed, we removed the selection for having only those transaction codes that end on MV. We expected not to see much Temporary Storage activity on this system. We simply wanted to see if there were other users of TS. The report is shown in Figure 8-16.
This report shows that two CICS transactions were also using Temporary Storage. The user transaction that we find in the list is MVGT. For the MVGT tasks, we see a breakdown that contains the TS queue name which is also MVGT. The queue name for the CICS transactions is not available because the TS requests are not done via an EXEC CICS command.
Figure 8-16 Transaction Temporary Storage Usage Summary report
We also requested for a Temporary Storage Usage report, shown in Figure 8-17.
Figure 8-17 Temporary Storage Usage Summary report
Since only one Temporary Storage queue was name found, we received a summary for the MVGT queue. This report is a combination or the two parts of the previous report.
V1R3M0 CICS Performance Analyzer Transaction Temporary Storage Usage Summary __________________________________________________ TEMP0001 Printed at 17:28:30 10/17/2003 Data from 11:47:06 10/17/2003 to 11:49:38 10/17/2003 APPLID SCSCLSA5 Page 1 ************* TS Calls ************* *** I/O Waits *** Tran #Tasks Get Put_Aux Put_Main Total TS Shr_TS ---- ------- --------- -------- -------- -------- -------- -------- CEMT 1 Elapse Avg .0000 .0000 Max .0000 .0000 Count Avg 0 1 0 1 0 0 Max 0 1 0 1 0 0 ************* TS Calls ************* *** I/O Waits *** Tran #Tasks Get Put_Aux Put_Main Total TS Shr_TS ---- ------- --------- -------- -------- -------- -------- -------- CESD 1 Elapse Avg .0000 .0000 Max .0000 .0000 Count Avg 1 1 0 2 0 0 Max 1 1 0 2 0 0
************* TS Calls ************* *** I/O Waits *** Tran #Tasks Get Put_Aux Put_Main Total TS Shr_TS ---- ------- --------- -------- -------- -------- -------- -------- MVGT 8 Elapse Avg .0096 .0000 Max .0000 .0000 Count Avg 0 100 0 100 5 0 Max 0 100 0 101 42 0 ************** TS Calls *********** *** I/O Waits *** ******** TS Item ********* TSQueue #Tasks Get Put_Aux Put_Main Total TS Shr_TS Get Put_Aux Put_Main ---------------- ------- -------- -------- -------- -------- -------- -------- -------- -------- -------- MVGT 8 Elapse Avg .0000 .0112 .0000 .0113 .0096 .0000 Max .0000 .0472 .0000 .0472 .0442 .0000 Count Avg 0 100 0 100 5 0 0 19462 0 Max 0 100 0 101 24 0 Length 0 74900 0
V1R3M0 CICS Performance Analyzer Temporary Storage Usage Summary __________________________________________________ TEMP0001 Printed at 12:03:27 10/17/2003 Data from 11:47:06 10/17/2003 to 11:49:19 10/17/2003 APPLID SCSCLSA5 Page 2 ************* TS Calls ************ *** I/O Waits *** ******** TS Item ********* TSQueue Tran #Tasks Get Put_Aux Put_Main Total TS Shr_TS Get Put_Aux Put_Main ---------------- ---- ------- -------- -------- -------- -------- -------- -------- -------- -------- -------- MVGT MVGT 8 Elapse Avg .0000 .0112 .0000 .0113 .0096 .0000 Max .0000 .0472 .0000 .0472 .0442 .0000 Count Avg 0 100 0 100 5 0 0 19462 0 Max 0 100 0 101 24 0 Length 0 74900 0
220 CICS Performance Analyzer

8.6 ConclusionThis chapter showed how easily you can produce list and summary reports by using the new MQ feature in CICS PA 1.3. Using two MQ sample provided transactions, we showed how you can interpret information about MQ API calls in these reports. CICS PA brings an added value to the MQ SMF accounting record by calculating average values and providing this information in the summary report.
We also showed how you can link a performance list report to the MQ reports. This report showed the RMI MQ field that is available in CICS TS 2.2 and that is supported by CICS PA.
Chapter 8. WebSphere MQ 221

222 CICS Performance Analyzer
Chapter 9. CICS and MVS System Logger
This chapter describe the interface between CICS Transaction Server (TS) and the MVS System Logger. It also introduces the System Logger reports that you can generate using CICS Performance Analyzer (PA).
9
Note: This scenario was used to provide a situation that allowed us to demonstrate the use of CICS PA System Logger reports. The CICS regions were not necessarily tuned for peak performance. In some cases, they had a high level of tracing active. Therefore, these scenarios and the results provided are for demonstration only. They do not provide definitive results for a customer environment.
© Copyright IBM Corp. 2003. All rights reserved. 223
9.1 CICS TS and the MVS System LoggerCICS uses the MVS System Logger for all its logging and journaling requirements. The CICS system log is used for:
� Dynamic transaction backout
� Warm and emergency restarts
� Cold starts, but only if the log contains information required for resynchronizing in-doubt units of work
� Forward recovery logs, auto-journals, and user journals
The MVS System Logger provides a programming interface to access records on a log stream.
Three hardware options are available that CICS can use:
� Non-volatile coupling facility, where logstream data is duplexed in the MVS logger data space
� Volatile coupling facility, where logstream data is duplexed to a staging data set
� Direct access storage device (DASD)-only, where logstream data is duplexed in the z/OS logger data space
Coupling facility and DASD-only log streamsEach log stream is a sequence of blocks of user data that the MVS System Logger internally partitions over three types of storage:
� Primary storage
This is a structure within a coupling facility that holds the most recent records written to the log stream. Log data written to the coupling facility is also copied to either a data space or a staging data set.
For DASD-only log streams, a log structure is not available. The primary medium for DASD-only logging is the staging data set. Log data written to a DASD-only log stream is held in a data space and in a staging data set. A staging data set must be defined.
� Secondary storage
When the primary storage structure for a log stream becomes full, the older records automatically spill into secondary storage, which consists of data sets managed by SMS. This process is known as DASD offloading. The allocation of new logger data sets for DASD offloading is known as a DASD shift. For DASD-only logging, the primary storage is the staging data set. Therefore, if the staging data set fills, offloading is done in the same way as for coupling facility logging. After data is offloaded, it is still available to the MVS System Logger.
� Tertiary storage
This storage is used as specified in your HSM policy, by which older records are migrated to some form of archive storage. This archive storage can be either DASD data sets or tape volumes.
Log data is considered “hardened” when it is written to both the coupling facility log structure and a buffer held in a data space (or to staging data sets). MVS keeps the second copy of the data for recovery in the event of a structure failure. A staging data set is always used for DASD-only logging.
Figure 9-1 shows the components of a DASD-only system.
224 CICS Performance Analyzer

Figure 9-1 DASD-only logging
DASD-only log streams do not use the coupling facility storage. For DASD-only log streams, the log blocks span storage buffers and DASD log data sets. A DASD-only log stream has a single-system scope. Only one system at a time can connect to a DASD-only log stream. Multiple applications from the same system can, however, simultaneously connect to a DASD-only log stream. When a System Logger application writes a log block to a DASD-only log stream, the System Logger writes it first to the local storage buffers for the system and then automatically duplexes it to a DASD staging data set associated with the log stream.
If the staging data set fills up to its defined HIGHOFFLOAD value, the System Logger begins the offload process. As a log stream fills offload data sets on DASD, the System Logger automatically allocates a new offload data set for the log stream.
When you size the log stream for use of CICS logger (DFHLOG), it is important to minimize the amount of data that is offloaded to secondary storage. The logger begins the offload process when the high offload threshold (HIGHOFFLOAD) of the log stream is reached. The offload process consists of two steps:
1. The z/OS logger physically deletes the data in the log stream that is logically marked for deletion by the CICS log-tail deletion process. This happens at activity keypoint time.
2. The z/OS logger calculates how much data must be offloaded to secondary storage, based on the difference between HIGHOFFLOAD and LOWOFFLOAD, less the amount of data that has been deleted since the last offload event. It may happen that an offload does not occur at all. This is possible when we fall below the LOWOFFLOAD value.
The CICS system log is implemented as two MVS System Logger log streams. One log stream is the primary system log stream, DFHLOG, which holds data for most normal (short-lived) in-flight units of work (UOWs). The other log stream is the secondary system log
Primary Storage
Secondary Storage
CurrentDataSet
LSN1
FullDataSet
Tertiary Storage
DFHSMStorage
DataSpace
System Logger
StagingData Set
Chapter 9. CICS and MVS System Logger 225

stream, DFHSHUNT, which holds information for UOWs that are not short-lived. These typically are UOWs that cannot complete because of backout failures, or because they are designed as long-running tasks that issue infrequent syncpoints.
9.2 CICS PA reporting on the System LoggerCICS PA processes System Logger (SMF 88) records to provide information about the System Logger log streams and coupling facility structures that are used by CICS Transaction Server for logging, recovery, and backout operations. The report can help to measure the effects of tuning changes and identify log stream or coupling facility structure performance problems.
The System Logger List report shows information about logstream writes, deletes, and events, as well as Structure Alter events for each SMF recording interval. The System Logger Summary report summarizes logstream and structure statistics so you can measure the System Logger performance over a longer period of time. These reports, when used in conjunction with the CICS logger reports produced from the standard CICS statistics reporting utilities, provide a comprehensive analysis of the logstream activity for all your CICS systems.
9.3 Scenario descriptionThe System Logger scenario looks at several CICS and System Logger parameters that can be tuned. It uses the CICS PA System Logger reports to show the way these parameters effect the System Logger.
For this scenario, we work with the CICS system log, DFHLOG, defined to the MVS System Logger as DASD-only. The CICS region we used for this scenario was at the CICS TS V1.3 level.
We use the CICS PA logger report function to produce reports of the logger activity, and then use the reports to help tune the logger system to perform more efficiently. To provide the System Logger SMF records, we use the same application that we used in the VSAM scenario. Again this application uses TPNS to generate its workload. Refer to Chapter 6, “VSAM application performance analysis and Transaction Resource Monitoring support” on page 139, for a description of our VSAM scenario.
Note that we are using a test CICS environment. As such, the figures and results we deal with are only there to show the use of the CICS PA System Logger reports.
We use the SMF (Type 88) records and the CICS PA reports to monitor the effect that several parameters have on the way the log stream for DFHLOG is effected when they are changed. We look at the SIT parameter AKPFREQ, and the logstream definition parameters LS_SIZE (logstream offload data set size), STG_SIZE (Staging data set size), and LOWOFFLOAD.
To minimize the amount of data offloaded from DFHLOG, you must:
1. Define a suitably-sized staging data set.
2. Ensure that the log-tail deletion process is working effectively.
CICS log manager controls the size of the system log stream by regularly deleting the oldest completed unit of work records. This operation is associated with activity keypoints. It is important, therefore, that you choose the correct activity keypoint frequency (AKPFREQ), that is, one that allows CICS to keep the system log down to a reasonable
226 CICS Performance Analyzer

size. If a system log stream exceeds the primary storage space allocated, it spills onto the secondary storage. The resulting I/O activity can adversely affect system performance. If the interval between activity keypoints is long, the volume of data could affect restart times. In general, an activity keypoint interval should be longer than the elapsed time of most transactions. The log tail is the oldest end of the log. At each activity keypoint, the CICS recovery manager requests the log manager to delete the tail of the system log.
Avoid “staging-data-set-full” events. A staging-data-set-full event occurs when a log stream’s staging data set becomes full before offloading of the data has completed.
Offloading is the movement of log data from the primary storage to the offload data sets. The size of the offload data sets needs to be reviewed. The offload data sets should be large enough to avoid too many DASD shifts.
For the CICS system log, the best performance is achieved when CICS can delete log-tail data that is no longer needed before it is written to secondary storage by the MVS System Logger. To monitor that this is being achieved, we need to examine the numbers in the CICS PA fields Count with DASD Write and Count without DASD Write.
These deletion values indicate:
� Count without DASD Write: Data was deleted from primary storage without first being written to DASD offload data sets. For a system log stream, this value should be high in relation to the value of “No. with DASD Write”.
� Count with DASD Write: Data was deleted from primary storage after being written to DASD offload data sets. For a system log stream, this value should be low in relation to the value in “No. without DASD Write”.
9.4 Scenario runWe started by defining the DASD-only log streams for DFHLOG. To do this, we used the MVS utility IXCMIAPU. The name we chose, CICSTS.SCSCPAA1.DFHLOG, matched the name we defined to the CICS system through the stream name in the JOURNALMODEL definition (see Figure 9-2).
Figure 9-2 JOURNALMODEL definition
Example 9-1 shows the initial definition used for the log stream. This definition uses a number of default values.
OVERTYPE TO MODIFY CICS RELEASE = 0530 CEDA ALter Journalmodel( DFHLOG ) Journalmodel : DFHLOG Group : LOGTEST Description ==> Journalname ==> DFHLOG Type ==> Mvs Mvs | Smf | Dummy Streamname ==> CICSTS.SCSCPAA1.DFHLOG SYSID=PAA1 APPLID=SCSCPAA1 PF 1 HELP 2 COM 3 END 6 CRSR 7 SBH 8 SFH 9 MSG 10 SB 11 SF 12 CNCL
Chapter 9. CICS and MVS System Logger 227

Example 9-1 Definition of a DASD-only log stream
//MSLDEFIN EXEC PGM=IXCMIAPU //SYSPRINT DD SYSOUT=*,DCB=RECFM=FBA //SYSIN DD *
DATA TYPE(LOGR) REPORT(NO) DEFINE LOGSTREAM NAME(CICSTS.SCSCPAA1.DFHLOG) DASDONLY(YES) MAXBUFSIZE(64000) STG_SIZE(3000) LS_SIZE(50) OFFLOADRECALL(NO) LOWOFFLOAD(20) HIGHOFFLOAD(80) /*
For this exercise, we used values for the logger options as recommended by the CICS TS manuals. In the case of LOWOFFLOAD and STG_SIZE, the initial calculation is provided after running the DFHLSCU utility or using the formulae available in the CICS manuals. The LS_SIZE should be large enough so that each data set can contain multiple offloads of the primary storage.
The execution of the job in Example 9-1 resulted in the logstream definition shown in Example 9-2, which shows all the parameters and their values.
Example 9-2 Log stream defined
LOGSTREAM NAME(CICSTS.SCSCPAA1.DFHLOG) STRUCTNAME() LS_DATACLAS() LS_MGMTCLAS() LS_STORCLAS() HLQ(IXGLOGR) MODEL(NO) LS_SIZE(50) STG_MGMTCLAS() STG_STORCLAS() STG_DATACLAS() STG_SIZE(3000) LOWOFFLOAD(20) HIGHOFFLOAD(80) STG_DUPLEX(YES) DUPLEXMODE(UNCOND) RMNAME() DESCRIPTION() RETPD(0) AUTODELETE(NO) OFFLOADRECALL(NO) DASDONLY(YES) DIAG(NO) LOGGERDUPLEX() EHLQ(NO_EHLQ) MAXBUFSIZE(64000)
For the first run, we used the SIT parameter values of:
� AKPFREQ = 4000� LGDFINT = 30
These are the default values for CICS TS V1.3.
We used TPNS to run the VSAM application to create a workload on the CICS region and then used CICS PA and its Logger reports to monitor the logger SMF records. For each test run, we ran the workload for 20 minutes. Each report was run for a 15 minute period taken from the middle of the 20 minute run.
To work with the System Logger records, we added the Logger System to CICS PA (Figure 9-3). We specified new sc66logr to add the Logger System to the CICS PA System Definitions. Here we added the Logger System manually. We could have used the Take-up facility as we did in other chapters in this book.
228 CICS Performance Analyzer

Figure 9-3 System Definitions screen
Figure 9-4 shows that we added the SMF data set containing the Logger SMF records.
Figure 9-4 Adding the SMF data set
Here we used SMFDATA.ALLRECS.G8525V00 for the SMF records.
Next, we needed to define a CICS PA Report Set so that we could report on the Logger usage. This was done in the CICS PA Report Set screen (Figure 9-5), where we defined a new Report Set called logreps.
Figure 9-5 New Report Set
File Edit Filter View Options Help ------------------------------------------------------------------------------ System Definitions Row 1 from 7 Command ===> new sc66logr Scroll ===> CSR Select a System to edit its definition, SMF Files and Groups. SMF Files / System Type Image Description System SC66 Image System added by take-up SC66
SCSCPJA6 CICS SC66 System added by take-up SCSCPJA6 D7Q2 DB2 SC66 System added by take-up D7Q2 SCSCPTA2 CICS SC66 System added by take-up SC66 SCSCPJA7 CICS SC66 System added by take-up SCSCPJA7 SCSCPTA1 CICS SC66 System added by take-up SC66 SCSCPAA1 CICS SC66 System added by take-up SC66
---------------------------- System Definitions ----------------------------- File Edit View Options Help -------------------------------------------------------------------------- System Logger Row 1 of 1 More: > Command ===> Scroll ===> CSR System Logger definition: Logger . . . . . SC66LOGR MVS Image . . . Description . . . / Exc SMF Data Set Name + UNIT + SEQ VOLSER + 'SMFDATA.ALLRECS.G8525V00' ********************************* End of list *****************************
File Systems Confirm Options Help ------------------------------------------------------------------------------ Report Sets Row 1 to 5 of 5 Command ===> new logreps Scroll ===> CSR Report Sets Data Set . . : CICSLS5.CICSPA.RSET / Name Description Changed ID
DB2REPS CICS PA Report Set 2003/10/14 12:00 CICSLS5 DB2REP2 CICS PA Report Set 2003/10/15 13:35 CICSLS5 REPORT1 CICS PA Report Set 2003/10/15 17:37 CICSLS5 REPORT2 CICS PA Report Set 2003/10/10 14:28 CICSLS5 REPORT3 CICS PA Report Set 2003/10/11 17:09 CICSLS5
Chapter 9. CICS and MVS System Logger 229

We then changed the Global Options screen to add the Logger system about which we wished to run reports. Figure 9-6 shows the Global Options screen.
Figure 9-6 Global Options screen
We then went into the System Logger part of the Report Set so that we could configure it as shown in Figure 9-7.
Figure 9-7 System Logger
We then requested the Summary Report for the log stream CICSTS.SCSCPAA1.DFHLOG as shown in Figure 9-8.
File Systems Options Help ------------------------------------------------------------------------------ LOGREPS - Global Options Command ===> System Selection: CICS APPLID . . + Image . . + Group . . + DB2 SSID . . . + Image . . + Group . . + MQ SSID . . . . + Image . . + Group . . + Logger . . . . sc66logr + Image . . + Group . . + Report Formatting Options: Print Lines per Page . . 60 (1-255) Time Zone . . . . . . . (Blank for system default or -12 to +12 hours) Date Delimiter . . . . . / Time Delimiter . . . . . :
File Systems Confirm Options Help ------------------------------------------------------------------------------ EDIT Report Set - LOGREPS Row 1 of 13 Command ===> Scroll ===> CSR Description . . . CICS PA Report Set Enter "/" to select action. ** Reports ** Active - Options No Global No + Selection Criteria No + Performance Reports No + Exception Reports No + Transaction Resource Usage Reports No - Subsystem Reports No DB2 No WebSphere MQ No - System Reports No s System Logger No + Performance Graphs No + Extracts No ** End of Reports **
230 CICS Performance Analyzer

Figure 9-8 Request Summary Logger report
We then entered line action RUN on the Report Set as shown in Figure 9-9. When pressing Enter, another screen opened which gave the chance to change some of the options, such as to Logger System or the data and time for selection. After we created the Report Set to produce the data in the form we required, on any subsequent test when the SMF data is located in a different SMF data set, we added the SMF data set to the system definition on the System Definition screen.
Figure 9-9 Run the Report Set
Example 9-3 shows the CICS PA parameters generated by the options we set. Note that we are selecting the log stream that is of interest to us.
Example 9-3 CICS PA parameters generated
* Report Set =LOGREPS * Description=CICS PA Report Set * Reports for System=SC66LOGR
File Systems Options Help ------------------------------------------------------------------------------ LOGREPS - System Logger Report Command ===> System Selection: Report Output: Logger . . + DDname . . . LOGR0001 Image . . + Group . . + Reports Required: Report Options: / Summary 1 1. Sort by Logstream Name List Include ALTER records 2. Sort by Structure Name Sort by Time SMF Recording Interval . . (mins) Report Filter: Logstream Name . . . CICSTS.SCSCPAA1.DFHLOG Structure Name . . . Report Format: Title . . CICS PA system Logger Report
File Systems Confirm Options Help ------------------------------------------------------------------------------ Report Sets Row 1 to 6 of 6 Command ===> Scroll ===> CSR Report Sets Data Set . . : CICSLS5.CICSPA.RSET / Name Description Changed ID
DB2REPS CICS PA Report Set 2003/10/14 12:00 CICSLS5 DB2REP2 CICS PA Report Set 2003/10/15 13:35 CICSLS5 run LOGREPS CICS PA Report Set 2003/10/16 16:17 CICSLS5
REPORT1 CICS PA Report Set 2003/10/15 17:37 CICSLS5 REPORT2 CICS PA Report Set 2003/10/10 14:28 CICSLS5 REPORT3 CICS PA Report Set 2003/10/11 17:09 CICSLS5
Chapter 9. CICS and MVS System Logger 231

CICSPA IN(SMFIN001), NOAPPLID, LINECNT(60), FORMAT(':','/'), LOGGER(OUTPUT(LOGR0001), EXTERNAL(CPAXW001), SUMMARY, SORT(LOGSTREAM), LOGSTREAM('CICSTS.SCSCPAA1.DFHLOG'), TITLE1( 'CICS PA System Logger Report '))
Figure 9-10 shows part of the listing that was produced.
Figure 9-10 System Logger Logstream Summary report
The fields that we concentrated on in the listing were, under DELETIONS:
� Count With DASD Write: The number of deletes from interim storage written to DASD
� Count Without DASD Write: The number of deletes from interim storage without having been written to the log data set
Under EVENTS, the fields were:
� Offloads: The number of times the log stream was offloaded.
� Staging Thresholds: The number of times the System Logger detected a Staging Data Set Threshold Hit condition (HIGHOFFLOAD reached) for the staging data set.
V1R3M0 CICS Performance Analyzer System Logger - Logstream Summary __________________________________________________ LOGR0001 Printed at 18:06:24 10/21/2003 Data from 17:45:00:20 10/21/2003 to 17:55:00:01 10/21/2003 Page 1 CICS PA System Logger Report Logstream name MVSID Structure name First interval start Last interval stop Total Interval CICSTS.SCSCPAA1.DFHLOG SC66 *DASDONLY* 17:40:00.00 10/21/2003 17:55:00.00 10/21/2003 0000:15:00 ----------- IXGWRITES ---------- ---------------- DELETIONS ----------------- Bytes Count Count Bytes Bytes Writn to With Without After Int Stor Total Average Interim DASD DASD Offload w/o DASD Count Bytes Bytes Storage Write Write w. DASD Write -------- -------- -------- -------- -------- -------- -------- -------- Total 22980 12669K 551 94183K 13035 10159 53441K 41615K Rate(/Sec) 25 14077 104648 14 11 59378 46239 Minimum 7517 4067508 30798K 2586 2963 10596K 12141K Maximum 7758 4325606 31797K 6093 4107 24982K 16822K ------------------------------------------ EVENTS ------------------------------------------ Demand Demand Staging DASD Block Staging Entry Struct Init'd Offloads Threshld Shifts Length Full Full Full Offloads -------- -------- -------- -------- -------- -------- -------- -------- Total 11 1458 39 0 0 0 0 Rate(/Sec) 0 1 0 0 0 0 0 Minimum 3 0 7 116 0 0 0 0 Maximum 4 0 17 9238 0 0 0 0 ----------------------- EVENTS ------------------------- --------------- DASD Writes ---------------- Struct Struct Rebuilds Rebuilds Total Type1 Type2 Type3 Init'd Complt'd Count Bytes Average Waits -------- -------- -------- -------- -------- -------- -------- -------- -------- Total 0 0 0 0 0 48 8967457 0 0 Rate(/Sec) 0 0 0 0 0 0 9964 0 Minimum 0 0 0 0 0 9 1786582 0 Maximum 0 0 0 0 0 21 3929235 0
232 CICS Performance Analyzer

� Demand DASD Shifts: The number of logstream DASD shifts (additional log data set allocates) initiated by this system. For DFHLOG and DFHSHUNT, this value should be small. Otherwise too much data is being offloaded. (You must check the LS_SIZE parameter for the logstream definition.)
Under DASD Writes, the field is:
� Waits: The number of times the System Logger had to suspend processing before writing to DASD because a previous DASD write request has not completed.
We had 39 DASD shifts. Frequent DASD shifts have a negative effect on performance and expose the system to a depletion of the offload data sets. The number of offload data sets is limited by the logger DSEXTENT value. In an effort to decrease the number of DASD shifts, we redefined the DFHLOG, now with an LS_SIZE of 500. Increasing the LS_SIZE and so the size of the logstream DASD data set should reduce the number of DASD shifts as the logstream data set should now be able to contain more data before it needs to be offloaded. Example 9-4 shows the new logstream definition.
Example 9-4 Specifying LS_SIZE
//MSLDEFIN EXEC PGM=IXCMIAPU //SYSPRINT DD SYSOUT=*,DCB=RECFM=FBA //SYSIN DD * DATA TYPE(LOGR) REPORT(NO) DEFINE LOGSTREAM NAME(CICSTS.SCSCPAA1.DFHLOG) DASDONLY(YES) MAXBUFSIZE(64000) STG_SIZE(3000) OFFLOADRECALL(NO) LS_SIZE(500) LOWOFFLOAD(20) HIGHOFFLOAD(80)
Chapter 9. CICS and MVS System Logger 233

Figure 9-11 shows the results from the next run of the workload. This change improved the values for Offloads, Staging Threshold and DASD shifts. We then concentrated on just the Staging Threshold. The Staging Threshold indicates the number of times we hit the HIGHOFFLOAD value. In an attempt to reduce this number, we changed the SIT value AKPFREQ to 200. A lower AKPFREQ should mean that we carry out log-tail deletion more often and as such do not hit the HIGHOFFLOAD value as often.
Figure 9-11 System Logger Logstream Summary report
V1R3M0 CICS Performance Analyzer System Logger - Logstream Summary __________________________________________________ LOGR0001 Printed at 18:46:53 10/21/2003 Data from 18:25:00:00 10/21/2003 to 18:35:00:01 10/21/2003 Page 1 CICS PA System Logger Report Logstream name MVSID Structure name First interval start Last interval stop Total Interval CICSTS.SCSCPAA1.DFHLOG SC66 *DASDONLY* 18:20:00.00 10/21/2003 18:35:00.00 10/21/2003 0000:15:00 ----------- IXGWRITES ---------- ---------------- DELETIONS ----------------- Bytes Count Count Bytes Bytes Writn to With Without After Int Stor Total Average Interim DASD DASD Offload w/o DASD Count Bytes Bytes Storage Write Write w. DASD Write -------- -------- -------- -------- -------- -------- -------- -------- Total 18589 10425K 561 76198K 10452 6025 42856K 24682K Rate(/Sec) 20 11583 84664 11 6 47618 27425 Minimum 2312 1241038 9469952 0 0 0 0 Maximum 8141 4607370 33374K 7027 3896 28811K 15962K ------------------------------------------ EVENTS ------------------------------------------
Demand Demand Staging DASD Block Staging Entry Struct Init'd Offloads Threshld Shifts Length Full Full Full Offloads -------- -------- -------- -------- -------- -------- -------- -------- Total 9 33 4 0 0 0 0 Rate(/Sec) 0 0 0 0 0 0 0 Minimum 0 0 0 116 0 0 0 0 Maximum 5 0 2 10363 0 0 0 0 ----------------------- EVENTS ------------------------- --------------- DASD Writes ---------------- Struct Struct Rebuilds Rebuilds Total Type1 Type2 Type3 Init'd Complt'd Count Bytes Average Waits -------- -------- -------- -------- -------- -------- -------- -------- -------- Total 0 0 0 0 0 28 6735633 0 15 Rate(/Sec) 0 0 0 0 0 0 7484 0 Minimum 0 0 0 0 0 0 0 0 Maximum 0 0 0 0 0 16 4537666 9
234 CICS Performance Analyzer

Figure 9-12 shows the result of the change. This change reduced the number of Staging Threshold hits and also reduced the number of offloads and the number of DASD shifts (reduced it to 0). The largest change it made was to the number of deletions after DASD writes; this also has been reduced to 0. We then redefined the DFHLOG with a larger STG_SIZE of 9000 to try and reduce the number of offloads still further. The STG_SIZE specifies how large to make the staging data set. Making the staging data set larger decreases the number of times an offload needs to happen.
Figure 9-12 System Logger Logstream Summary report
V1R3M0 CICS Performance Analyzer System Logger - Logstream Summary __________________________________________________ LOGR0001 Printed at 19:29:42 10/21/2003 Data from 19:10:00:26 10/21/2003 to 19:20:00:23 10/21/2003 Page 1CICS PA System Logger Report Logstream name MVSID Structure name First interval start Last interval stop Total Interval CICSTS.SCSCPAA1.DFHLOG SC66 *DASDONLY* 19:05:00.00 10/21/2003 19:20:00.00 10/21/2003 0000:15:00 ----------- IXGWRITES ---------- ---------------- DELETIONS ----------------- Bytes Count Count Bytes Bytes Writn to With Without After Int Stor Total Average Interim DASD DASD Offload w/o DASD Count Bytes Bytes Storage Write Write w. DASD Write -------- -------- -------- -------- -------- -------- -------- -------- Total 22180 16218K 731 93802K 0 22331 0 94233K Rate(/Sec) 24 18021 104225 0 24 0 104703 Minimum 5939 4316290 24982K 0 6581 0 28209K Maximum 8160 5975569 34570K 0 8808 0 37208K ------------------------------------------ EVENTS ------------------------------------------
Demand Demand Staging DASD Block Staging Entry Struct Init'd Offloads Threshld Shifts Length Full Full Full Offloads -------- -------- -------- -------- -------- -------- -------- -------- Total 10 10 0 0 0 0 0 Rate(/Sec) 0 0 0 0 0 0 0 Minimum 3 0 0 116 0 0 0 0 Maximum 4 0 0 22124 0 0 0 0 ----------------------- EVENTS ------------------------- --------------- DASD Writes ---------------- Struct Struct Rebuilds Rebuilds Total Type1 Type2 Type3 Init'd Complt'd Count Bytes Average Waits -------- -------- -------- -------- -------- -------- -------- -------- -------- Total 0 0 0 0 0 0 0 0 0 Rate(/Sec) 0 0 0 0 0 0 0 0 Minimum 0 0 0 0 0 0 0 0 Maximum 0 0 0 0 0 0 0 0
Chapter 9. CICS and MVS System Logger 235

We ran the test transaction again and then viewed the CICS PA System Logger Summary report shown in Figure 9-13. Here you see that we reduced the number of offloads and the staging threshold.
Figure 9-13 System Logger Logstream Summary report
We redefined the system log with a LOWOFFLOAD value of 40%. The test we ran showed that we had two offloads in a 15 minute period. IBM recommends that you try to limit the number of offloads to not more than one an hour.
DFHLSCU recommends a value of 40% for the LOWOFFLOAD value for DFHLOG. However in practice, we have seen that a value between 40% and 60% is a good value. This needs to be reviewed, since too low an offload value may result in physical offloading of log data from primary to secondary storage, after the System Logger offload process completes the physical deletion of any unwanted log data during offload processing. However, a value that is too high may mean that subsequent offload processing occurs more frequently, since less space is freed up from primary storage during an offload operation.
The LOWOFFLOAD value should be greater than the space required for the sum of: the system log data generated during one complete activity keypoint interval plus the system log data generated (between syncpoints) by the longest-running transaction.
V1R3M0 CICS Performance Analyzer System Logger - Logstream Summary __________________________________________________ LOGR0001 Printed at 10:31:04 10/22/2003 Data from 10:10:00:23 10/22/2003 to 10:20:00:26 10/22/2003 Page 1CICS PA System Logger Report Logstream name MVSID Structure name First interval start Last interval stop Total Interval CICSTS.SCSCPAA1.DFHLOG SC66 *DASDONLY* 10:05:00.00 10/22/2003 10:20:00.00 10/22/2003 0000:15:00 ----------- IXGWRITES ---------- ---------------- DELETIONS ----------------- Bytes Count Count Bytes Bytes Writn to With Without After Int Stor Total Average Interim DASD DASD Offload w/o DASD Count Bytes Bytes Storage Write Write w. DASD Write -------- -------- -------- -------- -------- -------- -------- -------- Total 21325 16317K 765 90698K 51 20317 237568 86258K Rate(/Sec) 23 18130 100775 0 22 264 95842 Minimum 5198 3522357 21697K 0 0 0 0 Maximum 8115 6471867 34664K 51 13549 237568 57614K
------------------------------------------ EVENTS ------------------------------------------ Demand Demand Staging DASD Block Staging Entry Struct Init'd Offloads Threshld Shifts Length Full Full Full Offloads -------- -------- -------- -------- -------- -------- -------- -------- Total 3 3 0 0 0 0 0 Rate(/Sec) 0 0 0 0 0 0 0 Minimum 0 0 0 116 0 0 0 0 Maximum 2 0 0 17021 0 0 0 0 ----------------------- EVENTS ------------------------- --------------- DASD Writes ---------------- Struct Struct Rebuilds Rebuilds Total Type1 Type2 Type3 Init'd Complt'd Count Bytes Average Waits -------- -------- -------- -------- -------- -------- -------- -------- -------- Total 0 0 0 0 0 0 0 0 0 Rate(/Sec) 0 0 0 0 0 0 0 0 Minimum 0 0 0 0 0 0 0 0 Maximum 0 0 0 0 0 0 0 0
236 CICS Performance Analyzer
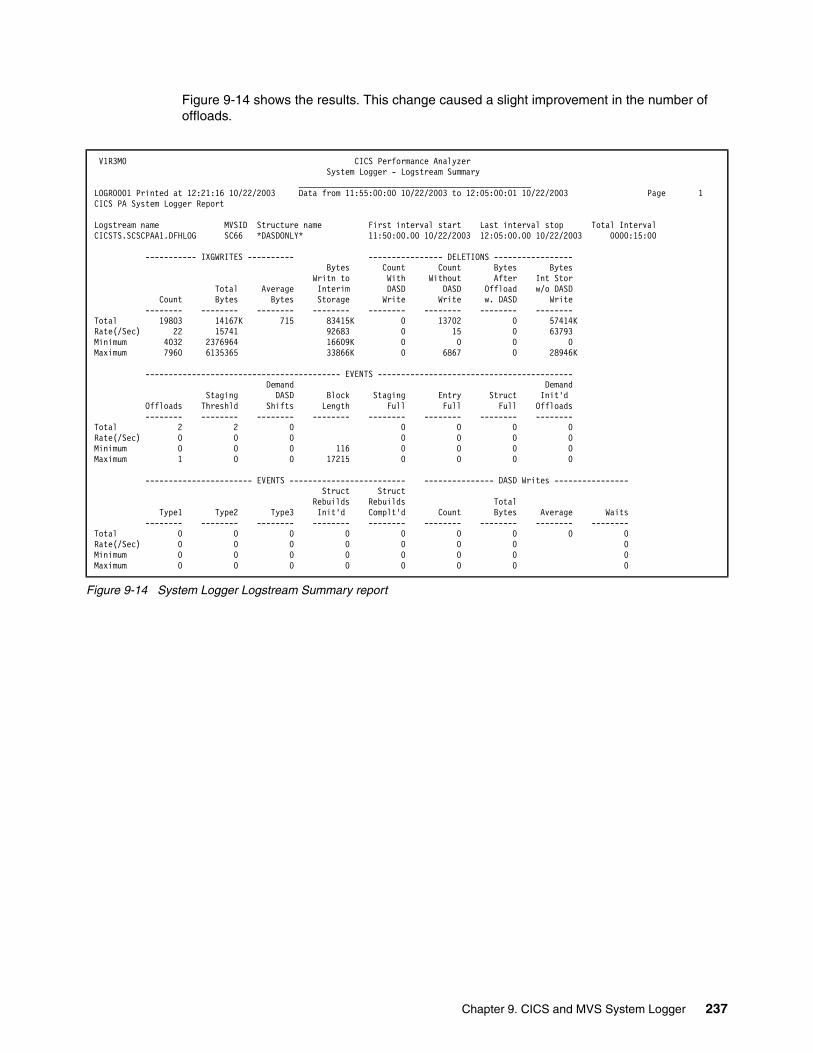
Figure 9-14 shows the results. This change caused a slight improvement in the number of offloads.
Figure 9-14 System Logger Logstream Summary report
V1R3M0 CICS Performance Analyzer System Logger - Logstream Summary __________________________________________________ LOGR0001 Printed at 12:21:16 10/22/2003 Data from 11:55:00:00 10/22/2003 to 12:05:00:01 10/22/2003 Page 1CICS PA System Logger Report Logstream name MVSID Structure name First interval start Last interval stop Total Interval CICSTS.SCSCPAA1.DFHLOG SC66 *DASDONLY* 11:50:00.00 10/22/2003 12:05:00.00 10/22/2003 0000:15:00 ----------- IXGWRITES ---------- ---------------- DELETIONS ----------------- Bytes Count Count Bytes Bytes Writn to With Without After Int Stor Total Average Interim DASD DASD Offload w/o DASD Count Bytes Bytes Storage Write Write w. DASD Write -------- -------- -------- -------- -------- -------- -------- -------- Total 19803 14167K 715 83415K 0 13702 0 57414K Rate(/Sec) 22 15741 92683 0 15 0 63793 Minimum 4032 2376964 16609K 0 0 0 0 Maximum 7960 6135365 33866K 0 6867 0 28946K ------------------------------------------ EVENTS ------------------------------------------
Demand Demand Staging DASD Block Staging Entry Struct Init'd Offloads Threshld Shifts Length Full Full Full Offloads -------- -------- -------- -------- -------- -------- -------- -------- Total 2 2 0 0 0 0 0 Rate(/Sec) 0 0 0 0 0 0 0 Minimum 0 0 0 116 0 0 0 0 Maximum 1 0 0 17215 0 0 0 0 ----------------------- EVENTS ------------------------- --------------- DASD Writes ---------------- Struct Struct Rebuilds Rebuilds Total Type1 Type2 Type3 Init'd Complt'd Count Bytes Average Waits -------- -------- -------- -------- -------- -------- -------- -------- -------- Total 0 0 0 0 0 0 0 0 0 Rate(/Sec) 0 0 0 0 0 0 0 0 Minimum 0 0 0 0 0 0 0 0 Maximum 0 0 0 0 0 0 0 0
Chapter 9. CICS and MVS System Logger 237

Figure 9-15 through Figure 9-17 show the same information but in the List version of the CICS PA report.
Figure 9-15 System Logger List report (Part 1 of 3)
Figure 9-16 System Logger List report (Part 2 of 3)
V1R3M0 CICS Performance Analyzer System Logger - List __________________________________________________ LOGR0001 Printed at 14:39:18 10/22/2003 Data from 11:55:00:00 10/22/2003 to 12:05:00:01 10/22/2003 Page 1CICS PA System Logger Report Logstream name Structure name MVSID Flag Interval expired at Level CICSTS.SCSCPAA1.DFHLOG *DASDONLY* SC66 Staging 11:55:00.00 10/22/2003 SP7.0.2 ----------- IXGWRITES ---------- ---------------- DELETIONS ----------------- Bytes Count Count Bytes Bytes Writn to With Without After Int Stor Total Average Interim DASD DASD Offload w/o DASD Count Bytes Bytes Storage Write Write w. DASD Write -------- -------- -------- -------- -------- -------- -------- -------- 4032 2376964 590 16609K 0 0 0 0 ---------------------------------------------- EVENTS -------------------------------------------------- Demand Demand Minimum Maximum Staging DASD Staging Entry Struct Init'd Block Block
Offloads Threshld Shifts Full Full Full Offloads Length Length -------- -------- -------- -------- -------- -------- -------- -------- -------- 0 0 0 0 0 0 0 116 8614 ----------------------- EVENTS ------------------------- --------------- DASD Writes ---------------- Struct Struct Rebuilds Rebuilds Total Type1 Type2 Type3 Init'd Complt'd Count Bytes Average Waits -------- -------- -------- -------- -------- -------- -------- -------- -------- 0 0 0 0 0 0 0 0 0
Logstream name Structure name MVSID Flag Interval expired at Level CICSTS.SCSCPAA1.DFHLOG *DASDONLY* SC66 Staging 12:00:00.00 10/22/2003 SP7.0.2 ----------- IXGWRITES ---------- ---------------- DELETIONS ----------------- Bytes Count Count Bytes Bytes Writn to With Without After Int Stor Total Average Interim DASD DASD Offload w/o DASD
Count Bytes Bytes Storage Write Write w. DASD Write -------- -------- -------- -------- -------- -------- -------- -------- 7811 5654754 724 32940K 0 6835 0 28467K ---------------------------------------------- EVENTS -------------------------------------------------- Demand Demand Minimum Maximum Staging DASD Staging Entry Struct Init'd Block Block Offloads Threshld Shifts Full Full Full Offloads Length Length -------- -------- -------- -------- -------- -------- -------- -------- -------- 1 1 0 0 0 0 0 116 12075 ----------------------- EVENTS ------------------------- --------------- DASD Writes ---------------- Struct Struct Rebuilds Rebuilds Total Type1 Type2 Type3 Init'd Complt'd Count Bytes Average Waits -------- -------- -------- -------- -------- -------- -------- -------- -------- 0 0 0 0 0 0 0 0 0
238 CICS Performance Analyzer

Figure 9-17 System Logger List report (Part 3 of 3)
9.5 ConclusionTo summarize, we showed that the CICS PA System Logger reports enabled us to identify possible areas of improvement. Using the information that the reports provided, we tuned the CICS System Logger log stream to perform more efficiently.
V1R3M0 CICS Performance Analyzer System Logger - List __________________________________________________ LOGR0001 Printed at 14:39:18 10/22/2003 Data from 11:55:00:00 10/22/2003 to 12:05:00:01 10/22/2003 Page 2 CICS PA System Logger Report Logstream name Structure name MVSID Flag Interval expired at Level CICSTS.SCSCPAA1.DFHLOG *DASDONLY* SC66 Staging 12:05:00.00 10/22/2003 SP7.0.2 ----------- IXGWRITES ---------- ---------------- DELETIONS ----------------- Bytes Count Count Bytes Bytes Writn to With Without After Int Stor Total Average Interim DASD DASD Offload w/o DASD Count Bytes Bytes Storage Write Write w. DASD Write
-------- -------- -------- -------- -------- -------- -------- -------- 7960 6135365 771 33866K 0 6867 0 28946K ---------------------------------------------- EVENTS -------------------------------------------------- Demand Demand Minimum Maximum Staging DASD Staging Entry Struct Init'd Block Block Offloads Threshld Shifts Full Full Full Offloads Length Length -------- -------- -------- -------- -------- -------- -------- -------- -------- 1 1 0 0 0 0 0 116 17215 ----------------------- EVENTS ------------------------- --------------- DASD Writes ---------------- Struct Struct Rebuilds Rebuilds Total Type1 Type2 Type3 Init'd Complt'd Count Bytes Average Waits -------- -------- -------- -------- -------- -------- -------- -------- -------- 0 0 0 0 0 0 0 0 0
Chapter 9. CICS and MVS System Logger 239

240 CICS Performance Analyzer

Chapter 10. Scenarios with CICS Transaction Gateway
This chapter investigates the performance of an application that is composed of a front-end part running in WebSphere Application Server on a Windows 2000 platform and a back-end part running in CICS Transaction Server (TS). The two components of the application communicate through IBM CICS Transaction Gateway (CTG). CTG can be run on either the z/OS or Windows 2000 platform. With CICS Performance Analyzer (PA) reports, we discover that the performance of this application can potentially be improved.
10
Note: The scenarios were used to provide situations that allow us to demonstrate the use of CICS Performance Analyzer reports. The CICS regions were not necessarily tuned for peak performance. In some cases, they had a high level of tracing active. Therefore, these scenarios and the results provided are for demonstration purposes only. They do not provide definitive results for a customer environment.
© Copyright IBM Corp. 2003. All rights reserved. 241

10.1 What is CICS Transaction GatewayIBM CICS Transaction Gateway provides secure, easy access from Web browsers and network computers to CICS applications, using standard Internet protocols in a range of configurations. It is a robust and scalable complement to a Web server. You can implement it as an e-business connector for IBM WebSphere Application Server, which is a Java 2 Platform, Enterprise Edition (J2EE)-compliant run-time environment for Java servlets and Java enterprise beans.
To communicate with CICS, CTG provides external access interfaces. The external access interfaces allow non-CICS applications to access and update CICS resources by initiating CICS transactions or by calling CICS programs. When used in conjunction with CICS communication facilities, they enable non-CICS programs to access and update resources on any CICS system.
The CTG supports such activities as developing graphical user interface (GUI) front ends for CICS applications. It also allows integration between CICS and non-CICS systems.
The latest release of the CTG is V5.0.1, and the currently supported platforms are: z/OS, OS/390, Linux® for S/390, AIX®, HP-UX, Sun Solaris, Windows NT®, and Windows 2000, and XP. CTG is supported for use with CICS/ESA V4.1, CICS/VSE 2.3 and CICS TS for VSE/ESA V1, but only if the CICS Transaction Gateway runs on a distributed platform. For use with CICS TS V1.2 for OS/390 or CICS TS V2 for z/OS, the CTG can run on z/OS, OS/390, or a distributed platform.
10.1.1 Gateway components and downstream protocolsCTG consists of the following principal components:
� Gateway daemon: This daemon listens on a Transmission Control Protocol/Internet Protocol (TCP/IP) port waiting for incoming requests from Java client applications.
� Java class library: This default /usr/lpp/ctg500/ctg/classes directory contains the following JAR files:
– ctgclient.jar: Java class library– ctgserver.jar: Classes used by the Gateway daemon and for local Gateway support– ctgsamples.jar: Samples– ctgadmin.jar: Trace admin client– cicsj2ee.jar, ccf2.jar, connector.jar: J2EE classes
� Client daemon: This daemon provides client/CICS server connectivity.
Figure 10-1 shows the main components of the CICS Transaction Gateway.
Figure 10-1 Components of the CICS Transaction Gateway
CICS Transaction Gateway CICS
Client
Client daemon
Gateway Java Class Library
Gateway daemon Program
3270Transaction
non-390
242 CICS Performance Analyzer

Notice that the client daemon is not used on CTG for z/OS and that a direct access to a 3270 transaction is only possible through a CTG on a distributed platform (non-390).
The Gateway daemon is a long-running process. It functions as a server to network-attached Java client applications (such as applets or remote applications) by listening on a specified TCP/IP port. CTG supports downstream four different CTG network protocols (TCP, Secure Sockets Layer (SSL), Hypertext Transfer Protocol (HTTP), and Secured HTTP (HTTPS)).
You do not have to start the Gateway daemon when a Java client application executes on the same machine where the CTG is running. In this situation, you can use the CTG local protocol, which directly invokes the underlying transport mechanism using the Java Native Interface (JNI) module CTGJNI.dll.
10.1.2 Application programming interfaces and upstream protocolsThe CTG provides three application programming interfaces (APIs) to client applications:
� External Call Interface (ECI) is a call interface to COMMAREA-based CICS applications. On z/OS and OS/390, ECI calls are mapped to External CICS Interface (EXCI) calls that provide similar functionality.
� External Presentation Interface (EPI) provides an API to invoke 3270-based transactions (CTG on distributed platform only).
� External Security Interface (ESI) is an API that allows password expiration management (PEM) functions to be invoked in CICS, to verify and change user IDs and passwords (CTG on distributed platform only).
On a distributed platform, the CTG client daemon provides upstream connectivity using the following network protocols:
� APPC connections from Windows and AIX platforms to all CICS platforms
� TCP62 (LU 6.2 over IP) connections to CICS/ESA V4.1, CICS TS V1.2 and CICS TS V1.3 for OS/390, and CICS TS for z/OS V2
� TCP/IP connections to CICS TS for z/OS V2.2, CICS TS for VSE/ESA V1.1.1, the TXSeries CICS Servers (AIX, Sun Solaris, Windows NT, Windows 2000, and HP-UX) and CICS OS/2 Transaction Server
Figure 10-2 shows a variety of ways to connect WebSphere Application Server to CICS TS for z/OS or CICS TS for OS/390.
Chapter 10. Scenarios with CICS Transaction Gateway 243

Figure 10-2 WebSphere Application Server and CICS TS
10.2 Scenario descriptionTo provide performance data for a CICS Transaction Gateway scenario, we created the environment shown in Figure 10-3.
Figure 10-3 CICS Transaction Gateway performance scenario
The front-end application running in WebSphere Application Server on Windows 2000 can connect to the back-end CICS application program TRADERBL using either a CTG V5 for z/OS or CTG V5 for Windows 2000.
Intranet/Extranet/InternetHTTP
HTML
CICSCOMMAREA-
Based Applications
WebSphere Application
Serverfor z/OS
CICS TG V5
WebSphere Application
Server CICS TG V5
WebSphere Application
Serverfor z/OS
SNA LU6.2TCP62TCP/IP
EXCI
IIOP
WebSphere Application Server for
Linuxfor z/OS
CICS TG V5
TCP/IP
CICS EJBs
z/OS CTG
ECIRequestworkload
PJA7PJA6
BrowserWeb application
Batchclient
workload
Non z/OS CTG
EXCIECI over TCP/IP
SC66
ECIRequestworkload
TRADERBL TRADERBL
244 CICS Performance Analyzer

We did not attempt to workload manage the ECI or EXCI requests. We connected the CTG for z/OS to a target CICS TS V2.2 system PJA6 and we connected the CTG for Windows 2000 to a target system PJA7.
The application we used in this scenario is fully described in Chapter 10 of Enterprise JavaBeans for z/OS and OS/390 CICS Transaction Server V2.2, SG24-6284.
10.2.1 Front-end applicationWe used a session enterprise bean, named TraderAgent, to link to the back-end application TRADERBL. The enterprise bean is using the ECIRequest Java class to use the ECI interface, which is an interface to COMMAREA-based CICS programs. To direct the ECI requests to the distributed CTG and to the CTG that is running on the z/OS platform, we modified the environment entries of the enterprise bean using the WebSphere Application Server Application Assembly Tool. When the enterprise bean was developed, the environment entries were defined externally. Therefore we can change them without recompiling the bean itself.
We used the following environment entries for this version of the session bean:
� The name of the back-end program� The CICS SYSID of the target CICS region� The name of the mirror transaction� The CTG URL
We changed the name of the CTG URL to direct ECI requests to our distributed CTG or to CTG for z/OS. You can call the enterprise bean by using two different enterprise bean clients:
� We have a Web application available that is using a servlet that is acting as an enterprise bean client for the enterprise bean that we are using. The Web application provides an Hypertext Markup Language (HTML) page that allows us to click the name of the ECIRequest application. When the ECIRequest application is selected, a servlet is started, which in turn, invokes the TraderAgent enterprise bean.
� To provide batch workload for the CTG performance scenario, we used a Windows enterprise bean client to execute the TraderAgent enterprise bean. We arranged a batch command file that allows to specify a loop-counter and a user ID to run the client several times.
10.2.2 Back-end applicationWe used the Trader application as a target back-end application for the CTG performance scenario. Trader is a sample share trading application that was used previously in other Redbooks projects. Trader, written in COBOL, uses the VSAM access method for file access and the CICS 3270 BMS programming interface.
The application consists of two modules: TRADERPL, which contains the 3270 presentation logic; and TRADERBL, which contains the business logic. TRADERPL invokes TRADERBL using an EXEC CICS LINK and passing a COMMAREA structure for input and output. TRADERBL contains logic to query and write to the persistent VSAM data, stored in two files: the company file and the customer file. We do not use TRADERPL, the presentation logic, for our CTG performance scenario. Instead, we use the TraderAgent enterprise bean. It passes the COMMAREA along with the ECI request and replaces the 3270 presentation logic.
Chapter 10. Scenarios with CICS Transaction Gateway 245

The following business functions are provided by the COBOL application:
� Get_Company Query the list of companies� Share_value Retrieve current stock quote from file� Buy_Sell Trade shares in a given company
We indicate which function we want to call by specifying the corresponding value in the COMMAREA.
10.2.3 CTG for z/OS EXCI scenarioWe use two different scenarios for the CTG performance measurement. When we direct the ECI request to the CTG on z/OS, the ECI calls used by the application are mapped to the External CICS Interface. If we use the distributed CTG, we use the ECI over TCP/IP function to call the Trader application.
The EXCI interface is analogous to ECI. It allows programs that are running on z/OS, for example, batch programs or the CTG, to call CICS programs. The programs can transfer data using a COMMAREA. The EXCI allows a user to allocate and open sessions (or pipes) to a CICS region, and to pass distributed program link (DPL) requests over them. The multiregion operation (MRO) facility of CICS inter-region communication (IRC) facility supports these requests, and each pipe maps onto one MRO session, with a limit of 100 pipes per EXCI address space.
10.2.4 Distributed CTG using ECI over TCP/IPWhen we direct the ECI request to the distributed CTG, we use the ECI over TCP/IP function to call the Trader application TRADERBL. ECI over TCP/IP allows direct access to CICS applications over TCP/IP. It removes the necessity to either use SNA or to configure TCP62 and the AnyNet® feature of VTAM.
CICS TS releases earlier than CICS TS for z/OS V2.2 do not support ECI over TCP/IP.
10.3 Scenario runTo produce SMF performance records for the CTG scenario, we used a batch CMD file, tsbc_ECI.cmd, that calls the Trader client from any Windows command prompt. We modified the environment variable JAVA_J2EE to point to our Java2 Enterprise Edition classes. Then we checked that the path specified in the CLIENTCLASSPATH environment variable contains the TraderEciClient.jar file. Example 10-1 shows the CMD file that we used to start the TraderEci client. The client is started using the Java command and the -classpath parameter.
Example 10-1 Batch CMD-file to run TraderClient
@echo offrem ----------------------------------------------------------------------rem TraderEci run command scriptrem Use this file to call TraderClient from any DOS command line.rem ----------------------------------------------------------------------rem Modify the following to match your directory containing j2ee.jar:set JAVA_J2EE="c:\j2sdkee1.3.1\lib"rem ----------------------------------------------------------------------
246 CICS Performance Analyzer

set CLIENTCLASSPATH=.;TraderEciClient.jar;TraderEciEJB.jar;%JAVA_J2EE%\j2ee.jar;..\..\ExternalJARs\CICSEJBClient.jarrem ----------------------------------------------------------------------echo *tsbc.cmd*: Starting the EJB client program.java -classpath %CLIENTCLASSPATH% itso.cics.cts22.trader.test.TraderClient %1 %2echo *tsbc.cmd*: Finished.
The Java command requires two parameters:
� The name of the properties file (specifying the JNDI parameters) � The name of the user who is going to trade shares (user ID)
The sample TraderClient.properties file is configured to work with the TraderEci session bean deployed to WebSphere Application Server on our Windows 2000 Server.
We wanted to start the TraderECI client a number of times. Therefore, we created another CMD file, WLM_ECI.CMD, so we could start the CMD file shown in Example 10-1 automatically rather than manually.
The CMD file shown in Example 10-2 uses two parameters:
� A loop count in which you can specify the number of times to call the TraderECI client� The prefix of the user ID you are going to use
The name of the user ID is built by the user ID prefix plus the loop count. Therefore, if you specify parameters 3 and MYUSER, then the following user IDs are used: MYUSER1, MYUSER2, and MYUSER3.
Example 10-2 Batch workload CMD file for TraderECI client
@echo offif "%1" == "" goto :outif "%2" == "" goto :outCD C:\itsocts22\ejb-components\ECIfor /L %%f in (1,1,%1) do call tsbc_eci.cmd TraderClient.properties %2%%fecho *tsbc.cmd*: Finished.goto :end:outecho.echo parameters required!echo.echo use ECI_WLM loopcount userid-prefixecho.echo for example ECI_WLM 10 myid (loops ten times using myid1...myid10)echo.echo remember that ECI_WLM 100000 MYUSER would exceed the 8 byte userid length.echo.echo ECI_WLM 100000 ID will be ok...echo.:endCD C:\itsocts22\WLM_BATCH_CMDS
10.3.1 Running the workload using the CTG for z/OSWe used the WLM_ECI.CMD file to run a batch of 50 TraderEciClient applications. Each client application issues eight ECI request calls to back-end application TRADERBL. Each
Chapter 10. Scenarios with CICS Transaction Gateway 247

ECI request call is received by the long running gateway daemon of the CTG for z/OS. The CTG for z/OS then uses the EXCI interface to call the CICS back-end application.
Example 10-3 shows the messages that we received during the process of one TraderEciClient run.
Example 10-3 WLM_ECI.CMD output
C:\itsocts22\WLM_Batch_CMDs>eci_wlm 50 userid*tsbc.cmd*: Starting the EJB client program.Now starting a session with our TraderAgent using the user 'USERID1'.
EJBHelper::jndiLookup: Going to use nameserver: iiop://9.24.105.29:900/EJBHelper::jndiLookup: Looking up home interface with JNDI name: domain/legacot/ejb/itso/cics/cts22/trader/eci/DistributedTraderAgentHomeEJBHelper::jndiLookup: Creating an InitialContext of type: com.sun.jndi.cosnag.CNCtxFactoryQuerying the version of our TraderAgent:
package itso.cics.cts22.trader.eci
Asking our TraderAgent for a list of all known companies:Casey_Import_ExportGlass_and_Luget_PlcHeadworth_ElectricalIBM
Selecting the last company as our current company...
The last company is named IBM, here are its details:The price per share in dollars = $163.0The total of outstanding shares = 123456789 sharesThe total outstanding share value = $2.0123456607E10The price one day ago = $163.0The price two days ago = $162.0The price three days ago = $160.0The price four days ago = $161.0The price five days ago = $159.0The price six days ago = $156.0The price seven days ago = $157.0The cost to sell a share = $400.0The cost to buy a share = $0.0
The portfolio of USERID1 contains 28 shares in IBM worth $4564.0.
Selling 23 shares...
Buying 16 shares...
The portfolio of USERID1 now contains 35 shares in IBM worth $5705.0..................................
When the batch of 50 TraderEciClient applications completed, we switched the current SMF data set using the /I SMF command. Then we used the Take-Up from SMF function to update our CICS Performance Analyzer system definitions. We performed the following steps to do the Take-up from SMF:
248 CICS Performance Analyzer
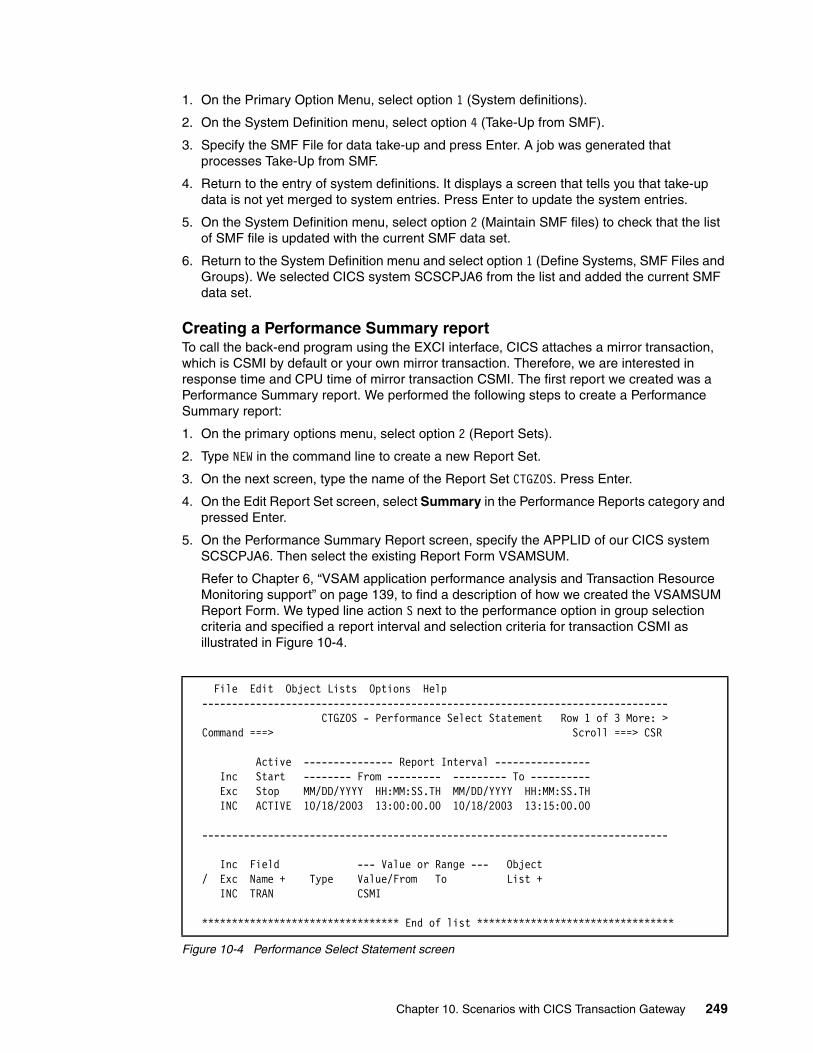
1. On the Primary Option Menu, select option 1 (System definitions).
2. On the System Definition menu, select option 4 (Take-Up from SMF).
3. Specify the SMF File for data take-up and press Enter. A job was generated that processes Take-Up from SMF.
4. Return to the entry of system definitions. It displays a screen that tells you that take-up data is not yet merged to system entries. Press Enter to update the system entries.
5. On the System Definition menu, select option 2 (Maintain SMF files) to check that the list of SMF file is updated with the current SMF data set.
6. Return to the System Definition menu and select option 1 (Define Systems, SMF Files and Groups). We selected CICS system SCSCPJA6 from the list and added the current SMF data set.
Creating a Performance Summary reportTo call the back-end program using the EXCI interface, CICS attaches a mirror transaction, which is CSMI by default or your own mirror transaction. Therefore, we are interested in response time and CPU time of mirror transaction CSMI. The first report we created was a Performance Summary report. We performed the following steps to create a Performance Summary report:
1. On the primary options menu, select option 2 (Report Sets).
2. Type NEW in the command line to create a new Report Set.
3. On the next screen, type the name of the Report Set CTGZOS. Press Enter.
4. On the Edit Report Set screen, select Summary in the Performance Reports category and pressed Enter.
5. On the Performance Summary Report screen, specify the APPLID of our CICS system SCSCPJA6. Then select the existing Report Form VSAMSUM.
Refer to Chapter 6, “VSAM application performance analysis and Transaction Resource Monitoring support” on page 139, to find a description of how we created the VSAMSUM Report Form. We typed line action S next to the performance option in group selection criteria and specified a report interval and selection criteria for transaction CSMI as illustrated in Figure 10-4.
Figure 10-4 Performance Select Statement screen
File Edit Object Lists Options Help ------------------------------------------------------------------------------ CTGZOS - Performance Select Statement Row 1 of 3 More: > Command ===> Scroll ===> CSR Active --------------- Report Interval ---------------- Inc Start -------- From --------- --------- To ---------- Exc Stop MM/DD/YYYY HH:MM:SS.TH MM/DD/YYYY HH:MM:SS.TH INC ACTIVE 10/18/2003 13:00:00.00 10/18/2003 13:15:00.00 ------------------------------------------------------------------------------ Inc Field --- Value or Range --- Object / Exc Name + Type Value/From To List + INC TRAN CSMI
********************************* End of list *********************************
Chapter 10. Scenarios with CICS Transaction Gateway 249

6. Return to the Report Set screen. Entered line action RUN on Summary typed SUB in the command line to run the Report Set.
When the job completed, it produced the output shown in Figure 10-5.
Figure 10-5 Performance Summary report for CSMI transaction
The Summary report gives a first impression about CICS internal response times and CPU consumption. For a closer look at the CICS internal performance of the CSMI transaction, we provide a Performance List report of CSMI transaction.
Creating a Performance List reportWe performed the following steps to create a Performance List report:
1. On the primary options menu, select option 2 (Report Sets). When the list of available Report Sets is displayed, select Report Set CTGZOS.
2. Deactivate the summary report that you created earlier when you typed line action D next to the summary report option. The Yes in the Active column after the summary option is changed to No.
3. Type line action S next to the list option in group performance reports and press Enter.
4. On the performance list report screen, specify APPLID SCSCPJA6 and Report Form VSAML. Refer to Chapter 6, “VSAM application performance analysis and Transaction Resource Monitoring support” on page 139, which describes how to create Report Form VSAML. Report Form VSAML uses the same sequence of performance fields as VSAMSUM.
5. Still on the Performance List Report screen, type line action S next to the performance option in group selection criteria. We specified selection criteria for transaction CSMI and the report interval.
6. Return to the Report Set screen from where you ran the Report Set. A Performance List report job was generated and executed. Figure 10-6 shows the Performance List report that we created.
V1R3M0 CICS Performance Analyzer Performance Summary __________________________________________________ SUMM0001 Printed at 13:38:12 10/18/2003 Data from 13:01:43 10/18/2003 to 13:05:15 10/18/2003 Page 1 Avg Max Avg Avg Avg Avg Avg Avg Avg Avg Avg Avg Avg Tran Response Response Dispatch User CPU Suspend FC Total RLS Wait FC Wait FCADD FCBROWSE FCDELETE FCGET FCPUT Time Time Time Time Time Time Time CSMI .0031 .1121 .0015 .0008 .0015 3 .0015 .0000 0 1 0 2 0 ******************************** BOTTOM OF DATA ***********************************************************************************
250 CICS Performance Analyzer

Figure 10-6 Performance List report CSMI transaction
We were surprised that the list contained about 400 mirror tasks. We did not expect mirror tasks to get detached since we specified DFHSIT parameters MROLRM (long running mirror) and MROFSE. MROFSE specifies whether you want to extend the lifetime of the long-running mirror to keep it allocated until the end of the task rather than after a user sync point for function shipping applications.
We started a CEDX session on transaction CSMI to look more closely at the EXEC CICS LINK requests that were issued over the EXCI interface.
Figure 10-7 shows the CEDX screen when it stopped at one of the EXEC CICS LINK commands. The LINK command actually was originated when the TraderEciClient issued an ECI request call to link to the back-end program TRADERBL. The fact that the LINK command was issued with the SYNCONRETURN option implies that the TraderEciClient is not running in extended mode. In traditional CICS client ECI applications, extended mode encompasses a series of one or more ECI requests to a server program, each executed with SYNCONRETURN set to off, followed by a final ECI request (to the same server program) that is executed with SYNCONRETURN set to on. This final ECI call causes CICS to take a sync point on successful completion of the server program, and any changes to resources made by the server program to be committed.
V1R3M0 CICS Performance Analyzer Performance List __________________________________________________ LIST0001 Printed at 14:04:43 10/18/2003 Data from 13:01:43 10/18/2003 APPLID SCSCPJA6 Page 1 Tran TaskNo Response Dispatch User CPU Suspend FC Total RLS Wait FC Wait FCADD FCGET FCBROWSE FCDELETE FCPUT Time Time Time Time Time Time CSMI 83134 .0012 .0012 .0008 .0000 6 .0000 .0000 0 0 4 0 0 CSMI 83135 .0013 .0013 .0008 .0000 2 .0000 .0000 0 2 0 0 0 CSMI 83136 .0012 .0012 .0008 .0000 2 .0000 .0000 0 2 0 0 0 CSMI 83137 .0011 .0010 .0008 .0000 2 .0000 .0000 0 2 0 0 0 CSMI 83138 .0070 .0016 .0008 .0055 3 .0055 .0000 0 2 0 0 1 CSMI 83139 .0034 .0015 .0008 .0020 3 .0019 .0000 0 2 0 0 1 CSMI 83140 .0011 .0011 .0008 .0000 2 .0000 .0000 0 2 0 0 0 CSMI 83141 .0012 .0012 .0008 .0000 2 .0000 .0000 0 2 0 0 0 CSMI 83142 .0013 .0013 .0009 .0000 6 .0000 .0000 0 0 4 0 0 CSMI 83143 .0117 .0117 .0008 .0000 2 .0000 .0000 0 2 0 0 0
.................. 400 CSMI transactions ...
................
Chapter 10. Scenarios with CICS Transaction Gateway 251

Figure 10-7 CEDX screen for transaction CSMI
We looked at the Java source of the enterprise bean methods that issue the ECI request call. We found that all of them specified the ECI_NON_EXTEND parameter as well as the ECI_LUW_NEW parameter. This in fact is the reason that each EXCI request runs with SYNCONRETURN set to on, which terminates the mirror transaction even if MROLRM SIT parameter is set to YES. Example 10-4 shows how the ECI request call has been coded. To avoid detaching the mirror transaction, change the recovery mode to ECI_EXTENDED mode. The last ECI request in series of ECI requests should issue a COMMIT request which results in a sync point.
Example 10-4 ECI request call issued by TraderAgent enterprise bean
// create ECI request request = new ECIRequest( ECIRequest.ECI_SYNC, // simple ECI synchronous call aCicsServer, // servername as configured to CTG null, // no userid null, // no password aProgramName, // name of the CICS program to run aTranId, // mirror transaction ID commarea, commarea.length, // COMMAREA and length ECIRequest.ECI_NO_EXTEND, // one LUW per call ECIRequest.ECI_LUW_NEW); // default LUW ID for new call
10.3.2 Running the workload using the distributed CTGTo run our workload using the distributed gateway, we changed the CTG-URL variable of the enterprise beans environment entries. We specified the TCP/IP address of the Windows 2000 Server and the port on which the gateway daemon is listening. Figure 10-8 shows the Application Assembly Tool screen where we modified the environment entries of the DistributedTraderAgent enterprise bean.
Figure 10-8 also shows the remaining environment entries that we used. We specified the CICS SYSID PJA6, the program name TRADERBL, and the mirror transaction ID CPMI.
TRANSACTION: CSMI PROGRAM: DFHMIRS TASK: 0008435 APPLID: SCSCPJA6 DISPLAY: 00 STATUS: COMMAND EXECUTION COMPLETE EXEC CICS LINK PROGRAM PROGRAM ('TRADERBL') COMMAREA ('Get_Company '...) LENGTH (372) DATALENGTH (372) SYNCONRETURN NOHANDLE
OFFSET:X'000FF4' LINE: EIBFN=X'0E08' RESPONSE: NORMAL EIBRESP=0 ENTER: CONTINUE PF1 : UNDEFINED PF2 : SWITCH HEX/CHAR PF3 : END EDF SESSION PF4 : SUPPRESS DISPLAYS PF5 : WORKING STORAGE PF6 : USER DISPLAY PF7 : SCROLL BACK PF8 : SCROLL FORWARD PF9 : STOP CONDITIONS PF10: PREVIOUS DISPLAY PF11: EIB DISPLAY PF12: ABEND USER TASK
252 CICS Performance Analyzer

When the DistributedTraderAgent bean was modified to point to the correct CTG, we started our workload again. We used the same CMD-file that we used for the CTG for the z/OS scenario which is processing a batch of 50 TraderClient calls.
Figure 10-8 Application Assembly Tool
While the workload was running, we verified that it ran correctly by checking the output of the CMD-file as illustrated in Example 10-3 on page 248. When 50 calls to the TraderEciClient completed, we switched the current SMF data set to archive the data.
To investigate the CICS internal performance of ECI over TCP/IP, and to see a comparison between EXCI and ECI over TCP/IP interfaces, we provided a similar Performance Summary report that we used to show the performance of the CTG for z/OS.
When we configured CICS to use ECI over TCP/IP, we created a TCPIPSERVICE resource definition. We specified the ECI protocol which automatically inserted the name of the listener transaction CIEP to the definition. From the CICS internal performance point of view, we wanted to look at two transactions: CPMI which is the mirror transaction that we specified in environment entries of the enterprise bean and CIEP which is the listener transaction for the ECI over TCP/IP function. Figure 10-9 shows a CEMT I TCPIPS display of the TCPIPSERVICE definition we use for ECI over TCP/IP.
Chapter 10. Scenarios with CICS Transaction Gateway 253

Figure 10-9 ECI over TCP/IP TCPIPSERVICE definition
Refer to “Creating a Performance Summary report” on page 249 for details about how to create a performance summary report for the distributed CTG scenario. We performed the following steps to create the Performance Summary report for transactions CIEP and CPMI:
1. Use the Take-Up for SMF function to update the CICS system entries with new performance data.
2. Copy the existing Report Set CTGZOS as CTGECI.
3. Modify the existing selection criteria as illustrated in Figure 10-10.
4. Run the Report Set.
Figure 10-10 Performance Select Statement screen
I TCPIPS RESULT - OVERTYPE TO MODIFY Tcpipservice(CTGECI6) Backlog( 00128 ) Connections(0000) Port(08068) Protocol(Eci) Ssltype(Nossl) Authenticate(Noauthentic) Openstatus( Open ) Transid(CIEP) Urm( ) Ipaddress(9.12.6.29) Socketclose(Wait) Closetimeout(000000) Dnsgroup() Dnsstatus( ) Grpcritical(Noncritical) Certificate() + Attachsec(Verify) SYSID=PJA6 APPLID=SCSCPJA6
File Edit Object Lists Options Help ------------------------------------------------------------------------------ CTGECI - Performance Select Statement Row 1 of 2 More: > Command ===> Scroll ===> CSR Active --------------- Report Interval ---------------- Inc Start -------- From --------- --------- To ---------- Exc Stop MM/DD/YYYY HH:MM:SS.TH MM/DD/YYYY HH:MM:SS.TH INC ACTIVE 10/18/2003 14:00:00.00 10/18/2003 14:15:00.00 ------------------------------------------------------------------------------ Inc Field --- Value or Range --- Object / Exc Name + Type Value/From To List + INC TRAN CIEP INC TRAN CPMI ********************************* End of list *********************************
254 CICS Performance Analyzer

When the Performance Summary report job completed, it produced the output shown in Figure 10-11. We did a CPMI to CSMI comparison and found that average response time for CPMI transaction was higher. In any case, the average CPU time of 0.0008 for both transaction is very much the same. The maximum response time of a single transaction might have influenced the average response time of CPMI transaction as well. The workload scenario using the distributed CTG ran one hour later than the CTG for z/OS scenario, therefore other activities on our system may have influenced CICS performance. For example, the ratio between average dispatch time and average CPU time is not good. It appears that the CICS address space was not continuously dispatched when the workload was running.
Figure 10-11 Performance Summary report
As we did for the CTG for z/OS scenario, we produced a Performance List report for the distributed CTG scenario as well. Refer to “Creating a Performance List report” on page 250 for details about how we created a Performance List report for the CTG for the z/OS scenario.
We performed the following steps to create a Performance List report:
1. Edit Report Set CTGECI to deactivate the Summary Report. 2. Activate the Performance List Report.3. Create a Performance select statement.4. Run the Report Set.
We used the same enterprise bean for the distributed CTG performance scenario. Therefore, we also discovered that we do not detach the mirror transaction. The Performance List report (Figure 10-10) contained about 400 mirror transactions.
To use long running mirror transactions for this scenario, we must change the ECI request calls issued by the enterprise bean. We must change the parameter ECI_NON_EXTENDED to ECI_EXTENDED. We must also change the logic of the enterprise bean slightly, since a token must be passed along with the request and the last ECI request call must be COMMIT or BACKOUT. In addition, we must enable the Gateway daemon support of z/OS Resource Recovery Services (RRS) using the CTG_RRMNAME environment variable.
V1R3M0 CICS Performance Analyzer Performance Summary __________________________________________________ SUMM0001 Printed at 15:09:28 10/18/2003 Data from 14:08:37 10/18/2003 to 14:10:18 10/18/2003 Page 1 Avg Max Avg Avg Avg Avg Avg Avg Avg Avg Avg Avg Avg Tran Response Response Dispatch User CPU Suspend FC Total RLS Wait FC Wait FCADD FCBROWSE FCDELETE FCGET FCPUT Time Time Time Time Time Time Time CIEP .0058 .3034 .0005 .0004 .0053 0 .0000 .0000 0 0 0 0 0 CPMI .0046 .2974 .0024 .0008 .0022 3 .0011 .0000 0 1 0 2 0 ******************************** BOTTOM OF DATA ***********************************************************************************
Chapter 10. Scenarios with CICS Transaction Gateway 255

Figure 10-12 Performance List report
10.4 ConclusionRunning this scenario, we showed that by analyzing CICS PA reports, a system programmer can deduce how different APIs are used by the CTG client application. In our case, an application change can be suggested that affects a certain performance improvement by using extended ECI calls. Of course, the reason extended ECI calls were not used in the first place was to prevent tying up CICS recoverable resources for the full duration of an extended unit of work.
V1R3M0 CICS Performance Analyzer Performance List __________________________________________________ LIST0001 Printed at 15:04:45 10/18/2003 Data from 14:08:37 10/18/2003 APPLID SCSCPJA6 Page 1 Tran TaskNo Response Dispatch User CPU Suspend FC Total RLS Wait FC Wait FCADD FCGET FCBROWSE FCDELETE FCPUT Time Time Time Time Time Time CIEP 83541 .0021 .0005 .0004 .0017 0 .0000 .0000 0 0 0 0 0 CPMI 83542 .0021 .0016 .0009 .0005 6 .0000 .0000 0 0 4 0 0 CIEP 83543 .0020 .0005 .0004 .0015 0 .0000 .0000 0 0 0 0 0 CPMI 83544 .0016 .0012 .0008 .0003 2 .0000 .0000 0 2 0 0 0 CPMI 83546 .0016 .0014 .0008 .0001 2 .0000 .0000 0 2 0 0 0 CIEP 83545 .0025 .0004 .0006 .0021 0 .0000 .0000 0 0 0 0 0 CPMI 83548 .0013 .0011 .0007 .0002 2 .0000 .0000 0 2 0 0 0 CIEP 83547 .0020 .0004 .0004 .0016 0 .0000 .0000 0 0 0 0 0 CIEP 83549 .0019 .0006 .0003 .0012 0 .0000 .0000 0 0 0 0 0 CPMI 83550 .0032 .0012 .0007 .0020 3 .0019 .0000 0 2 0 0 1
..........
........
256 CICS Performance Analyzer

Chapter 11. CICS Web Support and 3270 Bridge
This chapter presents a brief overview of the CICS Web Support and the 3270 Bridge interface. It shows how CICS PA can help you to tune the interface by deciding on an appropriate setting of the SOCKETCLOSE parameter on the TCPIPSERVICE definition. This value specifies if, and for how long, CICS should wait before closing the socket, after issuing a receive for incoming data on that socket. For more information about the SOCKETCLOSE parameter and the various setting options, refer to the CICS Transaction Server for z/OS CICS Resource Definition Guide, SC34-5990.
11
Note: This scenario was used to provide a situation that allows us to demonstrate the use of CICS PA reports. The CICS regions were not necessarily tuned for peak performance. In some cases, they had a high level of tracing active. Therefore, these scenarios and the results provided are for demonstration purposes only. They do not provide definitive results for a customer environment.
© Copyright IBM Corp. 2003. All rights reserved. 257

11.1 CICS Web Support overviewCICS Web Support enables Web browsers to communicate directly with mainframe CICS application programs without an intermediate gateway or a separate Web server. When an end user selects a CICS Web Support Uniform Resource Locator (URL) from a browser window, the request is sent to CICS over TCP/IP using the HTTP protocol. In first instance, the request is accepted by a CICS internal control task which attaches a task to analyze the request as presented in the URL. The name of this attached task is CWXN by default but can be changed. Under control of the CWXN transaction, the appropriate application to be run is determined and an alias transaction is attached to run the application. The default name of the alias transaction is CWBA.
You can use a special CICS-provided application program, DFHWBTTA, to invoke a 3270 transaction in a 3270 Bridge environment. Thus the CICS Web Support exploits the capabilities of the bridge service to allow existing 3270-based transactions to be driven from the Web.
Figure 11-1 shows a general overview of this process. A Web request is initially taken by the Socket Listener task CSOL, which attaches the CWXN transaction to analyze the request. The requested user application program is LINKed to under control of the subsequently attached alias transaction CWBA. If the user application program to be executed is the CICS provided program DFHBWTTA, then the requested 3270 transaction is processed under a separately attached transaction that runs in a bridge environment.
Figure 11-1 Basic CICS Web Support transaction flow
11.2 Scenario descriptionFor the purposes of this section, we did not use a tool to provide heavy workload. It is sufficient to run a few Web requests to show the possibilities of reporting with CICS PA.
We used two CICS systems, one CICS TS V1.3 system, SCSCPAA6, and one CICS TS V2.2 system, SCSCPJA6. Both ran on the same z/OS system so that they used the same IP address, 9.12.6.29. For SCSCPAA6, we defined that it is listening on port 8080 as you can see in the TCPIPSERVICE definition shown in Figure 11-2. Note also that the SOCKETCLOSE time is 20 seconds, which means that the socket stays open for 20 seconds to wait for another incoming requests after some data was received.
HTTP
HTTP
CSOL
CICS TS
CWXN
CWBA
User Application
CWXN
CWBA
DFHWBTTA
3270Transaction
258 CICS Performance Analyzer

Figure 11-2 TCPIPSERVICE definition for SCSCPAA6
For SCSCPJA6, we specified that it was listening on port 8081 and we had SOCKETCLOSE equal to zero. This means that the socket closes immediately, if no more data is available after the first receive. Figure 11-3 shows the TCPIPSERVICE definition for SCSCPJA6.
Figure 11-3 TCPIPSERVICE definition for SCSCPJA6
OBJECT CHARACTERISTICS CICS RELEASE = 0530 CEDA View TCpipservice( HTTPNSSL ) TCpipservice : HTTPNSSL Group : PAA6WEB Description : CICS Web TCPIPSERVICE with no SSL support Urm : DFHWBADX Portnumber : 08080 1-65535 Certificate : STatus : Open Open | Closed SSl : No Yes | No | Clientauth Authenticate : No No | Basic | Certificate | AUTORegister | AUTOMatic TRansaction : CWXN Backlog : 00005 0-32767 TSqprefix : Ipaddress : SOcketclose : 000020 No | 0-240000 (HHMMSS)
SYSID=PAA6 APPLID=SCSCPAA6
OBJECT CHARACTERISTICS CICS RELEASE = 0620 CEDA View TCpipservice( HTTPNSSL ) TCpipservice : HTTPNSSL GROup : PJA6HTTP DEscription : CICS Web TCPIPSERVICE with no SSL support Urm : DFHWBADX POrtnumber : 08081 1-65535 STatus : Open Open | Closed PRotocol : Http Iiop | Http | Eci TRansaction : CWXN Backlog : 00005 0-32767 TSqprefix : Ipaddress : SOcketclose : 000000 No | 0-240000 (HHMMSS) SECURITY SSl : No Yes | No | Clientauth Certificate : AUthenticate : No No | Basic | Certificate | AUTORegister | AUTOMatic ATtachsec : Local | Verify DNS CONNECTION BALANCING DNsgroup : GRPcritical : No No | Yes
SYSID=PJA6 APPLID=SCSCPJA6
Chapter 11. CICS Web Support and 3270 Bridge 259

11.3 Scenario runWe did not introduce a specific workload. From two workstations, we ran some applications. In SCSCPJA6, we used the following URLs:
� http://9.12.6.29:8081/cics/cwba/dfhwbtta/CEMT� http://9.12.6.29:8081/cics/cwba/dfhadwb0
For running applications on SCSCPAA6, we used:
� http://9.12.6.29:8080/cics/cwba/dfhwbtta/CEMT and other CICS supplied transactions.� http://9.12.6.29:8080/cics/cwba/dfhwbtta/TRAD� http://9.12.6.29:8080/cics/cwba/SHOWAPI� http://9.12.6.29:8080/tradercv/cwba/tradepl
With this as the starting point, we show you the Transaction Group Report. When a request from a browser comes into the CICS system, the CWXN transaction that handles the request is assigned a transaction group ID. This transaction group ID is used to correlate the transactions that CICS executes for the same incoming work request. You can ask CICS PA to provide a list of transactions that executed in the same group. The Transaction Group option is available on the Report Set screen in the Reports category. We created a new Report Set, called WEB. On the Report Set panel, we selected the Transaction Group option and received the screen shown in Figure 11-4. On this screen, we elected to have only those groups that contain more than one record.
Figure 11-4 Transaction group processing options
File Systems Options Help ------------------------------------------------------------------------------ WEB - Transaction Group Report Command ===> System Selection: Report Output: APPLID . . + DDname . . . . . . . . . TRGP0001 Image . . SC66 + Print Lines per Page . . (1-255) Group . . + Processing Options: 1 1. Groups of more than one record 2. Groups of a single record 3. All Groups Report Format: Title . . Grouping Web transactions Selection Criteria: Performance
260 CICS Performance Analyzer

We returned to the Report Set panel and ran the Web report. The beginning of the report is shown in Figure 11-5.
Figure 11-5 Default Transaction Group output
We concentrate on the Origin column in this example. This column gives the origin type from the SMF Transaction flags field, a string of 64 bits used for signaling transaction definition and status information. The values we are interested in are SOCKET, WEB and BRIDGE. To create a report with only transactions with one of those three types of origin, we again selected the Transaction Group option and selected the Performance selection criteria where we entered the selection to have only those records with ORIGIN is equal to WEB, SOCKET or BRIDGE as shown in Figure 11-6.
Figure 11-6 Transaction Group Selection criteria
V1R3M0 CICS Performance Analyzer Transaction Group __________________________________________________ TRGP0001 Printed at 13:20:10 11/06/2003 Data from 10:07:11 11/05/2003 to 12:22:37 11/05/2003 Page 1Grouping Web transactions Brdg Client Request Fcty Conn R Response Tran Userid SC Origin Tran IP Address Type Program Term LUName T/Name Name APPLID Task T Stop Time Time CSOL CICSUSER U NONE AP: DFHSOL SCSCPAA1 3 D 10:38:39.08 1887.52 CSOL CICSUSER U NONE AP: DFHSOL SCSCPAA1 3 D 11:10:06.51 1887.43 CSOL CICSUSER U NONE AP: DFHSOL SCSCPAA1 3 D 11:41:34.00 1887.48 CSOL CICSUSER U NONE AP: DFHSOL SCSCPAA1 3 D 12:13:01.39 1887.39 CSOL CICSUSER U NONE AP: DFHSOL SCSCPAA6 3 D 11:38:27.34 1887.74 CSOL CICSUSER U NONE AP: DFHSOL SCSCPAA6 3 D 12:09:54.74 1887.40 CWXN CICSUSER U SOCKET 9.24.104.192 AP: DFHWBXN SCSCPAA6 33 T 11:10:45.59 61.7739 CWBA CICSUSER U WEB 9.24.104.192 AP: SHOWAPI SCSCPAA6 37 T 11:09:53.34 .4741 CWBA CICSUSER U WEB 9.24.104.192 AP: SHOWAPI SCSCPAA6 38 T 11:09:57.61 2.1170 CWBA CICSUSER U WEB 9.24.104.192 AP: SCSCPAA6 39 T 11:10:13.82 .0935 CWBA CICSUSER U WEB 9.24.104.192 AP: SCSCPAA6 40 T 11:10:16.00 .0645 TRAD CICSUSER TO BRIDGE CWBA AP: TRADERPL }AAB }AAB B/}AAB SCSCPAA6 42 T 11:10:23.71 .6916 CWBA CICSUSER U WEB 9.24.104.192 AP: DFHWBTTA SCSCPAA6 41 T 11:10:23.71 .6934 TRAD CICSUSER TP BRIDGE CWBA AP: TRADERPL }AAB }AAB B/}AAB SCSCPAA6 44 T 11:10:25.48 .0105
File Edit Object Lists Options Help ------------------------------------------------------------------------------ WEB - Performance Select Statement Row 1 of 4 More: > Command ===> Scroll ===> CSR Active --------------- Report Interval ---------------- Inc Start -------- From --------- --------- To ---------- Exc Stop MM/DD/YYYY HH:MM:SS.TH MM/DD/YYYY HH:MM:SS.TH ------------------------------------------------------------------------------ Inc Field --- Value or Range --- Object / Exc Name + Type Value/From To List + INC ORIGIN WEB INC ORIGIN SOCKET INC ORIGIN BRIDGE ********************************* End of list *********************************
Chapter 11. CICS Web Support and 3270 Bridge 261

After we ran the report again, we received the report shown in Figure 11-7.
Figure 11-7 Transaction group report with only SOCKET, WEB, and BRIDGE
The report starts with the groups of APPLID SCSCPAA6. We see that there are many transactions running in the same group. This is the result of having a socket close time of 20 seconds. If the client sends a Connection: Keep-alive HTTP header with a SOCKETCLOSE value of 20 seconds, the socket stays open and every request coming in within 20 seconds
V1R3M0 CICS Performance Analyzer Transaction Group __________________________________________________ TRGP0001 Printed at 16:26:12 11/06/2003 Data from 11:09:43 11/05/2003 to 12:22:19 11/05/2003 Page 1Grouping Web transactions Brdg Client Request Fcty Conn R Response Tran Userid SC Origin Tran IP Address Type Program Term LUName T/Name Name APPLID Task T Stop Time Time CWXN CICSUSER U SOCKET 9.24.104.192 AP: DFHWBXN SCSCPAA6 33 T 11:10:45.59 61.7739 CWBA CICSUSER U WEB 9.24.104.192 AP: SHOWAPI SCSCPAA6 37 T 11:09:53.34 .4741 CWBA CICSUSER U WEB 9.24.104.192 AP: SHOWAPI SCSCPAA6 38 T 11:09:57.61 2.1170 CWBA CICSUSER U WEB 9.24.104.192 AP: SCSCPAA6 39 T 11:10:13.82 .0935 CWBA CICSUSER U WEB 9.24.104.192 AP: SCSCPAA6 40 T 11:10:16.00 .0645 CWBA CICSUSER U WEB 9.24.104.192 AP: DFHWBTTA SCSCPAA6 41 T 11:10:23.71 .6934 TRAD CICSUSER TO BRIDGE CWBA AP: TRADERPL }AAB }AAB B/}AAB SCSCPAA6 42 T 11:10:23.71 .6916 CWBA CICSUSER U WEB 9.24.104.192 AP: DFHWBTTA SCSCPAA6 43 T 11:10:25.48 .0120 TRAD CICSUSER TP BRIDGE CWBA AP: TRADERPL }AAB }AAB B/}AAB SCSCPAA6 44 T 11:10:25.48 .0105 CWXN CICSUSER U SOCKET 9.24.104.192 AP: DFHWBXN SCSCPAA6 45 T 11:14:11.37 52.5189 CWBA CICSUSER U WEB 9.24.104.192 AP: DFHWBTTA SCSCPAA6 46 T 11:13:18.86 .0135 CEMT CICSUSER TO BRIDGE CWBA AP: DFHEMTP }AAC }AAC B/}AAC SCSCPAA6 47 T 11:18:51.80 332.947CWBA CICSUSER U WEB 9.24.104.192 AP: DFHWBTTA SCSCPAA6 48 T 11:13:30.65 .0175CWBA CICSUSER U WEB 9.24.104.192 AP: DFHWBTTA SCSCPAA6 49 T 11:13:36.34 .0165CWBA CICSUSER U WEB 9.24.104.192 AP: DFHWBTTA SCSCPAA6 50 T 11:13:37.60 .0171CWBA CICSUSER U WEB 9.24.104.192 AP: DFHWBTTA SCSCPAA6 51 T 11:13:38.68 .0170CWBA CICSUSER U WEB 9.24.104.192 AP: DFHWBTTA SCSCPAA6 52 T 11:13:39.52 .0181CWBA CICSUSER U WEB 9.24.104.192 AP: DFHWBTTA SCSCPAA6 53 T 11:13:40.25 .0169CWBA CICSUSER U WEB 9.24.104.192 AP: DFHWBTTA SCSCPAA6 55 T 11:13:51.34 .0176 CWXN CICSUSER U SOCKET 9.24.104.153 AP: DFHWBXN SCSCPAA6 57 T 12:09:38.24 40.0885CWBA CICSUSER U WEB 9.24.104.153 AP: SHOWAPI SCSCPAA6 58 T 12:08:58.49 .3335CWBA CICSUSER U WEB 9.24.104.153 AP: SHOWAPI SCSCPAA6 59 T 12:09:11.52 1.8444CWBA CICSUSER U WEB 9.24.104.153 AP: SHOWAPI SCSCPAA6 60 T 12:09:17.81 .1636 CWXN CICSUSER U SOCKET 9.24.104.153 AP: DFHWBXN SCSCPAA6 61 T 12:10:03.14 20.4129CWBA CICSUSER U WEB 9.24.104.153 AP: SHOWAPI SCSCPAA6 62 T 12:09:42.93 .1986. . CWXN CICSUSER U SOCKET 9.24.104.153 AP: DFHWBXN SCSCPJA6 28402 T 12:10:08.92 .0626CWBA CICSUSER U WEB 9.24.104.153 AP: DFHADWB1 SCSCPJA6 28405 T 12:10:08.92 .0024 CWXN CICSUSER U SOCKET 9.24.104.153 AP: DFHWBXN SCSCPJA6 28403 T 12:10:08.92 .0264CWBA CICSUSER U WEB 9.24.104.153 AP: DFHADWB1 SCSCPJA6 28404 T 12:10:08.92 .0018 CWXN CICSUSER U SOCKET 9.24.104.153 AP: DFHWBXN SCSCPJA6 28407 T 12:10:08.96 .0035 CWBA CICSUSER U WEB 9.24.104.153 AP: DFHADWB1 SCSCPJA6 28408 T 12:10:08.96 .0016 CWXN CICSUSER U SOCKET 9.24.104.192 AP: DFHWBXN SCSCPJA6 29578 T 12:12:23.06 .0287 CWBA CICSUSER U WEB 9.24.104.192 AP: DFHWBTTA SCSCPJA6 29579 T 12:12:23.06 .0186 CEMT CICSUSER TO BRIDGE CWBA AP: DFHEMTP }AAB }AAB B/}AAB SCSCPJA6 29580 T 12:13:23.28 60.2362 . . V1R3M0 CICS Performance Analyzer Transaction Group - Summary __________________________________________________ TRGP0001 Printed at 16:26:12 11/06/2003 Data from 11:09:43 11/05/2003 to 12:22:19 11/05/2003 Page 9Grouping Web transactions Origin Average Average Average Average Average Average Average Average Average Type Transactions Response Dispatch CPU Time Suspend DispWait IR Wait RMI Susp FC Wait SO Wait BRIDGE 23 72.969 .000 .000 .073 .000 .000 .000 .000 .000 SOCKET 99 5.277 .000 .000 .005 .000 .000 .000 .000 .005 WEB 164 .148 .000 .000 .000 .000 .000 .000 .000 .000 ------------ -------- -------- -------- -------- -------- -------- -------- -------- -------- TOTAL 286 7.780 .000 .000 .008 .000 .000 .000 .000 .002 ********************************************************** Bottom of Data **********************************************************
262 CICS Performance Analyzer
after the last receive is handled by the same CWXN transaction. For the transaction group containing the transactions with task numbers 45 to 55, we see that a CEMT transaction was started in a bridge environment. CWXN is the first transaction in the group. The second transaction is the CWBA transaction with task number 46. This transaction links to program DFHWBTTA that then attaches the CEMT transaction with task number 47. Transactions 47 to 55 represent a conversation with the CEMT transaction. The last receive from the socket resulted in the CWBA transaction with number 55 that ended at 11:13:51.34. Twenty seconds later, at 11:14:22.37, the CWXN transaction ends because of the socket close time of 20 seconds.
For the SCSCPJA6 system, which has a SOCKETCLOSE value equal to zero, we see that the CWXN transaction is ending immediately, resulting in one CWXN and CWBA transaction per incoming request.
At the end of the report, we also receive a summary per origin type.
11.4 Tuning your CICS Web Support environmentThis section discusses how you can tune your CICS Web Support environment for better performance.
11.4.1 Storage consumption by CWXNAuthorized program analysis report (APAR) PQ33097 for CICS TS 1.3 explains that the default SOCKETCLOSE(NO) on the TCPIPSERVICE resource definition may lead to MAXTASK or SOS conditions. This APAR changes the default value for the HTTPNSSL TCPIPSERVICE definition in group DFH$SOT from NO to zero.
Let’s look at the storage consumption by the CWXN transaction. As a starting point, we use the CICS PA provided sample Report Forms USTORLST and SSTORLST. In the Report Forms screen, you can copy these forms to your own Report Forms data set by putting your cursor under the Samples option and selecting them from the resulting pop-up window. In your private data set, you can change them according to your needs. We decided to add the APPLID. As an example, we show the modified USTORLST in Figure 11-8.
Chapter 11. CICS Web Support and 3270 Bridge 263

Figure 11-8 Modified USTORLST Report Form
We ran two Performance List reports specifying these form names in the form field on the Performance List Report screen. For the Performance selection criteria, we chose to only have the report for the CWXN transaction. Figure 11-9 shows the result of the run with the USTORLST form.
Figure 11-9 CWXN user storage report
The number of GETMAINs and the high water marks for allocated storage in region SCSCPJA6 for CWXN are almost constant and low. In region SCSCPAA6, these numbers are
File Edit Confirm Upgrade Options Help ------------------------------------------------------------------------------ EDIT LIST Report Form - USTORLST Row 1 of 14 More: > Command ===> Scroll ===> CSR Description . . . User (Task) Storage Analysis Version (VRM): 620 Selection Criteria: Performance Field / Name + Type Description TRAN Transaction identifier APPLID CICS Generic APPLID TASKNO Transaction identification number STOP TIMET Task stop time SC24CGET CDSA GETMAINs below 16MB SC24CHWM CDSA HWM below 16MB SC24UGET UDSA GETMAINs below 16MB SC24UHWM UDSA HWM below 16MB SC31CGET ECDSA GETMAINs above 16MB SC31CHWM ECDSA HWM above 16MB SC31UGET EUDSA GETMAINs above 16MB SC31UHWM EUDSA HWM above 16MB EOR ---------------- End of Report ---------------- EOX ---------------- End of Extract ---------------
V1R3M0 CICS Performance Analyzer Performance List __________________________________________________ LIST0001 Printed at 8:30:39 11/07/2003 Data from 12:06:56 11/05/2003 Page 1 Transaction User (Task) Storage Analysis - Detail Tran APPLID TaskNo Stop SC24CGet SC24CHWM SC24UGet SC24UHWM SC31CGet SC31CHWM SC31UGet SC31UHWM Time CWXN SCSCPJA6 26877 12:06:56.546 0 0 0 0 3 5904 2 2064 ..CWXN SCSCPJA6 28402 12:10:08.921 0 0 0 0 3 5904 2 2064 CWXN SCSCPJA6 28407 12:10:08.964 0 0 0 0 3 5904 2 2064 CWXN SCSCPAA6 33 11:10:45.585 0 0 0 0 23 5248 17 34848 CWXN SCSCPAA6 45 11:14:11.365 0 0 0 0 24 5248 17 34848 CWXN SCSCPAA6 57 12:09:38.235 0 0 0 0 8 5248 7 34848 CWXN SCSCPAA6 61 12:10:03.137 0 0 0 0 3 5248 3 34848 CWXN SCSCPAA6 67 12:10:57.185 0 0 0 0 7 5248 7 34848 CWXN SCSCPJA6 29578 12:12:23.059 0 0 0 0 3 5904 2 2064 CWXN SCSCPJA6 29647 12:12:31.864 0 0 0 0 4 5904 2 2064 CWXN SCSCPJA6 29700 12:12:37.290 0 0 0 0 4 5904 2 2064
.
.
264 CICS Performance Analyzer

greater and related to the number of alias transactions that are attached for this run of CWXN. Figure 11-10 shows the equivalent report for shared storage usage.
Figure 11-10 CWXN shared storage report
You can see a similar trend here. The number of GETMAINs and storage high water marks are directly related to the number of CWBA transactions and to the SOCKETCLOSE value. Before coming to a conclusion, we should look at the CPU consumption of the CWXN transaction. Again, we used a CICS PA provided sample form, this time CPULST. We modified the USERID field to make it APPLID. Figure 11-11 shows the modified form.
Figure 11-11 Modified CPULST Report Form
V1R3M0 CICS Performance Analyzer Performance List __________________________________________________ LIST0001 Printed at 8:30:18 11/07/2003 Data from 12:06:56 11/05/2003 Page 1 Transaction Shared Storage Analysis - Detail Tran APPLID TaskNo Stop SC24SGet SC24GShr SC24GShr SC31SGet SC31GShr SC31FShr Time CWXN SCSCPJA6 26877 12:06:56.546 0 0 0 2 65536 32768 ..CWXN SCSCPJA6 28402 12:10:08.921 0 0 0 2 65536 32768
CWXN SCSCPJA6 28407 12:10:08.964 0 0 0 2 65536 32768 CWXN SCSCPAA6 33 11:10:45.585 0 0 0 9 294912 32768 CWXN SCSCPAA6 45 11:14:11.365 0 0 0 9 294912 32768 CWXN SCSCPAA6 57 12:09:38.235 0 0 0 4 131072 32768 CWXN SCSCPAA6 61 12:10:03.137 0 0 0 2 65536 32768 CWXN SCSCPAA6 67 12:10:57.185 0 0 0 4 131072 32768 CWXN SCSCPJA6 29578 12:12:23.059 0 0 0 2 65536 32768 CWXN SCSCPJA6 29647 12:12:31.864 0 0 0 2 65536 32768 CWXN SCSCPJA6 29700 12:12:37.290 0 0 0 2 65536 32768 ..
File Edit Confirm Upgrade Options Help ------------------------------------------------------------------------------ EDIT LIST Report Form - CPULST Row 1 of 16 More: > Command ===> Scroll ===> CSR Description . . . Transaction CPU Analysis Version (VRM): 620 Selection Criteria: Performance Field / Name + Type Description TRAN Transaction identifier APPLID CICS Generic APPLID TASKNO Transaction identification number STOP TIMET Task stop time RESPONSE Transaction response time DISPATCH TIME Dispatch time CPU TIME CPU time QRCPU TIME CICS QR TCB CPU time MSCPU TIME CICS TCBs CPU time ROCPU TIME CICS RO TCB CPU time KY8CPU TIME CICS Key 8 TCB CPU time J8CPU TIME CICS J8 TCB CPU time L8CPU TIME CICS L8 TCB dispatch time S8CPU TIME CICS S8 TCB CPU time
EOR ---------------- End of Report ----------------
Chapter 11. CICS Web Support and 3270 Bridge 265

Figure 11-12 shows the result of running a Performance List report with this form.
Figure 11-12 CWXN CPU consumption report
This report also shows longer response times for the SCSCPAA6 region because the socket does not close immediately. The value of the response time is dependent on the activity on the socket. The socket stays open for listening as long as requests come in within 20 seconds after the last receive. For SCSCPJA6, the response is dependent on the handling of a single request. Looking at the total CPU consumption, we see that the CPU time is relatively low. Most CPU time is used on the QR TCB, although some is spent on the SO TCB to handle the socket request. This CPU time is reported in the Miscellaneous CPU time field.
11.5 ConclusionSince CPU time is not directly involved, tuning your CICS Web Support environment means that you need to find an optimum balance. You need to find it between the number of CWXN transactions that you allow to exist concurrently and the storage they occupy. You also need to consider the overhead of starting a new CWXN transaction each time.
V1R3M0 CICS Performance Analyzer Performance List __________________________________________________ LIST0001 Printed at 11:03:51 11/07/2003 Data from 12:06:56 11/05/2003 Page 1 Transaction CICS TCB CPU Analysis - Detail Tran APPLID TaskNo Stop Response Dispatch User CPU QR CPU MS CPU RO CPU KY8 CPU J8 CPU L8 CPU S8 CPU Time Time Time Time Time Time Time Time Time Time Time CWXN SCSCPJA6 26877 12:06:56.546 .0248 .0011 .0009 .0006 .0004 .0000 .0000 .0000 .0000 .0000 CWXN SCSCPJA6 27109 12:07:18.932 .0283 .0012 .0010 .0006 .0004 .0000 .0000 .0000 .0000 .0000 CWXN SCSCPJA6 27388 12:07:51.458 .0148 .0011 .0009 .0006 .0003 .0000 .0000 .0000 .0000 .0000 ..CWXN SCSCPJA6 28402 12:10:08.921 .0626 .0009 .0007 .0004 .0003 .0000 .0000 .0000 .0000 .0000 CWXN SCSCPJA6 28407 12:10:08.964 .0035 .0009 .0008 .0005 .0003 .0000 .0000 .0000 .0000 .0000 CWXN SCSCPAA6 33 11:10:45.585 61.7739 .0527 .0079 .0049 .0030 Missing Missing .0000 .0000 .0000 CWXN SCSCPAA6 45 11:14:11.365 52.5189 .0066 .0056 .0049 .0007 Missing Missing .0000 .0000 .0000 CWXN SCSCPAA6 57 12:09:38.235 40.0885 .0033 .0028 .0022 .0005 Missing Missing .0000 .0000 .0000 CWXN SCSCPAA6 61 12:10:03.137 20.4129 .0033 .0017 .0013 .0004 Missing Missing .0000 .0000 .0000 CWXN SCSCPAA6 67 12:10:57.185 29.4945 .0030 .0022 .0020 .0002 Missing Missing .0000 .0000 .0000 CWXN SCSCPJA6 29578 12:12:23.059 .0287 .0012 .0011 .0006 .0004 .0000 .0000 .0000 .0000 .0000 CWXN SCSCPJA6 29647 12:12:31.864 .0259 .0011 .0009 .0006 .0003 .0000 .0000 .0000 .0000 .0000 CWXN SCSCPJA6 29700 12:12:37.290 .0221 .0012 .0009 .0006 .0003 .0000 .0000 .0000 .0000 .0000 ..
266 CICS Performance Analyzer

Chapter 12. Java applications in CICS
This chapter compares the performance of a sample CICS-provided Java application in an environment of resettable Java Virtual Machine (JVM) to its performance in an environment of a non-resettable JVM. It also demonstrates the performance advantages of using sharable application classpaths.
12
Note: The scenarios were used to provide situations that allow us to demonstrate the use of CICS Performance Analyzer (PA) reports. The CICS regions were not necessarily tuned for peak performance. In some cases, they had a high level of tracing active. Therefore, you should see these scenarios and the results provided for demonstration purposes only. They do not provide definitive results for a customer environment.
© Copyright IBM Corp. 2003. All rights reserved. 267
12.1 CICS and JavaYou can write Java application programs that use CICS services and execute under CICS control. CICS Transaction Server (TS) V2.2 supports three programming models. All three models are supported by the new Persistent Reusable JVM that executes under CICS control.
12.1.1 Java language programs in CICSCICS TS provides a Java class library called JCICS that covers many functions of the traditional EXEC CICS programming interface. The class library is shipped in a dfjcics.jar file. You can download it to your workstation for use in an Integrated Development Environment (IDE), such as WebSphere Studio Application Developer (WSAD). JCICS allows you to access CICS resources such as VSAM files, CICS transient data, and temporary storage queues. It also allows you to invoke other CICS programs and transactions.
Although these CICS Java programs run in a JVM environment, you invoke them the same way as other CICS programs written in procedural languages. You can invoke them as initial programs of a transaction through a transaction definition, through an EXEC CICS LINK or EXEC CICS XCTL with or without a COMMAREA, as a program that executes an EXEC CICS START TRANSACTION request, through APPC, through transient data queue triggering mechanism, and by all other available traditional means.
CICS TS V1.3 introduced CICS support of the Java language and the JCICS class library. they were further enhanced in CICS TS 1.3 by authorized program analysis report (APAR) PQ34321 to provide SQLJ and JDBC access to DB2 relational database.
12.1.2 Stateless CORBA objectsStateless CORBA objects are Java server applications that are invoked by a client application using the Internet Inter-ORB Protocol (IIOP). No state is maintained in object attributes between successful invocation of methods.
Inbound CORBA object communication was introduced in CICS TS V1.3. In CICS TS V2.2, CORBA objects can also make outbound IIOP calls. Therefore, they can behave as a client or as a server within the scope of an Object Transaction Service (OTS) distributed transaction.
Stateless CORBA objects can use JCICS API to interact with CICS.
12.1.3 Enterprise JavaBeansEnterprise JavaBeans (EJBs) are non-visual server-side components of a distributed transactional application that conform to Sun Microsystem’s Enterprise JavaBean Specification. CICS has implemented support for Version 1.1 level of this specification by mapping the interfaces defined in the specification to underlying CICS services.
You can develop Enterprise JavaBeans that use the JCICS class library to access CICS resources or programs directly. However, these applications are not portable to a non-CICS EJB run-time environment.
The EJB specification defines two types of Enterprise JavaBeans:
� Session beans: Encapsulate a session between a client and a server component. There are two varieties of session beans:
268 CICS Performance Analyzer

– Stateless session beans behave in a manner similar to Stateless CORBA Objects. That is, state data is not maintained between method invocations. Stateless session bean objects can handle multiple requests from multiple clients so sessions can be pooled. An OTS transaction cannot span though method invocations.
– Stateful session beans support multiple consecutive method invocations originating from the same client. The state data is maintained between method invocations. The bean object exists for the duration of a single client/server session and an OTS transaction can span multiple method invocations.
CICS fully supports both types of session beans. It is important to understand that a method invocation for both types of session beans maps to one CICS transaction, so the system behavior in both cases conforms to the CICS pseudo-conversational programming model.
� Entity beans: Usually encapsulate access to relational data. Entity beans are not supported by CICS TS. Relational data that usually resides in a local DB2 database can be accessed through JDBC or SQLJ interfaces.
Refer to Chapter 13, “Enterprise JavaBeans in CICS” on page 285, for further discussion.
12.2 Scenario descriptionThis scenario uses the CICS-provided sample transaction that accesses a temporary storage queue. This sample shows how to use the TSQ class. It consists of a single transaction, JTS1, which invokes a single Java class, TSQ.ClassOne. It also uses an auxiliary temporary storage queue. Refer to CICS Transaction Server for z/OS Java Applications in CICS, SC34-6000, which fully describes how to generate, set up and run this sample TSQ application.
Because the sample application uses only one single Java class, we found it necessary to download the application to a workstation and repackage it by adding one more class to the source of the program. We added the instantiation of the second class. This addition did not change anything in the execution logic of the sample program, but simply caused two classes to be loaded in the JVM instead of one. You can run the sample program DFJ$JTS1 by using the transaction code of JTS1. All definitions are provided by CICS in the DFH$JVM CSD group.
To run a Java program in a JVM environment, you need a PROGRAM definition that specifies this program to be a JVM program (JVM set to YES). You must also specify the name of the application class in the JVMCLASS parameter and point to a JVM properties file in the JVMPROFILE parameter. Figure 12-1 shows the relevant parameters from the DFH$JTS1 PROGRAM definition.
Chapter 12. Java applications in CICS 269

Figure 12-1 DFH$JTS1 PROGRAM definition
The JVMPROFILE parameter specifies the name of the profile that CICS is to use to provide the JVM characteristics. The profile is located as a member of a partitioned data set with DD-name DFHJVM. In this member, the three important parameters to check for this test are:
� JVMPROPS: Specifies the full path of the system properties file that resides in hierarchical file system (HFS) and that CICS is to use when creating a JVM. On our system, we have: JVMPROPS=/u/cicsts22/props/scscpj##/dfjjvmpr.props.
� CLASSPATH: Specifies the path to user applications. On our system, we have: CLASSPATH=/u/cicsls/:/usr/lpp/cicsts/cicsts22/samples.
� Xresettable: Specifies whether the JVM is eligible to be reused again for execution of other suitable JVM programs. In our test, we run with Xresettable=NO and Xresettable=YES.
We specify only the ibm.jvm.shareable.application.class.path property for this test, from the HFS jvm.properties file. If you use only the CLASSPATH in the profile in the DFHJVM data set, classes are reloaded from their HFS location each time the JVM is reused. Defining classes in the ibm.jvm.shareable.application.class.path system property provides additional optimization by caching the classes in the JVM. On our system, we have:
ibm.jvm.shareable.application.class.path=/u/cicsls/work/:/u/cicsls/samples/dfjcics/
Finally, there is one CICS system initialization parameter to be mentioned. MAXJVMTCBS specifies the maximum number of open task control blocks (TCBs) that CICS can create for use by JVM programs. We decided to run with the default value of 5.
In this test, we plan to perform three runs. A first run is with the Xresettable parameter set to NO so that for every JVM program execution, a new JVM has to be initialized. The second run should show the difference when running with Xresettable set to YES so that the JVM is initialized once and reused afterwards. During this run, we do not specify the ibm.jvm.shareable.application.class.path property. In the last run, we use cached classes by specifying the ibm.jvm.shareable.application.class.path property.
We used Teleprocessing Network Simulator (TPNS) to generate the workload for CICS. Fifty terminals were simulated that always start one and the same transaction. When transaction output is received, immediately a new transaction run was requested. The intention was to run the workload for about 15 minutes and take a sample of five minutes from the middle of the run.
OBJECT CHARACTERISTICS CICS RELEASE = 0620 CEDA View PROGram( DFJ$JTS1 ) + REMOTEName : Transid : EXECUtionset : Fullapi Fullapi | Dplsubset JVM ATTRIBUTES JVM : Yes No | Yes JVMClass : examples.TSQ.ClassOne : : : : JVMProfile : DFHJVMPR JAVA PROGRAM OBJECT ATTRIBUTES Hotpool : No No | Yes
SYSID=PJA6 APPLID=SCSCPJA6
270 CICS Performance Analyzer

12.3 Measuring JVM performanceThis section compares the transaction performance in resettable and non-resettable JVM environment.
12.3.1 Xresettable=NOAfter the SMF data sets were switched, we ran the Take-up facility on the SMF file. In CICS Performance Analyzer Primary Option Menu, we chose 1 to go to the Systems Definitions screen. On the Systems Definitions screen, we chose option 4 for the Take-up function. On the resulting screen, we entered the SMF records data set name and submitted the batch job. Figure 12-2 shows output from the take-up job.
Figure 12-2 Take-up output
Figure 12-3 shows the result of the take-up job on the Systems Definition screen. Because of the mix of systems and the amount of data, we decided to create a new data set containing only the records we were interested in. We used CICS PA Record Selection to do this.
On the Main Options screen, we selected 2 to go to the Report Sets screen. On the command line, we entered NEW JVM to create a new Report Set. We selected Record Selection in the Report category.
V1R3M0 17:02:50 10/14/2003 CICS Performance Analyzer Page 1 Take-up from SMF ________________ CPA2012I Processing started for SMF file SMFIN001 CPA2017I SMF records for System SC66 start at 10/14/2003 10:49:44.74 CPA2015I DB2 Accounting record found, DB2 SSID=D7Q2 Release=7.1 CPA2014I CMF record for CICS system found, APPLID=SCSCPAA1 Release=5.3.0 CPA2014I CMF record for CICS system found, APPLID=SCSCPTA1 Release=5.3.0 CPA2014I CMF record for CICS system found, APPLID=SCSCPTA2 Release=5.3.0 CPA2016I MVS System Logger record found, System=SC66LOGR CPA2014I CMF record for CICS system found, APPLID=SCSCPJA6 Release=6.2.0 CPA2014I CMF record for CICS system found, APPLID=SCSCLSA5 Release=6.2.0 CPA2014I CMF record for CICS system found, APPLID=SCSCPLA1 Release=6.2.0 CPA2014I CMF record for CICS system found, APPLID=SCSCPJA7 Release=6.2.0 CPA2014I CMF record for CICS system found, APPLID=SCSCPLA2 Release=6.2.0 CPA2014I CMF record for CICS system found, APPLID=SCSCPAME Release=6.2.0 CPA2013I Processing ended for SMF file SMFIN001 - 11 system(s) found CPA2000I Take-up processing has completed, RC=0
Chapter 12. Java applications in CICS 271

Figure 12-3 System added by the Take-up function
On the Report Selection Extract screen, we entered the APPLID and Image name as found during the take-up. We also entered the data set name that had to contain the subset of the SMF records, CICSLS2.JVM.FIRST.RUN, and specified 1 for the disposition to create a new data set. Since we planned to copy only records for transaction JTS1, we entered S next to the Performance selection criteria. Figure 12-4 shows the screen with its input.
Figure 12-4 Record selection: Defining the data set name
On the Performance Select Statement screen (Figure 12-5), we entered the field name TRAN and its value of JTS1. We also entered I to include this selection.
File Edit Filter View Options Help ------------------------------------------------------------------------------ System Definitions Row 1 from 16 Command ===> Scroll ===> CSR Select a System to edit its definition, SMF Files and Groups. SMF Files / System Type Image Description System
SCSCPJA6 CICS used for creating allfields SCSCPJA6 SCSCPJA6 CICS DFHAPPL EMP usage SCSCPJA6 SCSCPJA6 CICS EMP testing SCSCPJA6 SCSCLSA5 CICS JTS1 testing SCSCLSA5 SCSCLSA5 CICS JVM testing SCSCLSA5 SCSCPJA6 CICS used for export function SCSCPJA6 SC66 Image System added by take-up SC66 D7Q2 DB2 SC66 System added by take-up SC66 SCSCPAA1 CICS SC66 System added by take-up SC66 SCSCPTA1 CICS SC66 System added by take-up SC66 SCSCPTA2 CICS SC66 System added by take-up SC66 SC66LOGR Logger SC66 System added by take-up SC66 SCSCPJA6 CICS SC66 System added by take-up SC66 SCSCLSA5 CICS SC66 System added by take-up SC66 SCSCPLA1 CICS SC66 System added by take-up SC66
File Systems Options Help ------------------------------------------------------------------------------ JVM - Record Selection Extract Command ===> System Selection: CICS APPLID . . SCSCPJA6 + Image . . + Group . . + DB2 SSID . . . + Image . . + Group . . + MQ SSID . . . . + Image . . + Group . . + Extract Recap: DDname . . . RSEL0001 Output Data Set: Data Set Name . . 'CICSLS2.JVM.FIRST.RUN' Disposition . . . 1 1. OLD 2. MOD (If cataloged) Selection Criteria: s Performance
272 CICS Performance Analyzer

Figure 12-5 Record selection: Transaction ID selection
We submitted the batch job. Figure 12-6 shows the result.
Figure 12-6 Record selection batch job output
From now on, we use the data set CICSLS2.JVM.FIRST.RUN to produce our reports. We returned to the System Definitions screen where we selected our system entry to change the name of the SMF data set to the new data set that contains our subset of records. We easily selected the new data set name from the list of SMF data sets since its name was added to the list of SMF data sets by the Record Selection function.
Before running the first report, we chose a Report Form. We chose to use the CICS PA provided sample forms that are related to JVM. To bring these to our forms data set, on the CICS PA Primary Option Menu, we chose option 3 to go to the Report Forms screen. On this screen, we moved the cursor to the action bar under the Samples option and pressed Enter. We selected option 1 to populate the Report Forms data set with the sample forms (see Figure 12-7).
File Edit Object Lists Options Help ------------------------------------------------------------------------------ JVM - Performance Select Statement Row 1 of 3 More: > Command ===> Scroll ===> CSR Active --------------- Report Interval ---------------- Inc Start -------- From --------- --------- To ---------- Exc Stop MM/DD/YYYY HH:MM:SS.TH MM/DD/YYYY HH:MM:SS.TH ------------------------------------------------------------------------------ Inc Field --- Value or Range --- Object / Exc Name + Type Value/From To List + INC TRAN JTS1
V1R3M0 17:22:05 10/14/2003 CICS Performance Analyzer Page 4 End of File Record Counts __________________________________________________ DDname RecID Record Type Count Pct of Total SMFIN001 X'30' Performance Dictionary 2 0.01% X'31' Performance Class 7,012 21.07% X'51' CICS Statistics 17,954 53.95% X'58' MVS System Logger 2,052 6.17% X'65' DB2 Accounting 6,257 18.80% SMFIN001 Total 33,277 100.00% Total SMF Records 9,270
V1R3M0 CICS Performance Analyzer Record Selection Extract __________________________________________________ RSEL0001 Printed at 17:21:48 10/14/2003 Data from 12:48:55 10/14/2003 to 16:00:30 10/14/2003 Page 1 CPAORS01 Extract has completed successfully Data Set Name . . . . . CICSLS2.JVM.FIRST.RUN Record Counts: Performance Dictionary . 0 Performance Class . . 338 DB2 Accounting . . . . . 0 SMF Records . . . . . . . 18
Chapter 12. Java applications in CICS 273

Figure 12-7 Sample Report Forms pop-up screen
We scrolled down the list and selected the JVMLST and JVMSUM sample forms. We pressed F3 to return to our private Report Forms screen where we saw these forms included in the list.
We first produced the LIST report. We returned back to the Primary Option Menu, where we selected 2 to go the Report Set screen. On the Report Set screen, we entered NEW JVML to create a new Report Set. On the EDIT Report Set screen, we entered S next to the List option in the category Performance Reports. On the Performance List Report screen (Figure 12-8), we entered the APPLID and image name as generated by the take-up, specified to use the JVMLST Report Form, and entered a report title.
Figure 12-8 Performance List Report selections
Sample Report Forms Row 1 to 16 of 87 Command ===> Scroll ===> CSR Select one or more Sample Report Forms then press EXIT. Name Type Description ABNDLST LIST Transaction Abend List ABNDSUM SUMMARY Transaction Abend Summary BADCPU LISTX Top 20 Worst CPU Times BADFILE LISTX Top 20 Worst File Requests BADRESP LISTX Top 20 Worst Response Times BADRMI LISTX Top 20 Worst CICS RMI Times BADRMIRQ LISTX Top 20 Worst CICS RMI Requests BADSUSP LISTX Top 20 Worst Suspend Times BADTDQ LISTX Top 20 Worst Tdqueue Requests BADTSQ LISTX Top 20 Worst Tsqueue Requests BTSACLST LIST CICS BTS Activity - Overview BTSRQLST LIST CICS BTS Request Activity BTSRQSUM SUMMARY CICS BTS Request Activity COMMWLST LIST Transaction Comms Wait Analysis COMMWSUM SUMMARY Transaction Comms Wait Analysis CPULEXTR LIST CPU Analysis and Extract
File Systems Options Help ------------------------------------------------------------------------------ JVML - Performance List Report Command ===> System Selection: Report Output: APPLID . . SCSCPJA6 + DDname . . . . . . . . . LIST0001 Image . . SC66 + Print Lines per Page . . (1-255) Group . . + Report Format: Form . . . JVMLST + Title . . LIST report of JVM related fields Selection Criteria: Performance
274 CICS Performance Analyzer
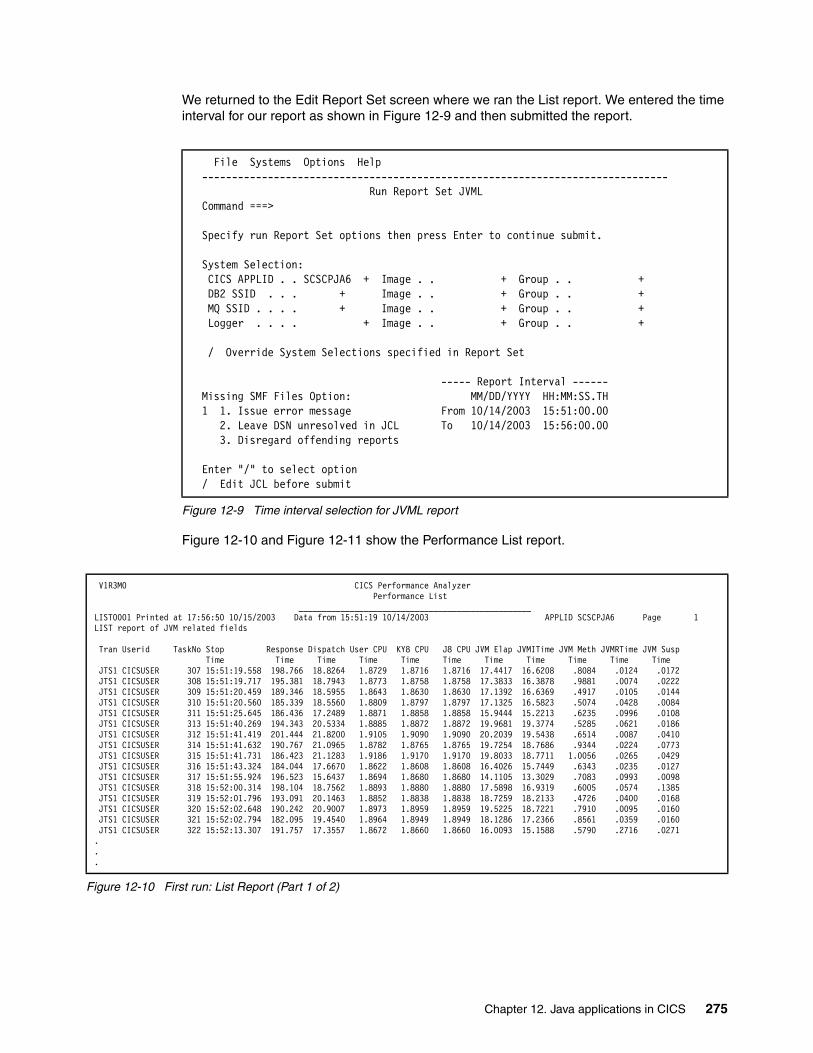
We returned to the Edit Report Set screen where we ran the List report. We entered the time interval for our report as shown in Figure 12-9 and then submitted the report.
Figure 12-9 Time interval selection for JVML report
Figure 12-10 and Figure 12-11 show the Performance List report.
Figure 12-10 First run: List Report (Part 1 of 2)
File Systems Options Help ------------------------------------------------------------------------------ Run Report Set JVML Command ===> Specify run Report Set options then press Enter to continue submit. System Selection: CICS APPLID . . SCSCPJA6 + Image . . + Group . . + DB2 SSID . . . + Image . . + Group . . + MQ SSID . . . . + Image . . + Group . . + Logger . . . . + Image . . + Group . . + / Override System Selections specified in Report Set ----- Report Interval ------ Missing SMF Files Option: MM/DD/YYYY HH:MM:SS.TH 1 1. Issue error message From 10/14/2003 15:51:00.00 2. Leave DSN unresolved in JCL To 10/14/2003 15:56:00.00 3. Disregard offending reports Enter "/" to select option / Edit JCL before submit
V1R3M0 CICS Performance Analyzer Performance List __________________________________________________ LIST0001 Printed at 17:56:50 10/15/2003 Data from 15:51:19 10/14/2003 APPLID SCSCPJA6 Page 1LIST report of JVM related fields Tran Userid TaskNo Stop Response Dispatch User CPU KY8 CPU J8 CPU JVM Elap JVMITime JVM Meth JVMRTime JVM Susp Time Time Time Time Time Time Time Time Time Time Time JTS1 CICSUSER 307 15:51:19.558 198.766 18.8264 1.8729 1.8716 1.8716 17.4417 16.6208 .8084 .0124 .0172 JTS1 CICSUSER 308 15:51:19.717 195.381 18.7943 1.8773 1.8758 1.8758 17.3833 16.3878 .9881 .0074 .0222 JTS1 CICSUSER 309 15:51:20.459 189.346 18.5955 1.8643 1.8630 1.8630 17.1392 16.6369 .4917 .0105 .0144 JTS1 CICSUSER 310 15:51:20.560 185.339 18.5560 1.8809 1.8797 1.8797 17.1325 16.5823 .5074 .0428 .0084 JTS1 CICSUSER 311 15:51:25.645 186.436 17.2489 1.8871 1.8858 1.8858 15.9444 15.2213 .6235 .0996 .0108 JTS1 CICSUSER 313 15:51:40.269 194.343 20.5334 1.8885 1.8872 1.8872 19.9681 19.3774 .5285 .0621 .0186 JTS1 CICSUSER 312 15:51:41.419 201.444 21.8200 1.9105 1.9090 1.9090 20.2039 19.5438 .6514 .0087 .0410 JTS1 CICSUSER 314 15:51:41.632 190.767 21.0965 1.8782 1.8765 1.8765 19.7254 18.7686 .9344 .0224 .0773 JTS1 CICSUSER 315 15:51:41.731 186.423 21.1283 1.9186 1.9170 1.9170 19.8033 18.7711 1.0056 .0265 .0429 JTS1 CICSUSER 316 15:51:43.324 184.044 17.6670 1.8622 1.8608 1.8608 16.4026 15.7449 .6343 .0235 .0127 JTS1 CICSUSER 317 15:51:55.924 196.523 15.6437 1.8694 1.8680 1.8680 14.1105 13.3029 .7083 .0993 .0098 JTS1 CICSUSER 318 15:52:00.314 198.104 18.7562 1.8893 1.8880 1.8880 17.5898 16.9319 .6005 .0574 .1385 JTS1 CICSUSER 319 15:52:01.796 193.091 20.1463 1.8852 1.8838 1.8838 18.7259 18.2133 .4726 .0400 .0168 JTS1 CICSUSER 320 15:52:02.648 190.242 20.9007 1.8973 1.8959 1.8959 19.5225 18.7221 .7910 .0095 .0160 JTS1 CICSUSER 321 15:52:02.794 182.095 19.4540 1.8964 1.8949 1.8949 18.1286 17.2366 .8561 .0359 .0160 JTS1 CICSUSER 322 15:52:13.307 191.757 17.3557 1.8672 1.8660 1.8660 16.0093 15.1588 .5790 .2716 .0271 ...
Chapter 12. Java applications in CICS 275

Figure 12-11 First run: List report (Part 2 of 2)
In a similar way, we created a Report Set JVMS that uses Report Form JVMSUM. On the Report Set screen, we chose the summary instead of the list. The Summary report produced is shown in Figure 12-12.
Figure 12-12 First run: Summary report
These reports show high values for dispatch time, JVM elapsed time and JVM initialization time and extremely high values for response time. The average times in the summary report are consistent with the individual values in the list report so that not a few deviating individual values impact the average values.
Most of the average JVM initialization time is going into the average JVM elapse time. Most of the average JVM elapse time is going into the average dispatch time so that we can say that the JVM initialization time is determining the dispatch time.
To find an explanation for the extreme high response time, we created a new summary Report Form that we called JVMDSP. We moved most dispatch fields that can give information about dispatch delays before the EOR indicator, as shown in Figure 12-13.
JTS1 CICSUSER 387 15:55:37.535 183.932 17.1542 1.8810 1.8794 1.8794 15.8741 15.1346 .6775 .0620 .0127 JTS1 CICSUSER 388 15:55:41.597 187.602 16.6716 1.8772 1.8758 1.8758 15.3292 14.6885 .6239 .0168 .0138 JTS1 CICSUSER 389 15:55:47.729 189.853 16.2151 1.8558 1.8544 1.8544 14.9242 14.4298 .4358 .0586 .0120 JTS1 CICSUSER 390 15:55:49.273 186.922 16.8655 1.8569 1.8555 1.8555 15.5751 15.0031 .5564 .0156 .0165 JTS1 CICSUSER 391 15:55:52.618 184.332 16.1689 1.8587 1.8573 1.8573 14.8589 14.1910 .6039 .0641 .0128 JTS1 CICSUSER 392 15:55:54.151 182.893 16.6036 1.8520 1.8506 1.8506 15.1766 14.5631 .5388 .0746 .0119 JTS1 CICSUSER 393 15:55:59.631 186.926 18.0197 1.8999 1.8985 1.8985 16.7013 15.9256 .7128 .0629 .0144 JTS1 CICSUSER 394 15:56:04.432 190.436 16.6919 1.8673 1.8659 1.8659 15.4022 14.7436 .6137 .0448 .0097 JTS1 CICSUSER 395 15:56:06.441 183.840 17.1584 1.8638 1.8624 1.8624 15.8751 15.1374 .6517 .0860 .0089 JTS1 CICSUSER 396 15:56:09.848 185.581 17.2203 1.8671 1.8657 1.8657 15.9127 15.3948 .4740 .0439 .0094 JTS1 CICSUSER 397 15:56:10.633 181.797 16.4699 1.8623 1.8610 1.8610 15.1900 14.6137 .5175 .0588 .0115 JTS1 CICSUSER 398 15:56:16.721 186.388 17.0783 1.8620 1.8606 1.8606 15.7856 14.9937 .7206 .0714 .0106 JTS1 CICSUSER 399 15:56:20.580 188.422 16.1362 1.8612 1.8598 1.8598 14.8551 14.2181 .5970 .0400 .0123 JTS1 CICSUSER 400 15:56:21.516 179.225 15.0624 1.8548 1.8534 1.8534 14.6987 13.8764 .7724 .0500 .0130 JTS1 CICSUSER 401 15:56:28.445 184.477 18.5827 1.8598 1.8585 1.8585 17.1340 16.5087 .5384 .0870 .0133 JTS1 CICSUSER 403 15:56:28.592 182.048 17.9307 1.8610 1.8596 1.8596 16.5542 15.9543 .5597 .0403 .0286 JTS1 CICSUSER 404 15:56:33.464 183.507 16.7237 1.8703 1.8689 1.8689 15.4031 14.6852 .6906 .0272 .0188 JTS1 CICSUSER 405 15:56:42.719 189.712 22.1165 1.8932 1.8916 1.8916 20.7884 19.9099 .8095 .0690 .0229 JTS1 CICSUSER 407 15:56:42.929 181.193 21.3748 1.8951 1.8935 1.8935 20.0321 19.0017 .9169 .1135 .0378 JTS1 CICSUSER 408 15:56:50.585 187.744 22.1169 1.8971 1.8957 1.8957 20.6553 20.0173 .6049 .0331 .0235 JTS1 CICSUSER 409 15:56:50.673 186.527 22.0545 1.8986 1.8971 1.8971 20.7277 20.0106 .7095 .0076 .0246 JTS1 CICSUSER 410 15:56:53.288 187.928 19.8079 1.8883 1.8870 1.8870 18.5421 17.9332 .5782 .0308 .0160 JTS1 CICSUSER 411 15:57:01.354 189.117 18.6154 1.8723 1.8709 1.8709 18.2632 17.6115 .6381 .0135 .0192
V1R3M0 CICS Performance Analyzer Performance Summary __________________________________________________ SUMM0001 Printed at 18:22:38 10/15/2003 Data from 15:48:00 10/14/2003 to 15:57:01 10/14/2003 Page 1SUMMARY report of JVM related fields Avg Avg Avg Avg Avg Avg Avg Avg Avg Avg Avg Avg Tran #Tasks Response Dispatch User CPU Suspend DispWait KY8 CPU J8 CPU JVM Elap JVMITime JVM Meth JVMRTime JVM Susp Time Time Time Time Time Time Time Time Time Time Time Time JTS1 95 187.091 18.3475 1.8681 168.743 .0037 1.8667 1.8667 17.0962 16.4318 .6062 .0582 .0205
276 CICS Performance Analyzer

Figure 12-13 Report Form with dispatcher delay fields
When we ran the JVMS Report Set with this form, we received the report shown in Figure 12-14.
Figure 12-14 First run: Summary report with dispatch delay information
From this report, we see that the first dispatch wait time is almost zero which means that there are no problems for the CICS dispatcher to accept and initiate new entered transactions.
Most of the dispatch delay time is spent on MAXJTDly. This means that we are waiting for a JVM TCB to initialize a new JVM. For a better understanding of what is happening, we decided to make one more list form to print the individual transaction information starting from the beginning of our test run. The form was called JVMBEGIN. It contained the fields that distinguish the individual transactions such as terminal ID and task number plus the dispatch and JVM fields that we were using already. We ran the JVML Report Set with the JVMBEGIN Report Form. In the JVML Report Set, we changed the starting time to the time we started our test run. Figure 12-15 shows the JVMBEGIN Report Form.
File Edit Confirm Upgrade Options Help ------------------------------------------------------------------------------ EDIT SUMMARY Report Form - JVMDSP Row 1 of 191 More: > Command ===> Scroll ===> CSR Description . . . Summary Report Form Version (VRM): 620 Selection Criteria: Performance Field / Name + S Type Fn Description TRAN A Transaction identifier RESPONSE AVE Transaction response time DISPATCH TIME AVE Dispatch time CPU TIME AVE CPU time SUSPEND TIME AVE Suspend time DSPDELAY TIME AVE First dispatch wait time DISPWAIT TIME AVE Redispatch wait time MAXJTDLY TIME AVE Maximum JVM TCB delay time MAXOTDLY TIME AVE MAXOPENTCBS wait time EOR ---------------- End of Report ----------------
V1R3M0 CICS Performance Analyzer Performance Summary __________________________________________________ SUMM0001 Printed at 10:19:11 10/16/2003 Data from 15:48:00 10/14/2003 to 15:57:01 10/14/2003 Page 1SUMMARY report of dispatcher wait fields Avg Avg Avg Avg Avg Avg Avg Avg Tran Response Dispatch User CPU Suspend Disp1Dly DispWait MaxJTDly MaxOTDly Time Time Time Time Time Time Time Time JTS1 187.091 18.3475 1.8681 168.743 .0001 .0037 168.723 .0000
Chapter 12. Java applications in CICS 277

Figure 12-15 JVMBEGIN Report Form
Figure 12-16 and Figure 12-17 show the resulting list report.
Figure 12-16 Individual transaction report from the beginning of the first run (Part 1 of 2)
File Edit Confirm Upgrade Options Help ------------------------------------------------------------------------------ EDIT LIST Report Form - JVMBEGIN Row 1 of 216 More: > Command ===> Scroll ===> CSR Description . . . List Report Form Version (VRM): 620 Selection Criteria: Performance Field / Name + Type Description TRAN Transaction identifier TERM Terminal ID TASKNO Transaction identification number START TIMET Task start time STOP TIMET Task stop time RESPONSE Transaction response time DISPATCH TIME Dispatch time DSPDELAY TIME First dispatch wait time DISPWAIT TIME Redispatch wait time SUSPEND TIME Suspend time MAXJTDLY TIME Maximum JVM TCB delay time JVMITIME TIME JVM initialize elapsed time JVMTIME TIME JVM elapsed time JVMSUSP TIME JVM suspend time
EOR ---------------- End of Report ----------------
V1R3M0 CICS Performance Analyzer Performance List __________________________________________________ LIST0001 Printed at 14:16:12 10/16/2003 Data from 15:41:49 10/14/2003 APPLID SCSCPJA6 Page 1LIST report of JVM related fields Tran Term TaskNo Start Stop Response Dispatch Disp1Dly DispWait Suspend MaxJTDly JVMITime JVM Elap JVM Susp Time Time Time Time Time Time Time Time Time Time Time JTS1 <ATJ 103 15:41:59.761 15:42:15.790 16.0285 16.0173 .0000 .0015 .0112 .0000 14.1832 14.7076 .0111 JTS1 <AY1 105 15:42:00.746 15:42:18.238 17.4924 17.4778 .0000 .0018 .0146 .0000 15.5917 16.1565 .0142 JTS1 <ATK 107 15:42:01.748 15:42:20.945 19.1964 19.1788 .0000 .0026 .0176 .0000 17.3058 17.8617 .0167 JTS1 <AY2 109 15:42:02.757 15:42:21.786 19.0292 19.0186 .0000 .0013 .0106 .0000 17.2687 17.7436 .0104 JTS1 <ATL 111 15:42:03.762 15:42:22.875 19.1138 19.0988 .0000 .0016 .0150 .0000 17.9410 18.7526 .0148 JTS1 <AY3 113 15:42:04.758 15:42:33.262 28.5035 17.4765 .0000 .0020 11.0270 11.0013 15.5605 16.1583 .0251 JTS1 <ATM 115 15:42:05.758 15:42:33.916 28.1582 15.7007 .0000 .0012 12.4576 12.4488 13.9661 14.3831 .0087 JTS1 <AY4 117 15:42:06.760 15:42:37.523 30.7634 16.5983 .0000 .0019 14.1652 14.1542 14.5251 15.1652 .0103 JTS1 <ATN 119 15:42:07.748 15:42:40.135 32.3870 18.3713 .0000 .0014 14.0157 14.0056 16.4651 16.9884 .0099 JTS1 <AY5 121 15:42:08.756 15:42:43.358 34.6024 20.5058 .0000 .0036 14.0965 14.0826 18.3485 18.9835 .0126 JTS1 <ATO 123 15:42:09.763 15:42:52.729 42.9667 19.4886 .0000 .0013 23.4780 23.4680 17.4390 18.2016 .0098 JTS1 <AY6 125 15:42:10.757 15:42:52.985 42.2277 19.0774 .0000 .0021 23.1502 23.1326 17.0032 17.7249 .0171 JTS1 <ATP 127 15:42:11.759 15:42:55.666 43.9066 18.1683 .0000 .0007 25.7383 25.7276 16.1772 16.8472 .0104 JTS1 <AY7 129 15:42:12.759 15:42:57.271 44.5112 17.1444 .0000 .0044 27.3668 27.3490 15.1047 15.6631 .0172 JTS1 <ATQ 131 15:42:13.766 15:43:05.644 51.8780 22.3815 .0000 .0012 29.4966 29.4853 20.2288 20.9829 .0111JTS1 <AY8 133 15:42:14.761 15:43:09.838 55.0773 17.1266 .0000 .0013 37.9507 37.9373 15.3727 15.8300 .0133
JTS1 <ATR 135 15:42:15.770 15:43:10.282 54.5118 17.3224 .0000 .0011 37.1894 37.1807 15.2967 15.9304 .0087 JTS1 <ATJ 137 15:42:16.196 15:43:13.619 57.4222 17.9335 .0000 .0018 39.4887 39.4699 16.1013 16.6822 .0187 JTS1 <AY9 138 15:42:16.739 15:43:14.768 58.0286 17.5202 .0000 .0013 40.5084 40.4988 15.6395 16.0798 .0094 JTS1 <ATS 140 15:42:17.757 15:43:24.468 66.7109 18.8492 .0000 .0022 47.8617 47.8489 16.8744 17.4438 .0127 JTS1 <AZA 143 15:42:18.738 15:43:26.848 68.1101 16.5890 .0000 .0025 51.5211 51.5077 14.6976 15.2677 .0133 JTS1 <AY1 142 15:42:18.647 15:43:27.161 68.5139 17.3103 .0000 .0040 51.2036 51.1911 15.3484 15.8451 .0121 JTS1 <ATT 145 15:42:19.763 15:43:30.454 70.6911 16.8550 .0000 .0027 53.8361 53.8219 15.0556 15.5081 .0138
278 CICS Performance Analyzer

Figure 12-17 Individual transaction report from the beginning of the first run (Part 2 of 2)
In this report, in the Suspend Time column, we see that the first five transactions start almost immediately. They have a MAXJTDLY of zero, MAXJTDLY being the elapsed time during which the user task waited to obtain a CICS JVM TCB, because the CICS system had reached the limit set by the system parameter, MAXJVMTCBS. The sixth transaction, with task number 113, entered the system at 15:42:04. It could not run immediately because there was no JVM TCB available. It was suspended until the first transaction frees a JVM TCB. The first transaction, with task number 103, stopped at 15:42:15 and has a dispatch time of 16 seconds. Transaction 113 was started 5 seconds after transaction 103, so it needed to wait 11seconds before a JVM TCB became available. This is reflected in the total suspend and the MAXJTDLY times. We see the next group of five transactions. Transactions 113 to 121 have suspend times between 11 and 14 seconds and the third group, and transactions 123 to 131 have times between 23 and 29 seconds.
TPNS is starting up to 50 transactions. When a transaction returns an output, immediately another is initiated from the same terminal. The first transaction stopped at 15:42:15.790. We can see that TPNS immediately initiated a new transaction, with number 137, from the same terminal, <ATJ, at 15:42:16.196. We initiated some new work before all 50 terminals each initiated a transaction. This explains why the MAXJTDLY suspend time is going up slowly. It also explains why it takes time to reach a point where the values of average response time, average dispatch time, and average suspend stabilize to the values as shown in Figure 12-12 on page 276.
12.3.2 Xresettable=YESKnowing that JVM initialization is a time consuming operation, we decided not to increase the MAXJVMTCBS from its default value of 5 to a higher value. Instead we preferred to make a test run with Xresettable=YES in the CICS system properties file in the DFHJVM data set.
JTS1 <AZB 147 15:42:20.759 15:43:31.498 70.7389 16.7471 .0000 .0015 53.9918 53.9816 15.8321 16.4265 .0101 JTS1 <ATK 149 15:42:21.356 15:43:40.574 79.2185 16.0536 .0000 .0097 63.1648 63.1118 13.9050 14.5561 .0521 JTS1 <ATU 150 15:42:21.757 15:43:44.808 83.0517 17.9742 .0000 .0036 65.0775 65.0601 15.7474 16.5692 .0163 JTS1 <AY2 152 15:42:22.199 15:43:44.912 82.7130 17.7223 .0000 .0101 64.9908 64.9612 15.5117 16.3978 .0288
JTS1 <AZC 153 15:42:22.760 15:43:47.375 84.6149 16.9341 .0000 .0022 67.6808 67.6632 15.1007 15.5919 .0168 JTS1 <ATL 155 15:42:23.312 15:43:48.804 85.4917 17.2923 .0000 .0031 68.1994 68.1858 15.4679 15.9823 .0135 JTS1 <ATV 156 15:42:23.759 15:43:58.140 94.3809 17.5854 .0000 .0020 76.7955 76.7770 15.4626 16.1596 .0181 JTS1 <AZE 162 15:42:26.745 15:44:02.407 95.6628 15.0666 .0000 .0011 80.5962 80.5845 13.9857 14.6860 .0116 JTS1 <AZD 158 15:42:24.757 15:44:02.986 98.2299 18.1984 .0000 .0027 80.0315 80.0097 15.9231 16.6747 .0217 JTS1 <ATW 160 15:42:25.760 15:44:03.212 97.4517 18.2931 .0000 .0071 79.1586 79.1230 15.8782 16.7777 .0355 JTS1 <ATX 164 15:42:27.739 15:44:05.818 98.0785 17.0301 .0000 .0019 81.0484 81.0345 15.9681 16.6863 .0134 JTS1 <AZF 166 15:42:28.755 15:44:13.643 104.888 15.5275 .0000 .0017 89.3605 89.3476 13.5863 14.1524 .0125 JTS1 <ATY 168 15:42:29.747 15:44:17.282 107.535 14.8835 .0000 .0049 92.6516 92.6247 12.8518 13.4025 .0258 JTS1 <AZG 170 15:42:31.121 15:44:20.286 109.165 17.3059 .0000 .0029 91.8597 91.8373 15.4121 15.9350 .0223 JTS1 <ATZ 172 15:42:31.927 15:44:20.493 108.566 17.2903 .0000 .0026 91.2762 91.2492 15.3763 15.9936 .0268 JTS1 <AZH 174 15:42:32.743 15:44:21.324 108.581 15.6221 .0000 .0012 92.9591 92.9499 13.5472 13.9543 .0090 JTS1 <AY3 176 15:42:33.666 15:44:29.774 116.107 16.1125 .0000 .0029 99.9948 99.9768 14.1806 14.8695 .0176 JTS1 <AT0 177 15:42:33.767 15:44:32.260 118.492 15.0124 .0000 .0012 103.480 103.471 12.8444 13.5104 .0089 JTS1 <ATM 179 15:42:34.331 15:44:36.991 122.660 16.6635 .0000 .0076 105.996 105.955 15.7164 16.4126 .0415 JTS1 <AZI 180 15:42:34.757 15:44:38.908 124.151 18.4587 .0000 .0020 105.692 105.680 16.2398 17.1398 .0113 JTS1 <AT1 182 15:42:35.760 15:44:39.004 123.244 17.6886 .0000 .0062 105.555 105.533 15.7903 16.3863 .0226 JTS1 <AZJ 184 15:42:36.765 15:44:48.442 131.676 18.6934 .0000 .0018 112.983 112.970 16.7547 17.3272 .0121 JTS1 <AT2 186 15:42:37.743 15:44:50.360 132.616 18.1282 .0000 .0019 114.488 114.477 16.1530 16.7351 .0103 JTS1 <AY4 188 15:42:37.933 15:44:52.680 134.746 15.6761 .0000 .0023 119.070 119.057 13.6271 14.2751 .0127 JTS1 <AZK 189 15:42:38.758 15:45:03.859 145.101 24.3526 .0000 .1910 120.748 120.113 20.3747 23.4196 .6353 JTS1 <AT3 191 15:42:39.757 15:45:04.319 144.562 24.6981 .0000 .0768 119.864 119.208 20.3491 23.5709 .6551 JTS1 <ATN 193 15:42:40.542 15:45:06.600 146.058 18.1472 .0000 .0013 127.910 127.900 17.1694 17.7405 .0106 JTS1 <AZL 194 15:42:40.754 15:45:11.991 151.237 21.6495 .0098 .0031 129.588 129.563 19.7868 20.3310 .0131 JTS1 <AT4 196 15:42:41.759 15:45:12.405 150.645 19.7419 .0000 .0125 130.903 130.882 18.8474 19.4218 .0212 JTS1 <AZM 198 15:42:42.756 15:45:23.594 160.837 19.7515 .0000 .0027 141.086 141.072 17.3596 18.1339 .0133 JTS1 <AY5 202 15:42:43.761 15:45:23.670 159.908 19.2944 .0000 .0176 140.614 140.558 17.2281 18.0755 .0560
Chapter 12. Java applications in CICS 279

As in the first run, we used the Take-up facility after we switched SMF data sets. We used the record selection facility again to write the JTS1 only records to a separate data set with name CICSLS2.JVM.SECOND.RUN.
For the first two reports, we used the same Report Forms and Report Sets as for the first run. The list produced with the JVML Report Set using the JVMLST Report Form is shown in Figure 12-18.
Figure 12-18 Second run: List report
Using the JVMS Report Set in combination with the JVMSUM Report Form produced the output shown in Figure 12-19.
V1R3M0 CICS Performance Analyzer Performance List __________________________________________________ LIST0001 Printed at 15:50:27 10/16/2003 Data from 18:02:00 10/14/2003 APPLID SCSCPJA6 Page 1
LIST report of JVM related fields Tran Userid TaskNo Stop Response Dispatch User CPU KY8 CPU J8 CPU JVM Elap JVMITime JVM Meth JVMRTime JVM Susp Time Time Time Time Time Time Time Time Time Time Time JTS1 CICSUSER 2249 18:02:00.014 .3887 .0398 .0208 .0195 .0195 .0926 .0000 .0902 .0024 .0532 JTS1 CICSUSER 2250 18:02:00.162 .5055 .0407 .0171 .0158 .0158 .2227 .0001 .2201 .0025 .1823 JTS1 CICSUSER 2252 18:02:00.171 .4986 .0379 .0156 .0143 .0143 .2045 .0000 .1984 .0061 .1669 JTS1 CICSUSER 2251 18:02:00.172 .5070 .0406 .0130 .0118 .0118 .2205 .0000 .2185 .0020 .1802 JTS1 CICSUSER 2253 18:02:00.202 .5134 .0376 .0136 .0123 .0123 .2314 .0000 .2294 .0020 .1941 JTS1 CICSUSER 2254 18:02:00.215 .5077 .1569 .0134 .0122 .0122 .1999 .0000 .1969 .0031 .0434 JTS1 CICSUSER 2255 18:02:00.277 .5304 .0339 .0132 .0120 .0120 .1148 .0000 .1130 .0018 .0813 JTS1 CICSUSER 2257 18:02:00.284 .4727 .0349 .0128 .0116 .0116 .1122 .0000 .1097 .0025 .0776 JTS1 CICSUSER 2258 18:02:00.304 .4924 .0347 .0130 .0118 .0118 .1009 .0000 .0988 .0021 .0665 JTS1 CICSUSER 2259 18:02:00.322 .5105 .0341 .0134 .0119 .0119 .1068 .0000 .1039 .0029 .0730 JTS1 CICSUSER 2256 18:02:00.332 .5742 .0911 .0532 .0520 .0520 .1611 .0000 .1593 .0018 .0703 JTS1 CICSUSER 2260 18:02:00.363 .4321 .0455 .0127 .0115 .0115 .0851 .0000 .0835 .0017 .0401 JTS1 CICSUSER 2261 18:02:00.378 .4411 .0412 .0132 .0118 .0118 .0932 .0000 .0915 .0018 .0524 JTS1 CICSUSER 2262 18:02:00.386 .2422 .0355 .0123 .0111 .0111 .0819 .0000 .0792 .0027 .0468 JTS1 CICSUSER 2263 18:02:00.398 .2502 .0309 .0124 .0112 .0112 .0750 .0000 .0724 .0026 .0444 JTS1 CICSUSER 2264 18:02:00.416 .2689 .0319 .0128 .0115 .0115 .0835 .0000 .0812 .0023 .0518 ...JTS1 CICSUSER 15601 18:06:59.730 .1975 .0331 .0128 .0114 .0114 .1070 .0000 .1053 .0016 .0743
JTS1 CICSUSER 15602 18:06:59.742 .2091 .0331 .0114 .0102 .0102 .0708 .0000 .0691 .0017 .0381 JTS1 CICSUSER 15603 18:06:59.754 .2207 .0407 .0121 .0109 .0109 .0742 .0000 .0724 .0018 .0338 JTS1 CICSUSER 15604 18:06:59.765 .2320 .0456 .0120 .0109 .0109 .0814 .0000 .0796 .0017 .0361 JTS1 CICSUSER 15605 18:06:59.774 .1871 .0390 .0124 .0111 .0111 .0778 .0000 .0758 .0020 .0392 JTS1 CICSUSER 15606 18:06:59.794 .1776 .0516 .0110 .0099 .0099 .0644 .0000 .0628 .0016 .0133 JTS1 CICSUSER 15607 18:06:59.820 .1940 .0542 .0119 .0107 .0107 .0777 .0000 .0759 .0018 .0243 JTS1 CICSUSER 15608 18:06:59.858 .2206 .0628 .0127 .0112 .0112 .1025 .0000 .1004 .0022 .0407 JTS1 CICSUSER 15609 18:06:59.872 .1986 .0598 .0121 .0109 .0109 .1063 .0000 .1040 .0022 .0468 JTS1 CICSUSER 15610 18:06:59.875 .1999 .0512 .0122 .0110 .0110 .1011 .0000 .0991 .0020 .0505 JTS1 CICSUSER 15612 18:06:59.883 .1760 .0308 .0119 .0106 .0106 .0623 .0000 .0594 .0029 .0318 JTS1 CICSUSER 15611 18:06:59.887 .1890 .0367 .0117 .0104 .0104 .0927 .0001 .0903 .0023 .0563 JTS1 CICSUSER 15613 18:06:59.932 .2150 .0416 .0113 .0103 .0103 .0731 .0000 .0700 .0031 .0325 JTS1 CICSUSER 15615 18:06:59.964 .2072 .0720 .0117 .0104 .0104 .0880 .0000 .0848 .0032 .0166 JTS1 CICSUSER 15617 18:07:00.126 .3510 .2003 .0124 .0112 .0112 .2385 .0000 .1305 .1080 .0386 JTS1 CICSUSER 15614 18:07:00.140 .4027 .1049 .0124 .0113 .0113 .2661 .0000 .2644 .0016 .1614 JTS1 CICSUSER 15616 18:07:00.144 .3776 .0980 .0123 .0112 .0112 .2609 .0000 .2592 .0017 .1632 JTS1 CICSUSER 15618 18:07:00.147 .3311 .0551 .0122 .0110 .0110 .2146 .0000 .2125 .0022 .1599 JTS1 CICSUSER 15619 18:07:00.154 .2185 .0329 .0123 .0109 .0109 .1893 .0000 .1874 .0018 .1573 JTS1 CICSUSER 15620 18:07:00.173 .2042 .0298 .0122 .0108 .0108 .0460 .0000 .0442 .0018 .0165 JTS1 CICSUSER 15621 18:07:00.194 .2173 .0430 .0110 .0101 .0101 .0532 .0000 .0517 .0015 .0105 JTS1 CICSUSER 15622 18:07:00.226 .2360 .0523 .0121 .0109 .0109 .0813 .0000 .0796 .0017 .0293 JTS1 CICSUSER 15623 18:07:00.234 .2359 .0574 .0122 .0109 .0109 .0862 .0000 .0844 .0018 .0293 JTS1 CICSUSER 15624 18:07:00.243 .2442 .0530 .0119 .0108 .0108 .0888 .0000 .0867 .0020 .0361
280 CICS Performance Analyzer

Figure 12-19 Second run: Summary report
When we compare the report in Figure 12-19 with the report in Figure 12-12 on page 276, we immediately see the positive effect of resettable JVM. The transaction rate went from 19 transactions per minute to 2675 transactions per minute. Response time dropped from 187 seconds to .38 seconds. We see also that for a reused JVM, the initialization time became zero. Note that we use here a subset of five minutes that excludes the JVM initialization of the first five transactions.
However, in the summary report, we still see that the Avg Suspend Time still makes up the biggest part of the response time. We run again the JVMS Report Set with the JVMDSP Report Form. The result is shown in Figure 12-20.
Figure 12-20 Second run: Summary report with dispatch delay information
We see that there is still a delay in availability of JVM TCBs. Our next attempt to improve performance is to specify the ibm.jvm.shareable.application.class.path property in the HFS properties file.
12.3.3 Using the sharable application classpathFor this run, we used the same Report Forms and Report Sets as for the previous runs. We only changed the SMF data set name in the systems definition and the date and time interval when submitting the print jobs. Again, we used a time interval of five minutes, not including the start or end of the test period.
Here we show only the output of the summary reports. Figure 12-21 shows the summary report using the sample provided JVMSUM Report Form. This first summary report shows that, by caching the used classes, we could increase the throughput to 3431 transactions per minute. We also see that all measured CPU values decreased as well as almost all elapsed time values.
V1R3M0 CICS Performance Analyzer Performance Summary __________________________________________________ SUMM0001 Printed at 16:06:45 10/16/2003 Data from 18:01:59 10/14/2003 to 18:07:00 10/14/2003 Page 1SUMMARY report of dispatcher wait fields Avg Avg Avg Avg Avg Avg Avg Avg Avg Avg Avg Avg Tran #Tasks Response Dispatch User CPU Suspend DispWait KY8 CPU J8 CPU JVM Elap JVMITime JVM Meth JVMRTime JVM Susp Time Time Time Time Time Time Time Time Time Time Time Time JTS1 13376 .3839 .0530 .0130 .3309 .0110 .0117 .0117 .1115 .0000 .1084 .0031 .0589
V1R3M0 CICS Performance Analyzer Performance Summary __________________________________________________ SUMM0001 Printed at 16:49:25 10/16/2003 Data from 18:01:59 10/14/2003 to 18:07:00 10/14/2003 Page 1SUMMARY report of dispatcher wait fields Avg Avg Avg Avg Avg Avg Avg Avg Tran Response Dispatch User CPU Suspend Disp1Dly DispWait MaxJTDly MaxOTDly Time Time Time Time Time Time Time Time JTS1 .3839 .0530 .0130 .3309 .0001 .0110 .2715 .0000
Chapter 12. Java applications in CICS 281

Figure 12-21 Third run: JVMS + JVMSUM
Figure 12-22 shows the report using the JVMDSP Report Form that we created ourselves including the time waiting for a JVM to become available. The second Summary report shows that there is still a 50 milliseconds queuing delay time on the MAXJVMTCBS number of TCBs. In the last run, we decided to see the effect of allocating one more TCB. With the CEMT SET DISPATCH command, we changed the number of MAXJVMTCBS to six and launched a new TPNS workload.
Figure 12-22 Third run: JVMS + JVMDSP
Figure 12-23 and Figure 12-24 show the two summary reports.
Figure 12-23 Final run: JVMS + JVMSUM
The report shows that all values, compared to the previous report, are more or less the same. Only the MAXJTDLY time went down from .0558 to .0487, due to one additional TCB for running JVM programs. Increasing the number of JVM TCBs does not change to the performance of the running JVM program. Given the type of workload introduced by TPNS, where a new transaction is immediately initiated when the previous one terminates, it is difficult to eliminate the delay time on the JVM TCBs as long as the number of TCBs does not reach, or is equal to, the number of simulated terminals in TPNS.
V1R3M0 CICS Performance Analyzer Performance Summary __________________________________________________ SUMM0001 Printed at 10:18:50 10/17/2003 Data from 17:54:59 10/16/2003 to 18:00:02 10/16/2003 Page 1SUMMARY report of dispatcher wait fields Avg Avg Avg Avg Avg Avg Avg Avg Avg Avg Avg Avg Tran #Tasks Response Dispatch User CPU Suspend DispWait KY8 CPU J8 CPU JVM Elap JVMITime JVM Meth JVMRTime JVM Susp Time Time Time Time Time Time Time Time Time Time Time Time JTS1 17157 .1220 .0103 .0071 .1116 .0052 .0059 .0059 .0654 .0000 .0632 .0022 .0555
V1R3M0 CICS Performance Analyzer Performance Summary __________________________________________________ SUMM0001 Printed at 10:19:11 10/17/2003 Data from 17:54:59 10/16/2003 to 18:00:02 10/16/2003 Page 1SUMMARY report of dispatcher wait fields Avg Avg Avg Avg Avg Avg Avg Avg Tran Response Dispatch User CPU Suspend Disp1Dly DispWait MaxJTDly MaxOTDly Time Time Time Time Time Time Time Time JTS1 .1220 .0103 .0071 .1116 .0001 .0052 .0558 .0000
V1R3M0 CICS Performance Analyzer Performance Summary __________________________________________________ SUMM0001 Printed at 11:36:13 10/17/2003 Data from 11:14:59 10/17/2003 to 11:19:59 10/17/2003 Page 1SUMMARY report of dispatcher wait fields Avg Avg Avg Avg Avg Avg Avg Avg Avg Avg Avg Avg Tran #Tasks Response Dispatch User CPU Suspend DispWait KY8 CPU J8 CPU JVM Elap JVMITime JVM Meth JVMRTime JVM Susp Time Time Time Time Time Time Time Time Time Time Time Time JTS1 17138 .1256 .0097 .0068 .1160 .0063 .0056 .0056 .0761 .0000 .0740 .0021 .0669
282 CICS Performance Analyzer

Figure 12-24 Final run: JVMS + JVMDSP
12.4 ConclusionThe CICS PA reports that we produced with this scenario confirm that the initiation of a JVM is an expensive operation. You should avoid it as much as possible. We recommend that you always use a properties file that contains Xresettable=YES.
We also recommend that you use sharable application classpaths to cache your classes and prevent their reload. Our JVM program contained only two classes and we saw a remarkable gain in CPU and elapsed time.
V1R3M0 CICS Performance Analyzer Performance Summary __________________________________________________ SUMM0001 Printed at 11:37:20 10/17/2003 Data from 11:14:59 10/17/2003 to 11:19:59 10/17/2003 Page 1SUMMARY report of dispatcher wait fields Avg Avg Avg Avg Avg Avg Avg Avg Tran Response Dispatch User CPU Suspend Disp1Dly DispWait MaxJTDly MaxOTDly Time Time Time Time Time Time Time Time JTS1 .1256 .0097 .0068 .1160 .0001 .0063 .0487 .0000
Chapter 12. Java applications in CICS 283

284 CICS Performance Analyzer

Chapter 13. Enterprise JavaBeans in CICS
This chapter explains how to use CICS Performance Analyzer (PA) to report on Java Virtual Machine (JVM) statistics. We used an application that has three versions, all of them providing exactly the same user interface and functionality. The difference is that the enterprise bean that implements the business logic can use three different interfaces to manage user data.
The three different versions of the enterprise bean are:
� JCICS version: Uses JCICS classes to directly access VSAM data sets. We identify this version as JCIM business application and associate JCIM transaction code with the bean name.
� SQLJ version: Uses the SQLJ Java application programming interface (API) (static Structured Query Language (SQL)) to access DB2 data. We identify this version as SQLM business transaction and associate SQLM transaction code with the bean name.
� JDBC version: Uses the Java Database Connectivity (JDBC) API (dynamic SQL) to access DB2 data. We identify this version as JDBM business transaction and associate JDBM transaction code with the bean name.
We ran three different versions of an enterprise bean application 100 times, each over a single thread to produce CICS PA JVM reports. Then we then each enterprise bean application 10 times over 10 threads and then five times over 20 threads. We used CICS PA to produce performance reports for each variety of the enterprise bean workload.
A single run of an enterprise bean application contains 13 method calls. In other words, execution of a single business transaction causes execution of 13 CICS transactions.
13
Note: These scenarios were used to provide situations that allow us to demonstrate the use of CICS Performance Analyzer reports when running with an enterprise bean workload. The CICS regions were not necessarily tuned for peak performance. In some cases, they had a high level of tracing active. Therefore these scenarios and the results provided are for demonstration purposes only. They do not provide definitive results for a customer environment.
© Copyright IBM Corp. 2003. All rights reserved. 285

13.1 CICS logical EJB server configurationYou can implement a CICS Enterprise JavaBean (EJB) server in a single CICS region. However, in a production environment, you may want to create a server consisting of multiple regions. In such a configuration, a failure of a single region is less critical, and you can implement workload balancing while providing a single system image.
A CICS logical EJB server consists of the following elements:
� A defined set of cloned listener regions that have identical TCPIPSERVICE definitions to listen for incoming Internet Inter-ORB Protocol (IIOP) requests
� A set of cloned application owning regions (AORs), each of which supports an identical set of enterprise beans in identically defined CORBA servers.
Workload balancing can be implemented at two levels:
� Balancing client connections across the listener regions: We used TCP/IP port sharing to achieve this goal.
� Balancing method requests across the AORs: We used the CICSPlex System Manager (SM) provided distributed routing program, EYU9XLOP, to achieve this goal.
For our tests, we implemented the configuration described in 5.1.2, “Configuration for Enterprise JavaBean workloads” on page 130, and shown in Figure 13-1.
Figure 13-1 CICS logical EJB server
For a complete description about how to set up a CICS logical EJB server, refer to CICS Transaction Server for z/OS Java Applications in CICS, SC34-6000, and to Chapter 5 of Enterprise JavaBeans for z/OS and OS/390 CICS Transaction Server V2.2, SG24-6284. You can also refer to Chapters 10, 11, and 12 in SG24-6284 for a description of the ITSO enterprise bean Trader application.
PLA2
PJA7PJA6
Browser
IP port sharing
IIOP Trader workload
Web application
Batchclient
workload
PLA1
SC66
CMAS
IIOP IIOP
LDAP
286 CICS Performance Analyzer

13.2 Single thread enterprise bean scenario We use CICS PA reports to compare the resources used by the three different enterprise beans. See 5.1.2, “Configuration for Enterprise JavaBean workloads” on page 130, for a description of the system setup that enabled us to run the EJB scenario.
13.2.1 CICS TS V2.2 JDBC/SQLJ supportCICS Java applications can access DB2 data via the JDBC and SQLJ APIs. The JDBC API uses the dynamic SQL model. The SQLJ API uses the static SQL model.
In a CICS environment, the DB2 JDBC driver is link-edited with the CICS DB2 language interface stub DSNCLI. Therefore, JDBC and SQLJ requests are converted by the JDBC driver into EXEC SQL requests and then routed into the existing CICS-DB2 Attachment Facility.
13.2.2 Initiating transaction workloadWe associated the following transaction codes with the bean name:
� SQLM for the SQLJ version� JDBM for the JDBC version � JCIM for the JCICS (VSAM) version
We used the CREA transaction in CICS to provide REQUESTMODEL definitions for various methods. For each method, we defined a different transaction identifier. This way, we could monitor performance down to the method level. REQUESTMODEL definitions had to be installed in all regions, listener regions as well as AORs.
Figure 13-2 shows the transaction identifiers for the methods for the SQLJ version. We also associated transaction code SQLN with the create() method.
Figure 13-2 SQLJ transactions and methods
Figure 13-3 shows the transactions and method association for the JDBC version. Again we used the CREA transaction to create the REQUESTMODELs and installed them in all regions. We also associated transaction code JDBN with the create() method.
SQLM DistributedTraderAgent SQL1 buy long SQL2 getCompanyDetails SQL3 getCustomerName SQL4 listCompanies SQL5 listPosition SQL6 selectCompany java.lang.String SQL7 sell long SQL8 getEJBHome (inherited from EJBObject) SQL9 getHandle (inherited from EJBObject) SQLA getPrimaryKey (inherited from EJBObject) SQLB isIdentical (inherited from EJBObject) javax.ejb.EJBObject SQLR remove (inherited from EJBObject)
Chapter 13. Enterprise JavaBeans in CICS 287

Figure 13-3 JDBC transactions and methods
Figure 13-4 shows the transactions and method association for the JCICS (VSAM) version. Again we used the CREA transaction to create the REQUESTMODELs and installed them in all regions. We also associated the JCIN transaction code with the create() method.
Figure 13-4 JVSM transactions and methods
Remember that in logical CICS EJB server, REQUESTMODEL definitions must be installed in IIOP listener regions as well as in AORs.
To produce a workload, we used a batch file that drives the JDBC, SQLJ, and JVSM applications. In this test, we ran each business application sequentially (that is, using only one thread), a total of 100 times.
Producing CICS Performance Analyzer reports We let the batch run of the SQLJ application complete. We flushed the CICS SMF buffers. We did this by turning performance monitoring off and on in both SCSCPJA6 and SCSCPJA7. We then switched the SMF data sets, using the /I SMF command. Our SMF data was copied into SMFDATA.ALLRECS.G8684V00. We needed to add this SMF data to the CICS system
JDBM DistributedTraderAgent JDB1 buy long JDB2 getCompanyDetails JDB3 getCustomerName JDB4 listCompanies JDB5 listPosition JDB6 selectCompany java.lang.String JDB7 sell long JDB8 getEJBHome (inherited from EJBObject)JDB9 getHandle (inherited from EJBObject) JDBA getPrimaryKey (inherited from EJBObject) JDBB isIdentical (inherited from EJBObject) javax.ejb.EJBObject JDBC remove (inherited from EJBObject)
JCIM DistributedTraderAgent JCI1 buy long JCI2 getCompanyDetails JCI3 getCustomerName JCI4 listCompanies JCI5 listPosition JCI6 selectCompany java.lang.String JCI7 sell long JCI8 getEJBHome (inherited from EJBObject) JCI9 getHandle (inherited from EJBObject) JCIA getPrimaryKey (inherited from EJBObject) JCIB isIdentical (inherited from EJBObject) javax.ejb.EJBObject JCIC remove (inherited from EJBObject)
288 CICS Performance Analyzer

definitions that were used to run the workload, in this case SCSCPJA6 and SCSCPJA7 (Figure 13-5).
Figure 13-5 Adding SMF data to CICS System definition
After we added the SMF data to the CICS System Definitions, we created a group that contained the two CICS System Definitions. To do this, we used option 3 of the System Definitions menu. In Figure 13-6, we specified new EJBGRP to create a new group.
Figure 13-6 New group EJBGRP
On the next screen, we added the two CICS system definitions (SCSCPJA6 and SCSCPJA7) that we wanted to include in the new group (Figure 13-7).
Figure 13-7 Adding CICS system definitions
---------------------------- System Definitions ----------------------------- File Edit Dictionary View Options Help -------------------------------------------------------------------------- CICS System Row 1 of 1 More: > Command ===> Scroll ===> CSR CICS System definition: APPLID . . . . . . . . SCSCPJA7 MVS Image . . SC66 Description . . . . . System added by take-up CICS Version (VRM) . . 620 MCT Suffix . . . . . . MCT Load Library . . . SDFHLOAD Library . . . Dictionary DSN . . . . / Exc SMF Data Set Name + UNIT + SEQ VOLSER + 'SMFDATA.ALLRECS.G8684V00' DASD
File Edit Filter View Options Help ------------------------------------------------------------------------------ Groups Row 1 from 2 Command ===> new EJBGRP Scroll ===> CSR Select to review the Systems in the Group. / Use Group Description 3 DB2GRP 1 DB2GROUP
---------------------------- System Definitions ---------------------------- File Edit Options Help -------------------------------------------------------------------------- Systems in this Group Row 1 to 2 of 2 Command ===> Scroll ===> CSR Group . . . . . . EJBGRP Description . . . / System + Type Image Description SCSCPJA6 CICS SC66 System added by take-up SCSCPJA7 CICS SC66 System added by take-up
Chapter 13. Enterprise JavaBeans in CICS 289

To obtain the reports that we required for the JVM, we used the sample reports JVMLST (List Report Form) and JVMSUM (Summary Report Form). The sample Report Forms are found on the Report Forms screen, under Samples. After selecting the samples, we populated the Report Forms data set with the sample Report Forms. We did this and had the list of all sample Report Forms. Figure 13-8 shows some of the samples available. We selected JVMLST and JVMSUM.
Figure 13-8 Sample Report Forms
After we set the forms we wanted, we created a Report Set to use for the performance report. To create a Report Set, we selected option 2 on the CICS Performance Analyzer main menu. We specified new EJBREP and created the new Report Set (Figure 13-9).
Figure 13-9 New Report Set
Sample Report Forms Row 33 to 48 of 87 Command ===> Scroll ===> CSR Select one or more Sample Report Forms then press EXIT. Name Type Description ICSUM SUMMARY Interval Control Activity IMSDBLST LIST Transaction DBCTL Usage Analysis IMSDBSUM SUMMARY Transaction DBCTL Usage Analysis IMSRQLST LIST Transaction DBCTL Req Analysis IMSRQSUM SUMMARY Transaction DBCTL Req Analysis IMSSUM SUMMARY IMS DBCTL PSB Usage Analysis JCLST LIST Journaling/Logging Activity JCSUM SUMMARY Journaling/Logging Activity JVMLST LIST Java Virtual Machine Analysis JVMSUM SUMMARY Java Virtual Machine Analysis s PCLST LIST Program Request Activity s PCSUM SUMMARY Program Request Activity PSTORLST LIST Program Storage Analysis PSTORSUM SUMMARY Program Storage Analysis RMIDBLST LIST CICS RMI Analysis - DB2 Overview RMIDBSUM SUMMARY CICS RMI Analysis - DB2 Overview
File Systems Confirm Options Help ------------------------------------------------------------------------------ Report Sets Row 1 to 9 of 9 Command ===> new EJBREP Scroll ===> CSR Report Sets Data Set . . : CICSLS5.CICSPA.RSET / Name Description Changed ID
DB2REPS CICS PA Report Set 2003/10/14 12:00 CICSLS5 DB2REP2 CICS PA Report Set 2003/10/15 13:35 CICSLS5 EXCREP CICS PA Report Set 2003/10/23 11:28 CICSLS5 LOGREPS CICS PA Report Set 2003/10/22 14:39 CICSLS5 LOGREP2 CICS PA Report Set 2003/10/18 09:48 CICSLS5 REPIT8 CICS PA Report Set 2003/10/25 12:09 CICSLS5 REPORT1 CICS PA Report Set 2003/10/23 08:49 CICSLS5 REPORT2 CICS PA Report Set 2003/10/25 11:05 CICSLS5 REPORT3 CICS PA Report Set 2003/10/22 18:47 CICSLS5
290 CICS Performance Analyzer

The two sample Report Forms were added to the list of Report Form that we already defined (see Figure 13-10). After the Report Forms were added, they did not appear in the list of samples.
Figure 13-10 Report Forms
We used the Report Set to produce both a List and a Summary report for transaction SQLM. We selected List in the category Performance Reports (Figure 13-11).
Figure 13-11 Specifying the List Performance Report
On the Performance List Report screen (Figure 13-12), we specified JVMLST in the Form field. We also chose Performance for selection criteria.
File Confirm Samples Options Help ------------------------------------------------------------------------------ Report Forms 2 members added Command ===> Scroll ===> CSR Report Forms Data Set . . : CICSLS5.CICSPA.FORM / Name Type Description Changed ID
DB2PERF LIST List Report Form 2003/10/15 12:05 CICSLS5 EXCFORM LIST List Report Form 2003/10/25 13:14 CICSLS5 JVMLST LIST Java Virtual Machine Analysis 2003/03/08 00:00 CICSPA JVMSUM SUMMARY Java Virtual Machine Analysis 2003/03/08 00:00 CICSPA SUSPEND LIST List Report Form 2003/10/22 17:30 CICSLS5
File Systems Confirm Options Help ------------------------------------------------------------------------------ EDIT Report Set - EJBREP Row 1 of 34 Command ===> Scroll ===> CSR Description . . . CICS PA Report Set Enter "/" to select action. ** Reports ** Active - Options No Global No - Selection Criteria No Performance No Exception No - Performance Reports No s List No List Extended No Summary No Totals No Wait Analysis No Cross-System Work No Transaction Group No BTS No Workload Activity No - Exception Reports No
Chapter 13. Enterprise JavaBeans in CICS 291

Figure 13-12 Choosing Report Form and selecting system
On the Performance Select Statement screen, we selected transaction SQL* (Figure 13-13). This is because we wanted all the transaction codes from all the methods that made up the SQLM transaction.
Figure 13-13 Selecting a transaction
After we finished with the List reports, we saved our changes and selected the Summary Report, used the JVMSUM form, and selected the transaction SQL*. We ran both the List and Summary reports. We needed to add the group EJBGRP to the Run Report Set screen (Figure 13-14).
File Systems Options Help ------------------------------------------------------------------------------ EJBREP - Performance List Report Command ===> System Selection: Report Output: APPLID . . + DDname . . . . . . . . . LIST0001 Image . . + Print Lines per Page . . (1-255) Group . . + Report Format: Form . . . JVMLST + Title . . Selection Criteria: s Performance
File Edit Object Lists Options Help ------------------------------------------------------------------------------ EJBREP - Performance Select Statement Row 1 of 2 More: > Command ===> Scroll ===> CSR Active --------------- Report Interval ---------------- Inc Start -------- From --------- --------- To ---------- Exc Stop MM/DD/YYYY HH:MM:SS.TH MM/DD/YYYY HH:MM:SS.TH ------------------------------------------------------------------------------ Inc Field --- Value or Range --- Object / Exc Name + Type Value/From To List + INC TRAN SQL*
292 CICS Performance Analyzer

Figure 13-14 Run Report Set
Figure 13-15 shows part of the first page from the list report. It shows one SQLM transaction and some of its method transactions.
Figure 13-15 Performance List report
File Systems Options Help ------------------------------------------------------------------------------ Run Report Set EJBREP Command ===> Specify run Report Set options then press Enter to continue submit. System Selection: CICS APPLID . . + Image . . + Group . . EJBGRP + DB2 SSID . . . + Image . . + Group . . + MQ SSID . . . . + Image . . + Group . . + Logger . . . . + Image . . + Group . . + / Override System Selections specified in Report Set ----- Report Interval ------ Missing SMF Files Option: MM/DD/YYYY HH:MM:SS.TH 1 1. Issue error message From 2. Leave DSN unresolved in JCL To 3. Disregard offending reports Enter "/" to select option / Edit JCL before submit
V1R3M0 CICS Performance Analyzer Performance List __________________________________________________ LIST0001 Printed at 17:25:39 10/29/2003 Data from 17:16:44 10/29/2003 APPLID SCSCPJA6 Page 1Transaction Java Virtual Machine (JVM) Usage Analysis - Detail Tran Userid TaskNo Stop Response Dispatch User CPU KY8 CPU J8 CPU JVM Elap JVMITime JVM Meth JVMRTime JVM Susp Time Time Time Time Time Time Time Time Time Time Time SQLN CICSUSER 164 17:16:44.230 5.6586 5.5701 1.0281 1.0270 1.0248 5.6576 .0000 5.5813 .0763 .0884 SQL4 CICSUSER 165 17:16:46.322 2.1161 2.1078 .4671 .4661 .4624 2.1145 .0000 2.0477 .0668 .0082 SQL6 CICSUSER 166 17:16:46.905 .5870 .5801 .3266 .3256 .3215 .5849 .0000 .5475 .0374 .0065 SQL3 CICSUSER 167 17:16:48.967 .1432 .1367 .1176 .1167 .1157 .1421 .0000 .1369 .0052 .0063 SQL5 CICSUSER 168 17:16:49.313 .3188 .3123 .1503 .1494 .1459 .3171 .0000 .3106 .0064 .0064 SQL5 CICSUSER 169 17:16:49.482 .1332 .1274 .0885 .0876 .0842 .1315 .0000 .1263 .0052 .0057 SQL1 CICSUSER 170 17:16:49.683 .1631 .1562 .0695 .0685 .0634 .1614 .0000 .1558 .0056 .0068 SQL7 CICSUSER 171 17:16:49.944 .2274 .2204 .1266 .1257 .1207 .2257 .0000 .2205 .0052 .0068 SQLM CICSUSER 172 17:16:50.154 .1789 .1726 .0765 .0755 .0745 .1781 .0000 .1490 .0291 .0062 SQL3 CICSUSER 173 17:16:50.326 .1572 .1508 .1303 .1294 .1285 .1561 .0000 .1510 .0051 .0063 SQL5 CICSUSER 174 17:16:50.577 .2200 .2137 .1776 .1767 .1734 .2184 .0000 .2131 .0053 .0061 SQL5 CICSUSER 175 17:16:50.708 .0981 .0918 .0717 .0708 .0675 .0965 .0000 .0904 .0061 .0062
Chapter 13. Enterprise JavaBeans in CICS 293

The Performance Summary Report follows the Performance List Report (Figure 13-16).
Figure 13-16 Performance Summary report
Figure 13-17 shows the elapsed time of the SQLM workload. From this report, you can see that running all 100 transactions took 5 minutes and 50 seconds. That is, we achieved a transaction rate of 4 transactions per second (1300 CICS transactions in 350 seconds).
Figure 13-17 Elapsed time for SQLM transactions
V1R3M0 CICS Performance Analyzer Performance Summary __________________________________________________ SUMM0001 Printed at 17:25:39 10/29/2003 Data from 17:16:38 10/29/2003 to 17:22:34 10/29/2003 Page 1Transaction Java Virtual Machine (JVM) Usage Analysis - Summary Avg Avg Avg Avg Avg Avg Avg Avg Avg Avg Avg Avg Tran #Tasks Response Dispatch User CPU Suspend DispWait KY8 CPU J8 CPU JVM Elap JVMITime JVM Meth JVMRTime JVM Susp Time Time Time Time Time Time Time Time Time Time Time Time SQLM 200 .1161 .1025 .0697 .0137 .0007 .0688 .0680 .1151 .0000 .0769 .0383 .0135 SQLN 100 .4450 .4139 .1349 .0311 .0013 .1339 .1331 .4438 .0000 .4032 .0406 .0309 SQL1 100 .0995 .0834 .0511 .0161 .0015 .0502 .0456 .0979 .0000 .0905 .0074 .0160 SQL3 200 .0688 .0544 .0410 .0143 .0006 .0402 .0393 .0679 .0000 .0609 .0069 .0142 SQL4 100 .1393 .1237 .0717 .0155 .0008 .0707 .0675 .1367 .0000 .0993 .0374 .0153 SQL5 400 .0791 .0659 .0483 .0132 .0008 .0474 .0441 .0773 .0000 .0688 .0085 .0130 SQL6 100 .0870 .0722 .0469 .0148 .0017 .0460 .0424 .0846 .0000 .0767 .0078 .0138 SQL7 100 .1035 .0882 .0577 .0153 .0007 .0568 .0522 .1010 .0000 .0919 .0091 .0152
V1R3M0 CICS Performance Analyzer Performance List __________________________________________________ LIST0001 Printed at 16:45:50 10/31/2003 Data from 17:16:44 10/29/2003 APPLID SCSCPJA6 Page 1 Transaction Java Virtual Machine (JVM) Usage Analysis - Detail Tran Userid TaskNo Stop Response Dispatch User CPU KY8 CPU J8 CPU JVM Elap JVMITime JVM Meth JVMRTime JVM Susp Time Time Time Time Time Time Time Time Time Time Time SQLN CICSUSER 164 17:16:44.230 5.6586 5.5701 1.0281 1.0270 1.0248 5.6576 .0000 5.5813 .0763 .0884 SQL5 CICSUSER 1426 17:22:34.380 .0523 .0459 .0377 .0370 .0340 .0510 .0000 .0448 .0061 .0064 | | | | | |___________| | | | | | 00:05:50
294 CICS Performance Analyzer

We ran the JDBM transaction and collected the SMF data in the same way as for the SQLM transaction. Now, we did not need to set up a new Report Form since we already did so for the SQLM transaction. However, we needed to add the SMF data set to the CICS APPLIDs on the System Definition screen. We wanted to create a new Report Set for the JDBM transaction. We did this by specifying new EJBREP2 on the Report Set screen (Figure 13-18).
Figure 13-18 New Report Set
On the new Report Set, we selected both the List and Summary report options. As shown in Figure 13-19, we added the Report Form JVMLST to the Performance List report. We also selected the Performance selection criteria.
Figure 13-19 List Report
File Systems Confirm Options Help ------------------------------------------------------------------------------ Report Sets Row 1 to 10 of 10 Command ===> new ejbrep2 Scroll ===> CSR Report Sets Data Set . . : CICSLS5.CICSPA.RSET / Name Description Changed ID
DB2REPS CICS PA Report Set 2003/10/14 12:00 CICSLS5 DB2REP2 CICS PA Report Set 2003/10/15 13:35 CICSLS5 EJBREP CICS PA Report Set 2003/10/29 08:48 CICSLS5 EXCREP CICS PA Report Set 2003/10/23 11:28 CICSLS5 LOGREPS CICS PA Report Set 2003/10/22 14:39 CICSLS5 LOGREP2 CICS PA Report Set 2003/10/18 09:48 CICSLS5 REPIT8 CICS PA Report Set 2003/10/25 12:09 CICSLS5 REPORT1 CICS PA Report Set 2003/10/23 08:49 CICSLS5 REPORT2 CICS PA Report Set 2003/10/25 11:05 CICSLS5 REPORT3 CICS PA Report Set 2003/10/22 18:47 CICSLS5
File Systems Options Help ------------------------------------------------------------------------------ EJBREP2 - Performance List Report Command ===> System Selection: Report Output: APPLID . . + DDname . . . . . . . . . LIST0001 Image . . + Print Lines per Page . . (1-255) Group . . + Report Format: Form . . . JVMLST + Title . . Selection Criteria: s Performance
Chapter 13. Enterprise JavaBeans in CICS 295

In the Selection Criteria screen, we requested to include just the JDB* transactions (Figure 13-20).
Figure 13-20 Selection criteria
We set up the Summary Report with the same selection criteria option and added the form JVMSUM. We ran the new reports. Both the List and Summary Performance Reports were active as indicated by yes in the Active column for each. We entered a RUN command on the command line to run both reports at the same time. The group EJBGRP was still specified on the Report Set screen, so we did not need to add it again (Figure 13-21).
Figure 13-21 Submitting Report Set
File Edit Object Lists Options Help ------------------------------------------------------------------------------ EJBREP2 - Performance Select Statement Row 1 of 9 More: > Command ===> Scroll ===> CSR Active --------------- Report Interval ---------------- Inc Start -------- From --------- --------- To ---------- Exc Stop MM/DD/YYYY HH:MM:SS.TH MM/DD/YYYY HH:MM:SS.TH ------------------------------------------------------------------------------ Inc Field --- Value or Range --- Object / Exc Name + Type Value/From To List + INC TRAN JDB*
File Systems Options Help ------------------------------------------------------------------------------ Run Report Set EJBREP2 Command ===> Specify run Report Set options then press Enter to continue submit. System Selection: CICS APPLID . . + Image . . + Group . . EJBGRP + DB2 SSID . . . + Image . . + Group . . + MQ SSID . . . . + Image . . + Group . . + Logger . . . . + Image . . + Group . . + / Override System Selections specified in Report Set ----- Report Interval ------ Missing SMF Files Option: MM/DD/YYYY HH:MM:SS.TH 1 1. Issue error message From 2. Leave DSN unresolved in JCL To 3. Disregard offending reports Enter "/" to select option / Edit JCL before submit
296 CICS Performance Analyzer

Figure 13-22 shows the Performance List report.
Figure 13-22 Performance List report
Because we used workload balancing of method requests, we needed to tie together transactions from both SCSCPJA6 and SCSCPJA7 for a complete picture. The first transaction is JDBN (create) and it is task number 1428. The next task number was 4564. These transactions ran on the different AORs.
We looked at the Performance Summary report (Figure 13-23). The JDBN transaction that corresponds to the bean create() method was run 100 times.
Figure 13-23 Performance Summary
V1R3M0 CICS Performance Analyzer Performance List __________________________________________________ LIST0001 Printed at 17:34:42 10/29/2003 Data from 17:26:29 10/29/2003 APPLID SCSCPJA7 Page 1 Transaction Java Virtual Machine (JVM) Usage Analysis - Detail Tran Userid TaskNo Stop Response Dispatch User CPU KY8 CPU J8 CPU JVM Elap JVMITime JVM Meth JVMRTime JVM Susp Time Time Time Time Time Time Time Time Time Time Time JDB4 CICSUSER 4564 17:26:29.967 .3291 .3225 .1172 .1165 .1133 .3276 .0000 .2917 .0359 .0064 JDB6 CICSUSER 4565 17:26:30.177 .1710 .0840 .0702 .0694 .0660 .1695 .0000 .1365 .0329 .0869 JDBM CICSUSER 4566 17:26:30.248 .0576 .0515 .0430 .0424 .0416 .0571 .0000 .0244 .0327 .0060 JDB3 CICSUSER 4567 17:26:30.348 .0562 .0500 .0405 .0399 .0390 .0555 .0000 .0526 .0029 .0060 JDB5 CICSUSER 4568 17:26:30.534 .0342 .0280 .0207 .0200 .0167 .0327 .0000 .0292 .0035 .0061 JDB1 CICSUSER 4569 17:26:30.616 .0379 .0312 .0211 .0204 .0160 .0363 .0000 .0328 .0035 .0063 JDB3 CICSUSER 4570 17:26:30.879 .0296 .0230 .0172 .0165 .0155 .0286 .0000 .0251 .0034 .0062 JDB5 CICSUSER 4571 17:26:30.956 .0315 .0253 .0196 .0190 .0156 .0302 .0000 .0271 .0030 .0060 JDB5 CICSUSER 4572 17:26:31.128 .1148 .1087 .0232 .0224 .0192 .1134 .0000 .1100 .0034 .0060 JDBN CICSUSER 4573 17:26:32.771 .1958 .1656 .0749 .0742 .0735 .1951 .0000 .1612 .0339 .0301 JDB6 CICSUSER 4574 17:26:32.960 .0367 .0305 .0238 .0232 .0197 .0355 .0000 .0319 .0035 .0061 JDBM CICSUSER 4575 17:26:33.149 .1415 .0570 .0460 .0453 .0443 .1408 .0000 .1052 .0355 .0843 JDB7 CICSUSER 4576 17:26:33.713 .0668 .0603 .0404 .0397 .0353 .0653 .0000 .0610 .0042 .0064 JDB3 CICSUSER 4577 17:26:33.914 .0568 .0504 .0425 .0418 .0409 .0562 .0000 .0527 .0035 .0063 JDB5 CICSUSER 4578 17:26:33.992 .0331 .0267 .0195 .0189 .0158 .0319 .0000 .0291 .0028 .0063 JDBN CICSUSER 4579 17:26:36.142 .5812 .5615 .1008 .1001 .0992 .5803 .0000 .5467 .0335 .0195 JDB4 CICSUSER 4580 17:26:36.245 .0683 .0617 .0497 .0489 .0458 .0667 .0000 .0321 .0346 .0065 V1R3M0 CICS Performance Analyzer Performance List __________________________________________________ LIST0001 Printed at 17:34:42 10/29/2003 Data from 17:26:29 10/29/2003 APPLID SCSCPJA6 Page 2Transaction Java Virtual Machine (JVM) Usage Analysis - Detail Tran Userid TaskNo Stop Response Dispatch User CPU KY8 CPU J8 CPU JVM Elap JVMITime JVM Meth JVMRTime JVM Susp Time Time Time Time Time Time Time Time Time Time Time JDBN CICSUSER 1428 17:26:29.610 .6367 .6036 .1673 .1663 .1652 .6356 .0000 .5990 .0365 .0329 JDB5 CICSUSER 1429 17:26:30.479 .0866 .0802 .0669 .0659 .0625 .0848 .0000 .0511 .0337 .0063 JDB7 CICSUSER 1430 17:26:30.720 .0590 .0524 .0400 .0391 .0347 .0573 .0000 .0520 .0053 .0064 JDBM CICSUSER 1431 17:26:30.836 .0791 .0727 .0616 .0607 .0597 .0782 .0000 .0439 .0343 .0062 JDB4 CICSUSER 1432 17:26:32.889 .0841 .0775 .0650 .0640 .0608 .0823 .0000 .0482 .0340 .0064 JDB3 CICSUSER 1433 17:26:33.238 .0537 .0436 .0356 .0347 .0337 .0527 .0000 .0479 .0048 .0100 JDB5 CICSUSER 1434 17:26:33.341 .0594 .0469 .0374 .0366 .0333 .0571 .0000 .0524 .0047 .0124 JDB5 CICSUSER 1435 17:26:33.509 .1266 .1125 .0392 .0383 .0349 .1251 .0000 .1197 .0054 .0139
V1R3M0 CICS Performance Analyzer Performance Summary __________________________________________________ SUMM0001 Printed at 17:34:42 10/29/2003 Data from 17:26:28 10/29/2003 to 17:31:29 10/29/2003 Page 1Transaction Java Virtual Machine (JVM) Usage Analysis - Summary Avg Avg Avg Avg Avg Avg Avg Avg Avg Avg Avg Avg Tran #Tasks Response Dispatch User CPU Suspend DispWait KY8 CPU J8 CPU JVM Elap JVMITime JVM Meth JVMRTime JVM Susp Time Time Time Time Time Time Time Time Time Time Time Time JDBM 200 .0876 .0719 .0539 .0157 .0005 .0531 .0523 .0861 .0000 .0463 .0398 .0155 JDBN 100 .3256 .3027 .0959 .0229 .0005 .0951 .0942 .3245 .0000 .2804 .0441 .0227 JDB1 100 .0630 .0481 .0291 .0149 .0007 .0283 .0238 .0598 .0000 .0546 .0051 .0147 JDB3 200 .0572 .0366 .0247 .0206 .0010 .0240 .0231 .0559 .0000 .0503 .0056 .0200 JDB4 100 .0935 .0789 .0587 .0146 .0007 .0579 .0547 .0917 .0000 .0511 .0406 .0142 JDB5 400 .0594 .0442 .0297 .0152 .0008 .0289 .0256 .0579 .0000 .0522 .0056 .0150 JDB6 100 .0636 .0475 .0317 .0161 .0007 .0309 .0276 .0612 .0000 .0561 .0051 .0159 JDB7 100 .0640 .0466 .0286 .0174 .0006 .0278 .0233 .0625 .0000 .0579 .0046 .0173
Chapter 13. Enterprise JavaBeans in CICS 297

Figure 13-24 shows the elapsed time of the JDBM workload. The throughput of the 100 JDBM business transactions was completed in five minutes or a transaction rate of 4 CICS transactions per second (1300 CICS transactions in 300 seconds).
Figure 13-24 Elapsed time for JDBM workload
We then ran the JVSM transaction workload using a batch workload. We collected the SMF records the same as before, and added the records to the System Definitions for SCSCPJA6 and SCSCPJA7. The first action was to create a new Report Set, called EJBREP3. Again we used the same sample Report Forms JVMLST and JVMSUM, as we used for the SQLJ and JDBC reports. We needed different selection criteria, all transactions JCI* (Figure 13-25).
Figure 13-25 JVSM selection criteria
V1R3M0 CICS Performance Analyzer Performance List __________________________________________________ LIST0001 Printed at 16:53:16 10/31/2003 Data from 17:26:29 10/29/2003 APPLID SCSCPJA6 Page 1Transaction Java Virtual Machine (JVM) Usage Analysis - Detail Tran Userid TaskNo Stop Response Dispatch User CPU KY8 CPU J8 CPU JVM Elap JVMITime JVM Meth JVMRTime JVM Susp Time Time Time Time Time Time Time Time Time Time Time JDBN CICSUSER 1428 17:26:29.610 .6367 .6036 .1673 .1663 .1652 .6356 .0000 .5990 .0365 .0329 JDB5 CICSUSER 5339 17:31:29.635 .0371 .0226 .0158 .0151 .0119 .0355 .0000 .0309 .0045 .0141
| | | | | |___________| | | | | | 00:05:00
File Edit Object Lists Options Help ------------------------------------------------------------------------------ EJBREP3 - Performance Select Statement Row 1 of 9 More: > Command ===> Scroll ===> CSR Active --------------- Report Interval ---------------- Inc Start -------- From --------- --------- To ---------- Exc Stop MM/DD/YYYY HH:MM:SS.TH MM/DD/YYYY HH:MM:SS.TH ------------------------------------------------------------------------------ Inc Field --- Value or Range --- Object / Exc Name + Type Value/From To List + INC TRAN JCI*
298 CICS Performance Analyzer

We submitted the new Report Set. Figure 13-26 shows part of the report.
Figure 13-26 JVSM List Report
Figure 13-27 is the Summary Report for the JVSM transaction run.
Figure 13-27 JVSM Summary Report
V1R3M0 CICS Performance Analyzer Performance List __________________________________________________ LIST0001 Printed at 11:48:00 11/06/2003 Data from 11:37:05 11/06/2003 APPLID SCSCPJA7 Page 1 CICS PA JVSM List Report Tran Userid TaskNo Stop Response Dispatch User CPU KY8 CPU J8 CPU JVM Elap JVMITime JVM Meth JVMRTime JVM Susp Time Time Time Time Time Time Time Time Time Time Time JCI4 CICSUSER 634 11:37:05.547 .1229 .1075 .0888 .0876 .0876 .1219 .0000 .0669 .0549 .0153 JCIM CICSUSER 635 11:37:05.776 .1139 .0996 .0872 .0863 .0863 .1129 .0001 .0601 .0527 .0142 JCI3 CICSUSER 636 11:37:05.858 .0644 .0503 .0428 .0418 .0418 .0636 .0000 .0587 .0049 .0141 JCI5 CICSUSER 637 11:37:06.095 .0780 .0637 .0447 .0436 .0436 .0769 .0000 .0718 .0051 .0142 JCIM CICSUSER 638 11:37:06.468 .1155 .1010 .0881 .0870 .0870 .1144 .0000 .0604 .0539 .0144 JCI5 CICSUSER 639 11:37:06.627 .0705 .0558 .0476 .0466 .0466 .0695 .0000 .0644 .0050 .0146 JCI4 CICSUSER 640 11:37:08.308 .1183 .1038 .0906 .0894 .0894 .1172 .0000 .0624 .0548 .0144 JCI3 CICSUSER 641 11:37:08.655 .0664 .0520 .0436 .0426 .0426 .0653 .0000 .0602 .0051 .0142 JCI5 CICSUSER 642 11:37:08.892 .0895 .0753 .0650 .0639 .0639 .0885 .0000 .0834 .0051 .0141 JCI1 CICSUSER 643 11:37:09.000 .0679 .0514 .0438 .0427 .0427 .0670 .0000 .0619 .0051 .0164 JCI7 CICSUSER 644 11:37:09.122 .0846 .0700 .0442 .0432 .0432 .0836 .0000 .0786 .0050 .0145 JCIM CICSUSER 645 11:37:09.273 .1135 .0982 .0868 .0859 .0859 .1125 .0000 .0583 .0542 .0151 JCI5 CICSUSER 646 11:37:09.434 .0708 .0540 .0446 .0436 .0436 .0698 .0000 .0645 .0052 .0167
JCI5 CICSUSER 647 11:37:09.541 .0690 .0531 .0435 .0425 .0425 .0680 .0000 .0630 .0050 .0159 JCIN CICSUSER 648 11:37:10.996 .1060 .0939 .0825 .0816 .0816 .1050 .0000 .0511 .0539 .0120 JCI6 CICSUSER 649 11:37:11.251 .1138 .0998 .0882 .0871 .0871 .1127 .0000 .0604 .0523 .0139 JCI3 CICSUSER 650 11:37:11.434 .0652 .0513 .0435 .0425 .0425 .0643 .0000 .0592 .0051 .0138 JCI5 CICSUSER 651 11:37:11.543 .0715 .0538 .0458 .0448 .0448 .0705 .0000 .0651 .0054 .0176 JCI5 CICSUSER 652 11:37:11.651 .0655 .0512 .0432 .0422 .0422 .0645 .0000 .0597 .0048 .0142 JCI1 CICSUSER 653 11:37:11.760 .0684 .0523 .0442 .0431 .0431 .0675 .0000 .0625 .0050 .0160 JCI7 CICSUSER 654 11:37:11.866 .0690 .0520 .0438 .0428 .0428 .0682 .0000 .0630 .0052 .0169 JCIM CICSUSER 655 11:37:12.029 .1259 .1108 .0894 .0883 .0883 .1239 .0000 .0580 .0658 .0141 JCI5 CICSUSER 656 11:37:12.186 .0659 .0518 .0441 .0432 .0432 .0650 .0000 .0601 .0050 .0140 JCI5 CICSUSER 657 11:37:12.303 .0792 .0531 .0438 .0428 .0428 .0785 .0001 .0733 .0051 .0261 JCIN CICSUSER 658 11:37:13.784 .1138 .0949 .0822 .0813 .0813 .1050 .0000 .0504 .0546 .0111 JCI4 CICSUSER 659 11:37:13.911 .1259 .1111 .0947 .0936 .0936 .1250 .0000 .0656 .0594 .0147 JCI6 CICSUSER 660 11:37:14.047 .1272 .1132 .0890 .0880 .0880 .1262 .0000 .0595 .0668 .0138 JCIM CICSUSER 661 11:37:14.150 .1122 .0980 .0851 .0840 .0840 .1111 .0000 .0647 .0464 .0142 JCI3 CICSUSER 662 11:37:14.237 .0658 .0516 .0449 .0441 .0441 .0649 .0000 .0607 .0042 .0141 JCI5 CICSUSER 663 11:37:14.345 .0702 .0559 .0470 .0460 .0460 .0692 .0000 .0645 .0046 .0142 JCI5 CICSUSER 664 11:37:14.459 .0698 .0555 .0468 .0459 .0459 .0688 .0000 .0638 .0050 .0143 JCI1 CICSUSER 665 11:37:14.576 .0776 .0619 .0503 .0492 .0492 .0767 .0000 .0719 .0048 .0156 JCI7 CICSUSER 666 11:37:14.692 .0777 .0615 .0525 .0514 .0514 .0766 .0000 .0718 .0048 .0160
V1R3M0 CICS Performance Analyzer Performance Summary __________________________________________________ SUMM0001 Printed at 11:48:00 11/06/2003 Data from 11:37:05 11/06/2003 to 11:41:46 11/06/2003 Page 1CICS PA JVSM Summary Report Avg Avg Avg Avg Avg Avg Avg Avg Avg Avg Avg Avg Tran #Tasks Response Dispatch User CPU Suspend DispWait KY8 CPU J8 CPU JVM Elap JVMITime JVM Meth JVMRTime JVM Susp Time Time Time Time Time Time Time Time Time Time Time Time JCIM 200 .1212 .1073 .0903 .0139 .0005 .0893 .0893 .1202 .0000 .0661 .0541 .0138 JCIN 100 .1080 .0941 .0788 .0138 .0005 .0778 .0778 .1069 .0000 .0535 .0533 .0136 JCI1 100 .0730 .0574 .0442 .0156 .0006 .0432 .0432 .0721 .0000 .0648 .0073 .0155 JCI3 200 .0729 .0590 .0479 .0139 .0005 .0469 .0469 .0719 .0000 .0663 .0056 .0138 JCI4 100 .1165 .1027 .0876 .0138 .0007 .0865 .0865 .1155 .0000 .0614 .0540 .0136 JCI5 400 .0723 .0586 .0462 .0138 .0005 .0452 .0452 .0714 .0000 .0661 .0053 .0137 JCI6 100 .1170 .1034 .0869 .0136 .0004 .0859 .0859 .1160 .0000 .0616 .0544 .0135 JCI7 100 .0704 .0551 .0439 .0153 .0007 .0429 .0429 .0694 .0000 .0638 .0055 .0152
Chapter 13. Enterprise JavaBeans in CICS 299

Figure 13-28 shows the elapse time for the JCICS VSAM workload.
Figure 13-28 Elapsed time for JVSM transactions
The JVSM workload completed in 4 minutes and 40 seconds or a transaction rate of 5 per second (1300 CICS transactions in 280 seconds).
This scenario demonstrated the use of CICS Performance Analyzer in providing JVM reports for the different enterprise beans. The results were not surprising, since we used only one thread. In the next scenario, we produce a workload on a greater number of threads to see if we can achieve a better performance.
13.3 Multithread enterprise bean scenarioThis section describe an enterprise bean performance scenario that is running several EJB clients concurrently. We used the SQLJ, JDBC, and JCICS (VSAM) version of the DistributedTraderAgent enterprise bean to produce relevant performance reports of each enterprise bean application workload.
We used CICSPlex SM Workload Management to balance method call invocations across our AOR regions PJA6 and PJA7. CICSPlex SM is using its distributed routing program EYU9XLOP to dynamically route each single method of the DistributedTraderAgent enterprise bean to the least loaded AOR. A client method call invocation to the stateful DistributedTraderAgent enterprise bean never runs under an existing OTS transaction since we defined a transaction attribute of NotSupported. Therefore, each method call invocation is routed by CICSPlex SM to the most efficient AOR. Refer to CICS Transaction Server for z/OS Java Applications in CICS, SC34-6000, for more information about enterprise bean applications in CICS.
See 13.2.2, “Initiating transaction workload” on page 287, where we explain how we associated transaction IDs with enterprise bean methods of the SQLJ, JDBC, and JCICS (VSAM) EJB applications. To measure the performance of enterprise beans in CICS, we monitored the performance data of the IIOP request receiver and request processor transactions. We used three sets of cloned CIRP transactions to monitor each single method call invocation through an associated transaction ID.
13.3.1 Workload generationWe created a Java front-end application (Figure 13-29) that allows to run the Java enterprise bean workload using parallel threads on a client workstation rather than a single threaded sequence of client method calls. The program starts the Windows command files that we used to generate the workload for the sequential enterprise bean scenario.
V1R3M0 CICS Performance Analyzer Performance List __________________________________________________ LIST0001 Printed at 11:48:00 11/06/2003 Data from 11:37:05 11/06/2003 APPLID SCSCPJA7 Page 1 CICS PA JVSM List Report Tran Userid TaskNo Stop Response Dispatch User CPU KY8 CPU J8 CPU JVM Elap JVMITime JVM Meth JVMRTime JVM Susp Time Time Time Time Time Time Time Time Time Time Time JCIN CICSUSER 624 11:37:05.412 .1065 .0947 .0780 .0772 .0772 .1056 .0000 .0534 .0522 .0118 JCI5 CICSUSER 1281 11:41:46.303 .0677 .0534 .0436 .0425 .0425 .0667 .0000 .0611 .0056 .0143| | | | | |___________| | | | | | 00:04:40
300 CICS Performance Analyzer

Figure 13-29 Java application to start the workload
Each command file runs in its own thread, which simulates clients that run the enterprise bean application concurrently. The Java front-end program uses three parameters:
� The name of the command file: For this performance scenario, we used the following command files:
– SQLJ.cmd runs the client of the DistributedTraderAgent enterprise bean that is using the SQL API to access its database
– JDBC.cmd runs the client of the DistributedTraderAgent enterprise bean that is using the JDBC API to access its database
– JVSM.cmd runs the client DistributedTraderAgent enterprise bean that is using the JCICS VSAM classes to access its data sets
� The number of threads that should be created
� The number of calls per thread
AORs PJA6 and PJA7 are configured to use 10 JVMs each. Therefore, we decided to run two different workloads per enterprise bean application. For the first run, we executed our Java program and specified the following values:
� SQLJ.cmd � 10� 10
We created ten threads. Each thread called the SQLJ.cmd file ten times, which resulted in a total of 100 calls to the SQLJ version of the DistributedTraderAgent enterprise bean. This, in fact, is the same number of calls that we used during the sequential enterprise bean performance scenario. To use more of the available JVMs, we started another workload that used 20 threads and five calls per thread. Again this resulted in a total of 100 calls to the DistributedTraderAgent enterprise bean. We specified the following values:
� SQLJ.cmd� 20� 5
Chapter 13. Enterprise JavaBeans in CICS 301

We ran both workloads using these above parameters for the SQLJ, JDBC, and JCICS (VSAM) version of the enterprise bean application.
13.3.2 Objectives We wanted to demonstrate the performance behavior of CICS enterprise bean applications using SQLJ/JDBC in comparison with the same enterprise bean application using JCICS(VSAM). We defined a CICSPlex SM workload specification for distributed routing specifying the default (QUEUE) algorithm. We expected CICSPlex SM to do dynamic distributed routing of method call invocations to the AOR region that has the shortest execution queues.
We calculated the time that was needed to complete the workload of 100 calls to the DistributedTraderAgent enterprise bean. We used CICS Performance Analyzer reports to show the enterprise bean performance when using 10 or 20 threads to complete the workload.
13.3.3 Running the SQLJ workload We started the workload that calls the SQLJ version of the DistributedTraderAgent enterprise bean using 10 threads and 10 calls per thread. The workload finished after about 1.5 minutes. To collect all relevant SMF records, we flushed the CICS monitoring buffers and issued an /I SMF command to switch SMF data sets. When the SMF data set was archived, we performed the following steps to create the performance summary reports shown in Figure 13-30 and Figure 13-31:
1. Use the Take-Up for SMF function to update AORs PJA6 and PJA7.
2. Create a new Report Set in order to create a summary report.
3. Use sample Report Form JVMSUM to format relevant performance fields for JVMs.
4. Specify a Performance select statement to include a report interval that covers the test interval.
5. Run the report.
When we looked at the reports shown in Figure 13-30 and Figure 13-31, we found that CICSPlex SM routed more transactions to AOR PJA7.
The EJB client calls the DistributedTraderAgent enterprise bean 13 times. To monitor the request stream and request processor transactions, we associated a transaction ID to each method of the bean. One client performs 13 method calls multiplied by 100 clients, resulting in 1300 transactions per workload. AOR PJA6 executed 383 transactions when PJA7 processed 1017 transactions.
302 CICS Performance Analyzer

Figure 13-30 AOR PJA6 using 10 threads and 10 calls per thread
Figure 13-31 AOR PJA7 using 10 threads and 10 calls per thread
When the workload completed, we entered the CEMT I JVM command. We found that PJA6 was using seven JVMs while PJA7 was just using three JVMs. We assumed that PJA6 was busy building additional serially reusable JVMs which lead to longer transaction queues and response times. CICSPlex SM took that into account for its routing decision and started to route more workload to PJA7. CICSPlex SM does not spread the workload evenly. The entire workload could be routed to one CICS system in a CICSplex if it stayed within its goals and continued being the most efficient CICS region. If the workload made 500 calls to the enterprise bean rather than 100 calls, then PJA6 would probably catch up to PJA7 quickly.
We started the same workload again using 20 threads and five calls per thread, which again started 100 calls to the SQLJ version of the DistributedTraderAgent enterprise bean. We repeated the steps that we described earlier to create a performance summary report for PJA6 and PJA7 (Figure 13-32 and Figure 13-33).
V1R3M0 CICS Performance Analyzer Performance Summary __________________________________________________ SUMM0001 Printed at 12:13:32 10/29/2003 Data from 11:05:00 10/29/2003 to 11:38:06 10/29/2003 Page 1 Transaction Java Virtual Machine (JVM) Usage Analysis - Summary Avg Avg Avg Avg Avg Avg Avg Avg Avg Avg Avg Avg Tran #Tasks Response Dispatch User CPU Suspend DispWait KY8 CPU J8 CPU JVM Elap JVMITime JVM Meth JVMRTime JVM Susp Time Time Time Time Time Time Time Time Time Time Time Time SQLM 61 .1246 .0959 .0521 .0287 .0064 .0514 .0506 .1231 .0000 .0680 .0550 .0278 SQLN 36 .4498 .4259 .1228 .0239 .0058 .1221 .1214 .4483 .0000 .3834 .0649 .0230 SQL1 28 .1280 .0954 .0587 .0326 .0108 .0580 .0538 .1258 .0000 .1147 .0111 .0318 SQL3 57 .6022 .5756 .0890 .0266 .0075 .0884 .0876 .5969 .2939 .2935 .0095 .0258 SQL4 21 .1561 .1231 .0666 .0330 .0086 .0659 .0630 .1495 .0000 .0873 .0622 .0315 SQL5 121 .0919 .0581 .0294 .0337 .0125 .0287 .0258 .0896 .0000 .0814 .0082 .0328 SQL6 25 .1230 .0879 .0356 .0351 .0103 .0349 .0315 .1209 .0000 .1136 .0073 .0343 SQL7 34 1.1405 1.1075 .1396 .0329 .0153 .1390 .1347 1.1316 .5550 .5657 .0110 .0318 ******************************** BOTTOM OF DATA ***********************************************************************************
V1R3M0 CICS Performance Analyzer Performance Summary __________________________________________________ SUMM0001 Printed at 12:20:05 10/29/2003 Data from 11:36:49 10/29/2003 to 11:38:08 10/29/2003 Page 1 Transaction Java Virtual Machine (JVM) Usage Analysis - Summary Avg Avg Avg Avg Avg Avg Avg Avg Avg Avg Avg Avg Tran #Tasks Response Dispatch User CPU Suspend DispWait KY8 CPU J8 CPU JVM Elap JVMITime JVM Meth JVMRTime JVM Susp Time Time Time Time Time Time Time Time Time Time Time Time SQLM 139 .1138 .0865 .0480 .0273 .0061 .0474 .0466 .1111 .0000 .0580 .0531 .0252 SQLN 64 .3211 .3029 .0757 .0182 .0047 .0751 .0744 .3195 .0000 .2599 .0596 .0175 SQL1 72 .0845 .0503 .0250 .0342 .0110 .0243 .0199 .0818 .0000 .0712 .0106 .0329 SQL3 143 .3123 .2849 .0455 .0274 .0058 .0448 .0441 .3076 .1347 .1626 .0104 .0264 SQL4 79 .4906 .4535 .1027 .0371 .0126 .1020 .0991 .4807 .1644 .2667 .0496 .0331 SQL5 279 .0809 .0496 .0248 .0313 .0099 .0242 .0211 .0782 .0000 .0683 .0098 .0303 SQL6 75 .0788 .0529 .0268 .0259 .0085 .0261 .0228 .0767 .0000 .0641 .0126 .0250 SQL7 66 .0918 .0600 .0264 .0318 .0103 .0258 .0214 .0885 .0000 .0791 .0093 .0298 ******************************** BOTTOM OF DATA ***********************************************************************************
Chapter 13. Enterprise JavaBeans in CICS 303

Figure 13-32 AOR PJA6 using 20 threads and five calls per thread
Figure 13-33 AOR PJA7 using 20 threads and five calls per thread
When we looked at the performance reports that we created, we found that response times did not improve at all. AOR PJA6 processed 223 transactions while AOR PJA7 processed 1077 transactions. We checked the number of JVMs that we created and found that PJA6 was using ten JVMs, which is the maximum. PJA7 was using five JVMs. Therefore, the average response time of PJA6 was influenced by method call invocations that were suspended waiting for JVM initialization. After the serially reusable JVM was built, response times improved dramatically.
We used a performance list report (Figure 13-34 and Figure 13-35) to select the first and last task number of the workload. Then we used the time stamps to calculate the time that the workload needed to complete. Using 10 threads took 78 seconds to complete 1300 method call invocations. That is an average of 17 transactions per second. The workload that was using 20 threads took 5 seconds longer, which is 83 seconds. This is a throughput of 17 transactions per second.
V1R3M0 CICS Performance Analyzer Performance Summary __________________________________________________ SUMM0001 Printed at 17:49:20 10/29/2003 Data from 11:07:43 10/29/2003 to 12:07:54 10/29/2003 Page 1 Transaction Java Virtual Machine (JVM) Usage Analysis - Summary Avg Avg Avg Avg Avg Avg Avg Avg Avg Avg Avg Avg Tran #Tasks Response Dispatch User CPU Suspend DispWait KY8 CPU J8 CPU JVM Elap JVMITime JVM Meth JVMRTime JVM Susp Time Time Time Time Time Time Time Time Time Time Time Time SQLM 31 2.2308 2.1184 .1788 .1125 .0411 .1781 .1774 2.1774 1.0735 .9270 .1769 .1066 SQLN 16 4.5143 4.4616 .3467 .0527 .0287 .3461 .3453 4.4876 2.2283 2.1032 .1562 .0494 SQL1 16 .2312 .1384 .0257 .0927 .0664 .0250 .0204 .2261 .0000 .1566 .0695 .0892 SQL3 41 .2085 .1019 .0245 .1066 .0436 .0238 .0230 .1956 .0000 .1568 .0388 .0946 SQL4 19 3.4753 3.3043 .2528 .1704 .1010 .2521 .2491 3.4522 1.5664 1.6637 .2221 .1647 SQL5 64 1.1534 1.0292 .0861 .1242 .0746 .0854 .0824 1.1411 .5518 .5607 .0286 .1194 SQL6 23 2.7519 2.6145 .2017 .1374 .0689 .2010 .1975 2.6872 1.2425 1.4043 .0403 .1335 SQL7 13 .2237 .1116 .0258 .1120 .0717 .0252 .0205 .2143 .0000 .1742 .0401 .1047
V1R3M0 CICS Performance Analyzer Performance Summary __________________________________________________ SUMM0001 Printed at 17:51:08 10/29/2003 Data from 11:27:19 10/29/2003 to 11:58:47 10/29/2003 Page 1 Transaction Java Virtual Machine (JVM) Usage Analysis - Summary Avg Avg Avg Avg Avg Avg Avg Avg Avg Avg Avg Avg Tran #Tasks Response Dispatch User CPU Suspend DispWait KY8 CPU J8 CPU JVM Elap JVMITime JVM Meth JVMRTime JVM Susp Time Time Time Time Time Time Time Time Time Time Time Time SQLM 169 .2746 .1550 .0432 .1196 .0243 .0425 .0417 .2060 .0000 .0848 .1211 .0517 SQLN 84 .6339 .5718 .0921 .0620 .0163 .0914 .0907 .6010 .0000 .4948 .1061 .0300 SQL1 84 .1827 .0653 .0212 .1174 .0389 .0206 .0162 .1291 .0000 .1089 .0201 .0652 SQL3 159 .1693 .0526 .0164 .1167 .0233 .0157 .0149 .1081 .0000 .0899 .0182 .0563 SQL4 81 .3852 .2478 .0598 .1373 .0452 .0591 .0562 .3273 .0000 .2112 .1160 .0808 SQL5 336 .1717 .0599 .0206 .1118 .0315 .0199 .0169 .1154 .0000 .0969 .0184 .0573 SQL6 77 .2344 .0629 .0198 .1714 .0401 .0191 .0157 .1494 .0000 .1289 .0206 .0892 SQL7 87 .2190 .0904 .0316 .1286 .0466 .0309 .0264 .1654 .0000 .1411 .0243 .0763 ******************************** BOTTOM OF DATA ***********************************************************************************
304 CICS Performance Analyzer

Figure 13-34 Transactions per second: 20 threads
Figure 13-35 Transaction per second 10 threads
13.3.4 Running the JDBC workloadTo see a comparison with JDBC and SQLJ versions of the DistributedTraderAgent enterprise bean, we started another workload using the Java program that we created earlier. We specified the following values:
� JDBC_WLM.cmd� 10� 10
This setup again starts the client code for the JDBC enterprise bean 100 times in total. We used 10 threads using 10 calls per thread, which simulated 10 EJB clients running concurrently.
When the workload finished, we flushed the CICS monitoring buffers and switched SMF data sets using the /I SMF command. When the SMF data set was archived, we performed the following steps to create a performance summary report for both AORs PJA6 and PJA7:
1. Use the Take-Up from SMF function to update the system definition with new SMF data.2. Create a new system group for both AORs PJA6 and PJA7.3. Reuse the Report Set that you used for the SQL workload. 4. Edit the report interval information in the Performance select statement.5. Run the report.
We used the performance list report to select the first and last task number of the workload (Figure 13-36 and Figure 13-37).
V1R3M0 CICS Performance Analyzer Performance List __________________________________________________ LIST0001 Printed at 15:12:06 10/29/2003 Data from 11:39:50 10/29/2003 APPLID SCSCPJA7 Page 1 Transaction Java Virtual Machine (JVM) Usage Analysis - Detail Tran Userid TaskNo Stop Response Dispatch User CPU KY8 CPU J8 CPU JVM Elap JVMITime JVM Meth JVMRTime JVM Susp Time Time Time Time Time Time Time Time Time Time Time SQLN CICSUSER 9645 11:39:50.683 .4234 .4117 .0649 .0642 .0633 .4227 .0000 .3853 .0373 .0116 SQL5 CICSUSER 10721 11:41:13.794 .0395 .0251 .0193 .0187 .0154 .0382 .0000 .0331 .0051 .0143
____________00:01:23
V1R3M0 CICS Performance Analyzer Performance List __________________________________________________ LIST0001 Printed at 15:38:29 10/29/2003 Data from 11:36:50 10/29/2003 APPLID SCSCPJA7 Page 1 Transaction Java Virtual Machine (JVM) Usage Analysis - Detail Tran Userid TaskNo Stop Response Dispatch User CPU KY8 CPU J8 CPU JVM Elap JVMITime JVM Meth JVMRTime JVM Susp Time Time Time Time Time Time Time Time Time Time Time SQLN CICSUSER 8728 11:36:50.149 .3721 .3555 .0619 .0612 .0606 .3518 .0000 .2111 .1407 .0164 SQL5 CICSUSER 9644 11:38:08.902 .0378 .0229 .0177 .0170 .0133 .0364 .0000 .0310 .0053 .0148
____________00:01:18
Chapter 13. Enterprise JavaBeans in CICS 305

Figure 13-36 Both AORs: 10 threads 10 calls per thread
Figure 13-37 Both AORs: 20 threads 5 calls per thread
We used the time stamps to calculate the time that the workload needed to complete (Figure 13-38 and Figure 13-39). Using 10 threads took 78 seconds to complete 1300 method call invocations. That is an average of 17 transactions per second. The workload that used 20 threads took 75 seconds. This is the throughput of 17 transactions per second.
Figure 13-38 Transactions per second: 20 threads
V1R3M0 CICS Performance Analyzer Performance Summary __________________________________________________ SUMM0001 Printed at 16:11:59 10/29/2003 Data from 11:59:29 10/29/2003 to 12:01:19 10/29/2003 Page 1 Transaction Java Virtual Machine (JVM) Usage Analysis - Summary Avg Avg Avg Avg Avg Avg Avg Avg Avg Avg Avg Avg Tran #Tasks Response Dispatch User CPU Suspend DispWait KY8 CPU J8 CPU JVM Elap JVMITime JVM Meth JVMRTime JVM Susp Time Time Time Time Time Time Time Time Time Time Time Time JDBM 200 .1849 .1502 .0646 .0346 .0072 .0639 .0631 .1833 .0000 .1231 .0602 .0338 JDBN 100 1.3104 1.1317 .0913 .1787 .0097 .0907 .0899 1.1915 .0114 .9315 .2486 .0659 JDB1 100 .0970 .0533 .0241 .0437 .0119 .0234 .0191 .0949 .0000 .0886 .0064 .0429 JDB3 200 .0855 .0485 .0225 .0370 .0080 .0219 .0211 .0842 .0000 .0775 .0067 .0362 JDB4 100 .1722 .1133 .0525 .0589 .0163 .0518 .0489 .1690 .0000 .1078 .0611 .0577 JDB5 400 .0894 .0442 .0232 .0451 .0101 .0225 .0196 .0873 .0000 .0808 .0064 .0443 JDB6 100 .1035 .0622 .0264 .0413 .0107 .0258 .0227 .1011 .0000 .0947 .0064 .0403 JDB7 100 .0920 .0569 .0273 .0350 .0095 .0267 .0223 .0891 .0000 .0806 .0085 .0344
V1R3M0 CICS Performance Analyzer Performance Summary __________________________________________________ SUMM0001 Printed at 17:38:06 10/29/2003 Data from 11:36:27 10/29/2003 to 12:57:33 10/29/2003 Page 1 Transaction Java Virtual Machine (JVM) Usage Analysis - Summary Avg Avg Avg Avg Avg Avg Avg Avg Avg Avg Avg Avg Tran #Tasks Response Dispatch User CPU Suspend DispWait KY8 CPU J8 CPU JVM Elap JVMITime JVM Meth JVMRTime JVM Susp Time Time Time Time Time Time Time Time Time Time Time Time JDBM 200 .4032 .2486 .0486 .1544 .0485 .0480 .0472 .3376 .0000 .1628 .1748 .0896 JDBN 100 .7467 .6325 .0873 .1142 .0395 .0866 .0859 .7011 .0000 .5405 .1606 .0695 JDB1 100 .2517 .0962 .0230 .1554 .0625 .0224 .0180 .2100 .0000 .1890 .0209 .1149 JDB3 200 .2397 .0916 .0186 .1481 .0494 .0180 .0172 .1775 .0000 .1525 .0250 .0866 JDB4 100 .5390 .3088 .0600 .2301 .0894 .0592 .0563 .4348 .0000 .2586 .1761 .1278 JDB5 400 .2316 .0833 .0214 .1483 .0595 .0208 .0178 .1811 .0000 .1592 .0219 .0991 JDB6 100 .2670 .0938 .0205 .1731 .0710 .0198 .0168 .1974 .0000 .1748 .0226 .1050 JDB7 100 .2572 .0951 .0225 .1621 .0680 .0218 .0174 .1944 .0000 .1690 .0253 .1008
V1R3M0 CICS Performance Analyzer Performance List __________________________________________________ LIST0001 Printed at 16:39:29 10/29/2003 Data from 12:03:11 10/29/2003 APPLID SCSCPJA7 Page 1 Transaction Java Virtual Machine (JVM) Usage Analysis - Detail Tran Userid TaskNo Stop Response Dispatch User CPU KY8 CPU J8 CPU JVM Elap JVMITime JVM Meth JVMRTime JVM Susp Time Time Time Time Time Time Time Time Time Time Time JDBN CICSUSER 11403 12:03:11.185 .2333 .2216 .0550 .0543 .0535 .2322 .0000 .1965 .0356 .0115 JDB5 CICSUSER 12146 12:04:26.361 .0948 .0488 .0142 .0134 .0108 .0910 .0002 .0662 .0246 .0458
____________00:01:15
306 CICS Performance Analyzer

Figure 13-39 Transactions per second: 10 threads
13.3.5 Running the JCICS (VSAM) workloadWe started the JCICS (VSAM) version of the DistributedTraderAgent enterprise bean. We started another workload using the Java program that we created earlier. We specified the following values:
� JVSM_WLM.cmd� 10� 10
This started the client code for the JCICS (VSAM) enterprise bean 100 times in total. We are used 10 threads, with 10 calls per thread, simulating 10 EJB clients running concurrently.
When the workload finished, we flushed the CICS monitoring buffers and switched SMF data sets using the /I SMF command. When the SMF data set was archived, we performed the following steps to create a performance summary report for both AORs PJA6 and PJA7:
1. Use the Take-Up from SMF function to update the system definition with new SMF data.2. Create a new system group for both AORs PJA6 and PJA7.3. Reuse the Report Set we were using for the SQL workload. 4. Edit the report interval information in the Performance select statement.5. Run the report.
We used the Performance List report to select the first and last task number of the workload (Figure 13-40 and Figure 13-41).
Figure 13-40 Both AORs: 10 threads, 10 calls per thread
V1R3M0 CICS Performance Analyzer Performance List __________________________________________________ LIST0001 Printed at 16:20:45 10/29/2003 Data from 11:59:57 10/29/2003 APPLID SCSCPJA6 Page 1 Transaction Java Virtual Machine (JVM) Usage Analysis - Detail Tran Userid TaskNo Stop Response Dispatch User CPU KY8 CPU J8 CPU JVM Elap JVMITime JVM Meth JVMRTime JVM Susp Time Time Time Time Time Time Time Time Time Time Time JDBN CICSUSER 4842 11:59:57.522 .9726 .9585 .2510 .2504 .2496 .9719 .0000 .9336 .0382 .0139 JDB5 CICSUSER 5463 12:01:15.939 .0389 .0236 .0179 .0173 .0140 .0376 .0000 .0345 .0031 .0152
____________00:01:18
V1R3M0 CICS Performance Analyzer Performance Summary __________________________________________________ SUMM0001 Printed at 13:23:04 11/06/2003 Data from 13:19:33 11/06/2003 to 13:20:45 11/06/2003 Page 1CICS PA JVSM Summary Report Avg Avg Avg Avg Avg Avg Avg Avg Avg Avg Avg Avg Tran #Tasks Response Dispatch User CPU Suspend DispWait KY8 CPU J8 CPU JVM Elap JVMITime JVM Meth JVMRTime JVM Susp Time Time Time Time Time Time Time Time Time Time Time Time JCIM 200 .1870 .1582 .0762 .0288 .0076 .0752 .0752 .1848 .0000 .1364 .0484 .0278 JCIN 100 .1451 .1271 .0649 .0180 .0045 .0640 .0640 .1417 .0000 .0970 .0447 .0173 JCI1 100 .1555 .1245 .0689 .0310 .0075 .0679 .0679 .1538 .0000 .1470 .0068 .0303 JCI3 200 .1376 .1047 .0516 .0329 .0068 .0507 .0507 .1355 .0000 .1284 .0072 .0320 JCI4 100 .1839 .1504 .0770 .0335 .0117 .0759 .0759 .1820 .0000 .1312 .0507 .0327 JCI5 400 .1353 .1039 .0478 .0314 .0073 .0468 .0468 .1330 .0000 .1252 .0078 .0303 JCI6 100 .1962 .1642 .0757 .0320 .0088 .0747 .0747 .1939 .0000 .1341 .0597 .0309 JCI7 100 .1448 .1135 .0559 .0313 .0090 .0549 .0549 .1426 .0000 .1354 .0071 .0305
Chapter 13. Enterprise JavaBeans in CICS 307
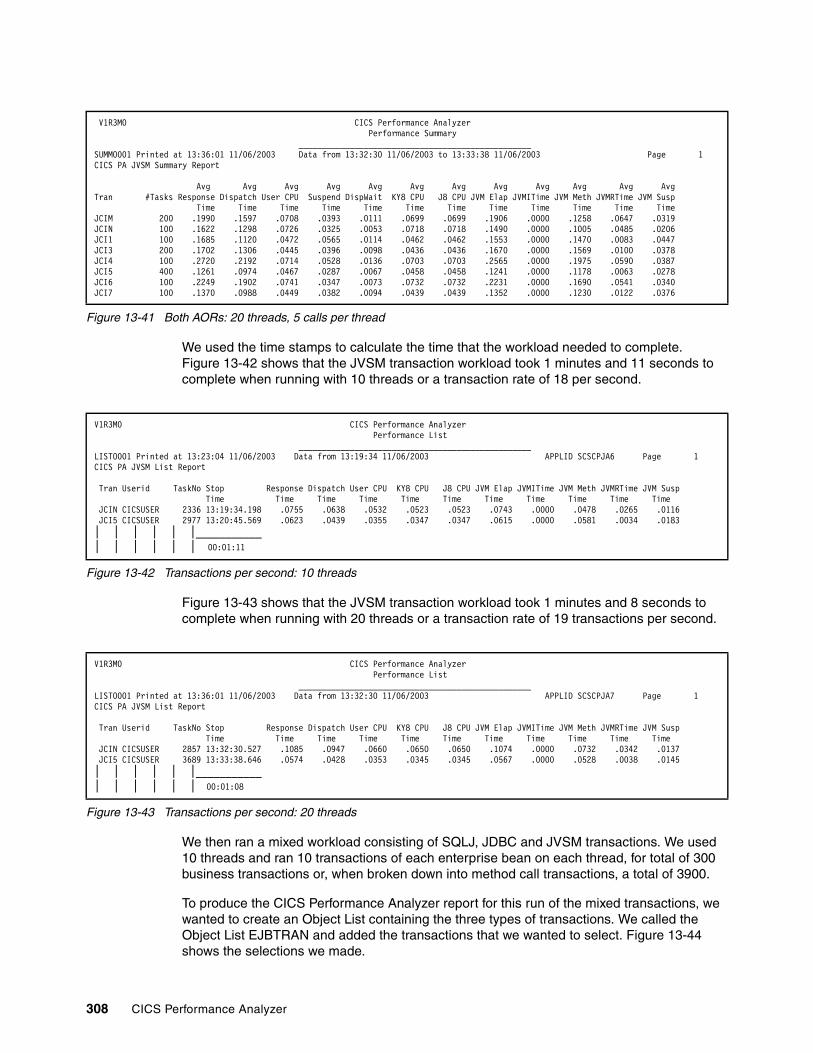
Figure 13-41 Both AORs: 20 threads, 5 calls per thread
We used the time stamps to calculate the time that the workload needed to complete. Figure 13-42 shows that the JVSM transaction workload took 1 minutes and 11 seconds to complete when running with 10 threads or a transaction rate of 18 per second.
Figure 13-42 Transactions per second: 10 threads
Figure 13-43 shows that the JVSM transaction workload took 1 minutes and 8 seconds to complete when running with 20 threads or a transaction rate of 19 transactions per second.
Figure 13-43 Transactions per second: 20 threads
We then ran a mixed workload consisting of SQLJ, JDBC and JVSM transactions. We used 10 threads and ran 10 transactions of each enterprise bean on each thread, for total of 300 business transactions or, when broken down into method call transactions, a total of 3900.
To produce the CICS Performance Analyzer report for this run of the mixed transactions, we wanted to create an Object List containing the three types of transactions. We called the Object List EJBTRAN and added the transactions that we wanted to select. Figure 13-44 shows the selections we made.
V1R3M0 CICS Performance Analyzer Performance Summary __________________________________________________ SUMM0001 Printed at 13:36:01 11/06/2003 Data from 13:32:30 11/06/2003 to 13:33:38 11/06/2003 Page 1CICS PA JVSM Summary Report Avg Avg Avg Avg Avg Avg Avg Avg Avg Avg Avg Avg Tran #Tasks Response Dispatch User CPU Suspend DispWait KY8 CPU J8 CPU JVM Elap JVMITime JVM Meth JVMRTime JVM Susp Time Time Time Time Time Time Time Time Time Time Time Time JCIM 200 .1990 .1597 .0708 .0393 .0111 .0699 .0699 .1906 .0000 .1258 .0647 .0319 JCIN 100 .1622 .1298 .0726 .0325 .0053 .0718 .0718 .1490 .0000 .1005 .0485 .0206 JCI1 100 .1685 .1120 .0472 .0565 .0114 .0462 .0462 .1553 .0000 .1470 .0083 .0447 JCI3 200 .1702 .1306 .0445 .0396 .0098 .0436 .0436 .1670 .0000 .1569 .0100 .0378 JCI4 100 .2720 .2192 .0714 .0528 .0136 .0703 .0703 .2565 .0000 .1975 .0590 .0387 JCI5 400 .1261 .0974 .0467 .0287 .0067 .0458 .0458 .1241 .0000 .1178 .0063 .0278 JCI6 100 .2249 .1902 .0741 .0347 .0073 .0732 .0732 .2231 .0000 .1690 .0541 .0340 JCI7 100 .1370 .0988 .0449 .0382 .0094 .0439 .0439 .1352 .0000 .1230 .0122 .0376
V1R3M0 CICS Performance Analyzer Performance List __________________________________________________ LIST0001 Printed at 13:23:04 11/06/2003 Data from 13:19:34 11/06/2003 APPLID SCSCPJA6 Page 1 CICS PA JVSM List Report Tran Userid TaskNo Stop Response Dispatch User CPU KY8 CPU J8 CPU JVM Elap JVMITime JVM Meth JVMRTime JVM Susp Time Time Time Time Time Time Time Time Time Time Time JCIN CICSUSER 2336 13:19:34.198 .0755 .0638 .0532 .0523 .0523 .0743 .0000 .0478 .0265 .0116 JCI5 CICSUSER 2977 13:20:45.569 .0623 .0439 .0355 .0347 .0347 .0615 .0000 .0581 .0034 .0183 | | | | | |___________| | | | | | 00:01:11
V1R3M0 CICS Performance Analyzer Performance List __________________________________________________ LIST0001 Printed at 13:36:01 11/06/2003 Data from 13:32:30 11/06/2003 APPLID SCSCPJA7 Page 1CICS PA JVSM List Report Tran Userid TaskNo Stop Response Dispatch User CPU KY8 CPU J8 CPU JVM Elap JVMITime JVM Meth JVMRTime JVM Susp Time Time Time Time Time Time Time Time Time Time Time JCIN CICSUSER 2857 13:32:30.527 .1085 .0947 .0660 .0650 .0650 .1074 .0000 .0732 .0342 .0137 JCI5 CICSUSER 3689 13:33:38.646 .0574 .0428 .0353 .0345 .0345 .0567 .0000 .0528 .0038 .0145 | | | | | |___________| | | | | | 00:01:08
308 CICS Performance Analyzer

Figure 13-44 Object List selection
We added the Object List to the Performance select statements for both the List and Summary reports. Figure 13-45 shows the Object List being used in the Performance Select Statement screen.
Figure 13-45 Performance Select Statement screen
File Edit Confirm Options Help ------------------------------------------------------------------------------ EDIT Object List - EJBTRAN Row 1 to 3 of 3 Command ===> Scroll ===> CSR Description . . . . CICS PA Object List Specify the Object List values: / 1st Value 2nd Value Sublist SQL* JDB* JCI*
File Edit Object Lists Options Help ------------------------------------------------------------------------------ EJBREP4 - Performance Select Statement Row 1 of 9 More: > Command ===> Scroll ===> CSR Active --------------- Report Interval ---------------- Inc Start -------- From --------- --------- To ---------- Exc Stop MM/DD/YYYY HH:MM:SS.TH MM/DD/YYYY HH:MM:SS.TH ------------------------------------------------------------------------------ Inc Field --- Value or Range --- Object / Exc Name + Type Value/From To List + INC TRAN EJBTRAN
Chapter 13. Enterprise JavaBeans in CICS 309

Figure 13-46 shows the CICS Performance Analyzer Performance Summary report.
Figure 13-46 Total run summary report
To calculate the elapsed time, we used the Performance List report (Figure 13-47). Here, we ran all the transactions in 4 minutes. We reached throughput of 16 transactions per second.
Figure 13-47 Transactions per second: 10 threads
13.4 ConclusionCICS Performance Analyzer proved useful in providing reports on the use of JVMs in a CICS environment. From the CICS PA reports, in these runs, the JVSM transaction performed slightly better than the SQLJ and JDBC transactions. However, we did not see noticeable difference in performance between SQLJ and JDBC versions of our application. The reason may be that we did not customize the SQLJ default serializable profiles on z/OS, assuming that it was done in an earlier ITSO project when the application was developed. By default, if you run an SQLJ program with an uncustomized profile, SQL calls are mapped to pure JDBC calls at run time. Since there is no easy way to check whether the JAR file contains customized or uncustomized profiles, we decided not to investigate this issue further.
V1R3M0 CICS Performance Analyzer Performance Summary __________________________________________________ SUMM0001 Printed at 11:15:12 11/07/2003 Data from 11:07:46 11/07/2003 to 11:11:47 11/07/2003 Page 1Transaction Java Virtual Machine (JVM) Usage Analysis - Summary Avg Avg Avg Avg Avg Avg Avg Avg Avg Avg Avg Avg Tran #Tasks Response Dispatch User CPU Suspend DispWait KY8 CPU J8 CPU JVM Elap JVMITime JVM Meth JVMRTime JVM Susp Time Time Time Time Time Time Time Time Time Time Time Time JCIM 200 .1469 .1225 .0762 .0244 .0054 .0753 .0753 .1451 .0000 .0875 .0576 .0236 JCIN 100 .1489 .1254 .0730 .0235 .0047 .0722 .0722 .1472 .0000 .0838 .0633 .0228 JCI1 100 .1142 .0848 .0444 .0294 .0060 .0435 .0435 .1123 .0000 .1055 .0067 .0286 JCI3 200 .1127 .0862 .0447 .0265 .0060 .0438 .0438 .1102 .0000 .1030 .0072 .0256 JCI4 100 .1713 .1419 .0846 .0293 .0077 .0836 .0836 .1697 .0000 .1038 .0659 .0287 JCI5 400 .1042 .0796 .0436 .0247 .0052 .0427 .0427 .1025 .0000 .0950 .0075 .0240 JCI6 100 .1673 .1409 .0793 .0264 .0063 .0783 .0783 .1657 .0000 .1025 .0632 .0257 JCI7 100 .1026 .0756 .0453 .0271 .0055 .0443 .0443 .1011 .0000 .0948 .0062 .0264 JDBM 200 .1666 .1422 .0835 .0244 .0063 .0826 .0817 .1640 .0000 .1011 .0629 .0235 JDBN 100 .5527 .5250 .1369 .0277 .0058 .1360 .1352 .5504 .0000 .4836 .0668 .0269 JDB1 100 .1266 .0932 .0515 .0334 .0107 .0506 .0461 .1237 .0000 .1172 .0065 .0325 JDB3 200 .1070 .0818 .0436 .0252 .0063 .0426 .0418 .1029 .0000 .0946 .0082 .0244 JDB4 100 .1712 .1382 .0814 .0330 .0120 .0805 .0775 .1682 .0000 .1067 .0615 .0317 JDB5 400 .1256 .0986 .0519 .0270 .0088 .0510 .0479 .1232 .0000 .1139 .0093 .0262 JDB6 100 .1732 .1477 .0863 .0255 .0087 .0854 .0821 .1703 .0000 .1099 .0604 .0243 JDB7 100 .1308 .1002 .0499 .0307 .0125 .0489 .0444 .1276 .0000 .1196 .0080 .0295 SQLM 200 .1885 .1639 .0820 .0246 .0068 .0811 .0803 .1842 .0000 .1245 .0597 .0218 SQLN 100 .3533 .3262 .1311 .0271 .0049 .1302 .1294 .3512 .0000 .2843 .0669 .0263 SQL1 100 .1600 .1259 .0509 .0341 .0105 .0500 .0455 .1518 .0000 .1436 .0082 .0288 SQL3 200 .1444 .1168 .0490 .0276 .0074 .0481 .0473 .1404 .0000 .1297 .0107 .0251 SQL4 100 .2016 .1712 .0841 .0304 .0123 .0831 .0801 .1972 .0000 .1384 .0588 .0282 SQL5 400 .1491 .1202 .0500 .0289 .0105 .0491 .0460 .1454 .0000 .1354 .0100 .0273 SQL6 100 .2045 .1749 .0812 .0296 .0108 .0802 .0767 .1968 .0000 .1351 .0617 .0277 SQL7 100 .1498 .1172 .0518 .0325 .0122 .0508 .0464 .1450 .0000 .1363 .0087 .0295
V1R3M0 CICS Performance Analyzer Performance List __________________________________________________ LIST0001 Printed at 11:15:12 11/07/2003 Data from 11:07:46 11/07/2003 APPLID SCSCPJA6 Page 1 Transaction Java Virtual Machine (JVM) Usage Analysis - Detail Tran Userid TaskNo Stop Response Dispatch User CPU KY8 CPU J8 CPU JVM Elap JVMITime JVM Meth JVMRTime JVM Susp Time Time Time Time Time Time Time Time Time Time Time SQLN CICSUSER 2710 11:07:46.745 .3102 .2787 .1206 .1196 .1187 .3091 .0000 .2694 .0396 .0314 JCI5 CICSUSER 4600 11:11:47.616 .0636 .0489 .0410 .0400 .0400 .0627 .0000 .0588 .0039 .0146 | | | | | |____________| | | | | | 00:04:00
310 CICS Performance Analyzer

Chapter 14. Application Naming support
Application Naming support allows you to exercise greater control over the identification and collection of performance data. It allows more granularity over a “transaction ID” since it allows you to specify an alternate transaction ID. This way you can relate individual transactions into a single application name or to separate different linked programs that run under one common transaction ID as different transactions.
A good reason to do so can be an application that starts from one common menu. Depending on the selected option, a different program is run. On entry into each program, you can assign a different alternate transaction code for the execution of this program. With CICS Performance Analyzer (PA), you can select this alternate transaction code instead of using the common transaction ID.
This chapter discusses the Application Naming support introduced by CICS Transaction Server (TS) V2.2 authorized program analysis report (APAR) PQ63143. The equivalent CICS TS V1.3 APAR is PQ63141. For a description of Transaction Resource Monitoring support also introduced by these APARs, refer to 6.7, “Transaction Resource Monitoring” on page 163. For the complete list of enabling program temporary fixes (PTFs), refer to Table 2-1 on page 26.
14
© Copyright IBM Corp. 2003. All rights reserved. 311

14.1 Implementing Application Naming supportA new parameter, APPLNAME={NO | YES}, is added to the DFHMCT TYPE=INITIAL macro. The APPLNAME option specifies whether you want to use the application support provided by CICS monitoring. This is an enabling function that allows application programs to invoke special CICS event monitoring points called DFHAPPL.1 and DFHAPPL.2.
When you specify APPLNAME=YES, two macros (see Example 14-1) are internally generated.
Example 14-1 Internal generated event monitoring points (EMPs) with APPLNAME=YES
DFHMCT TYPE=EMP,CLASS=PERFORM,ID=(DFHAPPL.1), X PERFORM=(MOVE(0,4)),FIELD=(1,APPLNAME) @BA63143 DFHMCT TYPE=EMP,CLASS=PERFORM,ID=(DFHAPPL.2), X PERFORM=(MOVE(4,8)) @BA63143
There is one user event monitoring point field with name APPLNAME added to the system management facility (SMF) record. The SMF record field contains 12 bytes. Two monitoring points, DFHAPPL.1 and DFHAPPL.2, perform the following default operation when invoked:
� DFHAPPL.1: Moves four characters from the address specified on the DATA1 option of the EXEC CICS MONITOR command to an offset zero in the SMF field.
� DFHAPPL.2: Moves eight characters from the address specified on the DATA1 option of the EXEC CICS MONITOR command to an offset four in the SMF field.
Unlike EMPs which you define explicitly with your own EMP IDs, data moved by invoking the APPLNAME EMPs is not reset by CICS after you force the writing of an SMF record by using the DELIVERY option. However, your application can set different values by invoking the APPLNAME EMPs again.
CICS Performance Analyzer implements these changes by splitting the 12-byte SMF field into two fields, a four-byte field called APPLTRAN and an eight-byte field called APPLPROG. These fields can be requested in Report Forms or the FIELDS/BY command operands. APPLTRAN and APPLPROG are new Selection Criteria fields that allow filtering of reports by Application Naming transaction ID and program.
14.2 Application Naming sampleThis section provides a sample EMP, the monitoring control table (MCT), and the results of running the program.
14.2.1 Sample programTo show how you can use the DFHAPPL EMPs, we developed the program shown in Example 14-2. The basic flow of this program is:
1. Write actual transaction code and program name to SMF record in DFHAPPL provided field.
2. Write the date and time to SMF record in its own generated EMP2 field. This EMP also updates a counter.
3. Update the counter again and force the writing of the SMF record.
312 CICS Performance Analyzer

4. Update the counter twice.
5. Update counter again and force the writing of a second SMF record.
6. Change the values in the DFHAPPL provided fields.
7. Stop the program so that a third SMF record is written.
Example 14-2 Sample program to show DFHAPPL EMP usage
WORKING-STORAGE SECTION. 01 DFHAPPL PIC X(8) VALUE 'DFHAPPL'. 01 APPLDATA-PTR POINTER. 01 APPLTRAN PIC X(4). 01 APPLPROG PIC X(8). 01 APPLDATA-LEN PIC S9(8) COMP VALUE 0. * 01 CICS-TIME PIC X(08) VALUE SPACES. 01 EMP2P PIC X(8) VALUE 'EMP2'. 01 PGMTIME-PTR POINTER. 01 PGMTIME. 03 CURRENT-DATE PIC X(10). 03 FILLER PIC X(01) VALUE SPACES. 03 CURRENT-TIME PIC X(08). 01 PGMTIME-LEN PIC S9(8) COMP VALUE 19. * 01 ITSOTRAN PIC X(4) VALUE 'ITSO'. 01 ITSOPROG PIC X(8) VALUE 'ITSOPROG'. * PROCEDURE DIVISION. BEGIN.
* * OBTAIN TRANSACTION ID FROM EIB AND USE E.C.ASSIGN * FOR PROGRAM NAME. * MOVE EIBTRNID TO APPLTRAN. EXEC CICS ASSIGN PROGRAM(APPLPROG) END-EXEC. * * WRITE TO DFHAPPL EMP. * SET APPLDATA-PTR TO ADDRESS OF APPLTRAN. EXEC CICS MONITOR POINT(1) ENTRYNAME(DFHAPPL) DATA1(APPLDATA-PTR) DATA2(APPLDATA-LEN) END-EXEC. * SET APPLDATA-PTR TO ADDRESS OF APPLPROG. EXEC CICS MONITOR POINT(2) ENTRYNAME(DFHAPPL) DATA1(APPLDATA-PTR) DATA2(APPLDATA-LEN) END-EXEC. * * OBTAIN DATE AND TIME *
EXEC CICS ASKTIME ABSTIME(CICS-TIME) END-EXEC. EXEC CICS FORMATTIME ABSTIME(CICS-TIME) DDMMYYYY(CURRENT-DATE)
Chapter 14. Application Naming support 313

DATESEP TIME(CURRENT-TIME) TIMESEP END-EXEC. * * WRITE TO EMP2. AT THE SAME TIME WE UPDATE OUR COUNTER. * SET PGMTIME-PTR TO ADDRESS OF PGMTIME. EXEC CICS MONITOR POINT(1) ENTRYNAME(EMP2P) DATA1(PGMTIME-PTR) DATA2(PGMTIME-LEN) END-EXEC. * * UPDATE COUNTER AGAIN AND WRITE SMF RECORD USING THE * DELIVER OPTION IN THE EMP. * EXEC CICS MONITOR POINT(2) ENTRYNAME(EMP2P)
END-EXEC. * * UPDATE COUNTER TWICE * EXEC CICS MONITOR POINT(3) ENTRYNAME(EMP2P) END-EXEC. EXEC CICS MONITOR POINT(3) ENTRYNAME(EMP2P) END-EXEC. * * UPDATE COUNTER AGAIN AND WRITE SMF RECORD USING THE * DELIVER OPTION IN THE EMP. * EXEC CICS MONITOR POINT(2) ENTRYNAME(EMP2P) END-EXEC. * * MOVE NEW VALLUES TO APPLTRAN. * MOVE ITSOTRAN TO APPLTRAN. MOVE ITSOPROG TO APPLPROG. * * WRITE NEW VALUES TO SMF RECORD. * SET APPLDATA-PTR TO ADDRESS OF APPLTRAN. EXEC CICS MONITOR POINT(1) ENTRYNAME(DFHAPPL) DATA1(APPLDATA-PTR) DATA2(APPLDATA-LEN) END-EXEC. * SET APPLDATA-PTR TO ADDRESS OF APPLPROG. EXEC CICS MONITOR POINT(2) ENTRYNAME(DFHAPPL) DATA1(APPLDATA-PTR) DATA2(APPLDATA-LEN) END-EXEC. * GOBACK.
14.2.2 Monitoring control table Example 14-3 shows the part of the MCT that we wrote to contain the EMPs as referenced in the program.
314 CICS Performance Analyzer

Example 14-3 MCT part for Application Naming sample
I1 DFHMCT TYPE=INITIAL, * APPLNAME=YES, * SUFFIX=I1 * ..*
DFHMCT TYPE=EMP, * CLASS=PERFORM, * ID=(EMP2.1), * COUNT=(1,COUNTER), * FIELD=(1,PGMTIME), * PERFORM=(ADDCNT(1,1),MOVE(0,19)) * DFHMCT TYPE=EMP, * CLASS=PERFORM, * ID=(EMP2.2), * PERFORM=(ADDCNT(1,1),DELIVER) * DFHMCT TYPE=EMP, * CLASS=PERFORM, * ID=(EMP2.3), * PERFORM=(ADDCNT(1,1)) * DFHMCT TYPE=FINAL END
In this MCT, APPLNAME=YES is in the DFHMCT TYPE=INITIAL macro that results in the automatic generation of the APPLNAME field for the DFHAPPL EMP.
The fields that we added ourselves are:
� EMP2.1: This EMP defines two fields. The first field is a counter field with name COUNTER that is incremented by one every time we execute an EXEC CICS MONITOR POINT(1) command referencing this EMP. The second field is a character field with the name PGMTIME. Nineteen bytes of data are moved to this field while updating the counter when you run the EXEC CICS MONITOR POINT(1) command.
� EMP2.2: This field acts on the same counter that is defined in EMP2.1. When executing an EXEC CICS MONITOR POINT(2) command, the counter is incremented by 1 and the writing of an SMF record is requested through the DELIVERY option.
� EMP2.3: This field also acts on the same counter as defined in EMP2.1. Running an EXEC CICS MONITOR command on this EMP only increments the counter by one with no other action.
14.2.3 Program run results using the Performance List reportTo see the results of a single program run, from CICS PA, we selected the existing SCSCPJA6 definition to update it. We only changed the title and the new SMF data set name. Next, we moved the cursor under Dictionary and entered 1 to create a new dictionary record in the specified dictionary data set. Figure 14-1 shows the Systems Definition screen with those updates.
Chapter 14. Application Naming support 315

Figure 14-1 Modified system entry for SCSCPJA6
Then we created a new Report Form. On the Primary Option Menu, we selected 3. The first Report Forms screen is displayed. On this screen, we entered NEW DFHAPPL to create a form with name DFHAPPL. In the pop-up screen, the APPLID was already filled in. We entered 1 to select a list form and pressed Enter. On the EDIT screen, we moved the fields APPLTRAN, APPLPROG, COUNTER, PGMTIME, and START before the EOR indicator. We also requested only those fields together with TRAN, PROG and TASKNO, and CPU. Figure 14-2 shows this Report Form definition.
Figure 14-2 DFHAPPL Report Form
We saved this Report Form and, in the Primary Option Menu, selected option 2 to create a new Report Set with the same name DFHAPPL. On the Report Sets main screen, we entered NEW DFHAPPL. On the resulting screen, we entered S next to List in the Performance Reports
---------------------------- System Definitions ----------------------------- File Edit Dictionary View Options Help -------------------------------------------------------------------------- CICS System Row 1 of 1 More: > Command ===> Scroll ===> CSR CICS System definition: APPLID . . . . . . . . SCSCPJA6 MVS Image . . Description . . . . . Testing for APPLNAME EMP CICS Version (VRM) . . 620 MCT Suffix . . . . . . I1 MCT Load Library . . . 'CICSSYSF.APPL62.LOADLIB' SDFHLOAD Library . . . 'CICSTS22.CICS.SDFHLOAD' Dictionary DSN . . . . 'CICSLS2.PJA6.DICTREC' / Exc SMF Data Set Name + UNIT + SEQ VOLSER + 'SMFDATA.ALLRECS.G8804V00' ********************************* End of list *****************************
File Edit Confirm Upgrade Options Help ------------------------------------------------------------------------------ EDIT LIST Report Form - DFHAPPL Row 1 of 257 More: > Command ===> Scroll ===> CSR Description . . . List Report Form Version (VRM): 620 Selection Criteria: Performance Field / Name + Type Description TRAN Transaction identifier
PROGRAM Program name TASKNO Transaction identification number APPLTRAN Application naming Tran ID APPLPROG Application naming Program COUNTER User field: CMF ID=EMP2 A001 PGMTIME User field: CMF ID=EMP2 C001
START TIMET Task start time CPU TIME CPU time EOR ---------------- End of Report ----------------
316 CICS Performance Analyzer

category. On the subsequent screen, we entered the APPLID, the Report Form name, and title. Then under the Selection Criteria heading, we selected the Performance option as shown in Figure 14-3.
Figure 14-3 DFHAPPL Performance List Report
As a result of selecting the Performance option, we received the Performance Select Statement screen (Figure 14-4). On this screen, we chose to include only those SMF records in which the field name TRAN is equal to APPL.
Figure 14-4 DFHAPPL Performance Select Statement screen
We pressed F3 to save our settings until we returned to the Report Set screen. On the Report Set screen, Global and List have Yes in the active column to indicate that these are the active options. On this screen, we entered the RUN command to run the report that generates the job to print our requested list. When the batch job finished, in the spool, we found the output shown in Figure 14-5.
File Systems Options Help ------------------------------------------------------------------------------ DFHAPPL - Performance List Report Command ===> System Selection: Report Output: APPLID . . SCSCPJA6 + DDname . . . . . . . . . LIST0001 Image . . + Print Lines per Page . . (1-255) Group . . + Report Format: Form . . . DFHAPPL + Title . . Testing of DFHAPPL EMP Selection Criteria: s Performance
File Edit Object Lists Options Help ------------------------------------------------------------------------------ DFHAPPL - Performance Select Statement Row 1 of 1 More: > Command ===> Scroll ===> CSR Active --------------- Report Interval ---------------- Inc Start -------- From --------- --------- To ---------- Exc Stop MM/DD/YYYY HH:MM:SS.TH MM/DD/YYYY HH:MM:SS.TH
------------------------------------------------------------------------------ Inc Field --- Value or Range --- Object / Exc Name + Type Value/From To List + INC TRAN APPL ********************************* End of list *********************************
Chapter 14. Application Naming support 317

Figure 14-5 Performance List report
This output shows that we have three SMF records for task number 5515. During the one time execution of our test program, we first moved the actual transaction code from the EIB and the actual program name, that we acquired through an EXEC CICS ASSIGN PROGRAM command, to the DFHAPPL Tran and Program fields. Then we obtained date and time which we moved to our own defined EMP. At the same time, we set our counter to 1.
The next EXEC CICS MONITOR command was to increment our counter a second time and to force the writing of the SMF record by using the DELIVERY option. This record is printed in the first line of our report. The first Tran and Program fields are the fields as inserted by CICS. Then we see the task number followed by the Tran and Program fields from the DFHAPPL EMP. Our counter is set to 2 and the date and time as we move in the SMF record are present. The Start Time and User CPU Time are again CICS provided fields. They show the start time of the transaction and the amount of CPU time used up to when the SMF record is written.
After this first SMF record was written, all values for all user EMPs are reset. This is different for the DFHAPPL EMP which is not reset and keeps its value. To show this, we executed monitoring point 3 of our own EMP2 twice. This results in the counter becoming 2. We then executed monitoring point 2 again, which brought our counter to a value of 3 and again forced the writing of the SMF record. This is shown in the second line of the report. The counter indeed has a value of 3 and the PGMTIME field is blanked out. Notice also that the Start Time field is the time when the second SMF record was created. The CPU time used since the creation of the SMF record up to the time of writing it, is so low that no value shows up in the field.
To show that the DFHAPPL EMP fields can be modified at any time, we now moved the values ITSO and ITSOPROG to the actual SMF record. This record is written at task end and is the third and last record written for this transaction run. We see that the CICS provided values for Tran and Program are left untouched but the values of the DFHAPPL EMP contain the new values we moved to them.
To summarize, we showed you the new Application Naming feature introduced in CICS TS V2.2 and CICS TS V1.3. We wrote a sample program that shows the basic possibilities of this new feature. To show you how you can externalize this using CICS PA, we produced a performance list report. However, since you can use the newly added fields in every selection criteria, you can use these fields in other reports as well.
V1R3M0 CICS Performance Analyzer Performance List __________________________________________________ LIST0001 Printed at 15:07:28 11/01/2003 Data from 11:55:40 10/31/2003 APPLID SCSCPJA6 Page 1 Testing of DFHAPPL EMP Tran Program TaskNo Tran Program COUNTER PGMTIME Start User CPU Time Time APPL COBAPPL 5515 APPL COBAPPL 2 31/10/2003 11:55:40 11:55:40.217 .0036 APPL COBAPPL 5515 APPL COBAPPL 3 11:55:40.357 .0000 APPL COBAPPL 5515 ITSO ITSOPROG 0 11:55:40.357 .0001 ******************************** BOTTOM OF DATA ***********************************************************************************
318 CICS Performance Analyzer

Chapter 15. CALL and LINK performance
This chapter shows how you can perform performance measurements on an individual transaction level base. It looks at performance issues associated with use of the EXEC CICS LINK command as opposed to the CALL command in CICS COBOL programs. It shows how you can use event monitoring points to add user fields to standard CICS Monitoring Facility (CMF) performance records. Plus, this chapter shows how CICS Performance Analyzer (PA) can handle these user fields.
15
Note: These scenarios were used to provide situations that allow us to demonstrate the use of CICS Performance Analyzer reports. The CICS regions were not necessarily tuned for peak performance. Therefore, these scenarios and the results provided are for demonstration purposes only. They do not provide definitive results for a customer environment.
© Copyright IBM Corp. 2003. All rights reserved. 319

15.1 Performance testingThis example first shows how you can define your own EMPs and monitoring points to do some performance testing in your own applications. We look at the overhead of the Language Environment® (LE) 370 run-time parameter CBLPSHPOP. We also look at the performance gains obtained by specifying RUWAPOOL=YES.
Then, we compare the CALL and EXEC CICS LINK commands. For all these exercises, you see how CICS Performance Analyzer can be helpful to produce similar reports on different runs with different data.
15.1.1 What is CBLPSHPOP?A CICS program can issue an EXEC CICS IGNORE or EXEC CICS HANDLE command. When this program performs an EXEC CICS LINK to another CICS program, the handle effects are not inherited by the LINKed-to program. The LINKed-to program can itself issue the EXEC CICS IGNORE or EXEC CICS HANDLE commands. Upon EXEC CICS RETURN to the first program, the LINKed-to program’s HANDLE environment is ignored and the first program continues within its own HANDLE environment. This is possible because internally, CICS keeps the HANDLE environment of the first program after an EXEC CICS LINK.
This behavior becomes different with Language Environment where programs can CALL each other. With a CALL, we do not go through CICS program control so that the HANDLE environment is not saved. If a called program executes its own EXEC CICS HANDLE, it destroys the settings of the first program. Upon return, the calling program inherits the settings of the called program and eventually runs with a HANDLE environment of which it is not aware.
To avoid this, COBOL2 run-time support always executed an EXEC CICS PUSH HANDLE command to save the current effect of EXEC CICS HANDLE and EXEC CICS IGNORE commands. Upon return, an EXEC CICS POP HANDLE command was always executed to restore the caller’s environment.
Language Environment run-time support introduced the CBLPSHPOP parameter to make the execution of the EXEC CICS PUSH HANDLE and the EXEC CICS POP HANDLE commands optional. For called programs that do not execute their own EXEC CICS HANDLE or EXEC CICS IGNORE commands or for called programs that issue their own EXEC CICS PUSH HANDLE and EXEC CICS POP HANDLE commands, you can se the CBLPSHPOP parameter to OFF to avoid the overhead of these commands.
15.1.2 CLER transactionLanguage Environment provides run-time options to control CICS program’s processing. There are four levels at which you can specify run-time options:
� Installation wide: The installation-wide options for CICS are compiled in CSECT CEEDOPT in the load module CEECCICS in data set CEE.SCEERUN. Members CEECOPT and CEEWCOPT in CEE.SCEESAMP provide a samples source and job to change installation wide definitions and to re-compile CEEDOPT.
� Region wide: The region-wide options, specific for individual CICS regions, are compiled in CSECT CEEROPT. This CSECT is link-edited into a load module of the same name and placed in a data set in the DFHRPL concatenation of the CICS job control language (JCL). Members CEECOPT and CEEWROPT in CEE.SCEESAMP provide a samples source and job to change region-wide definitions and to recompile CEEROPT. Options specified in a CEEROPT override CEEDOPT options.
320 CICS Performance Analyzer

� Application level: User-supplied application program level run-time options can be compiled in a CSECT with name CEEUOPT. This CSECT must be linked with the application program itself. Members CEEUOPT and CEEWUOPT in CEE.SCEESAMP provide a samples source and job to change application level definitions and to re-compile CEEUOPT so that it can be linked with the application program. Options specified in a CEEUOPT, override CEEDOPT, CEEROPT options, or both.
� C and PL/I programs: In C and PL/I programs, the source statements through programming language specific statements can provide run-time options.
Language Environment Authorized Program Analysis Report (APAR) PQ38838 introduced a CICS transaction called CLER that enables you to:
� Display the actually active Language Environment run-time options for this CICS region� Write the run-time options to the CESE TD queue for printing� Modify a subset of the run-time options
CLER is a conversational transaction. Figure 15-1 shows the initial screen.
Figure 15-1 CLER transaction initial screen
15.1.3 Monitoring control table You can define user data fields in performance class monitoring records. User-defined fields are called event monitoring points (EMPs). EMPs allow you to add up to 16K of your own data in each performance monitoring record. The data can consist of a combination of up to 256 counters, 256 clocks, and a single character string of up to 8192 bytes. EMPs have to be specified in the monitoring control table (MCT). The MCT is fully described in the CICS Transaction Server for z/OS CICS Resource Definition Guide, SC34-5990.
An EMP is defined with an ID that consists of a NAME and a POINT value. The NAME qualifies the POINT value. EMPs are invoked by the execution of the following command:
EXEC CICS MONITOR ENTRYNAME(name) POINT(number)
CLER PJA6 SCSCPJA6 Language Environment Region Level Runtime Options Type in your Choices. Runtime option Choice Possible choices. TRAP ==> ON ON, OFF RPTOPTS ==> OFF ON, OFF RPTSTG ==> OFF ON, OFF ALL31 ==> ON ON, OFF CBLPSHPOP ==> ON ON, OFF TERMTHDACT ==> TRACE QUIET,MSG,TRACE,DUMP,UAONLY,UATRACE,UADUMP,UAIMM When finished, press ENTER.
PF1=Help 3=Quit 5=Current Settings 9=Error List
Chapter 15. CALL and LINK performance 321
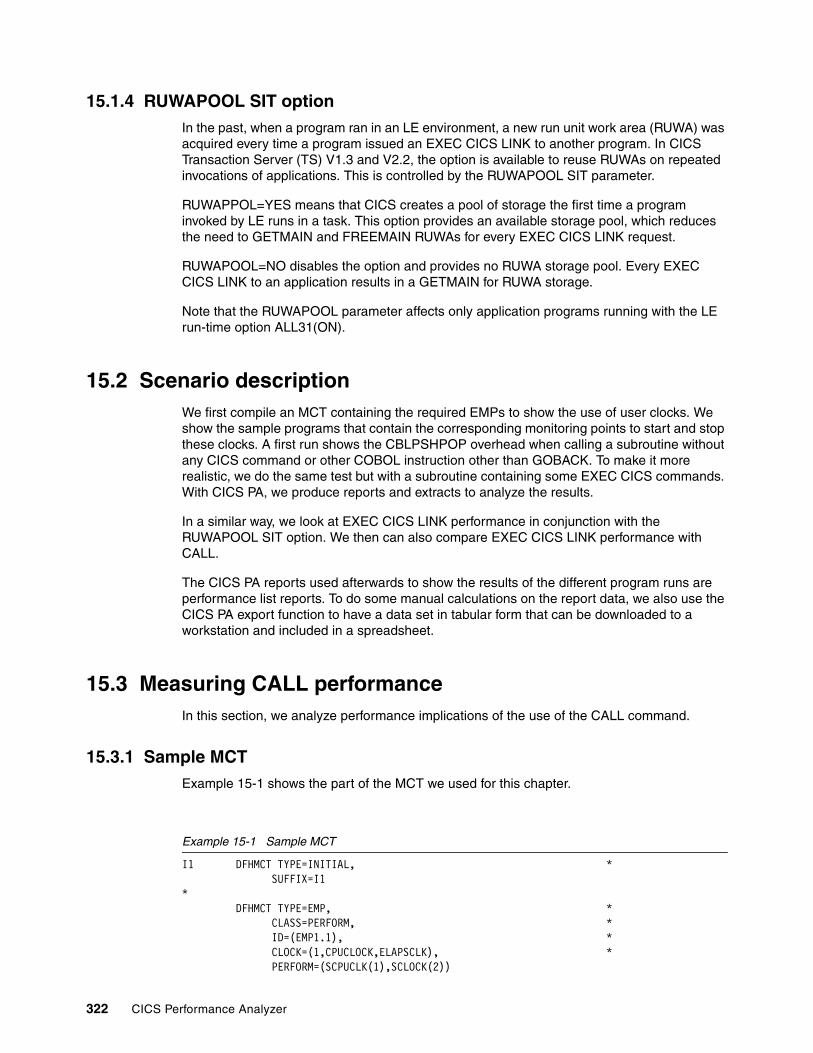
15.1.4 RUWAPOOL SIT optionIn the past, when a program ran in an LE environment, a new run unit work area (RUWA) was acquired every time a program issued an EXEC CICS LINK to another program. In CICS Transaction Server (TS) V1.3 and V2.2, the option is available to reuse RUWAs on repeated invocations of applications. This is controlled by the RUWAPOOL SIT parameter.
RUWAPPOL=YES means that CICS creates a pool of storage the first time a program invoked by LE runs in a task. This option provides an available storage pool, which reduces the need to GETMAIN and FREEMAIN RUWAs for every EXEC CICS LINK request.
RUWAPOOL=NO disables the option and provides no RUWA storage pool. Every EXEC CICS LINK to an application results in a GETMAIN for RUWA storage.
Note that the RUWAPOOL parameter affects only application programs running with the LE run-time option ALL31(ON).
15.2 Scenario descriptionWe first compile an MCT containing the required EMPs to show the use of user clocks. We show the sample programs that contain the corresponding monitoring points to start and stop these clocks. A first run shows the CBLPSHPOP overhead when calling a subroutine without any CICS command or other COBOL instruction other than GOBACK. To make it more realistic, we do the same test but with a subroutine containing some EXEC CICS commands. With CICS PA, we produce reports and extracts to analyze the results.
In a similar way, we look at EXEC CICS LINK performance in conjunction with the RUWAPOOL SIT option. We then can also compare EXEC CICS LINK performance with CALL.
The CICS PA reports used afterwards to show the results of the different program runs are performance list reports. To do some manual calculations on the report data, we also use the CICS PA export function to have a data set in tabular form that can be downloaded to a workstation and included in a spreadsheet.
15.3 Measuring CALL performanceIn this section, we analyze performance implications of the use of the CALL command.
15.3.1 Sample MCTExample 15-1 shows the part of the MCT we used for this chapter.
Example 15-1 Sample MCT
I1 DFHMCT TYPE=INITIAL, * SUFFIX=I1 * DFHMCT TYPE=EMP, * CLASS=PERFORM, * ID=(EMP1.1), * CLOCK=(1,CPUCLOCK,ELAPSCLK), * PERFORM=(SCPUCLK(1),SCLOCK(2))
322 CICS Performance Analyzer

* DFHMCT TYPE=EMP, * CLASS=PERFORM, * ID=(EMP1.2), * CLOCK=(1,CPUCLOCK,ELAPSCLK), * PERFORM=(PCPUCLK(1),PCLOCK(2)) * . .* DFHMCT TYPE=FINAL END
In this example, we use the EMPs defined with ID name EMP1. EMP1.1 defines two clocks, one measuring CPU time and one measuring elapsed time. The names assigned to the clocks are CPUCLOCK and ELAPSCLK. The number 1 in the CLOCK operand is the number assigned to the first defined clock. Number+1 is assigned to subsequent clock names. The PERFORM operand defines the action to be taken to update the user defined fields. Here we use SCPUCLK(1) to start clock 1, the number that was assigned to our clock with CPUCLOCK. Similarly, we use SCLOCK(2) to start the secondly defined clock with name ELAPSCLK.
The CLOCK operand of EMP1.2 references the same clock names. The PERFORM operand, by specifying PCPUCLK and PCLOCK, asks CICS to stop the clocks when an EXEC CICS MONITOR with POINT ID of 2 is executed.
15.3.2 First run: Program descriptionWe developed two small sample COBOL programs. Example 15-2 shows the calling program.
Example 15-2 COBCALL1: Sample COBOL calling program
WORKING-STORAGE SECTION. 01 EMP1P PIC X(8) VALUE 'EMP1'. 01 LOOP-NUM PIC 99999. PROCEDURE DIVISION. BEGIN. EXEC CICS MONITOR POINT(1) ENTRYNAME(EMP1P) END-EXEC. MOVE 0 TO LOOP-NUM. PERFORM CALL-LOOP UNTIL LOOP-NUM = 100. PERFORM DONE. CALL-LOOP. CALL 'COBCALL2'. ADD 1 TO LOOP-NUM. DONE. EXEC CICS MONITOR POINT(2) ENTRYNAME(EMP1P) END-EXEC. GOBACK.
To avoid the overhead of execution of too many EXEC CICS MONITOR commands, we chose to start and stop the clocks only once and to place them outside of the calling loop.
For the called program, in first instance we chose to have an “empty” program, just performing a GOBACK. Example 15-3 shows this program.
Chapter 15. CALL and LINK performance 323

Example 15-3 COBCALL2: ‘Empty’ COBOL called program
PROCEDURE DIVISION. BEGIN. GOBACK.
To avoid program loading, we chose to execute a static program call. The main and only program that is known to CICS is COBCALL1. The called subprogram is COBCALL2, and it is linked into the load module COBCALL1. By changing the LOOP-NUM counter in the program, we changed the number of times we call the subprogram. We decided to have three different runs and call the subprogram 100, 5000 and 10000 times. Finally, we define transaction KALL to run the program COBCALL1. As we are using program autoinstall, we did not have to provide PROGRAM definitions.
15.3.3 Executed scenarioThe system we were running on is a test system where CICS systems are running with tracing on. In the case of running with CBLPSHPOP OFF, there are no EXEC CICS commands during a COBOL CALL command. With CBLPSHPOP ON, we have these CICS commands and running with a trace on. There is additional overhead compared to the run without these commands. That is why we decided to switch all tracing off for these exercises.
We followed these steps:
1. Run CETR to switch off all tracing.2. Compile and link the called program COBCALL2.3. Compile and ling the calling program COBCALL1.4. Execute the CEMT transaction to NEWCOPY program COBCALL1.5. Execute the CLER transaction to set CBLPSHPOP to ON.6. Execute the KALL transaction six times.7. Execute the CLER transaction to set CBLPSHPOP to OFF.8. Execute the KALL transaction five times.
After this, we recompiled the program to change the number of times to call the subroutine and repeated this scenario.
The first time we execute KALL six times because we expect a program load after the newcopy or because it is the first execution after CICS start.
15.3.4 Performance List report generationAfter switching the SMF data sets, we used CICS Performance Analyzer in the following way to select the KALL records. The data set containing the SMF records after the switch is SMFDATA.ALLRECS.G8734V00.
In CICS Performance Analyzer, on the Primary Option Menu, we select 1 to go to the System Definitions screen (Figure 15-2).
Attention: You must use extreme care when using EMP clocks. As opposed to CICS clocks, a user clock continues to run when control is passed to the CICS dispatcher. This means that, if you start a CPU clock and do not stop this clock before you run a CICS command that goes through the CICS dispatcher so that a higher priority task can take control, the CPU time executed for that task is accumulated in your CPU clock.
324 CICS Performance Analyzer

Figure 15-2 System Definitions screen
On this screen, we entered NEW to create a new System Definition. On the pop-up screen, we entered the new System Name which is the APPLID of the CICS on which we run our tests. In this case, this is SCSCPJA6. For System Type, we chose option 1 to select a CICS System.
We also specified a Dictionary data set name. Because we switch SMF data sets all the time, it can be that the current SMF data set does not contain a dictionary record. In our case, with EMPs defined in the MCT, we could not use the default dictionary record and so we had to define and populate the dictionary data set. The data set itself is created automatically when you specify its name on this screen. To populate it, we placed the cursor under Dictionary in the action bar and pressed Enter. Then we selected 1 as the only possible option to populate a Dictionary data set with the Dictionary record.
We filled in the SMF data set name directly on this screen. We could have added its name to the list of SMF data sets and then selected it from that list. Figure 15-3 shows the final screen after all information is filled in.
Figure 15-3 System Definitions final screen
We pressed F3 three times to return to the Primary Option Menu. On this screen, we selected option 3 to create a new Report Form. Figure 15-4 shows the screen where we chose to create the new CALL Report Form.
File Edit Filter View Options Help ------------------------------------------------------------------------------ System Definitions Row 1 from 4 Command ===> new Scroll ===> CSR Select a System to edit its definition, SMF Files and Groups. SMF Files / System Type Image Description System
SCSCPJA6 CICS used for creating allfields SCSCPJA6 SCSCLSA5 CICS JTS1 testing SCSCLSA5
SCSCLSA5 CICS JVM testing SCSCLSA5 SCSCPJA6 CICS used for export function SCSCPJA6
---------------------------- System Definitions ----------------------------- File Edit Dictionary View Options Help -------------------------------------------------------------------------- CICS System Row 1 of 1 More: > Command ===> Scroll ===> CSR CICS System definition: APPLID . . . . . . . . SCSCPJA6 MVS Image . . Description . . . . . Performance testing CICS Version (VRM) . . 620 MCT Suffix . . . . . . I1 MCT Load Library . . . 'CICSSYSF.APPL62.LOADLIB' SDFHLOAD Library . . . 'CICSTS22.CICS.SDFHLOAD' Dictionary DSN . . . . 'CICSLS2.PJA6.DICTREC' / Exc SMF Data Set Name + UNIT + SEQ VOLSER + 'SMFDATA.ALLRECS.G8734V00' ********************************* End of list *****************************
Chapter 15. CALL and LINK performance 325
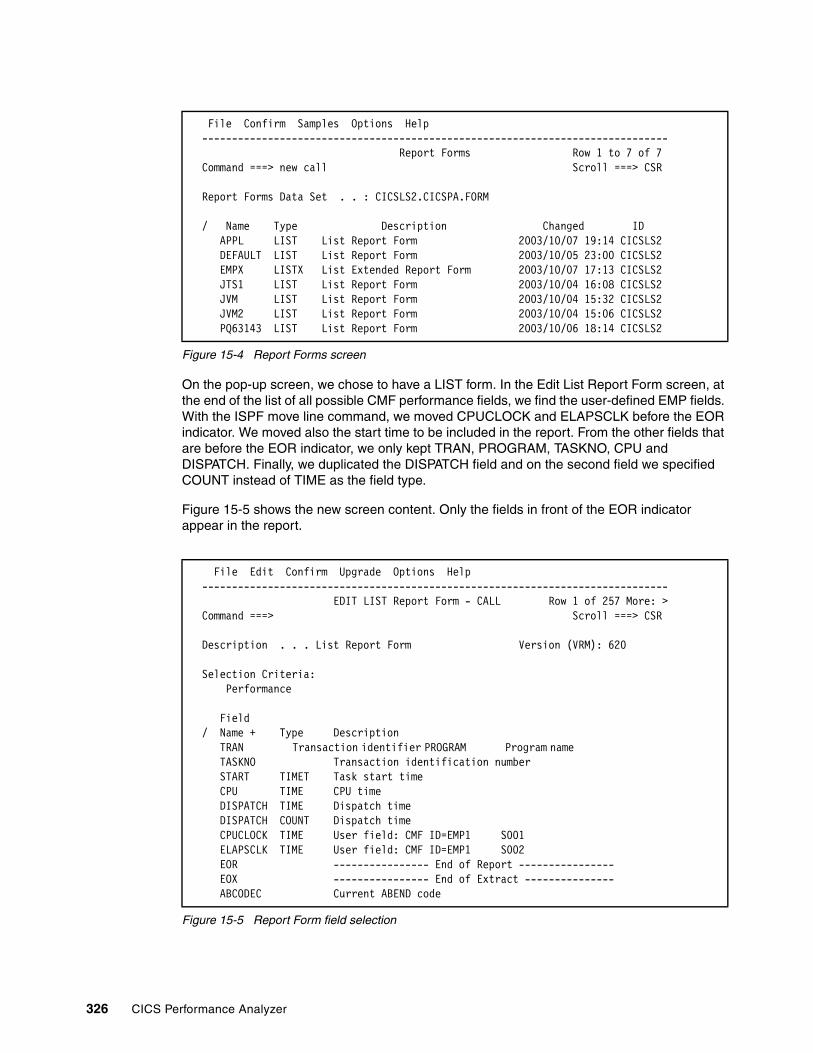
Figure 15-4 Report Forms screen
On the pop-up screen, we chose to have a LIST form. In the Edit List Report Form screen, at the end of the list of all possible CMF performance fields, we find the user-defined EMP fields. With the ISPF move line command, we moved CPUCLOCK and ELAPSCLK before the EOR indicator. We moved also the start time to be included in the report. From the other fields that are before the EOR indicator, we only kept TRAN, PROGRAM, TASKNO, CPU and DISPATCH. Finally, we duplicated the DISPATCH field and on the second field we specified COUNT instead of TIME as the field type.
Figure 15-5 shows the new screen content. Only the fields in front of the EOR indicator appear in the report.
Figure 15-5 Report Form field selection
File Confirm Samples Options Help ------------------------------------------------------------------------------ Report Forms Row 1 to 7 of 7 Command ===> new call Scroll ===> CSR Report Forms Data Set . . : CICSLS2.CICSPA.FORM / Name Type Description Changed ID
APPL LIST List Report Form 2003/10/07 19:14 CICSLS2 DEFAULT LIST List Report Form 2003/10/05 23:00 CICSLS2 EMPX LISTX List Extended Report Form 2003/10/07 17:13 CICSLS2 JTS1 LIST List Report Form 2003/10/04 16:08 CICSLS2 JVM LIST List Report Form 2003/10/04 15:32 CICSLS2 JVM2 LIST List Report Form 2003/10/04 15:06 CICSLS2 PQ63143 LIST List Report Form 2003/10/06 18:14 CICSLS2
File Edit Confirm Upgrade Options Help ------------------------------------------------------------------------------ EDIT LIST Report Form - CALL Row 1 of 257 More: > Command ===> Scroll ===> CSR Description . . . List Report Form Version (VRM): 620 Selection Criteria: Performance Field / Name + Type Description
TRAN Transaction identifier PROGRAM Program name TASKNO Transaction identification number START TIMET Task start time CPU TIME CPU time DISPATCH TIME Dispatch time DISPATCH COUNT Dispatch time CPUCLOCK TIME User field: CMF ID=EMP1 S001 ELAPSCLK TIME User field: CMF ID=EMP1 S002 EOR ---------------- End of Report ---------------- EOX ---------------- End of Extract --------------- ABCODEC Current ABEND code
326 CICS Performance Analyzer

We pressed F3 to save this form. Back on the Primary Option Menu, we chose option 2 to go to the Report Sets screen. On the command line, we entered NEW CALL to create a new Report Set with name CALL. Figure 15-6 shows the resulting screen.
Figure 15-6 Report Set selection screen
In the Performance Reports category, we selected List. On the next screen, we entered the APPLID, the form name, and selected the selection criteria Performance as shown in Figure 15-7.
Figure 15-7 Performance List Report selection criteria
File Systems Confirm Options Help ------------------------------------------------------------------------------ EDIT Report Set - CALL Row 1 of 34 Command ===> Scroll ===> CSR Description . . . CICS PA Report Set Enter "/" to select action. ** Reports ** Active - Options No Global No - Selection Criteria No Performance No Exception No - Performance Reports No List No List Extended No Summary No Totals No Wait Analysis No Cross-System Work No Transaction Group No BTS No Workload Activity No - Exception Reports No
File Systems Options Help ------------------------------------------------------------------------------ CALL - Performance List Report Command ===> System Selection: Report Output: APPLID . . SCSCPJA6 + DDname . . . . . . . . . LIST0001 Image . . + Print Lines per Page . . (1-255) Group . . + Report Format: Form . . . CALL + Title . . Performance testing Selection Criteria: s Performance
Chapter 15. CALL and LINK performance 327

In the resulting screen, we chose to print only the KALL transaction. This was done by entering an I in the Inc/Exc column to indicate that this is an include option. In the Field Name column, we entered TRAN to indicate that the include selection is based on the transaction name and as the first Value, we entered the transaction code KALL. Figure 15-8 shows the resulting screen.
Figure 15-8 Performance Select Statement screen
We then returned to the Report Set screen as shown in Figure 15-6. Now the Global and List options are flagged as active with a Yes in the Active column. On the command line, we entered the RUN command to run the report. This generates the batch job JCL to print the report. On the Run Report Set screen, we typed a slash (‘/’) in front of Edit JCL before submit to edit the JCL before submitting it. Example 15-4 shows the JCL.
Example 15-4 Generated JCL for batch report
// JOB /*JOBPARM SYSAFF=SC66 //* CICS PA V1R3 Report JCL //CICSPA EXEC PGM=CPAMAIN //STEPLIB DD DSN=CPA.SCPALINK,DISP=SHR //SYSPRINT DD SYSOUT=* //* SMF Input Files //SMFIN001 DD DSN=SMFDATA.ALLRECS.G8734V00,// DISP=SHR //* Command Input //SYSIN DD * * Report Set =CALL * Description=CICS PA Report Set * Reports for System=SCSCPJA6 * Description=Performance testing CICSPA IN(SMFIN001), APPLID(SCSCPJA6), LINECNT(60), FORMAT(':','/'), LIST(OUTPUT(LIST0001), SELECT(PERFORMANCE( INC(TRAN(KALL)))), FIELDS(TRAN, PROGRAM, TASKNO,
File Edit Object Lists Options Help ------------------------------------------------------------------------------ CALL - Performance Select Statement Row 1 of 9 More: > Command ===> Scroll ===> CSR Active --------------- Report Interval ---------------- Inc Start -------- From --------- --------- To ---------- Exc Stop MM/DD/YYYY HH:MM:SS.TH MM/DD/YYYY HH:MM:SS.TH ------------------------------------------------------------------------------ Inc Field --- Value or Range --- Object / Exc Name + Type Value/From To List + INC TRAN KALL
328 CICS Performance Analyzer

START(TIMET), CPU(TIME), DISPATCH(TIME), DISPATCH(COUNT), CLOCKTIME(OWNER(EMP1),NUMBER(001)), CLOCKTIME(OWNER(EMP1),NUMBER(002))), TITLE1( 'Performance testing '))/* //* Dictionary Records //CPADICTR DD DISP=SHR,DSN=CICSLS2.PJA6.DICTREC
We submitted the job and received the output listing shown in Figure 15-9.
Figure 15-9 CICS PA List report: First run
We see that transactions with numbers 485, 499, and 514 have a dispatch count of 3 because they were the first transactions executed after a NEWCOPY of the program. All other runs were dispatched only once so that we are sure that CPU and elapsed wait time only apply to these particular runs.
Transactions 486 to 496 represent the program runs where the subprogram was called 100 times, 500 to 511 are for the runs where the subprogram was called 5000 times, and 515 to 525 are for the runs of 10000 calls.
V1R3M0 CICS Performance Analyzer Performance List __________________________________________________ LIST0001 Printed at 20:07:12 10/28/2003 Data from 19:20:20 10/28/2003 APPLID SCSCPJA6 Page 1 Performance testing Tran Program TaskNo Start User CPU Dispatch Dispatch CPUCLOCK ELAPSCLK Time Time Time Count Time Time KALL COBCALL1 485 19:23:39.437 .0024 .0151 3 .0003 .0003 KALL COBCALL1 486 19:23:40.397 .0006 .0008 1 .0003 .0003 KALL COBCALL1 487 19:23:41.357 .0006 .0009 1 .0003 .0004 KALL COBCALL1 488 19:23:42.319 .0006 .0009 1 .0003 .0004 KALL COBCALL1 489 19:23:43.394 .0006 .0012 1 .0003 .0003 KALL COBCALL1 490 19:23:44.506 .0006 .0008 1 .0003 .0003 KALL COBCALL1 492 19:24:10.170 .0003 .0005 1 .0000 .0000 KALL COBCALL1 493 19:24:11.061 .0003 .0043 1 .0000 .0000 KALL COBCALL1 494 19:24:11.899 .0003 .0005 1 .0000 .0000 KALL COBCALL1 495 19:24:12.821 .0003 .0005 1 .0000 .0000 KALL COBCALL1 496 19:24:13.704 .0003 .0005 1 .0000 .0000 KALL COBCALL1 499 19:25:41.526 .0156 .0215 3 .0148 .0166 KALL COBCALL1 500 19:25:42.371 .0152 .0173 1 .0149 .0168 KALL COBCALL1 501 19:25:43.218 .0151 .0166 1 .0148 .0162 KALL COBCALL1 502 19:25:44.097 .0152 .0175 1 .0149 .0169 KALL COBCALL1 503 19:25:44.987 .0152 .0167 1 .0148 .0160 KALL COBCALL1 504 19:25:45.907 .0153 .0197 1 .0149 .0191 KALL COBCALL1 506 19:25:56.895 .0016 .0018 1 .0014 .0014 KALL COBCALL1 508 19:25:57.705 .0017 .0020 1 .0014 .0015 KALL COBCALL1 509 19:25:58.549 .0017 .0020 1 .0014 .0015 KALL COBCALL1 510 19:25:59.356 .0017 .0022 1 .0014 .0017 KALL COBCALL1 511 19:26:00.099 .0017 .0019 1 .0014 .0015 KALL COBCALL1 514 19:27:01.425 .0308 .0419 3 .0300 .0339 KALL COBCALL1 515 19:27:02.270 .0299 .0321 1 .0296 .0316 KALL COBCALL1 516 19:27:03.115 .0303 .0369 1 .0300 .0362 KALL COBCALL1 517 19:27:03.961 .0300 .0327 1 .0297 .0322 KALL COBCALL1 518 19:27:04.809 .0301 .0338 1 .0298 .0334 KALL COBCALL1 519 19:27:05.653 .0300 .0338 1 .0297 .0332 KALL COBCALL1 521 19:27:18.100 .0031 .0035 1 .0028 .0030
KALL COBCALL1 522 19:27:19.054 .0031 .0064 1 .0028 .0059 KALL COBCALL1 523 19:27:19.904 .0031 .0037 1 .0028 .0032 KALL COBCALL1 524 19:27:20.749 .0031 .0035 1 .0028 .0030 KALL COBCALL1 525 19:27:21.558 .0031 .0036 1 .0028 .0030******************************** BOTTOM OF DATA ***********************************************************************************
Chapter 15. CALL and LINK performance 329

As expected, the CICS measured transaction CPU time is slightly higher than the EMP CPU clock time. In case of larger applications where smaller isolated parts are measured, this difference may be higher. The same applies for the CICS measured dispatch time and the EMP measured elapsed time, except for the runs where the dispatch count is 3. Here we see a higher dispatch time because it includes the time being dispatched to load the program before the start of the program execution.
For the runs when we call the subprogram 100 times, we see CPU and elapsed times as being zero. The execution time was too short to have it in the fourth digit after the comma.
15.3.5 Data exportWith the intention of performing some calculations on the CPU measurement results, we planned to export only the two CPU clock fields to a data set. To have only two columns with those two fields, we created a new Report Form called CALL2. On the Report Forms screen, we entered NEW CALL2 and received the New Report Form pop-up screen. Here we chose to create CALL2 as a model from CALL as shown in Figure 15-10.
Figure 15-10 New Report Form screen
In the CALL2 form, we moved the fields CPU and CPUCLOCK to the top of the list and moved the EOX indicator behind them as shown in Figure 15-11.
---------------------------- Report Forms ----------------------------- File Systems Options Help -------------------------------------------------------------------- New Report Form Command ===> Specify the name of the new Report Form and its options. Name . . . . . . CALL2 APPLID . . . . . SCSCPJA6 + Version (VRM) . . 620 MVS Image . . . . Field Categories Form Type or Model . . 4 1. List 2. List Extended (Sorted) 3. Summary 4. Model (specified below) Model CALL
330 CICS Performance Analyzer

Figure 15-11 CALL2 Report Form screen
In the CALL Report Set, this time we deactivated the list report option by entering a D in front of List and then selected the Export option in the Extracts category. On the screen shown in Figure 15-12, we entered the APPLID, SCSCPJA6; the Data Set Name to contain the extract, CICSLS2.CALL.EXPORT; specified 1 for the data set disposition; entered CALL2 for the Extract Format Form; and finally, entered S to select the Performance selection criteria.
Figure 15-12 CALL - Export screen
File Edit Confirm Upgrade Options Help ------------------------------------------------------------------------------ EDIT LIST Report Form - CALL2 Row 1 of 257 More: > Command ===> Scroll ===> CSR Description . . . List Report Form Version (VRM): 620 Selection Criteria: Performance Field / Name + Type Description CPU TIME CPU time CPUCLOCK TIME User field: CMF ID=EMP1 S001 EOX ---------------- End of Extract --------------- TRAN Transaction identifier PROGRAM Program name TASKNO Transaction identification number START TIMET Task start time DISPATCH TIME Dispatch time DISPATCH COUNT Dispatch time ELAPSCLK TIME User field: CMF ID=EMP1 S002 EOR ---------------- End of Report ---------------- ABCODEC Current ABEND code
File Systems Options Help ------------------------------------------------------------------------------ CALL - Export Command ===> System Selection: Extract Recap: APPLID . . SCSCPJA6 + DDname . . . EXPT0001 Image . . + Group . . + Output Data Set: Data Set Name . . 'CICSLS2.CALL.EXPORT' Disposition . . . 1 1. OLD 2. MOD (If cataloged) Extract Format: Enter "/" to select option Form . . . . CALL2 + / Include Field Labels Delimiter . . ; Numeric Fields in Float format Selection Criteria: Summary Processing Options: s Performance Time Interval 00:01:00 (hh:mm:ss)
Chapter 15. CALL and LINK performance 331

On the Performance Select Statement screen (Figure 15-13), we entered two selection criteria. One is in the TRAN field to only list the KALL transactions. The other one is in the DISPATCH COUNT field to only list the transactions having a dispatch count of 1. This eliminates the transaction runs where we had a program load.
Figure 15-13 Export selection criteria
Back on the first Report Set screen, we re-ran the report and submitted the newly generated JCL. The data set was created. The two columns that we found in the data set were used in a Lotus 1-2-3 spreadsheet. Some calculations were performed shown in Table 15-1.
This spreadsheet shows the Average total CPU and Average CPUCLOCK times calculated per group of execution runs. The Program Execution Ratio column shows the total CPU time for a run with CBLPSHPOP divided by the corresponding total CPU time for a run without CBLPSHPOP. The SUM CALL+PUSH+POP column is the difference between the values of Average CPUCLOCK measured in two runs: with CBLPSHPOP ON and CBLPSHPOP OFF. It gives the CPU time consumed by LE to call the subroutine including the EXEC CICS PUSH HANDLE and the EXEC CICS POP HANDLE command. The last column shows this value divided by the number of calls done to the subroutine and thus is the cost of one call of the subroutine.
Because of the few number of transaction runs, the cost of one call to a subroutine seems to be comparable. This cannot be said of the execution ratio. For the 100-run, we presume that the CPUCLOCK time is so small, even zero in this report, that little deviations can result in significant differences in the calculated ratio. For the other two runs, the ratio is high because of the empty subroutine so that the PUSH and POP commands can be considered to be pure overhead.
File Edit Object Lists Options Help ------------------------------------------------------------------------------ CALL - Performance Select Statement Row 1 of 2 More: > Command ===> Scroll ===> CSR Active --------------- Report Interval ---------------- Inc Start -------- From --------- --------- To ---------- Exc Stop MM/DD/YYYY HH:MM:SS.TH MM/DD/YYYY HH:MM:SS.TH ------------------------------------------------------------------------------ Inc Field --- Value or Range --- Object / Exc Name + Type Value/From To List + INC TRAN KALL INC DISPATCH COUNT 1 ********************************* End of list *********************************
332 CICS Performance Analyzer

Table 15-1 Lotus 1-2-3 spreadsheet created from CICS PA export: First run
15.3.6 Second runTo obtain a more realistic result, we decided to add some other EXEC CICS commands to the subroutine. We added five EXEC CICS commands that are normally not causing a pass through the CICS dispatcher. Example 15-5 shows the subroutine that we created.
Example 15-5 Subroutine with EXEC CICS commands
WORKING-STORAGE SECTION. 01 EIBADDR POINTER. 01 USERNAME PIC X(08) VALUE SPACES. 01 CICS-TIME PIC X(08) VALUE SPACES. 01 PGMTIME. 03 CURRENT-DATE PIC X(10). 03 FILLER PIC X(01) VALUE SPACES. 03 CURRENT-TIME PIC X(08). 01 AREAPTR POINTER. PROCEDURE DIVISION. BEGIN. EXEC CICS ADDRESS EIB(EIBADDR) END-EXEC. EXEC CICS ASSIGN USERID(USERNAME) END-EXEC. EXEC CICS ASKTIME
Calls/CBLPSHPOP
Total CPU
CPUCLOCK AVG Total CPU
Program execution ratio
Avg CPUCLOCK
SUM CALL+PUSH+POP
1 CALL+PUSH+POP
100/ON 0.0006 0.00030.0006 0.00030.0006 0.00030.0006 0.00030.0006 0.0003 0.0006 0.0003
100/OFF 0.0003 00.0003 00.0003 00.0003 00.0003 0 0.0003 2 0 0.0003 0.000003
5000/ON 0.0152 0.01490.0151 0.01480.0152 0.01490.0152 0.01480.0153 0.0149 0.0152 0.01486
5000/OFF 0.0016 0.00140.0017 0.00140.0017 0.00140.0017 0.00140.0017 0.0014 0.00168 9.04761905 0.0014 0.01346 0.000002692
10000/ON 0.0299 0.02960.0303 0.03
0.03 0.02970.0301 0.0298
0.03 0.0297 0.03006 0.02976
10000/OFF 0.0031 0.00280.0031 0.00280.0031 0.00280.0031 0.00280.0031 0.0028 0.0031 9.69677419 0.0028 0.02696 0.000002696
Chapter 15. CALL and LINK performance 333

ABSTIME(CICS-TIME) END-EXEC.
EXEC CICS FORMATTIME ABSTIME(CICS-TIME)
DDMMYYYY(CURRENT-DATE)DATESEP
TIME(CURRENT-TIME) TIMESEP END-EXEC. EXEC CICS GETMAIN SET(AREAPTR) FLENGTH(500) INITIMG(' ') END-EXEC. GOBACK.
We did the same exercise again. After the KALL transactions ran, we switched the SMF data sets. We updated the system definition to contain the new SMF data set name. For the rest, we could reuse the CICS PA definitions to print the new results as shown in Figure 15-14.
Figure 15-14 CICS PA List report: Second run
The results were again copied to an identical spreadsheet as the one we used for the first report. It is shown in Table 15-2.
V1R3M0 CICS Performance Analyzer Performance List __________________________________________________ LIST0001 Printed at 23:42:29 10/28/2003 Data from 23:34:34 10/28/2003 APPLID SCSCPJA6 Page 1 Performance testing Tran Program TaskNo Start User CPU Dispatch Dispatch CPUCLOCK ELAPSCLK Time Time Time Count Time Time KALL COBCALL1 67 23:34:34.344 .0040 .0134 3 .0018 .0020 KALL COBCALL1 68 23:34:35.228 .0021 .0025 1 .0018 .0020 KALL COBCALL1 69 23:34:35.996 .0021 .0026 1 .0018 .0021 KALL COBCALL1 70 23:34:36.780 .0021 .0027 1 .0018 .0021 KALL COBCALL1 71 23:34:37.498 .0021 .0026 1 .0018 .0020 KALL COBCALL1 72 23:34:38.227 .0021 .0026 1 .0018 .0020 KALL COBCALL1 76 23:34:51.485 .0018 .0024 1 .0015 .0017 KALL COBCALL1 77 23:34:52.216 .0018 .0021 1 .0015 .0016 KALL COBCALL1 78 23:34:52.907 .0018 .0026 1 .0015 .0020 KALL COBCALL1 79 23:34:53.601 .0019 .0024 1 .0015 .0018 KALL COBCALL1 80 23:34:54.291 .0018 .0023 1 .0015 .0017 KALL COBCALL1 92 23:36:08.551 .0903 .1158 3 .0874 .1022 KALL COBCALL1 93 23:36:09.434 .0882 .0981 1 .0861 .0952 KALL COBCALL1 94 23:36:10.242 .0879 .0992 1 .0859 .0968 KALL COBCALL1 95 23:36:11.258 .0895 .1675 1 .0871 .1643 KALL COBCALL1 96 23:36:12.099 .0876 .0976 1 .0857 .0952 KALL COBCALL1 97 23:36:12.817 .0885 .1023 1 .0864 .0996 KALL COBCALL1 99 23:36:22.175 .0743 .0829 1 .0720 .0801 KALL COBCALL1 100 23:36:22.943 .0743 .1675 1 .0718 .1643 KALL COBCALL1 101 23:36:23.788 .0745 .0856 1 .0722 .0820 KALL COBCALL1 102 23:36:24.557 .0737 .0833 1 .0717 .0806 KALL COBCALL1 103 23:36:25.286 .0742 .0836 1 .0719 .0809 KALL COBCALL1 107 23:37:48.098 .1770 .2057 3 .1723 .1954 KALL COBCALL1 108 23:37:49.102 .1761 .2022 1 .1722 .1974 KALL COBCALL1 109 23:37:49.964 .1782 .2847 1 .1740 .2794 KALL COBCALL1 110 23:37:50.848 .1767 .2833 1 .1722 .2779 KALL COBCALL1 111 23:37:51.695 .1761 .1964 1 .1719 .1914 KALL COBCALL1 112 23:37:52.541 .1761 .1974 1 .1719 .1921 KALL COBCALL1 114 23:38:05.094 .1477 .1666 1 .1433 .1616 KALL COBCALL1 115 23:38:05.901 .1481 .2488 1 .1438 .2436 KALL COBCALL1 116 23:38:06.706 .1478 .1695 1 .1434 .1644 KALL COBCALL1 117 23:38:07.476 .1477 .1756 1 .1437 .1707 KALL COBCALL1 118 23:38:08.281 .1488 .1736 1 .1443 .1682 ******************************** BOTTOM OF DATA ***********************************************************************************
334 CICS Performance Analyzer

Table 15-2 Lotus 1-2-3 spreadsheet created from CICS PA export: Second run
The calculated value for the time of executing one call is in the same order as the first calculation, only slightly higher. The program execution ratio is now more consistent.
The conclusion from our tests is that it is not obvious how much savings you can obtain by setting the CBLPSHPOP parameter to OFF. The overhead of the two additional CICS commands has to be compared with the rest of the application. However, this example shows that when running modular applications that do a lot of calls to relatively small subroutines, the CPU consumption gain can be considerable by switching off CBLPSHPOP, if the application allows you to do so.
15.4 Measuring the EXEC CICS LINK command performanceIn this section, we analyze the performance of the EXEC CICS LINK command.
15.4.1 Program descriptionFor the EXEC CICS LINK performance exercise, we used the same programs as for the CALL. However, this time we replaced the CALL by an EXEC CICS LINK and the GOBACK by an EXEC CICS RETURN. Example 15-6 shows the source of the calling program.
Calls/CBLPSHPOP
Total CPU
CPUCLOCK AVG Total CPU
Program execution ratio
Avg CPUCLOCK
SUM CALL+PUSH+POP
1 CALL+PUSH+POP
100/ON 0.0021 0.00180.0021 0.00180.0021 0.00180.0021 0.00180.0021 0.0018 0.0021 0.0018
100/OFF 0.0018 0.00150.0018 0.00150.0018 0.00150.0019 0.00150.0018 0.0015 0.00182 1.15384615 0.0015 0.0003 0.000003
5000/ON 0.0882 0.08610.0879 0.08590.0895 0.08710.0876 0.08570.0885 0.0864 0.08834 0.08624
5000/OFF 0.0743 0.0720.0743 0.07180.0745 0.07220.0737 0.07170.0742 0.0719 0.0742 1.19056604 0.07192 0.01432 0.000002864
10000/ON 0.1761 0.17220.1782 0.1740.1767 0.17220.1761 0.17190.1761 0.1719 0.17664 0.17244
10000/OFF 0.1477 0.14330.1481 0.14380.1478 0.14340.1477 0.14370.1488 0.1443 0.14802 1.19335225 0.1437 0.02874 0.000002874
Chapter 15. CALL and LINK performance 335

Example 15-6 COBLINK1 - calling program
WORKING-STORAGE SECTION. 01 EMP1P PIC X(8) VALUE 'EMP1'. 01 LOOP-NUM PIC 99999. PROCEDURE DIVISION. BEGIN.
EXEC CICS MONITOR POINT(1) ENTRYNAME(EMP1P) END-EXEC. MOVE 0 TO LOOP-NUM. PERFORM CALL-LOOP UNTIL LOOP-NUM = 10000. PERFORM DONE.
CALL-LOOP. EXEC CICS LINK PROGRAM('COBLINK2') END-EXEC. ADD 1 TO LOOP-NUM.
DONE. EXEC CICS MONITOR POINT(2) ENTRYNAME(EMP1P) END-EXEC. EXEC CICS RETURN END-EXEC.
Example 15-7 shows the source of the called program.
Example 15-7 COBLINK2: Called program
PROCEDURE DIVISION. BEGIN. EXEC CICS RETURN END-EXEC.
Unlike in the previous example, here we had no choice between static or dynamic options. We had two different load modules and thus the risk exists that we go through the CICS dispatcher during the execution of the EXEC CICS LINK command. However, we expected that during different transaction runs that use the same program load modules, these load modules would remain loaded in CICS storage. Again, we can checked in the SMF information whether we were dispatched multiple times. To run these application programs, we defined the transaction LINK. Again, no program definitions were required because we used the autoinstall program.
15.4.2 Executed scenarioWe followed these steps:
1. Run transaction CETR to switch off all tracing.2. Compile and link the calling program COBLINK1 with a loop count of 100.3. Compile and link the called program COBLINK2.4. Stop and restart CICS to run with SIT parameter RUWAPOOL=NO.5. Execute the LINK transaction six times.6. Recompile the program COBLINK1 with a loop count of 5000.7. Execute the CEMT transaction to NEWCOPY program COBLINK1.8. Execute the LINK transaction six times.9. Recompile the program COBLINK1 with a loop count of 10000.10.Execute the CEMT transaction to NEWCOPY program COBLINK1.11.Execute the LINK transaction six times.12.Recompile the program COBLINK1 with a loop count of 100.
336 CICS Performance Analyzer

13.Stop and restart CICS to run with SIT parameter RUWAPOOL=YES.14.Execute the LINK transaction six times.15.Recompile the program COBLINK1 with a loop count of 5000.16.Execute the CEMT transaction to NEWCOPY program COBLINK1.17.Execute the LINK transaction six times.18.Recompile the program COBLINK1 with a loop count of 10000.19.Execute the LINK transaction six times.
15.4.3 LINK transaction characteristicsBefore concentrating on the CPU and elapsed timer values, we were interested in seeing the typical characteristics of this LINK transaction. In CICS PA, we could continue to use the existing system definition. We needed to change the SMF data set name.
For the typical characteristics, we decided to create a new Report Form. For that, we selected Report Forms on the Primary Options Menu. On the Report Forms screen, we entered the NEW LINK command to create the new form. A pop-up screen appeared on which we entered option 1 to request a list form. On the LIST Report Form screen, we moved program and storage related SMF field names before the EOR indicator to include these in the list report. Figure 15-15 shows the LINK form as we created it.
Figure 15-15 LINK Report Form
We saved this form. Then we returned to the Primary Option Menu, where we selected option 2 to create a new Report Set which we called LINK. The choices of the Performance List report and the Report Set selection criteria are identical to those in Figure 15-6 on page 327 through Figure 15-8 on page 328. The difference is that this time, we selected on transaction
File Edit Confirm Upgrade Options Help ------------------------------------------------------------------------------ EDIT LIST Report Form - LINK Row 1 of 257 More: > Command ===> Scroll ===> CSR Description . . . List Report Form Version (VRM): 620 Selection Criteria: Performance Field / Name + Type Description Field
TRAN Transaction identifier PROGRAM Program name TASKNO Transaction identification number DISPATCH TIME Dispatch time DISPATCH COUNT Dispatch time CPU TIME CPU time SUSPEND TIME Suspend time PCLINK Program LINK requests PCLOADTM TIME Program Library wait time PCLOADTM COUNT Program Library wait time PCLURM Program LINK URM requests CHMODECT Change-TCB modes requests
SC31UGET EUDSA GETMAINs above 16MB SC31SGET ECDSA/ESDSA GETMAINs above 16MB SC31CGET ECDSA GETMAINs above 16MB EOR ---------------- End of Report ----------------
Chapter 15. CALL and LINK performance 337

LINK instead of KALL. We ran the report and received the output listing shown in Figure 15-16.
Figure 15-16 LINK transaction characteristics
The first transaction in this list has a PCLOAD wait count of 3. This transaction was the first user transaction initiated from a screen after the CICS restart. CICS required first to load the program autoinstall URM before the loads of COBLINK1 and COBLINK2. Because of the three program loads, we also had a change mode count of six, since each load requires a switch from QR mode to RO mode for the loading of the program and then back to QR. This also explains the high dispatch count: one initial dispatch and one after each change mode.
We see a PCLINK count of 101 because the initial link to program COBLINK1 is included in this link count together with the 100 EXEC CICS LINK commands to program COBLINK2. The link to URMs is not included in the total program link count but is reported in a separate field, PCLNKURM. For this first transaction, we linked twice to the autoinstall URM, once for COBLINK1 and once for COBLINK2. The first transaction has a higher GETMAIN count in the user, shared storage above the 16Mb line than the following transactions, again because of first initialization, or both.
The transactions with task number 84 and 91 in the top half of the list are the first ones we executed after we relinked COBLINK1 and performed a CEMT NEWCOPY of only COBLINK1.
V1R3M0 CICS Performance Analyzer Performance List __________________________________________________ LIST0001 Printed at 21:48:35 10/28/2003 Data from 21:33:33 10/28/2003 APPLID SCSCPJA6 Page 1 Tran Program TaskNo Dispatch Dispatch User CPU Suspend PCLINK PCLOADWt PCLOADWt PCLNKURM ChngMode SC31UGet SC31SGet SC31CGet Time Count Time Time Time Count LINK COBLINK1 77 .0880 7 .0068 .0019 101 .0336 3 2 6 104 0 0 LINK COBLINK1 78 .0029 1 .0025 .0000 101 .0000 0 0 0 101 0 0 LINK COBLINK1 79 .0028 1 .0025 .0000 101 .0000 0 0 0 101 0 0 LINK COBLINK1 80 .0163 1 .0025 .0000 101 .0000 0 0 0 101 0 0 LINK COBLINK1 81 .0032 1 .0026 .0000 101 .0000 0 0 0 101 0 0 LINK COBLINK1 82 .0029 1 .0025 .0000 101 .0000 0 0 0 101 0 0 LINK COBLINK1 84 .1338 3 .1087 .0000 5001 .0111 1 0 2 5001 0 0 LINK COBLINK1 85 .2072 1 .1098 .0000 5001 .0000 0 0 0 5001 0 0 LINK COBLINK1 86 .1251 1 .1096 .0000 5001 .0000 0 0 0 5001 0 0 LINK COBLINK1 87 .1246 1 .1093 .0000 5001 .0000 0 0 0 5001 0 0 LINK COBLINK1 88 .1243 1 .1090 .0000 5001 .0000 0 0 0 5001 0 0 LINK COBLINK1 89 .1234 1 .1089 .0000 5001 .0000 0 0 0 5001 0 0 LINK COBLINK1 91 .2481 3 .2174 .0001 10001 .0046 1 0 2 10001 0 0 LINK COBLINK1 92 .2528 1 .2196 .0000 10001 .0000 0 0 0 10001 0 0 LINK COBLINK1 93 .2526 1 .2182 .0000 10001 .0000 0 0 0 10001 0 0 LINK COBLINK1 94 .2602 1 .2193 .0000 10001 .0000 0 0 0 10001 0 0 LINK COBLINK1 95 .2544 1 .2192 .0000 10001 .0000 0 0 0 10001 0 0 LINK COBLINK1 96 .2511 1 .2184 .0000 10001 .0000 0 0 0 10001 0 0 LINK COBLINK1 66 .0864 7 .0073 .0074 101 .0294 3 2 6 105 0 0 LINK COBLINK1 67 .0026 1 .0022 .0000 101 .0000 0 0 0 1 0 0 LINK COBLINK1 68 .0026 1 .0022 .0000 101 .0000 0 0 0 1 0 0 LINK COBLINK1 69 .0026 1 .0023 .0000 101 .0000 0 0 0 1 0 0 LINK COBLINK1 70 .0027 1 .0022 .0000 101 .0000 0 0 0 1 0 0 LINK COBLINK1 71 .0028 1 .0023 .0000 101 .0000 0 0 0 1 0 0 LINK COBLINK1 84 .1179 3 .0952 .0000 5001 .0100 1 0 2 1 0 0 LINK COBLINK1 85 .1038 1 .0938 .0000 5001 .0000 0 0 0 1 0 0 LINK COBLINK1 86 .1097 1 .0948 .0000 5001 .0000 0 0 0 1 0 0 LINK COBLINK1 87 .1053 1 .0946 .0000 5001 .0000 0 0 0 1 0 0 LINK COBLINK1 88 .1882 1 .0957 .0000 5001 .0000 0 0 0 1 0 0 LINK COBLINK1 89 .1079 1 .0951 .0000 5001 .0000 0 0 0 1 0 0 LINK COBLINK1 91 .2221 3 .1903 .0001 10001 .0034 1 0 2 1 0 0 LINK COBLINK1 92 .2279 1 .1902 .0000 10001 .0000 0 0 0 1 0 0 LINK COBLINK1 93 .2158 1 .1898 .0000 10001 .0000 0 0 0 1 0 0 LINK COBLINK1 94 .2163 1 .1901 .0000 10001 .0000 0 0 0 1 0 0 LINK COBLINK1 95 .3302 1 .1924 .0000 10001 .0000 0 0 0 1 0 0 LINK COBLINK1 96 .2951 1 .1899 .0000 10001 .0000 0 0 0 1 0 0 ******************************** BOTTOM OF DATA ***********************************************************************************
338 CICS Performance Analyzer

Transactions with task number 77 to 96 in the top half of the list were running during the first CICS run. For these transactions, we see that the SC31UGet column corresponds to the values in the PCLINK column. It clearly shows that we were running with RUWAPOOL=NO and that a GETMAIN was performed for each link.
After we stopped and restarted CICS, we again started with a lower task number. The transaction with task number 66 here also shows the higher values for dispatch count and change mode count. Also the SC31UGet value is still high and in the order of the number of times we issued the EXEC CICS LINK command. The reason is that if you specify RUWAPOOL=YES, the first run of a transaction is the same as with RUWAPOOL=NO, but CICS keeps a history of the total storage of RUWAs requested to run the transaction. This means that when the transaction is run again, CICS issues a single GETMAIN for a RUWAPOOL for the total amount of storage required. As in our case, if the transaction follows the same code path, CICS allocates the storage from the RUWAPOOL and no further GETMAIN has to be performed. Therefore, we see that for all subsequent runs of the LINK transaction we only have one GETMAIN left.
15.4.4 LINK performanceThe same way as we did for the CALL performance, we exported the CPU and CPUCLOCK values to a PDS to be used as input for a Lotus 1-2-3 spreadsheet. We could reuse the CALL2 Report Form that was built in 15.3.5, “Data export” on page 330. See Figure 15-10 on page 330 and Figure 15-11 on page 331.
We also reused the LINK Report Set that we earlier defined for this test. However, this time, on the Report Sets screen, we selected the LINK Report Set for updating. On the Report Set screen, we selected Export in the Performance Extracts category to specify the new data set name CICSLS2.LINK.EXPORT, the CALL2 form, and a selection criteria to only print information about the LINK transaction runs that have a dispatch count equal to 1. This is similar to the actions shown in Figure 15-12 on page 331 and Figure 15-13 on page 332.
On the Report Set screen, we also selected List in the Performance Reports category and provided identical information for form and selection criteria. We saw that both List and Export options are flagged as active wit a Yes in the Active column so that both reports are handled in one report run.
We submitted the generated job. We expect an output in the JES spool and an output in the specified data set. Figure 15-17 shows the beginning of the resulting output in the spool. However, the data set will only contain the first two columns because the EOX indicator was moved behind the CPUCLOCK field as shown in Figure 15-11 on page 331.
Figure 15-17 List output with form EMP2
V1R3M0 CICS Performance Analyzer Performance List __________________________________________________ LIST0001 Printed at 22:09:31 10/28/2003 Data from 21:33:33 10/28/2003 APPLID SCSCPJA6 Page 1 User CPU CPUCLOCK Tran Program TaskNo Start Dispatch Dispatch ELAPSCLK Time Time Time Time Count Time
.0025 .0022 LINK COBLINK1 78 21:38:13.465 .0029 1 .0024 .0025 .0022 LINK COBLINK1 79 21:38:14.310 .0028 1 .0023 .0025 .0022 LINK COBLINK1 80 21:38:15.158 .0163 1 .0157 .0026 .0023 LINK COBLINK1 81 21:38:16.003 .0032 1 .0025 .0025 .0022 LINK COBLINK1 82 21:38:16.771 .0029 1 .0025
Chapter 15. CALL and LINK performance 339

The figures from the created data set were again transferred to a spreadsheet. Similar calculations were made as we did for the CALL performance test. The spreadsheet is shown in Table 15-3.
Table 15-3 LINK test results: First run
This spreadsheet again shows that the program ratio, for the run where the program linked only a hundred times, is inconsistent with the two other runs. As the overhead of one GETMAIN is low compared to the rest of the code path, the calculations of the cost of one GETMAIN did not give accurate results, so we preferred not to include these calculations in this spreadsheet.
We thought it could be of more interest to show a comparison between the program execution with CALL and GOBACK and the program execution with EXEC CICS LINK and EXEC CICS RETURN. To do so, we first made a second run comparable to the second run of the first part of this chapter. As linked to program, we were using the same subroutine containing the five additional EXEC CICS commands. We only had to change the GOBACK to an EXEC CICS RETURN.
Table 15-4 shows the results of this run in a spreadsheet.
LINKs/RUWAPOOL
Total CPU
CPUCLOCK AVG Total CPU
Program execution ratio
100/NO 0.0025 0.00220.0025 0.00220.0025 0.00220.0026 0.00230.0025 0.0022 0.00252
100/YES 0.0022 0.00190.0022 0.00190.0023 0.0020.0022 0.00190.0023 0.002 0.00224 1.125
5000/NO 0.1098 0.10950.1096 0.10930.1093 0.1090.109 0.1087
0.1089 0.1086 0.10932
5000/YES 0.0938 0.09340.0948 0.09450.0946 0.09420.0957 0.09540.0951 0.0947 0.0948 1.15316456
10000/NO 0.2196 0.21930.2182 0.21780.2193 0.2190.2192 0.21890.2184 0.2181 0.21894
10000/YES 0.1902 0.18990.1898 0.18950.1901 0.18980.1924 0.19210.1899 0.1896 0.19048 1.14941201
340 CICS Performance Analyzer

Table 15-4 LINK results: Second run
Table 15-5 shows the result of comparing the runs with a COBOL CALL statement versus the runs with EXEC CICS commands.
Table 15-5 CALL versus LINK comparison
The figures in the table are the average total CPU time for one execution of the program expressed in microseconds. They are shown are based on the measurements when the subroutine is called 10000 times.
The lowest figure in the table is 0.31 for the CALL to the empty subroutine with CBLPSHPOP OFF. In this case, during the transaction run, only two EXEC CICS MONITOR commands are
CALL LINK
CBLPSHPOPON
CBLPSHPOP OFF
RUWAPOOLNO
RUWAPOOLYES
Empty subroutine
3,01 0.31 21.89 19.05
Five commands in subroutine
17.66 14.80 35.95 34.52
LINKs/RUWAPOOL
Total CPU
CPUCLOCK AVG Total CPU
Program execution ratio
100/NO 0.004 0.00370.0038 0.00350.0039 0.00360.0038 0.00350.0039 0.0036 0.00388
100/YES 0.0038 0.00360.0039 0.00360.0039 0.00360.0037 0.00350.0037 0.0034 0.0038 1.02105263
5000/NO 0.1813 0.17880.18 0.17770.18 0.1777
0.1786 0.17640.1789 0.1766 0.17976
5000/YES 0.1733 0.17120.1736 0.17120.1737 0.17160.1705 0.16840.1721 0.17 0.17264 1.04124189
10000/NO 0.3565 0.35220.3603 0.35570.3591 0.35450.3635 0.35870.3582 0.3536 0.35952
10000/YES 0.3459 0.34140.3461 0.34170.3441 0.33960.3445 0.340.3456 0.3408 0.34524 1.04136253
Chapter 15. CALL and LINK performance 341

executed, and no other EXEC CICS command is executed during the 10000 times the subroutine is called. With CBLPSHPOP ON, for the same transaction run, one EXEC CICS PUSH and one EXEC CICS POP are executed per CALL, that means 20000 EXEC CICS commands are added. When CALLing the subroutine with the five EXEC CICS commands, we have to add another 50000 EXEC CICS commands to the previous counts so that we come to 50002 for CBLPSHPOP OFF and 70002 for CBLPSHPOP ON. This is reflected in the different results. Note that we did not calculate the time for one EXEC CICS command because each command has a different code path.
For the LINK figures, we have twice the same number of EXEC CICS commands that are executed: 20003 when calling the empty subroutine and 70003 when calling the five commands subroutine. The difference in time is purely the effect of the difference in code path if RUWAPOOL is YES or NO.
When using the subroutine with the five EXEC CICS commands, we can compare the CALL with CBLPSHPOP ON with the LINK results as those runs execute all about 70000 EXEC CICS commands. In this case, we see that there is a remarkable difference between programs using a COBOL CALL statement and EXEC CICS LINK and RETURN commands.
15.5 ConclusionWe conclude from these test runs that the use of CALL instead of EXEC CICS LINK has significant advantage in terms of CPU consumption. If you develop new COBOL applications, consider using CALL commands rather than EXEC CICS LINK commands. In this case, develop subroutines in a way that they do not require EXEC CICS HANDLE commands or that they include their own EXEC CICS PUSH and POP commands so that LE run-time option CBLPSHPOP can be set to OFF.
If you use a lot of EXEC CICS LINK commands, consider defining RUWAPOOL=YES in the SIT if storage utilization allows to do so.
The goal of this topic was to show the ease of use of CICS PA when you want to do your own performance measurement. After you make your setup, it is easy to reuse the previously defined definitions. If by looking at a certain report, a question arises about an SMF field that is not displayed in this report, it is easy to change the Report Form to include the required field. After a new test run, it is often enough to just change the name of the data set that contains the SMF records to produce a new report.
342 CICS Performance Analyzer

Chapter 16. Exception reporting
This chapter provides examples of CICS PA exception reports.
16
© Copyright IBM Corp. 2003. All rights reserved. 343
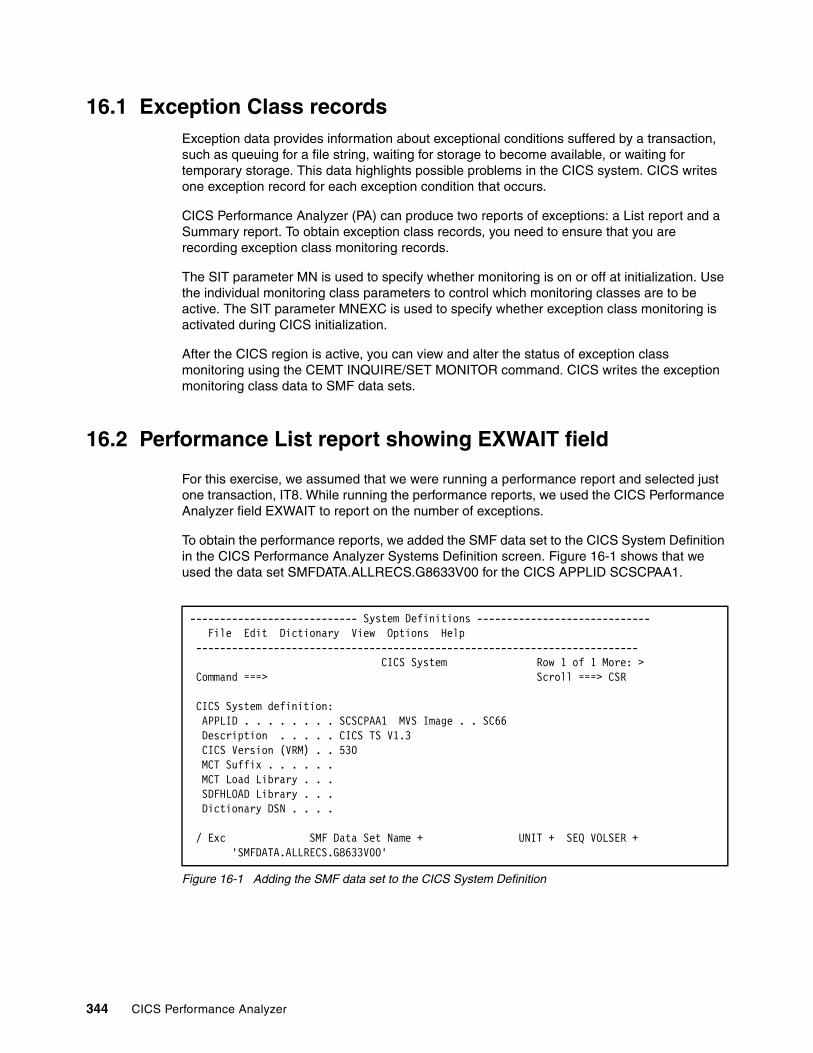
16.1 Exception Class recordsException data provides information about exceptional conditions suffered by a transaction, such as queuing for a file string, waiting for storage to become available, or waiting for temporary storage. This data highlights possible problems in the CICS system. CICS writes one exception record for each exception condition that occurs.
CICS Performance Analyzer (PA) can produce two reports of exceptions: a List report and a Summary report. To obtain exception class records, you need to ensure that you are recording exception class monitoring records.
The SIT parameter MN is used to specify whether monitoring is on or off at initialization. Use the individual monitoring class parameters to control which monitoring classes are to be active. The SIT parameter MNEXC is used to specify whether exception class monitoring is activated during CICS initialization.
After the CICS region is active, you can view and alter the status of exception class monitoring using the CEMT INQUIRE/SET MONITOR command. CICS writes the exception monitoring class data to SMF data sets.
16.2 Performance List report showing EXWAIT field
For this exercise, we assumed that we were running a performance report and selected just one transaction, IT8. While running the performance reports, we used the CICS Performance Analyzer field EXWAIT to report on the number of exceptions.
To obtain the performance reports, we added the SMF data set to the CICS System Definition in the CICS Performance Analyzer Systems Definition screen. Figure 16-1 shows that we used the data set SMFDATA.ALLRECS.G8633V00 for the CICS APPLID SCSCPAA1.
Figure 16-1 Adding the SMF data set to the CICS System Definition
---------------------------- System Definitions ----------------------------- File Edit Dictionary View Options Help -------------------------------------------------------------------------- CICS System Row 1 of 1 More: > Command ===> Scroll ===> CSR CICS System definition: APPLID . . . . . . . . SCSCPAA1 MVS Image . . SC66 Description . . . . . CICS TS V1.3 CICS Version (VRM) . . 530 MCT Suffix . . . . . . MCT Load Library . . . SDFHLOAD Library . . . Dictionary DSN . . . . / Exc SMF Data Set Name + UNIT + SEQ VOLSER + 'SMFDATA.ALLRECS.G8633V00'
344 CICS Performance Analyzer

To produce a performance report which includes the EXWAIT field, we created a new Report Form. From the CICS Performance Analyzer main menu, we selected option is 3 for the Report Form. We created the Report Form by specifying NEW EXCFORM. See Figure 16-2.
Figure 16-2 New Report Form EXCFORM
Using the line commands, we moved the EXWAIT field into the Report Form we set up. We also copied it and made the new copy a Type of COUNT. We did this to see how many times we had an exception. See Figure 16-3.
Figure 16-3 EXCFORM Report Form
File Confirm Samples Options Help ------------------------------------------------------------------------------ Report Forms Row 1 to 5 of 5 Command ===> new excform Scroll ===> CSR Report Forms Data Set . . : CICSLS5.CICSPA.FORM / Name Type Description Changed ID
BADRESP LISTX Top 20 Worst Response Times 2003/03/08 00:00 CICSPA DB2PERF LIST List Report Form 2003/10/15 12:05 CICSLS5 EJBPERF LIST List Report Form 2003/10/23 15:48 CICSLS5
SUSPEND LIST List Report Form 2003/10/22 17:30 CICSLS5
File Edit Confirm Upgrade Options Help ------------------------------------------------------------------------------ EDIT LIST Report Form - EXCFORM Row 1 of 221 More: > Command ===> Scroll ===> CSR Description . . . List Report Form Version (VRM): 530 Selection Criteria: Performance Field / Name + Type Description TRAN Transaction identifier STYPE Transaction start type PROGRAM Program name TASKNO Transaction identification number STOP TIMET Task stop time RESPONSE Transaction response time DISPATCH TIME Dispatch time CPU TIME CPU time EXWAIT TIME Exception Conditions wait time EXWAIT COUNT Exception Conditions wait time SUSPEND TIME Suspend time DISPWAIT TIME Redispatch wait time FCWAIT TIME File I/O wait time FCAMCT File access-method requests
IRWAIT TIME MRO link wait time EOR ---------------- End of Report ----------------
Chapter 16. Exception reporting 345

To produce a report, we created a new Report Set. From the CICS Performance Analyzer main menu, we selected option 2 for the Report Set. We created a new report called REPIT8 (Figure 16-4).
Figure 16-4 New Report Set REPIT8
On the Report Set screen, we selected List in the Performance Reports category as shown in Figure 16-5.
Figure 16-5 List Performance Report
File Systems Confirm Options Help ------------------------------------------------------------------------------ Report Sets Row 1 to 9 of 9 Command ===> new repit8 Scroll ===> CSR Report Sets Data Set . . : CICSLS5.CICSPA.RSET / Name Description Changed ID
DB2REPS CICS PA Report Set 2003/10/14 12:00 CICSLS5 DB2REP2 CICS PA Report Set 2003/10/15 13:35 CICSLS5 EJBREP CICS PA Report Set 2003/10/23 12:08 CICSLS5 EXCREP CICS PA Report Set 2003/10/23 11:28 CICSLS5 LOGREPS CICS PA Report Set 2003/10/22 14:39 CICSLS5 LOGREP2 CICS PA Report Set 2003/10/18 09:48 CICSLS5 REPORT1 CICS PA Report Set 2003/10/23 08:49 CICSLS5 REPORT2 CICS PA Report Set 2003/10/25 11:05 CICSLS5 REPORT3 CICS PA Report Set 2003/10/22 18:47 CICSLS5
File Systems Confirm Options Help ------------------------------------------------------------------------------ EDIT Report Set - REPIT8 Row 1 of 34 Command ===> Scroll ===> CSR Description . . . CICS PA Report Set Enter "/" to select action. ** Reports ** Active - Options No Global No - Selection Criteria No Performance No Exception No - Performance Reports No s List No List Extended No Summary No Totals No Wait Analysis No Cross-System Work No Transaction Group No BTS No
346 CICS Performance Analyzer

We added the Report Form we created to the Report Set. We also specified a selection criteria for the transaction IT8. In Figure 16-6, you can see that we specified the Report Form, EXCFORM, and requested selection criteria. We also entered a title of CICS PA Report IT8 for the report.
Figure 16-6 Performance List Report
As shown in Figure 16-7, we specified the selection criteria we wanted. In this case, we wanted to include the transaction IT8.
Figure 16-7 Performance Selection
File Systems Options Help ------------------------------------------------------------------------------ REPIT8 - Performance List Report Command ===> System Selection: Report Output: APPLID . . + DDname . . . . . . . . . LIST0001 Image . . + Print Lines per Page . . (1-255) Group . . + Report Format: Form . . . EXCFORM + Title . . CICS PA Report IT8 Selection Criteria: s Performance
File Edit Object Lists Options Help ------------------------------------------------------------------------------ REPIT8 - Performance Select Statement Row 1 of 9 More: > Command ===> Scroll ===> CSR Active --------------- Report Interval ---------------- Inc Start -------- From --------- --------- To ---------- Exc Stop MM/DD/YYYY HH:MM:SS.TH MM/DD/YYYY HH:MM:SS.TH ------------------------------------------------------------------------------ Inc Field --- Value or Range --- Object / Exc Name + Type Value/From To List + INC TRAN IT8
Chapter 16. Exception reporting 347
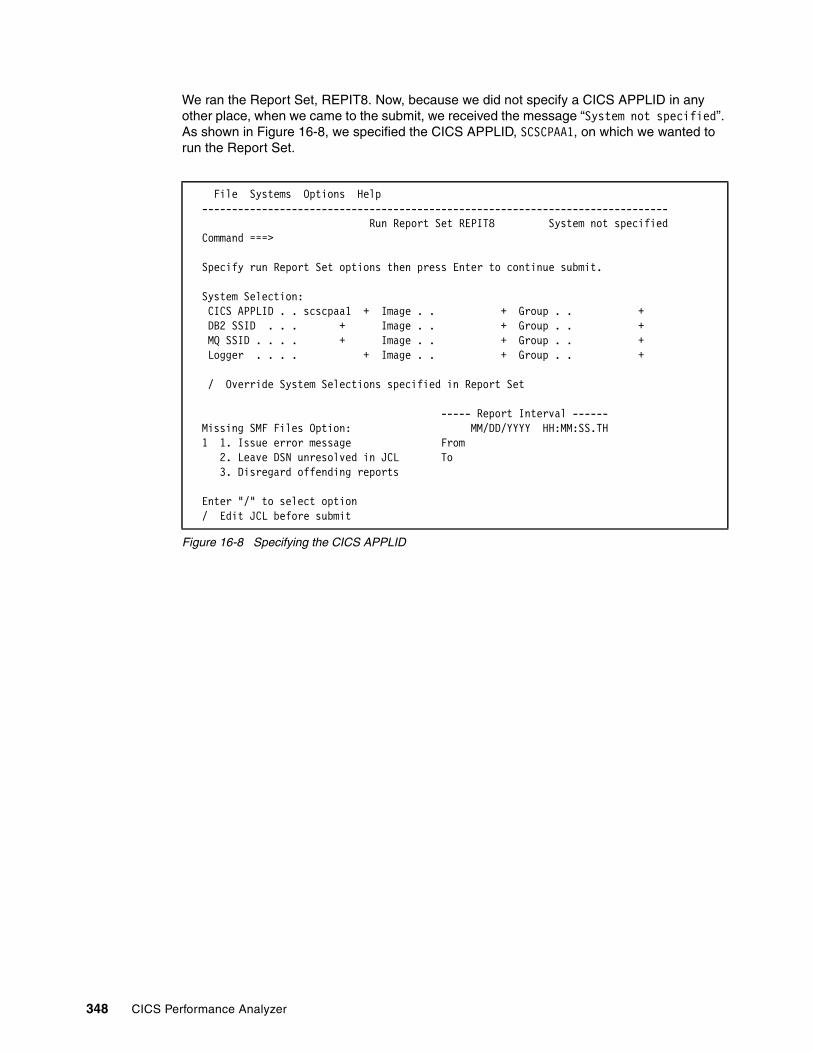
We ran the Report Set, REPIT8. Now, because we did not specify a CICS APPLID in any other place, when we came to the submit, we received the message “System not specified”. As shown in Figure 16-8, we specified the CICS APPLID, SCSCPAA1, on which we wanted to run the Report Set.
Figure 16-8 Specifying the CICS APPLID
File Systems Options Help ------------------------------------------------------------------------------ Run Report Set REPIT8 System not specified Command ===> Specify run Report Set options then press Enter to continue submit. System Selection: CICS APPLID . . scscpaa1 + Image . . + Group . . + DB2 SSID . . . + Image . . + Group . . + MQ SSID . . . . + Image . . + Group . . + Logger . . . . + Image . . + Group . . + / Override System Selections specified in Report Set ----- Report Interval ------ Missing SMF Files Option: MM/DD/YYYY HH:MM:SS.TH 1 1. Issue error message From 2. Leave DSN unresolved in JCL To 3. Disregard offending reports Enter "/" to select option / Edit JCL before submit
348 CICS Performance Analyzer

Figure 16-9 shows part of the report that we produced. In this report, you can see the number of exceptions in the Exc Wait Count column.
Figure 16-9 Performance List Report edited
16.3 Exception List reportTo see the exceptions, we used the CICS Performance Analyzer Exception report. In Figure 16-10, we requested a new Report Set by specifying NEW EXCREP.
V1R3M0 CICS Performance Analyzer Performance List __________________________________________________ LIST0001 Printed at 12:16:22 10/25/2003 Data from 08:33:10 10/23/2003 APPLID SCSCPAA1 Page 7 CICS PA Report IT8 Tran SC Program TaskNo Stop Response Dispatch User CPU Exc Wait Exc Wait Suspend DispWait FC Wait FCAMRq IR Wait Time Time Time Time Time Count Time Time IT8 TP DSWIT8VV 59793 8:33:10.248 .1145 .0059 .0030 .0000 0 .1086 .0267 .0000 18 .0000 IT8 TP DSWIT8VV 59796 8:33:10.275 .1411 .0059 .0032 .0000 0 .1351 .0231 .0000 18 .0000 IT8 TP DSWIT8VV 59799 8:33:10.276 .1425 .0051 .0030 .0000 0 .1374 .0284 .0000 18 .0000 IT8 TP DSWIT8VV 59795 8:33:10.280 .1463 .0056 .0030 .0000 0 .1408 .0292 .0000 18 .0000 IT8 TP DSWIT8VV 59774 8:33:10.286 .2764 .0105 .0031 .0880 1 .2658 .1171 .0000 18 .0000 IT8 TP DSWIT8VV 59776 8:33:10.287 .2728 .0846 .0030 .0029 1 .1881 .0372 .0000 18 .0000 IT8 TP DSWIT8VV 59804 8:33:10.371 .2375 .0062 .0035 .0000 0 .2312 .0033 .0000 18 .0000 IT8 TP DSWIT8VV 59781 8:33:10.372 .2665 .0049 .0030 .0000 0 .2616 .0061 .0000 18 .0000 IT8 TP DSWIT8VV 59755 8:33:10.373 .7382 .0050 .0030 .0994 1 .7332 .0186 .0000 18 .0000 IT8 TP DSWIT8VV 59783 8:33:10.374 .2686 .0055 .0029 .0000 0 .2630 .0123 .0000 18 .0000 IT8 TP DSWIT8VV 59786 8:33:10.375 .2422 .0057 .0030 .0000 0 .2365 .0170 .0000 18 .0000 IT8 TP DSWIT8VV 59805 8:33:10.377 .2429 .0267 .0028 .0000 0 .2162 .0155 .0000 18 .0000 IT8 TP DSWIT8VV 59805 8:33:10.377 .2429 .0267 .0028 .0000 0 .2162 .0155 .0000 18 .0000IT8 TP DSWIT8VV 59808 8:33:10.377 .2431 .0056 .0030 .0000 0 .2375 .0269 .0000 18 .0000IT8 TP DSWIT8VV 59788 8:33:10.391 .2578 .0060 .0034 .0989 1 .2518 .0126 .0000 18 .0000IT8 TP DSWIT8VV 59791 8:33:10.393 .2595 .0062 .0032 .0000 0 .2533 .0127 .0000 18 .0000IT8 TP DSWIT8VV 59794 8:33:10.393 .2598 .0051 .0031 .0000 0 .2547 .0168 .0000 18 .0000IT8 TP DSWIT8VV 59777 8:33:10.501 .4868 .0060 .0031 .0000 0 .4808 .0082 .0000 18 .0000IT8 TP DSWIT8VV 59801 8:33:10.501 .3679 .0061 .0032 .0000 0 .3618 .0184 .0000 18 .0000IT8 TP DSWIT8VV 59797 8:33:10.505 .3716 .0049 .0028 .0000 0 .3667 .0237 .0000 18 .0000IT8 TP DSWIT8VV 59756 8:33:10.513 .8786 .0051 .0029 .0000 0 .8735 .0148 .0000 18 .0000IT8 TP DSWIT8VV 59784 8:33:10.516 .4105 .0052 .0028 .0000 0 .4053 .0163 .0000 18 .0000IT8 TP DSWIT8VV 59787 8:33:10.517 .3834 .0060 .0030 .0000 0 .3774 .0139 .0000 18 .0000IT8 TP DSWIT8VV 59809 8:33:10.517 .3835 .0053 .0030 .0000 0 .3782 .0116 .0000 18 .0000IT8 TP DSWIT8VV 59806 8:33:10.645 .5110 .0050 .0031 .0000 0 .5059 .0184 .0000 18 .0000IT8 TP DSWIT8VV 59780 8:33:10.646 .5408 .0061 .0032 .0000 0 .5347 .0170 .0000 18 .0000IT8 TP DSWIT8VV 59792 8:33:10.647 .5136 .0067 .0032 .0000 0 .5069 .0140 .0000 18 .0000IT8 TP DSWIT8VV 59789 8:33:10.648 .5150 .0063 .0034 .0969 1 .5086 .0236 .0000 18 .0000IT8 TP DSWIT8VV 59800 8:33:10.662 .5287 .0050 .0029 .0000 0 .5237 .0130 .0000 18 .0000IT8 TP DSWIT8VV 59798 8:33:10.665 .5310 .0048 .0032 .0000 0 .5261 .0100 .0000 18 .0000IT8 TP DSWIT8VV 59835 8:33:10.687 .0465 .0048 .0028 .0000 0 .0417 .0075 .0000 18 .0000IT8 TP DSWIT8VV 59807 8:33:10.692 .5579 .0059 .0031 .0000 0 .5519 .0105 .0000 18 .0000IT8 TP DSWIT8VV 59833 8:33:10.692 .0517 .0062 .0034 .0000 0 .0455 .0080 .0000 18 .0000IT8 TP DSWIT8VV 59810 8:33:10.697 .5633 .0048 .0029 .0000 0 .5584 .0133 .0000 18 .0000
Chapter 16. Exception reporting 349

Figure 16-10 New Report Set EXCREP
To produce an exception report, we selected List in the Exception Reports category as shown in Figure 16-11.
Figure 16-11 Exception List Report
File Systems Confirm Options Help ------------------------------------------------------------------------------ Report Sets Row 1 to 7 of 7 Command ===> new excrep Scroll ===> CSR Report Sets Data Set . . : CICSLS5.CICSPA.RSET / Name Description Changed ID DB2REPS CICS PA Report Set 2003/10/14 12:00 CICSLS5 DB2REP2 CICS PA Report Set 2003/10/15 13:35 CICSLS5 LOGREPS CICS PA Report Set 2003/10/22 14:39 CICSLS5 LOGREP2 CICS PA Report Set 2003/10/18 09:48 CICSLS5 REPORT1 CICS PA Report Set 2003/10/23 08:49 CICSLS5 REPORT2 CICS PA Report Set 2003/10/23 08:58 CICSLS5 REPORT3 CICS PA Report Set 2003/10/22 18:47 CICSLS5
File Systems Confirm Options Help ------------------------------------------------------------------------------ EDIT Report Set - EXCREP Row 1 of 25 Command ===> Scroll ===> CSR Description . . . CICS PA Report Set Enter "/" to select action. ** Reports ** Active - Options No Global No - Selection Criteria No Performance No Exception No + Performance Reports No - Exception Reports No s List No Summary No - Transaction Resource Usage Reports No File Usage Summary No Temporary Storage Usage Summary No Transaction Resource Usage List No - Subsystem Reports No DB2 No WebSphere MQ No
350 CICS Performance Analyzer

We pressed Enter and the Exception List Report screen is displayed. We entered a title for the report and left the other fields as the default (Figure 16-12).
Figure 16-12 Report title
We completed the changes for the Exception List Report screen. We pressed F3 twice to return to the Report Set screen. On this screen, we entered line action RUN on the List to run the report (Figure 16-13).
Figure 16-13 Run Exception List Report
We pressed Enter, and then CICS Performance Analyzer presented the Run Report Set screen (Figure 16-14). On this screen, we verified the CICS APPLID on whose exceptions we wanted to report.
File Systems Options Help ------------------------------------------------------------------------------ EXCREP - Exception List Report Command ===> System Selection: Report Output: APPLID . . + DDname . . . . . . . . . XLST0001 Image . . + Print Lines per Page . . (1-255) Group . . + Report Format: Title . . CICS PA Exception List Report Selection Criteria: Exception
File Systems Confirm Options Help ------------------------------------------------------------------------------ EDIT Report Set - EXCREP Row 1 of 25 Command ===> Scroll ===> CSR Description . . . CICS PA Report Set Enter "/" to select action. ** Reports ** Active - Options Yes Global Yes - Selection Criteria No Performance No Exception No + Performance Reports No - Exception Reports Yes RUN List Yes Summary No - Transaction Resource Usage Reports No File Usage Summary No Temporary Storage Usage Summary No Transaction Resource Usage List No - Subsystem Reports No DB2 No WebSphere MQ No
Chapter 16. Exception reporting 351

Figure 16-14 Specifying CICS APPLID
Figure 16-15 shows the report that was produced. From the performance report, you can see that task number 59774 had an exception. You can also see that the exception was a string wait on file DEPSUMDB.
Figure 16-15 Exception List Report edited
File Systems Options Help ------------------------------------------------------------------------------ Run Report Set EXCREP Command ===> Specify run Report Set options then press Enter to continue submit. System Selection: CICS APPLID . . SCSCPAA1 + Image . . + Group . . + DB2 SSID . . . + Image . . + Group . . + MQ SSID . . . . + Image . . + Group . . + Logger . . . . + Image . . + Group . . + / Override System Selections specified in Report Set ----- Report Interval ------ Missing SMF Files Option: MM/DD/YYYY HH:MM:SS.TH 1 1. Issue error message From 2. Leave DSN unresolved in JCL To 3. Disregard offending reports Enter "/" to select option / Edit JCL before submit
V1R3M0 CICS Performance Analyzer Exception List __________________________________________________ XLST0001 Printed at 10:37:51 10/23/2003 Data from 08:33:06 10/23/2003 APPLID SCSCPAA1 Page 1CICS PA Exception List Report Tran Service Report Exp ..... Time ..... Current Resource ExceptionTran Term LUName Userid SC Class Class Class Taskno Seq Start Elapsed Program Type Resource ID Type /FOR T27 SCSCPTA2 CICSUSER TO 59478 1 08:33:06 .046 DSWFORVV STORAGE EUDSA WAIT /FOR T26 SCSCPTA2 CICSUSER TO 59475 1 08:33:06 .046 DSWFORVV STORAGE EUDSA WAIT /FOR T116 SCSCPTA1 CICSUSER TO 59469 1 08:33:06 .045 DSWFORVV STORAGE EUDSA WAIT IT8 T13 SCSCPTA1 CICSUSER TP 59471 1 08:33:06 .045 DSWIT8VV STORAGE EUDSA WAIT /FOR T215 SCSCPTA2 CICSUSER TO 59466 1 08:33:06 .045 DSWFORVV STORAGE EUDSA WAIT /FOR T123 SCSCPTA1 CICSUSER TO 59459 1 08:33:06 .002 DSWFORVV STORAGE EUDSA WAIT /FOR T243 SCSCPTA2 CICSUSER TO 59458 1 08:33:06 .004 DSWFORVV STORAGE EUDSA WAIT /FOR T242 SCSCPTA2 CICSUSER TO 59455 1 08:33:06 .006 DSWFORVV STORAGE EUDSA WAIT /FOR T241 SCSCPTA2 CICSUSER TO 59453 1 08:33:06 .008 DSWFORVV STORAGE EUDSA WAIT /FOR T222 SCSCPTA2 CICSUSER TO 59454 1 08:33:06 .009 DSWFORVV STORAGE EUDSA WAIT /FOR T122 SCSCPTA1 CICSUSER TO 59449 1 08:33:06 .013 DSWFORVV STORAGE EUDSA WAIT /FOR T240 SCSCPTA2 CICSUSER TO 59451 1 08:33:06 .015 DSWFORVV STORAGE EUDSA WAIT IT8 T134 SCSCPTA1 CICSUSER TP 59654 1 08:33:07 .024 DSWIT8VV STORAGE EUDSA WAIT IT8 T11 SCSCPTA1 CICSUSER TP 59776 1 08:33:10 .002 DSWIT8VV FILE DEPSUMDB STRING IT8 T21 SCSCPTA2 CICSUSER TP 59774 1 08:33:10 .088 DSWIT8VV FILE DEPSUMDB STRING IT8 T17 SCSCPTA1 CICSUSER TP 59788 1 08:33:10 .098 DSWIT8VV FILE DEPSUMDB STRING IT8 T212 SCSCPTA2 CICSUSER TP 59755 1 08:33:10 .099 DSWIT8VV FILE DEPSUMDB STRING IT8 T18 SCSCPTA1 CICSUSER TP 59789 1 08:33:10 .096 DSWIT8VV FILE DEPSUMDB STRING IT8 T23 SCSCPTA2 CICSUSER TP 60008 1 08:33:13 .019 DSWIT8VV FILE DEPSUMDB STRING IT8 T11 SCSCPTA1 CICSUSER TP 60009 1 08:33:13 .001 DSWIT8VV FILE DEPSUMDB STRING IT8 T115 SCSCPTA1 CICSUSER TP 60018 1 08:33:13 .004 DSWIT8VV FILE DEPSUMDB STRING IT8 T110 SCSCPTA1 CICSUSER TP 60017 1 08:33:13 .008 DSWIT8VV FILE DEPSUMDB STRING
352 CICS Performance Analyzer

When we set up the Report Set for the exceptions, we did not specify any selection criteria. This resulted in the report in Figure 16-15, which also shows that the APPLID SCSCPAA1 suffered exceptions of Waits for EUDSA.
16.4 Exception Summary reportWe ran the Exception Summary report (Figure 16-16). Here we first deactivated the Exception Report: List and then activated the Exception Report: Summary. We could have run both the List and Summary reports together in the same job, by activating both reports on the Report Set screen.
Figure 16-16 Activate Exception Summary Report
We then ran the Exception Summary report. Figure 16-17 shows the output.
Figure 16-17 Exception Summary report
File Systems Confirm Options Help ------------------------------------------------------------------------------ EDIT Report Set - EXCREP Row 1 of 25 Command ===> Scroll ===> CSR Description . . . CICS PA Report Set Enter "/" to select action. ** Reports ** Active - Options No Global No - Selection Criteria No Performance No Exception No + Performance Reports No - Exception Reports No List No a Summary No - Transaction Resource Usage Reports No File Usage Summary No Temporary Storage Usage Summary No Transaction Resource Usage List No - Subsystem Reports No DB2 No WebSphere MQ No
V1R3M0 CICS Performance Analyzer Exception Summary __________________________________________________ XSUM0001 Printed at 11:28:25 10/23/2003 Data from 08:33:06 10/23/2003 to 08:34:43 10/23/2003 Page 1 Tran Total TS-Buffer-Wait TS-String-Wait Pool-Buffr-Wait Pool-Strng-Wait File-Strng-Wait ..Temp Storage. ..Main Storage. ID Excepts Average Count Average Count Average Count Average Count Average Count Average Count Average Count /FOR 46 .046 46IT8 74 .020 69 .035 5 ------- ------- ------- ------- ------- ------- ------- ------- ------- ------- ------- ------- ------- ------- -------TOTAL 120 .020 69 .045 51
Chapter 16. Exception reporting 353

The Exception Summary report summarizes the exception records collected by the CICS Monitoring Facility. The records are summarized by transaction identifier. The report provides the total number of exceptions for each transaction. In the report shown in Figure 16-17, you can see that the transaction IT8 had a total of 74 exceptions. Five of them were storage waits and the rest were string waits.
In conclusion, the CICS PA Exception Reports showed the number and type of exceptions from which the CICS System was suffering.
354 CICS Performance Analyzer

Chapter 17. Analyzing overall system performance
In this chapter, we generate reports that help use to understand the overall performance behavior of a system that is composed of a number of CICS regions running a mixed transaction workload. We do not use the detailed step-by-step approach as we do in other chapters. Here we describe which definitions we created and only show the most relevant screens.
17
© Copyright IBM Corp. 2003. All rights reserved. 355

17.1 Making a subset of CMF performance recordsFor this chapter, we were collecting CICS Monitoring Facility (CMF) performance records from nine different systems. Refer to Chapter 5, “System setup and scenario overview” on page 129, for a description of our system setup and CICS region connectivity.
Four of our regions are at CICS TS V1.3 level:
� SCSCPTA1 - TOR� SCSCPTA2 - TOR� CICSPAA1 - AOR� CICSPAA4 - AOR
Four other regions are at CICS TS V2.2 level:
� CICSPLA1 - TOR� CICSPLA2 - TOR� CICSPJA6 - AOR� CICSPJA7 - AOR
We also used a stand-alone CICS Transaction Server (TS) V1.3 region, SCSCPAA6, in which we executed some additional CICS Web-based applications.
Because multiple regions are involved, we started by creating a new system definition. We created an MVS image with the name of SC66. From the time we had the load on our CICS systems, we isolated a 15 minutes period. We started from three system management facility (SMF) data sets that we added to our newly created MVS image system definition as shown in Figure 17-1.
Figure 17-1 MVS Image System Definition
We then created a new Report Set with the name CROSS. On the Report Set screen, we selected Record Selection in the Extracts category. Figure 17-2 shows the information that we provided.
---------------------------- System Definitions ----------------------------- File Edit View Options Help -------------------------------------------------------------------------- MVS Image Row 1 of 3 More: > Command ===> Scroll ===> CSR MVS Image definition: MVS Image . . . . . SC66 Description . . . . Cross system testing / Exc SMF Data Set Name + UNIT + SEQ VOLSER + 'SMFDATA.ALLRECS.G8812V00' DASD 'SMFDATA.ALLRECS.G8813V00' DASD 'SMFDATA.ALLRECS.G8814V00' DASD ********************************* End of list *****************************
356 CICS Performance Analyzer

Figure 17-2 Record Selection Extract information
After we saved this information, we received a summary screen with the information from Figure 17-2. We repeated this summary three times and filled in the generic CICS APPLIDs to arrive at the screen shown in Figure 17-3.
Figure 17-3 Record Selection Extract: Selecting CICS systems
We ran the report but before we submitted the job. Then we filled in the required time limits of the period that we decided to investigate as shown in Figure 17-4.
File Systems Options Help ------------------------------------------------------------------------------ CROSS - Record Selection Extract Enter required field Command ===> System Selection: CICS APPLID . . + Image . . SC66 + Group . . + DB2 SSID . . . + Image . . + Group . . + MQ SSID . . . . + Image . . + Group . . + Extract Recap: DDname . . . RSEL0001 Output Data Set: Data Set Name . . 'CICSLS2.BIGRUN1' Disposition . . . 1 1. OLD 2. MOD (If cataloged) Selection Criteria: Performance
File Filter Edit Systems Options Help ------------------------------------------------------------------------------ CROSS - Record Selection Extracts Row 1 from 4 Command ===> Scroll ===> CSR ---- System Selection ----- Selection / Exc APPLID + Image + Group + Recap Criteria SCSCPTA* SC66 RSEL0001 NO Output Data Set . . 'CICSLS2.BIGRUN1' ------------------------------------------------------------------------------ SCSCPAA* SC66 RSEL0001 NO Output Data Set . . 'CICSLS2.BIGRUN1' ------------------------------------------------------------------------------ SCSCPLA* SC66 RSEL0001 NO Output Data Set . . 'CICSLS2.BIGRUN1' ------------------------------------------------------------------------------ SCSCPJA* SC66 RSEL0001 NO Output Data Set . . 'CICSLS2.BIGRUN1' ------------------------------------------------------------------------------
Chapter 17. Analyzing overall system performance 357

Figure 17-4 Report Set: Setting time limits
We submitted the batch job. CICS Performance Analyzer (PA) created a data set CICSLS2.BIGRUN1 that contains only the required records we are interested in for the rest of our tests. In the system definition of MVS image SC66, we replaced the names of the three SMF data sets with the single data set name CICSLS2.BIGRUN1.
17.2 Working with different CICS system releasesEach new release of CICS usually introduces new CMF performance class fields. Therefore, when you analyze data for CICS systems with mixed releases, some tasks include performance data that is not available for other tasks.
Each CICS system (APPLID) has a CMF Dictionary record that defines which fields are applicable to that system. CICS PA keeps a dictionary record for each CICS APPLID that has CMF performance records in the SMF file. CICS PA uses it to extract field values from the performance records when required.
When using Report Forms to tailor your List, ListX or Summary reports, CICS PA may detect that a required field value is not available, in which case, it is reported as “missing”. This typically happens when your Report Form specifies a CMF field for a new release of CICS, and your SMF file includes CMF performance data for CICS systems at an earlier release.
When CICS PA reads the input data set, it uses the first dictionary record that is encountered to build the field layout that will be used for the rest of the run. When you request a field that
File Systems Options Help ------------------------------------------------------------------------------ Run Report Set CROSS Command ===> Specify run Report Set options then press Enter to continue submit. System Selection: CICS APPLID . . + Image . . + Group . . + DB2 SSID . . . + Image . . + Group . . + MQ SSID . . . . + Image . . + Group . . + Logger . . . . + Image . . + Group . . + / Override System Selections specified in Report Set ----- Report Interval ------ Missing SMF Files Option: MM/DD/YYYY HH:MM:SS.TH 1 1. Issue error message From 10/31/2003 15:40:00.00 2. Leave DSN unresolved in JCL To 10/31/2003 15:55:00.00 3. Disregard offending reports Enter "/" to select option / Edit JCL before submit
Note: You can specify a monitoring control table (MCT) to exclude fields from the CMF Dictionary. CICS PA treats all missing fields the same, regardless of whether they are excluded by the MCT or only applicable to a higher release of CICS.
358 CICS Performance Analyzer

appears only in one of the releases, two different situations can occur depending on whether the field is present in the first dictionary record.
17.2.1 Dictionary record does not contain requested fieldIf the first dictionary record encountered in the input data set is from a release that does not contain a requested field, a CPA0311E message is issued and the associated field is omitted. The report that we now are going to produce is a Performance List report in which we use the CICS PA provided sample Report Form CPULST. However, to show the system name of the CMF performance record, we changed the USERID field to APPLID. Figure 17-5 shows that the first dictionary record read was for SCSCPAA4, which is a CICS TS V1.3 system. Message CPA0311E is issued twice because CMF performance fields RO CPU Time and KY8 CPU Time were requested. These correspond to DFHTASK S270 and S263, respectively.
Figure 17-5 System messages from a list report showing CPA0311E
Figure 17-6 shows the beginning of the corresponding Performance List report. The header shows that fields DFHTASK S270 and S263 are missing.
Figure 17-6 List report showing missing header and fields
In an attempt to bypass this problem, we made two subsets of CICSLS2.BIGRUN1. One subset contains only CICS TS V1.3 records and the other only CICS TS V2.2 records. An
V1R3M0 15:32:06 11/07/2003 CICS Performance Analyzer Page 3 System Messages __________________________________________________ CPA0218I Record processing for SMF File SMFIN001 has started CPA0220I SMF records for System SC66 start at 11/05/2003 14:50:03:18 CPA0230I Dictionary Record default is being used, APPLID=SCSCPAA4, Release= 5.3.0 CPA0311E Field ID DFHTASK S270 is not defined to Dictionary - field ignored from module CPALSTMF+ 000556 CPA0311E Field ID DFHTASK S263 is not defined to Dictionary - field ignored from module CPALSTMF+ 000556 CPA0329E Dictionary returned error on Field ID DFHTASK S270 from module CPALSTMF+ 0018D2 CPA0329E Dictionary returned error on Field ID DFHTASK S263 from module CPALSTMF+ 0018D2 CPA0230I Dictionary Record default is being used, APPLID=SCSCPTA1, Release= 5.3.0 CPA0230I Dictionary Record default is being used, APPLID=SCSCPTA2, Release= 5.3.0 CPA0230I Dictionary Record default is being used, APPLID=SCSCPAA1, Release= 5.3.0 CPA0359W Connector ID X'00CC' not mapped by Performance Dictionary record from module CPADICMF+ 000496 Field ID=User field , APPLID=SCSCPAA1, Release= 5.3.0 from module CPADICMF+ 000496 CPA0230I Dictionary Record default is being used, APPLID=SCSCPJA7, Release= 6.2.0 CPA0359W Connector ID X'00F0' not mapped by Performance Dictionary record from module CPADICMF+ 000496 Field ID=User field , APPLID=SCSCPJA7, Release= 6.2.0 from module CPADICMF+ 000496 CPA0230I Dictionary Record default is being used, APPLID=SCSCPLA1, Release= 6.2.0 CPA0359W Connector ID X'00F0' not mapped by Performance Dictionary record from module CPADICMF+ 000496 Field ID=User field , APPLID=SCSCPLA1, Release= 6.2.0 from module CPADICMF+ 000496 CPA0230I Dictionary Record default is being used, APPLID=SCSCPLA2, Release= 6.2.0 CPA0359W Connector ID X'00F0' not mapped by Performance Dictionary record from module CPADICMF+ 000496 Field ID=User field , APPLID=SCSCPLA2, Release= 6.2.0 from module CPADICMF+ 000496 CPA0228I Dictionary Record from Dialog is being used, APPLID=SCSCPJA6, SID=SC66 Record Date=11/01/2003, Time=13:25:08, Release= 6.2.0 CPA0222I SMF records for System SC66 end at 11/05/2003 15:04:59:49 CPA0219I End of File processing for SMF File SMFIN001 has started CPA0229I CICS PA has completed processing, RC=8
V1R3M0 CICS Performance Analyzer Performance List __________________________________________________ LIST0001 Printed at 15:32:06 11/07/2003 Data from 14:49:57 11/05/2003 Page 1 list all Tran APPLID TaskNo Stop Response Dispatch User CPU QR CPU MS CPU DFHTASK DFHTASK J8 CPU L8 CPU S8 CPU Time Time Time Time Time Time S270 S263 Time Time Time SC6 SCSCPAA4 19257 14:49:57.781 .1930 .0491 .0029 .0029 .0000 Missing Missing .0000 .0000 .0000 /FOR SCSCPAA4 19258 14:49:58.044 .0034 .0034 .0014 .0014 .0000 Missing Missing .0000 .0000 .0000 /FOR SCSCPAA4 19259 14:49:58.100 .0034 .0034 .0012 .0012 .0000 Missing Missing .0000 .0000 .0000 /FOR SCSCPAA4 19260 14:49:58.236 .0044 .0044 .0012 .0012 .0000 Missing Missing .0000 .0000 .0000 SX6 SCSCPAA4 19261 14:49:58.577 .0607 .0162 .0026 .0026 .0000 Missing Missing .0000 .0000 .0000
Chapter 17. Analyzing overall system performance 359

alternative to creating data sets that contain subsets for specific CICS regions is to create a group definition. Option 3, Maintain Group definitions, on the Systems Definitions Menu screen, allows you to do so. A system definition has to exist for an individual system that you want to add to a group. Figure 17-7 shows the definition of the group we created to contain only our CICS TS V1.3 regions.
Figure 17-7 CICSTS13 Group definition
The name of this group can then be specified in the Group field of the Record selection Extracts screen as shown in Figure 17-8. The Image name was removed to contain only the group name. One of the individual systems from the group has to contain the name of the SMF input data set so that it can be picked up from there.
Figure 17-8 Record Selection Extracts screen
We changed the SC66 system definition so that it now has two input SMF data sets, CICSLS2.BIGRUN1.CICSTS22 and CICSLS2.BIGRUN1.CICSTS13. By defining CICSLS2.BIGRUN1.CICSTS22 before CICSLS2.BIGRUN1.CICSTS13, we made it so that the CICS TS V2.2 dictionary record would be read and used first.
17.2.2 Dictionary record contains requested fieldIf the first dictionary record encountered is from a release that has the requested field defined, then the field is included in the extract and the subsequent systems that do not have the field defined will have Missing substituted for the value. This time CICS PA issues a message CPA0329E. Figure 17-9 shows the system messages for this case.
---------------------------- System Definitions ---------------------------- File Edit Options Help -------------------------------------------------------------------------- Systems in this Group Row 1 to 5 of 5 Command ===> Scroll ===> CSR Group . . . . . . CICSTS13 Description . . . / System + Type Image Description SCSCPAA1 CICS SC66 System added by take-up SCSCPAA4 CICS SCSCPAA6 CICS SCSCPTA1 CICS SCSCPTA2 CICS ********************************* End of list ****************************
File Filter Edit Systems Options Help ------------------------------------------------------------------------------ CROSS - Record Selection Extracts Row 1 from 1 Command ===> Scroll ===> CSR ---- System Selection ----- Selection / Exc APPLID + Image + Group + Recap Criteria CICSTS13 RSEL0001 NO Output Data Set . . 'CICSLS2.BIGRUN1.CICSTS13' ------------------------------------------------------------------------------ ********************************* End of list *********************************
360 CICS Performance Analyzer

Figure 17-9 System Messages when reading first a CICS TS 2.2 dictionary record
Figure 17-10 shows an extract of the result of this run.
Figure 17-10 List report showing missing fields for CICS TS 1.3 records
In this last case, where we have a mix of CICS TS V1.3 and CICS TS V2.2 records, if we asked for a Summary report, we would have found Missing everywhere for the RO CPU Time and KY8 CPU Time. The reason that the Summary report shows averages and results is different if the average was calculated on reduced task count or on total task count. Running separate reports is more appropriate in this case.
17.3 Looking at overall system performanceWe now review the reports that allow us to have a total view of one system or a group of systems. In a specific system or within a CICSplex, we can also look at groups of transactions or compare the behavior of different CICS components within different CICS regions. The intention is to use as much as possible the standard reports as offered by CICS PA.
V1R3M0 15:27:58 11/07/2003 CICS Performance Analyzer Page 3 System Messages __________________________________________________ CPA0218I Record processing for SMF File SMFIN001 has started CPA0220I SMF records for System SC66 start at 11/05/2003 14:50:00:33 CPA0230I Dictionary Record default is being used, APPLID=SCSCPJA7, Release= 6.2.0 CPA0359W Connector ID X'00F0' not mapped by Performance Dictionary record from module CPADICMF+ 000496 Field ID=User field , APPLID=SCSCPJA7, Release= 6.2.0 from module CPADICMF+ 000496 CPA0230I Dictionary Record default is being used, APPLID=SCSCPLA1, Release= 6.2.0 CPA0359W Connector ID X'00F0' not mapped by Performance Dictionary record from module CPADICMF+ 000496 Field ID=User field , APPLID=SCSCPLA1, Release= 6.2.0 from module CPADICMF+ 000496 CPA0230I Dictionary Record default is being used, APPLID=SCSCPLA2, Release= 6.2.0 CPA0359W Connector ID X'00F0' not mapped by Performance Dictionary record from module CPADICMF+ 000496 Field ID=User field , APPLID=SCSCPLA2, Release= 6.2.0 from module CPADICMF+ 000496 CPA0228I Dictionary Record from Dialog is being used, APPLID=SCSCPJA6, SID=SC66 Record Date=11/01/2003, Time=13:25:08, Release= 6.2.0 CPA0230I Dictionary Record default is being used, APPLID=SCSCPAA4, Release= 5.3.0 CPA0329E Dictionary returned error on Field ID DFHTASK S270 from module CPALSTMF+ 0018D2 CPA0329E Dictionary returned error on Field ID DFHTASK S263 from module CPALSTMF+ 0018D2 CPA0230I Dictionary Record default is being used, APPLID=SCSCPTA1, Release= 5.3.0 CPA0230I Dictionary Record default is being used, APPLID=SCSCPTA2, Release= 5.3.0 CPA0230I Dictionary Record default is being used, APPLID=SCSCPAA1, Release= 5.3.0 CPA0359W Connector ID X'00CC' not mapped by Performance Dictionary record from module CPADICMF+ 000496 Field ID=User field , APPLID=SCSCPAA1, Release= 5.3.0 from module CPADICMF+ 000496 . . . . . . . . . . . . . . . . . . . . . . . . . . . . .
V1R3M0 CICS Performance Analyzer Performance List __________________________________________________ LIST0001 Printed at 15:27:58 11/07/2003 Data from 14:49:58 11/05/2003 Page 1 list all Tran APPLID TaskNo Stop Response Dispatch User CPU QR CPU MS CPU RO CPU KY8 CPU J8 CPU L8 CPU S8 CPU Time Time Time Time Time Time Time Time Time Time Time JCIN SCSCPJA7 6290 14:49:58.990 .1103 .1004 .0866 .0008 .0000 .0000 .0858 .0858 .0000 .0000 JDB3 SCSCPJA7 6291 14:49:58.995 .0677 .0528 .0437 .0009 .0000 .0000 .0428 .0418 .0010 .0000 JDB1 SCSCPJA7 6293 14:49:59.129 .1097 .0883 .0544 .0009 .0000 .0000 .0536 .0493 .0043 .0000 CIRP SCSCPJA7 6292 14:49:59.144 .1324 .1143 .0766 .0011 .0000 .0000 .0755 .0755 .0000 .0000 ..CIRR SCSCPLA2 26930 14:50:07.336 .0916 .0039 .0015 .0012 .0003 .0000 .0000 .0000 .0000 .0000
SC6 SCSCPAA4 19257 14:49:57.781 .1930 .0491 .0029 .0029 .0000 Missing Missing .0000 .0000 .0000 /FOR SCSCPAA4 19258 14:49:58.044 .0034 .0034 .0014 .0014 .0000 Missing Missing .0000 .0000 .0000 /FOR SCSCPAA4 19259 14:49:58.100 .0034 .0034 .0012 .0012 .0000 Missing Missing .0000 .0000 .0000 /FOR SCSCPAA4 19260 14:49:58.236 .0044 .0044 .0012 .0012 .0000 Missing Missing .0000 .0000 .0000 SX6 SCSCPAA4 19261 14:49:58.577 .0607 .0162 .0026 .0026 .0000 Missing Missing .0000 .0000 .0000 PS3 SCSCPAA4 19262 14:49:58.685 .0316 .0311 .0048 .0048 .0000 Missing Missing .0000 .0000 .0000
Chapter 17. Analyzing overall system performance 361

17.3.1 Performance Totals reportThe Performance Totals report summarizes the total system behavior as reflected in CMF performance records. It gives a system-wide overview of system performance and resource usage. It can be used in a daily follow-up of system behavior and, in a way, to compare regions to each other. We started with a totals report of all our systems. We continued to use our CROSS Report Set definition. On the EDIT Report Set screen, we selected Totals in the Performance Reports category. We verified that the System Selection Image field was set to SC66 and did not change the selection criteria. We submitted the batch job, which resulted in seeing page 1 of the output (Figure 17-11). It shows the overall CICS system usage.
Figure 17-11 Default Performance Totals report: Page 1
The Total Elapsed Run Time is the time calculated by subtracting the start time from the first encountered SMF record from the stop time of the last SMF record. As we isolated a time period of 15 minutes, the 46 minutes that we see here seem to be rather a high value.
On the second page of the report, we receive a more detailed view of the CPU and dispatch statistics. Figure 17-12 shows the beginning of page 2.
V1R3M0 CICS Performance Analyzer Performance Totals __________________________________________________ TOTL0001 Printed at 17:59:12 11/07/2003 Data from 14:18:57 11/05/2003 to 15:04:59 11/05/2003 Page 1 Dispatched Time CPU Time DD HH:MM:SS Secs DD HH:MM:SS Secs Total Elapsed Run Time 00:46:02 2762 From Selected Performance Records QR Dispatch/CPU Time 00:03:39 219 00:01:01 61 MS Dispatch/CPU Time 00:00:07 7 00:00:04 4 -------- ----- -------- ------ TOTAL (QR + MS) 00:03:46 226 00:01:06 66 L8 CPU Time 00:00:21 21 J8 CPU Time 00:15:28 928 S8 CPU Time 00:00:00 0 -------- ----- -------- ------ TOTAL (L8 + J8 + S8) 00:31:55 1915 00:15:49 949 -------- ----- -------- ------ Total CICS TCB Time 00:03:46 2141 00:16:55 1015 Total Performance Records (Type C) 0 Total Performance Records (Type D) 4 Total Performance Records (Type F) 0 Total Performance Records (Type S) 0 Total Performance Records (Type T) 54865 -------- -------- Total Performance Records (Selected) 54869 Total Performance Records 54869
362 CICS Performance Analyzer

Figure 17-12 Default Performance Totals report: Page 2
In this report, we see a maximum suspend and response time of 1887 seconds. This is a typical value for the CSOL transaction. CSOL is the TCP/IP listener transaction and is an internal CICS transaction. If you specify TCP=YES in the SIT, this transaction is started at CICS initialization. About every 30 minutes, a CMF performance record is written for this transaction. In this example, where we are interested in only application records, we prefer to exclude these records from the report. In other cases, when you want to consider the total system run, they should not be excluded. That is the reason why these internal transactions are not excluded by default. We suggest a list of long running CICS internal transactions that you can consider excluding from your reports:
� CFQR - RLS quiesce� CFQS - RLS quiesce� CSHQ - Scheduler services� CSNC - IRC connection manager� CSNE - VTAM node abnormal� CSOL - TCP/IP listener� CSSY - CICS internal task� CSTP - CICS internal task� CSZI - FEPI
If your CICS system is managed by CICSPlex System Manager (SM), you should also consider excluding:
� COIE - CICSPlex SM hearbeat task� COI0 - CICSPlex SM CMAS communication task� CONL - CICSPlex SM MAS initialization and control transaction� CONM - CICSPlex SM monitoring task� COHT - CICSPlex SM completed task history recorder
Two more transactions to be considered for exclusion are:
� CSKL - TCP/IP default Sockets listener� CKTI - MQSeries default listener task initiator
V1R3M0 CICS Performance Analyzer Performance Totals __________________________________________________ TOTL0001 Printed at 17:59:12 11/07/2003 Data from 14:18:57 11/05/2003 to 15:04:59 11/05/2003 Page 2 ...... C O U N T S ...... ........... T I M E ........... From Selected Performance Records Total Avg/Task Max/Task Total Avg/Task Max/Task Dispatch Time 795454 14.5 8239 2141 .039 10.650 CPU Time 1015 .018 3.292 RLS CPU (SRB) Time 40 .001 .007 Suspend Time 795451 14.5 8238 10537 .192 1887.441 Dispatch Wait Time 740585 13.5 8238 459 .008 12.807 Dispatch Wait Time (QR Mode) 342477 6.2 26 184 .003 .684 Response (-TCWait for Type C) 0 .000 .000 Response (All Selected Tasks) 12678 .231 1887.479 QR Dispatch Time 397343 7.2 27 219 .004 .641 MS Dispatch Time 110220 2.0 8239 7 .000 1.010 RO Dispatch Time 1 .0 1 0 .000 .013 QR CPU Time 61 .001 .007 MS CPU Time 4 .000 .738 RO CPU TIME 0 .000 .001 L8 CPU Time 21 .000 .007J8 CPU Time 928 .017 3.288 S8 CPU Time 0 .000 .000
Chapter 17. Analyzing overall system performance 363

We made an Object List, CICSEXCL, containing all the transactions that were mentioned (Figure 17-13). Figure 17-12 shows the content of the Object List.
Figure 17-13 Object list to exclude CICS internal transactions
We specified the name of this Object list in the performance criteria of our totals report as shown in Figure 17-14.
Figure 17-14 Exclusion object list specification
File Edit Confirm Options Help ------------------------------------------------------------------------------ EDIT Object List - CICSEXCL Row 1 to 16 of 16 Command ===> Scroll ===> CSR Description . . . . CICS/CPSM trans to be excluded Specify the Object List values: / 1st Value 2nd Value Sublist CFQR CFQS CSHQ CSNC CSNE CSOL CSSY CSTP CSZI COIE COI0 CONL CONM COHT CSKL CKTI
File Edit Object Lists Options Help ------------------------------------------------------------------------------ CROSS - Performance Select Statement Row 1 of 1 More: > Command ===> Scroll ===> CSR Active --------------- Report Interval ---------------- Inc Start -------- From --------- --------- To ---------- Exc Stop MM/DD/YYYY HH:MM:SS.TH MM/DD/YYYY HH:MM:SS.TH ------------------------------------------------------------------------------ Inc Field --- Value or Range --- Object / Exc Name + Type Value/From To List + EXC TRAN CICSEXCL ********************************* End of list *********************************
364 CICS Performance Analyzer
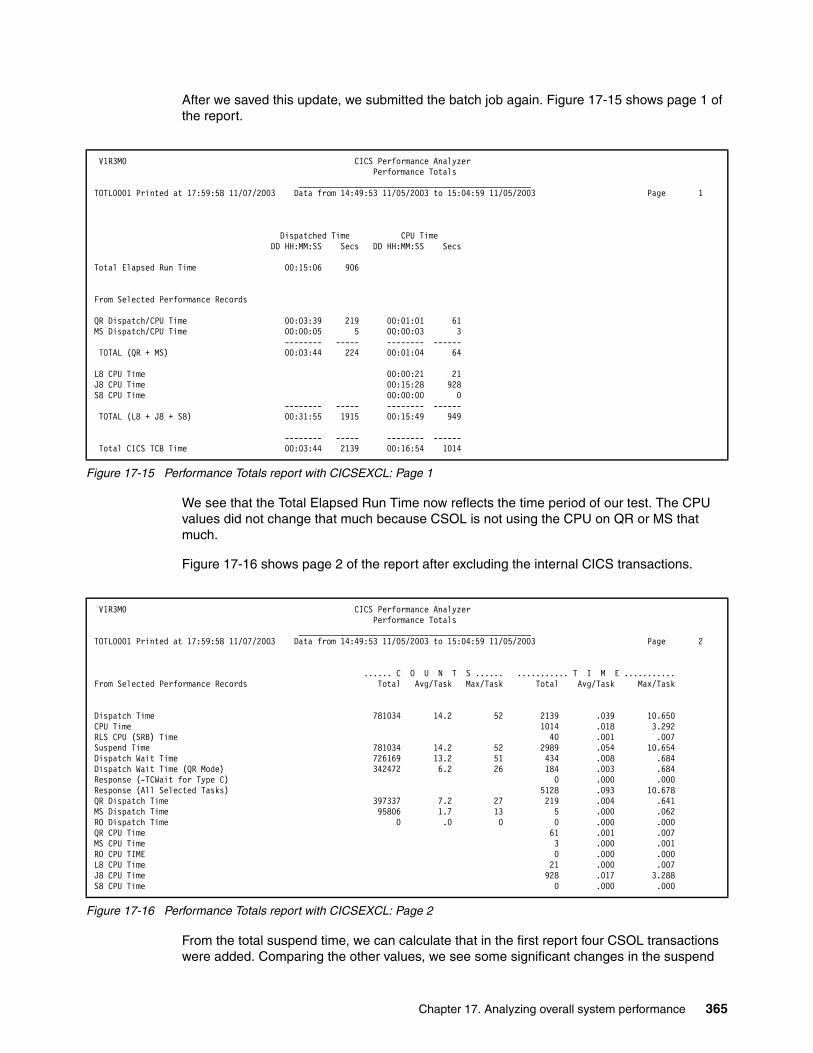
After we saved this update, we submitted the batch job again. Figure 17-15 shows page 1 of the report.
Figure 17-15 Performance Totals report with CICSEXCL: Page 1
We see that the Total Elapsed Run Time now reflects the time period of our test. The CPU values did not change that much because CSOL is not using the CPU on QR or MS that much.
Figure 17-16 shows page 2 of the report after excluding the internal CICS transactions.
Figure 17-16 Performance Totals report with CICSEXCL: Page 2
From the total suspend time, we can calculate that in the first report four CSOL transactions were added. Comparing the other values, we see some significant changes in the suspend
V1R3M0 CICS Performance Analyzer Performance Totals __________________________________________________ TOTL0001 Printed at 17:59:58 11/07/2003 Data from 14:49:53 11/05/2003 to 15:04:59 11/05/2003 Page 1 Dispatched Time CPU Time DD HH:MM:SS Secs DD HH:MM:SS Secs Total Elapsed Run Time 00:15:06 906 From Selected Performance Records QR Dispatch/CPU Time 00:03:39 219 00:01:01 61 MS Dispatch/CPU Time 00:00:05 5 00:00:03 3 -------- ----- -------- ------ TOTAL (QR + MS) 00:03:44 224 00:01:04 64 L8 CPU Time 00:00:21 21 J8 CPU Time 00:15:28 928 S8 CPU Time 00:00:00 0 -------- ----- -------- ------ TOTAL (L8 + J8 + S8) 00:31:55 1915 00:15:49 949
-------- ----- -------- ------ Total CICS TCB Time 00:03:44 2139 00:16:54 1014
V1R3M0 CICS Performance Analyzer Performance Totals __________________________________________________ TOTL0001 Printed at 17:59:58 11/07/2003 Data from 14:49:53 11/05/2003 to 15:04:59 11/05/2003 Page 2 ...... C O U N T S ...... ........... T I M E ........... From Selected Performance Records Total Avg/Task Max/Task Total Avg/Task Max/Task Dispatch Time 781034 14.2 52 2139 .039 10.650 CPU Time 1014 .018 3.292 RLS CPU (SRB) Time 40 .001 .007 Suspend Time 781034 14.2 52 2989 .054 10.654 Dispatch Wait Time 726169 13.2 51 434 .008 .684 Dispatch Wait Time (QR Mode) 342472 6.2 26 184 .003 .684 Response (-TCWait for Type C) 0 .000 .000 Response (All Selected Tasks) 5128 .093 10.678 QR Dispatch Time 397337 7.2 27 219 .004 .641 MS Dispatch Time 95806 1.7 13 5 .000 .062 RO Dispatch Time 0 .0 0 0 .000 .000 QR CPU Time 61 .001 .007 MS CPU Time 3 .000 .001 RO CPU TIME 0 .000 .000 L8 CPU Time 21 .000 .007 J8 CPU Time 928 .017 3.288 S8 CPU Time 0 .000 .000
Chapter 17. Analyzing overall system performance 365

time and dispatch wait time. However, these figures represent more the figures that we expected for our application tests.
Figure 17-17 shows part of what follows in the Totals report starting from page 3. It shows the resource utilizations statistics. Each data field from the CMF performance record is summarized in Total, Avg/Task and Max/Task. For clock fields, the count and time components are broken down. For the other fields where there is no time component, only the count values are reported.
Figure 17-17 Performance Totals report with CICSEXCL: Page 3
17.3.2 Performance Summary reportSummary reports where clock and count fields are summarized statistically can also be produced with Performance Summary reports. Any field from a CMF performance record can be included in the Performance Summary report so that this allows you to tailor these reports to your more specific reporting requirements. Summary reports allow you also to look at specific transaction or a set of transactions.
V1R3M0 CICS Performance Analyzer Performance Totals __________________________________________________ TOTL0001 Printed at 17:59:58 11/07/2003 Data from 14:49:53 11/05/2003 to 15:04:59 11/05/2003 Page 3 ...... C O U N T S ...... ........... T I M E ........... From Selected Performance Records Total Avg/Task Max/Task Total Avg/Task Max/Task FCWAIT File I/O wait time 0 .0 0 0 .000 .000 RLSWAIT RLS File I/O wait time 37566 .7 13 389 .007 .695 TSWAIT VSAM TS I/O wait time 0 .0 0 0 .000 .000 TSSHWAIT Asynchronous Shared TS wait time 0 .0 0 0 .000 .000 JCWAIT Journal I/O wait time 7276 .1 18 62 .001 1.088 TDWAIT VSAM transient data I/O wait time 0 .0 0 0 .000 .000 IRWAIT MRO link wait time 17540 .3 5 317 .006 1.278 CFDTWAIT CF Data Table access requests wait time 0 .0 0 0 .000 .000 CFDTSYNC CF Data Table syncpoint wait time 0 .0 0 0 .000 .000 RUNTRWAI BTS run Process/Activity wait time 0 .0 0 0 .000 .000 SYNCDLY SYNCPOINT parent request wait time 0 .0 0 0 .000 .000 RMITIME Resource Manager Interface (RMI) elapsed time 63796 1.2 18 38 .001 .205 RMISUSP Resource Manager Interface (RMI) suspend time 0 .0 0 0 .000 .000 JVMITIME JVM initialize elapsed time 47379 .9 3 0 .000 .002 JVMTIME JVM elapsed time 126654 2.3 10 2368 .043 10.674 ..PCLOADTM Program Library wait time 0 .0 0 0 .000 .000 SYNCTIME SYNCPOINT processing time 70749 1.3 2 121 .002 .558 OTSINDWT OTS Indoubt Wait time 0 .0 0 0 .000 .000 EXWAIT Exception Conditions wait time 0 .0 0 0 .000 .000 TCMSGIN1 Messages received count 11067 .2 1 TCCHRIN1 Terminal characters received count 378040 6.9 245 TCMSGOU1 Messages sent count 11067 .2 1 TCCHROU1 Terminal characters sent count 2934543 53.5 1561 TCMSGIN2 Messages received from LU6.1 0 .0 0 TCCHRIN2 LU6.1 characters received count 0 .0 0 TCMSGOU2 Messages sent to LU6.1 0 .0 0 TCCHROU2 LU6.1 characters sent count 0 .0 0 TCALLOC TCTTE ALLOCATE requests 27705 .5 2 TCM62IN2 LU6.2 messages received count 0 .0 0 TCC62IN2 LU6.2 characters received count 0 .0 0 TCM62OU2 LU6.2 messages sent count 0 .0 0 TCC62OU2 LU6.2 characters sent count 0 .0 0 FCADD File ADD requests 20087 .4 9 FCBROWSE File Browse requests 2741 .0 5 FCDELETE File DELETE requests 793 .0 1 FCGET File GET requests 92865 1.7 34 FCPUT File PUT requests 4482 .1 9 FCTOTAL File Control requests 122208 2.2 34..
366 CICS Performance Analyzer

Example 17-1 shows the list of sample Summary Report Forms that are available in your Report Forms data set. You can use these as a starting point for further tailoring. To have the Report form effectively available, you must select it from the pop-up screen that you see after you select Samples in the option bar in the Report Forms screen.
Example 17-1 CICS PA provided Sample Summary Report Forms
ABNDSUM Transaction Abend Summary BTSRQSUM CICS BTS Request Activity COMMWSUM Transaction Comms Wait AnalysisCPUSEXTR CPU Analysis and Extract CPUSUM Transaction CPU Analysis DHSUM CICS Document Handler Analysis ENQSUM CICS ENQueue/Lock Delay Analysis FCSUM File Request Activity FCWTSUM File Wait Analysis FDSPSUM First Dispatch Delay Analysis FEPISUM FEPI Request Activity ICSUM Interval Control Activity IMSDBSUM Transaction DBCTL Usage Analysis IMSRQSUM Transaction DBCTL Req Analysis IMSSUM IMS DBCTL PSB Usage Analysis JCSUM Journaling/Logging Activity JVMSUM Java Virtual Machine Analysis PCSUM Program Request Activity PSTORSUM Program Storage Analysis RMIDBSUM CICS RMI Analysis - DB2 Overview RMIMSSUM CICS RMI Analysis - IMS Overview RMIOVSUM CICS RMI Analysis - Overview RMISUM1 CICS RMI Analysis - Summary (1) RMISUM2 CICS RMI Analysis - Summary (2) RTETRSUM Transaction Routing Analysis (2) SOAPSUM SOAP for CICS Usage - Summary SSTORSUM Shared Storage Analysis TCLDLSUM Tclass Delays by Tranclass Name TCPIPSUM Transactions by TCP/IP Service TCPSUM CICS Support for TCP/IP Analysis TCSUM2 Terminal Control Activity (2) TDSUM Transient Data Activity TRAPLSUM Transactions by Application Tran TRARTSUM Transaction Routing Analysis (3) TRATDSUM Transactions by Applid and TOD TRRTESUM Transaction Routing Analysis (1) TRTCLSUM Transactions by Tranclass Name TRTESUM Transaction Usage by Terminal ID TRTODSUM Transactions by Time-of-Day TRTRASUM Transaction Routing Analysis (4) TSSUM Temporary Storage Activity TSWTSUM Temporary Storage Wait Analysis USTORSUM User (Task) Storage Analysis WEBSUM CICS Web Support Analysis
Chapter 17. Analyzing overall system performance 367

As an example, we start to show a CPU Summary report. To avoid “missing” data, we run the report on the CICSTS22 subset of our CMF performance records. Figure 17-18 shows the contents of the CPUSUM report form.
Figure 17-18 CPUSUM sample Report Form
File Edit Confirm Upgrade Options Help ------------------------------------------------------------------------------ EDIT SUMMARY Report Form - CPUSUM Row 1 of 16 More: > Command ===> Scroll ===> CSR Description . . . Transaction CPU Analysis Version (VRM): 620 Selection Criteria: Performance Field / Name + S Type Fn Description TRAN A Transaction identifier TASKCNT Total Task count RESPONSE AVE Transaction response time RESPONSE MAX Transaction response time DISPATCH TIME AVE Dispatch time CPU TIME AVE CPU time SUSPEND TIME AVE Suspend time QRCPU TIME AVE CICS QR TCB CPU time MSCPU TIME AVE CICS TCBs CPU time ROCPU TIME AVE CICS RO TCB CPU time KY8CPU TIME AVE CICS Key 8 TCB CPU time J8CPU TIME AVE CICS J8 TCB CPU time L8CPU TIME AVE CICS L8 TCB dispatch time S8CPU TIME AVE CICS S8 TCB CPU time
EOR ---------------- End of Report ---------------- EOX ---------------- End of Extract ---------------
368 CICS Performance Analyzer

The form shows that we selected TRAN and sorted the report in ascending order. Figure 17-19 shows the resulting output.
Figure 17-19 Default CPU Analysis Summary report
V1R3M0 CICS Performance Analyzer Performance Summary __________________________________________________ SUMM0001 Printed at 14:44:49 11/08/2003 Data from 14:19:50 11/05/2003 to 15:04:59 11/05/2003 Page 1Transaction CICS TCB CPU Analysis - Summary Avg Max Avg Avg Avg Avg Avg Avg Avg Avg Avg Avg Tran #Tasks Response Response Dispatch User CPU Suspend QR CPU MS CPU RO CPU KY8 CPU J8 CPU L8 CPU S8 CPU Time Time Time Time Time Time Time Time Time Time Time Time CDTS 14 .0043 .0171 .0016 .0013 .0028 .0013 .0000 .0000 .0000 .0000 .0000 .0000 CIRP 3965 .1561 10.6778 .1278 .0611 .0283 .0011 .0000 .0000 .0600 .0600 .0000 .0000 CIRR 15768 .1309 10.6563 .0024 .0012 .1285 .0010 .0002 .0000 .0000 .0000 .0000 .0000 CITS 17 .0028 .0034 .0012 .0010 .0016 .0010 .0000 .0000 .0000 .0000 .0000 .0000 CSMI 1320 .0059 .2249 .0010 .0005 .0049 .0005 .0000 .0000 .0000 .0000 .0000 .0000 CSOL 3 1887.33 1887.47 .6293 .4393 1886.70 .0001 .4392 .0003 .0000 .0000 .0000 .0000 DB2N 174 .0083 .0297 .0041 .0026 .0042 .0008 .0000 .0000 .0018 .0000 .0018 .0000 DB2U 636 .0021 .0290 .0017 .0011 .0004 .0006 .0000 .0000 .0005 .0000 .0005 .0000 JCIM 606 .1689 1.1021 .1423 .0801 .0266 .0009 .0000 .0000 .0791 .0791 .0000 .0000 JCIN 305 .1743 3.0177 .1533 .0731 .0210 .0009 .0000 .0000 .0722 .0722 .0000 .0000 JCI1 303 .1069 .5476 .0765 .0431 .0304 .0010 .0000 .0000 .0421 .0421 .0000 .0000 JCI3 606 .1122 3.0357 .0859 .0414 .0263 .0009 .0000 .0000 .0404 .0404 .0000 .0000 JCI4 305 .1904 2.2279 .1592 .0807 .0312 .0011 .0000 .0000 .0796 .0796 .0000 .0000 JCI5 1212 .1097 2.3669 .0816 .0425 .0281 .0010 .0000 .0000 .0415 .0415 .0000 .0000 JCI6 304 .1666 1.2564 .1379 .0756 .0287 .0010 .0000 .0000 .0746 .0746 .0000 .0000 JCI7 304 .1134 1.9295 .0840 .0441 .0293 .0010 .0000 .0000 .0430 .0430 .0000 .0000 JDBM 608 .1766 1.2794 .1480 .0805 .0286 .0010 .0000 .0000 .0795 .0786 .0009 .0000 JDBN 303 .3321 2.5468 .3084 .1201 .0237 .0009 .0000 .0000 .1192 .1184 .0008 .0000 JDB1 306 .1284 1.9091 .0965 .0484 .0318 .0010 .0000 .0000 .0474 .0428 .0046 .0000 JDB3 609 .1160 2.4298 .0886 .0432 .0274 .0010 .0000 .0000 .0422 .0413 .0009 .0000 JDB4 303 .2013 3.7688 .1701 .0925 .0312 .0010 .0000 .0000 .0915 .0883 .0032 .0000 JDB5 1215 .1266 4.8343 .0965 .0485 .0301 .0010 .0000 .0000 .0475 .0443 .0032 .0000 JDB6 304 .2036 10.4893 .1744 .0841 .0292 .0010 .0000 .0000 .0831 .0797 .0034 .0000 JDB7 304 .1283 .9939 .0951 .0487 .0332 .0010 .0000 .0000 .0478 .0431 .0046 .0000 SQLM 605 .1727 2.1050 .1449 .0787 .0278 .0010 .0000 .0000 .0777 .0768 .0009 .0000 SQLN 303 .3421 3.9273 .3195 .1159 .0226 .0009 .0000 .0000 .1150 .1141 .0009 .0000 SQL1 302 .1295 2.4471 .0990 .0485 .0305 .0010 .0000 .0000 .0475 .0428 .0047 .0000 SQL3 604 .1270 7.1156 .0995 .0474 .0275 .0010 .0000 .0000 .0464 .0455 .0009 .0000 SQL4 303 .1893 2.1465 .1558 .0807 .0335 .0010 .0000 .0000 .0797 .0765 .0032 .0000 SQL5 1209 .1232 2.8840 .0918 .0481 .0314 .0010 .0000 .0000 .0471 .0438 .0033 .0000 SQL6 303 .1811 1.1894 .1500 .0790 .0311 .0010 .0000 .0000 .0780 .0743 .0037 .0000 SQL7 302 .1229 .9066 .0910 .0484 .0319 .0010 .0000 .0000 .0474 .0427 .0047 .0000 ******************************** BOTTOM OF DATA ***********************************************************************************
Chapter 17. Analyzing overall system performance 369
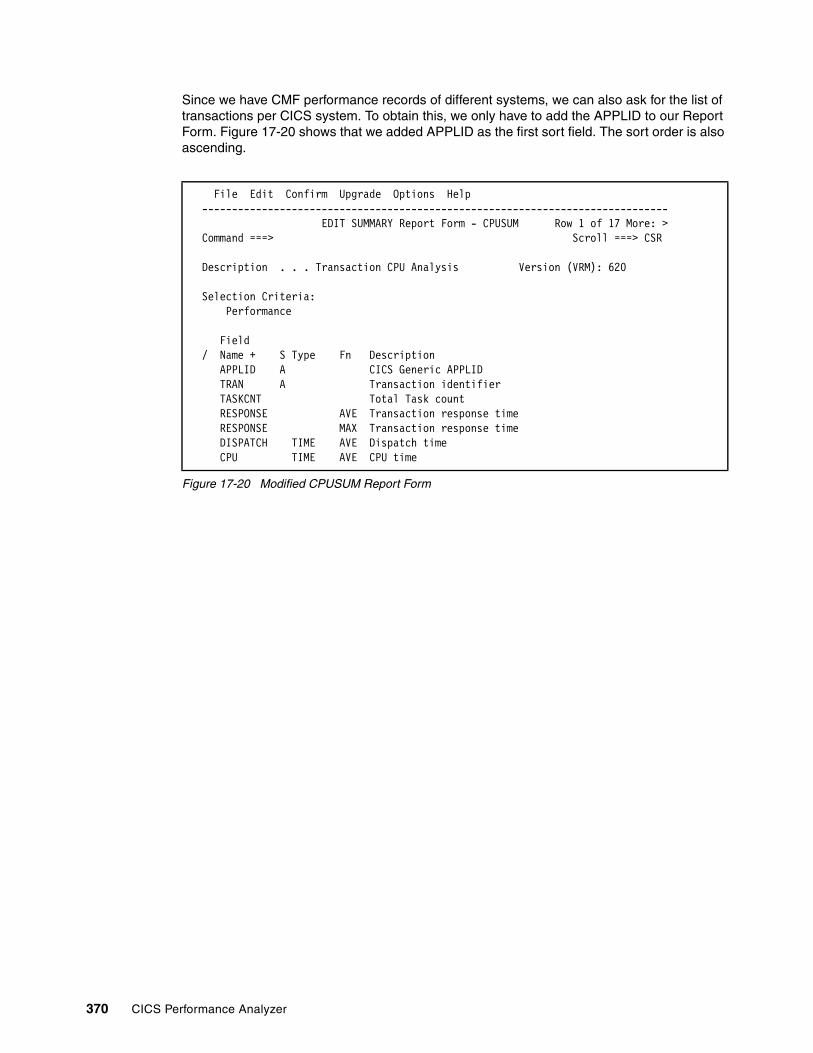
Since we have CMF performance records of different systems, we can also ask for the list of transactions per CICS system. To obtain this, we only have to add the APPLID to our Report Form. Figure 17-20 shows that we added APPLID as the first sort field. The sort order is also ascending.
Figure 17-20 Modified CPUSUM Report Form
File Edit Confirm Upgrade Options Help ------------------------------------------------------------------------------ EDIT SUMMARY Report Form - CPUSUM Row 1 of 17 More: > Command ===> Scroll ===> CSR Description . . . Transaction CPU Analysis Version (VRM): 620 Selection Criteria: Performance Field / Name + S Type Fn Description APPLID A CICS Generic APPLID TRAN A Transaction identifier TASKCNT Total Task count RESPONSE AVE Transaction response time RESPONSE MAX Transaction response time DISPATCH TIME AVE Dispatch time CPU TIME AVE CPU time
370 CICS Performance Analyzer

Figure 17-21 shows the new Summary report. You see that the result shows all transactions executed per APPLID. You receive an additional line that gives the averages per APPLID as well.
Figure 17-21 CPU Summary report with APPLID added as sort field
V1R3M0 CICS Performance Analyzer Performance Summary __________________________________________________ SUMM0001 Printed at 15:01:47 11/08/2003 Data from 14:19:50 11/05/2003 to 15:04:59 11/05/2003 Page 1 Transaction CICS TCB CPU Analysis - Summary Avg Max Avg Avg Avg Avg Avg Avg Avg Avg Avg APPLID Tran #Tasks Response Response Dispatch User CPU Suspend QR CPU MS CPU RO CPU KY8 CPU J8 CPU L8 CPU Time Time Time Time Time Time Time Time Time Time Time SCSCPJA6 CIRP 1806 .1686 10.6778 .1375 .0577 .0311 .0010 .0000 .0000 .0567 .0567 .0000 SCSCPJA6 CSMI 1320 .0059 .2249 .0010 .0005 .0049 .0005 .0000 .0000 .0000 .0000 .0000 SCSCPJA6 JCIM 270 .1845 1.0295 .1535 .0767 .0310 .0009 .0000 .0000 .0757 .0757 .0000 SCSCPJA6 JCIN 149 .2101 3.0177 .1855 .0718 .0245 .0009 .0000 .0000 .0710 .0710 .0000 ..SCSCPJA6 SQL5 582 .1342 2.8840 .0999 .0453 .0343 .0009 .0000 .0000 .0444 .0411 .0033 SCSCPJA6 SQL6 137 .1972 1.1894 .1626 .0754 .0346 .0010 .0000 .0000 .0744 .0708 .0036 SCSCPJA6 SQL7 139 .1373 .9066 .1007 .0459 .0366 .0009 .0000 .0000 .0450 .0403 .0047 ------------------------------------------------------------------------------------------------------------------------------------SCSCPJA6 8626 .1431 10.6778 .1152 .0496 .0279 .0009 .0000 .0000 .0487 .0476 .0011
SCSCPJA7 CDTS 14 .0043 .0171 .0016 .0013 .0028 .0013 .0000 .0000 .0000 .0000 .0000 SCSCPJA7 CIRP 2159 .1456 10.2244 .1197 .0639 .0259 .0011 .0000 .0000 .0629 .0629 .0000 SCSCPJA7 CITS 17 .0028 .0034 .0012 .0010 .0016 .0010 .0000 .0000 .0000 .0000 .0000 ..SCSCPJA7 SQL5 627 .1130 1.2724 .0842 .0506 .0288 .0010 .0000 .0000 .0496 .0463 .0033 SCSCPJA7 SQL6 166 .1678 1.0332 .1396 .0819 .0282 .0010 .0000 .0000 .0809 .0772 .0037 SCSCPJA7 SQL7 163 .1107 .5799 .0828 .0504 .0279 .0010 .0000 .0000 .0494 .0447 .0047 ------------------------------------------------------------------------------------------------------------------------------------SCSCPJA7 9329 .3291 1887.47 .1032 .0577 .2259 .0010 .0000 .0000 .0567 .0555 .0012
SCSCPLA1 CIRR 8815 .1300 10.6563 .0024 .0012 .1276 .0010 .0002 .0000 .0000 .0000 .0000 SCSCPLA1 CSOL 1 1887.18 1887.18 1.0098 .7384 1886.17 .0000 .7384 .0000 .0000 .0000 .0000 ------------------------------------------------------------------------------------------------------------------------------------SCSCPLA1 8816 .3441 1887.18 .0025 .0013 .3416 .0010 .0003 .0000 .0000 .0000 .0000
SCSCPLA2 CIRR 6953 .1319 10.3505 .0024 .0012 .1296 .0010 .0002 .0000 .0000 .0000 .0000 SCSCPLA2 CSOL 1 1887.33 1887.33 .8070 .5648 1886.53 .0000 .5648 .0000 .0000 .0000 .0000 ------------------------------------------------------------------------------------------------------------------------------------SCSCPLA2 6954 .4033 1887.33 .0025 .0013 .4008 .0010 .0003 .0000 .0000 .0000 .0000 ******************************** BOTTOM OF DATA ***********************************************************************************
Chapter 17. Analyzing overall system performance 371

On the Performance Summary Report screen, it is also possible to specify an interval time. To use this time interval option, you need to specify the STOP or START field as a sort field. In this case, CICS PA accumulates the data for each interval in the report period and writes a report line for each. Figure 17-22 shows that we set the Time Interval option to 7:30 minutes to have our originally measured interval divided into two separate intervals. You can also see that the Performance selection criteria is active. To eliminate the influence of long running CICS transactions, we preferred to use the CICSEXCL Object List as well.
Figure 17-22 Performance Summary Report: Time Interval selection
File Systems Options Help ------------------------------------------------------------------------------ CROSS22 - Performance Summary Report Command ===> System Selection: Report Output: APPLID . . + DDname . . . . . . . . . SUMM0001 Image . . SC66 + Print Lines per Page . . (1-255) Group . . + Report Format: Form . . . CPUSUM + Title . . Processing Options: Reporting Options: Time Interval . . . 00:07:30 (hh:mm:ss) Exclude Totals Selection Criteria: Performance *
372 CICS Performance Analyzer
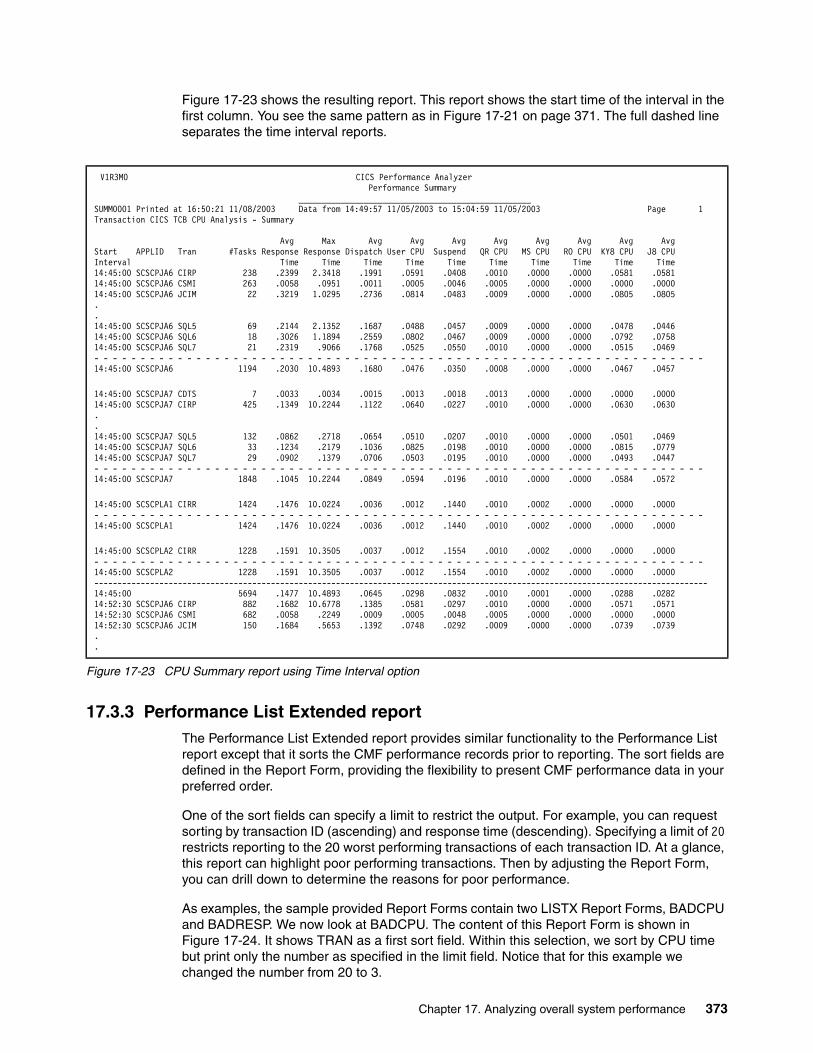
Figure 17-23 shows the resulting report. This report shows the start time of the interval in the first column. You see the same pattern as in Figure 17-21 on page 371. The full dashed line separates the time interval reports.
Figure 17-23 CPU Summary report using Time Interval option
17.3.3 Performance List Extended reportThe Performance List Extended report provides similar functionality to the Performance List report except that it sorts the CMF performance records prior to reporting. The sort fields are defined in the Report Form, providing the flexibility to present CMF performance data in your preferred order.
One of the sort fields can specify a limit to restrict the output. For example, you can request sorting by transaction ID (ascending) and response time (descending). Specifying a limit of 20 restricts reporting to the 20 worst performing transactions of each transaction ID. At a glance, this report can highlight poor performing transactions. Then by adjusting the Report Form, you can drill down to determine the reasons for poor performance.
As examples, the sample provided Report Forms contain two LISTX Report Forms, BADCPU and BADRESP. We now look at BADCPU. The content of this Report Form is shown in Figure 17-24. It shows TRAN as a first sort field. Within this selection, we sort by CPU time but print only the number as specified in the limit field. Notice that for this example we changed the number from 20 to 3.
V1R3M0 CICS Performance Analyzer Performance Summary __________________________________________________ SUMM0001 Printed at 16:50:21 11/08/2003 Data from 14:49:57 11/05/2003 to 15:04:59 11/05/2003 Page 1 Transaction CICS TCB CPU Analysis - Summary Avg Max Avg Avg Avg Avg Avg Avg Avg Avg Start APPLID Tran #Tasks Response Response Dispatch User CPU Suspend QR CPU MS CPU RO CPU KY8 CPU J8 CPU Interval Time Time Time Time Time Time Time Time Time Time 14:45:00 SCSCPJA6 CIRP 238 .2399 2.3418 .1991 .0591 .0408 .0010 .0000 .0000 .0581 .0581 14:45:00 SCSCPJA6 CSMI 263 .0058 .0951 .0011 .0005 .0046 .0005 .0000 .0000 .0000 .0000 14:45:00 SCSCPJA6 JCIM 22 .3219 1.0295 .2736 .0814 .0483 .0009 .0000 .0000 .0805 .0805 ..14:45:00 SCSCPJA6 SQL5 69 .2144 2.1352 .1687 .0488 .0457 .0009 .0000 .0000 .0478 .0446 14:45:00 SCSCPJA6 SQL6 18 .3026 1.1894 .2559 .0802 .0467 .0009 .0000 .0000 .0792 .0758 14:45:00 SCSCPJA6 SQL7 21 .2319 .9066 .1768 .0525 .0550 .0010 .0000 .0000 .0515 .0469 - - - - - - - - - - - - - - - - - - - - - - - - - - - - - - - - - - - - - - - - - - - - - - - - - - - - - - - - - - - - - - - - - - 14:45:00 SCSCPJA6 1194 .2030 10.4893 .1680 .0476 .0350 .0008 .0000 .0000 .0467 .0457
14:45:00 SCSCPJA7 CDTS 7 .0033 .0034 .0015 .0013 .0018 .0013 .0000 .0000 .0000 .0000 14:45:00 SCSCPJA7 CIRP 425 .1349 10.2244 .1122 .0640 .0227 .0010 .0000 .0000 .0630 .0630 ..14:45:00 SCSCPJA7 SQL5 132 .0862 .2718 .0654 .0510 .0207 .0010 .0000 .0000 .0501 .0469 14:45:00 SCSCPJA7 SQL6 33 .1234 .2179 .1036 .0825 .0198 .0010 .0000 .0000 .0815 .0779 14:45:00 SCSCPJA7 SQL7 29 .0902 .1379 .0706 .0503 .0195 .0010 .0000 .0000 .0493 .0447 - - - - - - - - - - - - - - - - - - - - - - - - - - - - - - - - - - - - - - - - - - - - - - - - - - - - - - - - - - - - - - - - - - 14:45:00 SCSCPJA7 1848 .1045 10.2244 .0849 .0594 .0196 .0010 .0000 .0000 .0584 .0572
14:45:00 SCSCPLA1 CIRR 1424 .1476 10.0224 .0036 .0012 .1440 .0010 .0002 .0000 .0000 .0000 - - - - - - - - - - - - - - - - - - - - - - - - - - - - - - - - - - - - - - - - - - - - - - - - - - - - - - - - - - - - - - - - - - 14:45:00 SCSCPLA1 1424 .1476 10.0224 .0036 .0012 .1440 .0010 .0002 .0000 .0000 .0000
14:45:00 SCSCPLA2 CIRR 1228 .1591 10.3505 .0037 .0012 .1554 .0010 .0002 .0000 .0000 .0000 - - - - - - - - - - - - - - - - - - - - - - - - - - - - - - - - - - - - - - - - - - - - - - - - - - - - - - - - - - - - - - - - - - 14:45:00 SCSCPLA2 1228 .1591 10.3505 .0037 .0012 .1554 .0010 .0002 .0000 .0000 .0000 ------------------------------------------------------------------------------------------------------------------------------------14:45:00 5694 .1477 10.4893 .0645 .0298 .0832 .0010 .0001 .0000 .0288 .0282 14:52:30 SCSCPJA6 CIRP 882 .1682 10.6778 .1385 .0581 .0297 .0010 .0000 .0000 .0571 .0571 14:52:30 SCSCPJA6 CSMI 682 .0058 .2249 .0009 .0005 .0048 .0005 .0000 .0000 .0000 .0000 14:52:30 SCSCPJA6 JCIM 150 .1684 .5653 .1392 .0748 .0292 .0009 .0000 .0000 .0739 .0739 ..
Chapter 17. Analyzing overall system performance 373

Figure 17-24 Default sample BADCPU LISTX Report Form
Figure 17-25 shows the report produced with this BADCPU LISTX Report Form.
Figure 17-25 Top three worst CPU times per transaction
The output shows the worst CPU consumers per transaction. Since we saw more than two seconds for a CIRP transaction, we were wondering what would be the worst transactions within the whole system. To produce this information, we edited the BADCPU Report Form and removed the A for the TRAN field so that it is no longer a sort field, we changed the limit
File Edit Confirm Upgrade Options Help ------------------------------------------------------------------------------ EDIT LISTX Report Form - BADCPU Row 1 of 16 More: > Command ===> Scroll ===> CSR Description . . . Top 3 Worst CPU Times Version (VRM): 620 Selection Criteria: Performance Field / Name + S Type Limit Description TRAN A Transaction identifier CPU D TIME 3 CPU time USERID * User ID TASKNO Transaction identification number STOP * TIMET Task stop time RESPONSE * Transaction response time DISPATCH * TIME Dispatch time DISPATCH * COUNT Dispatch time CPU * TIME CPU time SUSPEND * TIME Suspend time SUSPEND * COUNT Suspend time DISPWAIT * TIME Redispatch wait time DISPWAIT * COUNT Redispatch wait time IRWAIT TIME MRO link wait time EOR ---------------- End of Report -------------- EOX ---------------- End of Extract -------------
V1R3M0 CICS Performance Analyzer Performance List Extended __________________________________________________ LSTX0001 Printed at 17:48:55 11/08/2003 Data from 14:19:50 11/05/2003 to 15:04:59 11/05/2003 Page 1 Top 3 Worst CPU Times Tran User CPU Userid TaskNo Stop Response Dispatch Dispatch User CPU Suspend Suspend DispWait DispWait IR Wait Time Time Time Time Count Time Time Count Time Count Time CDTS .0015 CICSUSER 10706 14:56:30.349 .0171 .0020 3 .0015 .0151 3 .0006 2 .0000 CDTS .0014 CICSUSER 13656 15:01:25.989 .0042 .0016 3 .0014 .0026 3 .0000 2 .0000 CDTS .0014 CICSUSER 7370 14:51:19.251 .0033 .0016 3 .0014 .0017 3 .0000 2 .0000 CIRP 2.2373 CICSUSER 9148 14:53:58.324 3.0009 2.9728 29 2.2373 .0282 29 .0032 28 .0037 CIRP .6662 CICSUSER 9230 14:54:03.007 .8143 .7646 25 .6662 .0497 25 .0003 24 .0000 CIRP .6548 CICSUSER 6342 14:50:03.883 1.0350 1.0238 25 .6548 .0113 25 .0028 24 .0000 CIRR .0027 CICSUSER 40192 14:50:23.972 1.0798 .0274 24 .0027 1.0524 24 .1576 23 .0000 CIRR .0026 CICSUSER 42853 14:55:00.721 .5283 .0120 23 .0026 .5162 23 .3014 22 .0000 CIRR .0026 CICSUSER 42852 14:55:00.969 .9883 .0390 24 .0026 .9492 24 .6158 23 .0000 CITS .0012 CICSUSER 6561 14:50:19.576 .0031 .0014 3 .0012 .0016 3 .0000 2 .0000 CITS .0012 CICSUSER 6567 14:50:19.815 .0031 .0016 3 .0012 .0016 3 .0000 2 .0000 CITS .0011 CICSUSER 8814 14:53:29.901 .0032 .0013 3 .0011 .0019 3 .0002 2 .0000 ..
374 CICS Performance Analyzer

value from 3 to 10 in the Limit field of the CPU field and changed the USERID field to APPLID. Figure 17-26 shows these modifications.
Figure 17-26 Modified BADCPU Report Form
Figure 17-27 shows the result of running with this Report Form.
Figure 17-27 Top 10 of the worst CPU consumers
17.3.4 Cross-System Work reportAnother way to look at the total system is to know where transactions are entering the system, where the resulting application programs run, and which type of requests are executed and where. The Cross-System Work report can be of help in this case because it correlates CMF performance records by network UOW ID. Since the Cross-System Work report only produces lists of transaction and no summaries, we recommend that you run this report for a rather short time period of data. You can use this report to understand a transaction flow, probably in combination with the Transaction Group report.
When you print a Cross-System Work report, CICS PA allows you to choose the kind of UOWs to see. We selected to have only those UOWs printed that have more than one record. The way to do so is to set Processing Options to 1 as shown in Figure 17-28.
File Edit Confirm Upgrade Options Help ------------------------------------------------------------------------------ EDIT LISTX Report Form - BADCPU Row 1 of 16 More: > Command ===> Scroll ===> CSR Description . . . Top 10 Worst CPU Times Version (VRM): 620 Selection Criteria: Performance Field / Name + S Type Limit Description TRAN * Transaction identifier CPU D TIME 10 CPU time APPLID * CICS Generic APPLID TASKNO Transaction identification number STOP * TIMET Task stop time RESPONSE * Transaction response time
V1R3M0 CICS Performance Analyzer Performance List Extended __________________________________________________ LSTX0001 Printed at 17:55:19 11/08/2003 Data from 14:19:50 11/05/2003 to 15:04:59 11/05/2003 Page 1 Top 10 Worst CPU Times Tran User CPU APPLID TaskNo Stop Response Dispatch Dispatch User CPU Suspend Suspend DispWait DispWait IR Wait Time Time Time Time Count Time Time Count Time Count Time JDB5 3.2922 SCSCPJA6 9452 15:01:45.653 4.8343 4.8172 43 3.2922 .0171 43 .0023 42 .0000 JDB4 2.8532 SCSCPJA7 9952 14:55:13.922 3.7688 3.7538 49 2.8532 .0149 49 .0005 48 .0000 SQL3 2.3613 SCSCPJA7 13497 15:01:08.403 7.1156 7.0732 31 2.3613 .0424 31 .0225 30 .0000 CIRP 2.2373 SCSCPJA7 9148 14:53:58.324 3.0009 2.9728 29 2.2373 .0282 29 .0032 28 .0037 JDB6 1.0107 SCSCPJA6 2892 14:50:08.372 10.4893 10.3844 43 1.0107 .1050 43 .0941 42 .0000 SQLN .9781 SCSCPJA6 3111 14:50:37.149 3.9273 3.9128 28 .9781 .0144 28 .0050 27 .0000 JDBN .9511 SCSCPJA6 8729 15:00:37.624 2.5468 2.5126 29 .9511 .0342 29 .0193 28 .0000 JCI5 .9131 SCSCPJA6 3464 14:51:24.014 2.3669 2.3597 27 .9131 .0072 27 .0013 26 .0000 JDBN .9096 SCSCPJA6 10123 15:02:43.445 1.6267 1.6077 29 .9096 .0190 29 .0012 28 .0000 ******************************** BOTTOM OF DATA ***********************************************************************************
Chapter 17. Analyzing overall system performance 375
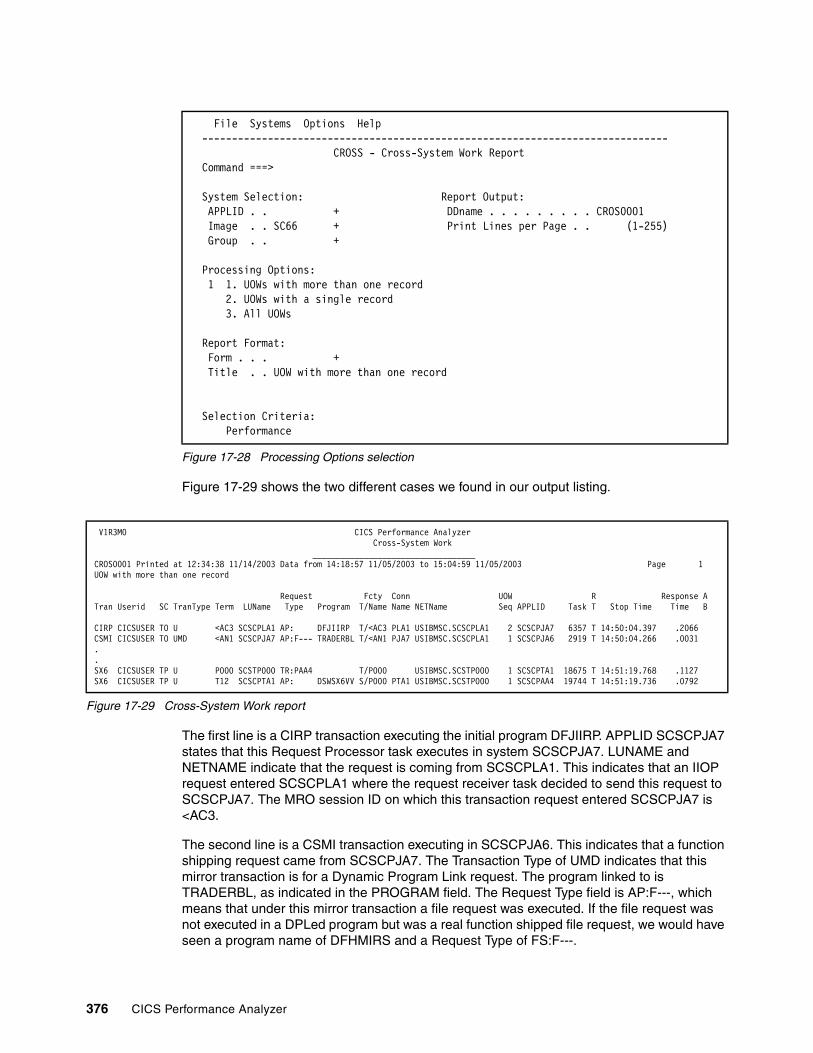
Figure 17-28 Processing Options selection
Figure 17-29 shows the two different cases we found in our output listing.
Figure 17-29 Cross-System Work report
The first line is a CIRP transaction executing the initial program DFJIIRP. APPLID SCSCPJA7 states that this Request Processor task executes in system SCSCPJA7. LUNAME and NETNAME indicate that the request is coming from SCSCPLA1. This indicates that an IIOP request entered SCSCPLA1 where the request receiver task decided to send this request to SCSCPJA7. The MRO session ID on which this transaction request entered SCSCPJA7 is <AC3.
The second line is a CSMI transaction executing in SCSCPJA6. This indicates that a function shipping request came from SCSCPJA7. The Transaction Type of UMD indicates that this mirror transaction is for a Dynamic Program Link request. The program linked to is TRADERBL, as indicated in the PROGRAM field. The Request Type field is AP:F---, which means that under this mirror transaction a file request was executed. If the file request was not executed in a DPLed program but was a real function shipped file request, we would have seen a program name of DFHMIRS and a Request Type of FS:F---.
File Systems Options Help ------------------------------------------------------------------------------ CROSS - Cross-System Work Report Command ===> System Selection: Report Output: APPLID . . + DDname . . . . . . . . . CROS0001 Image . . SC66 + Print Lines per Page . . (1-255) Group . . + Processing Options: 1 1. UOWs with more than one record 2. UOWs with a single record 3. All UOWs Report Format: Form . . . + Title . . UOW with more than one record Selection Criteria: Performance
V1R3M0 CICS Performance Analyzer Cross-System Work ___________________________________ CROS0001 Printed at 12:34:38 11/14/2003 Data from 14:18:57 11/05/2003 to 15:04:59 11/05/2003 Page 1 UOW with more than one record Request Fcty Conn UOW R Response ATran Userid SC TranType Term LUName Type Program T/Name Name NETName Seq APPLID Task T Stop Time Time B CIRP CICSUSER TO U <AC3 SCSCPLA1 AP: DFJIIRP T/<AC3 PLA1 USIBMSC.SCSCPLA1 2 SCSCPJA7 6357 T 14:50:04.397 .2066 CSMI CICSUSER TO UMD <AN1 SCSCPJA7 AP:F--- TRADERBL T/<AN1 PJA7 USIBMSC.SCSCPLA1 1 SCSCPJA6 2919 T 14:50:04.266 .0031 . . SX6 CICSUSER TP U P000 SCSTP000 TR:PAA4 T/P000 USIBMSC.SCSTP000 1 SCSCPTA1 18675 T 14:51:19.768 .1127 SX6 CICSUSER TP U T12 SCSCPTA1 AP: DSWSX6VV S/P000 PTA1 USIBMSC.SCSTP000 1 SCSCPAA4 19744 T 14:51:19.736 .0792
376 CICS Performance Analyzer

The second group shows a transaction SX6 that is initiated in system SCSCPTA1 from terminal P000. There is no program name provided because the transaction does not execute in this CICS system. Indeed, the Request Type field indicates that this TOR performed a transaction routing towards system ID PAA4. The second line indicates that the SX6 transaction executes with the same name in SCSCPAA4. The name of the initial program executed is DSWSX6VV.
You can tailor this Cross-System Work report to your needs by creating a LIST or LISTX Report Form. For this report, there is no difference between a LIST or LISTX Report Form as the sort sequences from a LISTX Report Set are ignored in this case.
Figure 17-30 shows the CROSSDET LISTX Report Form that we created to have other output in the Cross-System Work report.
Figure 17-30 List Extended Report Form
To have the report with the information as requested in the CROSSDET Report Form, we added the report name CROSSDET to the Form field in the Cross-System Work Reports panel and re-ran the report. Figure 17-31 shows that transactions belonging to the same network UOW ID are grouped the same way as before, and only the information printed in the individual records is different.
File Edit Confirm Upgrade Options Help ------------------------------------------------------------------------------ EDIT LISTX Report Form - CROSSDET Row 1 of 267 More: > Command ===> Scroll ===> CSR Description . . . List Extended Report Form Version (VRM): 620 Selection Criteria: Performance Field / Name + S Type Limit Description START A TIMET Task start time APPLID * CICS Generic APPLID TRAN * Transaction identifier PROGRAM * Program name TASKNO * Transaction identification number RSYSID * Remote System ID TERM * Terminal ID STYPE * Transaction start type TRANTYPE Transaction type ORIGIN * Transaction origin type NETNAME * Originating System VTAM network name UOWID Network UOW ID UOWSEQ Network UOW Sequence Number EOR ---------------- End of Report --------------
Chapter 17. Analyzing overall system performance 377

Figure 17-31 Cross-System Work Extended report
17.3.5 MVS Workload Activity reportThere are two options for the MVS Workload Activity report. You can request a list report which is very similar to the Cross-System Work report because it also uses the network UOW ID to correlate transactions that execute in one single CICS region or multiple CICS regions through transaction routing, function shipping, or distributed transaction routing. Otherwise, you can ask for a Workload Activity Summary report that summarizes response time by WLM service and report classes which can be used to set or verify the goals that were defined to the WLM.
To show reporting on different service classes, we defined one of our AORs, SCSCPJA7, to execute in a different service class (CICSWORK) than all the other regions (CICSDFLT). We also changed the CICSPlex SM workload specification to use the GOAL mode rather than the default QUEUE mode that we used for all other scenarios.
Figure 17-32 shows the Workload Activity Report setup screen.
Figure 17-32 Workload Activity Report setup screen
The List report is selected by entering a slash character next to the List option. Figure 17-33 shows the Workload Manager Activity List report.
V1R3M0 CICS Performance Analyzer Cross-System Work Extended __________________________________________________ CROS0001 Printed at 6:30:41 11/18/2003 Data from 14:18:57 11/05/2003 to 15:04:59 11/05/2003 Page 1UOW with more than one record Start APPLID Tran Program TaskNo RSID Term SC TranType Origin NETName Network UOW Time UOW ID SeqNo 14:50:04.190 SCSCPJA7 CIRP DFJIIRP 6357 <AC3 TO U MRO USIBMSC.SCSCPLA1 7C741189BFA2 2 14:50:04.263 SCSCPJA6 CSMI TRADERBL 2919 <AN1 TO UMD MRO USIBMSC.SCSCPLA1 7C741189BFA2 1 . . 14:51:19.655 SCSCPTA1 SX6 ######## 18675 PAA4 P000 TP U TERM USIBMSC.SCSTP000 7C745982088F 1 14:51:19.656 SCSCPAA4 SX6 DSWSX6VV 19744 T12 TP U MRO USIBMSC.SCSTP000 7C745982088F 1
File Systems Options Help ------------------------------------------------------------------------------ CROSS - Workload Activity Report Command ===> System Selection: Report Output: APPLID . . + DDname . . . . . . . . . WKLD0001 Image . . SC66 + Print Lines per Page . . (1-255) Group . . + Reports Required: Processing Options: / List Peak Percentile . . . 90 (50-100) Summary Include EXE Y tasks Report Format: Title . . Selection Criteria: Performance
378 CICS Performance Analyzer

Figure 17-33 Workload Manager Activity List report
The MVS Workload Manager divides the life span of a transaction into two phases: a begin-to-end phase and an execution phase. Applied to the CICS environment, this means that the phase where the TOR receives a transaction and ends it is called the begin-to-end phase. The phase where the transaction moves into an AOR, FOR or elsewhere and is processed is called the execution phase. For a more detailed explanation about Workload Manager state information, refer to OS/390 V2R10.0 MVS Workload Management Services, GC28-1773.
The first two lines of the report show CSOL transactions. The TranType column indicates that these are system transactions. This first CSOL transaction is running in CICS system with APPLID SCSCPLA1. Address space SCSCPLA1 has WLM service class CICSDFLT. The second CSOL transaction is running in SCSCPJA7. This address space has service class CICSWORK. Only SCSCPJA7 has service class CICSWORK. The whole installation has only one report class, WASC. As explained in 17.3.1, “Performance Totals report” on page 362, CSOL is running permanently but about every 30 minutes, a CMF performance record is written. This explains the D in the RT field. This is a record output written by a user event monitoring point DELIVER request. The P column displays the phase information.
For the CSOL transactions, we see BTE, standing for Begin-To-End, indicating that this part of the CSOL transaction execution started and ended in this CICS region without going to another CICS region. The completion field is always blank for BTE phase transactions.
The next line shows a CIRR transaction. The U in the TranType field indicates that this is a user transaction. CIRR is an IIOP request receiver task that starts a request processor task but is not related to it. As request receiver tasks and request processor tasks have different network UOW IDs, they are not grouped together like function shipped mirror tasks or transaction routed tasks. A request receiver is considered to run on its own and thus it is shown as a BTE phase task. The record type is T, indicating that the CMF performance record is written at task termination.
The next transaction in the list is a JDB6 transaction. This transaction is running as a request processor task because it is started by an IIOP request receiver task. For the same reason as for the CIRR transaction, a request processor task appears as a single record. This transaction executes an SQL request that is executed by DB2. This means that only a part of the execution took place in SCSCPJA6. The other part took place in DB2 but we do not have
V1R3M0 CICS Performance Analyzer Workload Manager Activity List __________________________________________________ WKLD0001 Printed at 12:21:49 11/18/2003 Data from 14:18:57 11/05/2003 to 15:04:59 11/05/2003 Page 1 Request Fcty Conn Service Report R Response ATran Userid SC TranType Term LUName Type Program T/Name Name Class Class APPLID Task T P C Stop Time Time B CSOL CICSUSER U S AP: DFHSOL CICSDFLT WASC SCSCPLA1 3 D BTE 14:51:17.56 1887.18 . . CSOL CICSUSER U S AP: DFHSOL CICSWORK WASC SCSCPJA7 3 D BTE 14:54:01.39 1887.47 . . CIRR CICSUSER U U AP: DFHIIRRS CICSDFLT WASC SCSCPLA1 39983 T BTE 14:50:07.89 JDB6 CICSUSER TO U <AC1 SCSCPLA1 AP: DFJIIRP T/<AC1 PLA1 SCSCPJA6 2892 T EXE N 14:50:08.37 10.4893 . . CIRP CICSUSER TO U <AC3 SCSCPLA1 AP: DFJIIRP T/<AC3 PLA1 SCSCPJA7 6357 T EXE N 14:50:04.39 .2066 CSMI CICSUSER TO UMD <AN1 SCSCPJA7 AP:F--- TRADERBL T/<AN1 PJA7 SCSCPJA6 2919 T EXE N 14:50:04.26 .0031. . SX6 CICSUSER TP U P000 SCSTP000 TR:PAA4 T/P000 CICSDFLT WASC SCSCPTA1 18675 T BTE 14:51:19.76 .1127SX6 CICSUSER TP U T12 SCSCPTA1 AP: DSWSX6VV S/P000 PTA1 SCSCPAA4 19744 T EXE Y 14:51:19.73 .0792. . DB2U CICSUSER TO U P000 SCSTP000 TR:PJA7 T/P000 CICSDFLT WASC SCSCPTA1 18920 T BTE 14:52:13.45 DB2U CICSUSER TO U <AY1 SCSCPTA1 AP: PROGDB2U S/P000 PTA1 SCSCPJA7 7918 T EXE Y 14:52:13.45
Chapter 17. Analyzing overall system performance 379

SMF records from the DB2 region. Because only a part of the execution took place in this region, we see EXE N in the combined Phase and Completion fields.
The following part of the report corresponds to the transaction pairs described in 17.3.4, “Cross-System Work report” on page 375. The first transaction is again a request processor task. However, as we saw before, this task does a Dynamic Program Link to SCSCPJA6 where it performs a file request. Here also, because only a part of the execution took place in each region, we see them flagged as EXE N.
Next two records describe the behavior of transaction SX6. This transaction is attached in TOR SCSCPTA1 but is routed to AOR SCSCPAA4. The transaction starts and terminates in the TOR. That is why this task is flagged as a BTE phase task. The execution phase is done completely in the AOR. This is reflected by the EXE Y.
For tasks with phase EXE, the service and report classes are not provided in the List report. However, when CICS starts an EXE phase task on behalf of an originating task, a WLM token is passed with it to identify the service class. The EXE phase tasks always has the same service class as the originating task. This explains why in this last case, the EXE Y task DB2U that runs on SCSCPJA7, have a service class of CICSDFLT, and not CICSWORK. You can verify this in the WLM Summary report shown in Figure 17-34.
Next to the Workload Activity List report, you can also ask for a Workload Summary report which summarizes response times by WLM service and report classes. The report can be run for BTE phase transactions only but you can also ask to include the EXE Y transactions in the report. The selection of the Summary report and the inclusion of the EXE Y tasks, is done on the Workload Activity Report panel under the heading Reports Required. You can see this in Figure 17-32 on page 378.
Figure 17-34 shows the Workload Manager Activity Summary reports arranged by Service Class and by Report Class.
Figure 17-34 WLM Activity Summary report
V1R3M0 CICS Performance Analyzer Workload Manager Activity Summary by Service Class __________________________________________________ WKLD0001 Printed at 16:41:47 11/18/2003 Data from 14:18:57 11/05/2003 to 15:04:59 11/05/2003 Page 1 Service -------------- Response Time -------------- Class APPLID Phase #Tasks Average Std Dev 90% Peak Maximum CICSDFLT SCSCPAA1 BTE 51 .0377 .1073 .1753 .5600 SCSCPAA4 BTE 17 111.043 457.767 697.900 1887.44 SCSCPLA1 BTE 8816 .3441 20.0989 26.1108 1887.18 SCSCPLA2 BTE 6954 .4033 22.6318 29.4172 1887.33 SCSCPTA1 BTE 6624 .0356 .0792 .1371 1.2963 SCSCPTA2 BTE 4680 .0412 .0891 .1555 1.1289 CICSDFLT *Total* BTE 27142 .3005 19.8410 25.7367 1887.44 CICSWORK SCSCPJA7 BTE 32 58.9871 333.661 486.741 1887.47
Workload Manager Activity Summary by Report Class Report -------------- Response Time -------------- Class APPLID Phase #Tasks Average Std Dev 90% Peak Maximum WASC SCSCPAA1 BTE 51 .0377 .1073 .1753 .5600 SCSCPAA4 BTE 17 111.043 457.767 697.900 1887.44 SCSCPJA7 BTE 32 58.9871 333.661 486.741 1887.47 SCSCPLA1 BTE 8816 .3441 20.0989 26.1108 1887.18 SCSCPLA2 BTE 6954 .4033 22.6318 29.4172 1887.33 SCSCPTA1 BTE 6624 .0356 .0792 .1371 1.2963 SCSCPTA2 BTE 4680 .0412 .0891 .1555 1.1289
380 CICS Performance Analyzer

As requested, only BTE phase transactions are considered in this report. We see that service class CICSDFLT covers all regions except SCSCPJA7 which runs in service class CICSWORK.
Since there is only one report class, SCSCPJA7 is grouped with the other regions. In this report, again we see some maximum response times of 1887 seconds. As explained in 17.3.1, “Performance Totals report” on page 362, this is because of the presence of the CSOL transaction. Its long response time has a negative influence on the other values of average, standard deviation and the 90% peak value.
Figure 17-35 shows the Workload Manager Activity Summary report produced with the same SMF input records, but here with the transaction group CICSEXCL specified for selection criteria to exclude all CICS long running transactions. We also chose to include the EXE Y phase transactions.
Figure 17-35 WLM Activity Summary report with CICS system tasks excluded
We see that the report includes now also the EXE Y phase transactions. The values of the number of EXE Y phase transactions is one less for SCSCPAA4, SCSCPLA1, SCSCPLA2 and SCSCPJA7 compared to the previous report. These are the CSOL transactions that are not counted now. We now have a better distribution in the different values for the response times.
17.3.6 Using DB2We followed exactly the instructions in 19.4.5, “Export HDB data sets to DB2” on page 441, to load our system data into a DB2 table that we called ITSO.CICSPATB.
V1R3M0 CICS Performance Analyzer Workload Manager Activity Summary by Service Class __________________________________________________ WKLD0001 Printed at 16:47:26 11/18/2003 Data from 14:49:53 11/05/2003 to 15:04:59 11/05/2003 Page 1 Service -------------- Response Time -------------- Class APPLID Phase #Tasks Average Std Dev 90% Peak Maximum CICSDFLT SCSCPAA1 BTE 51 .0377 .1073 .1753 .5600 SCSCPAA1 EXE 1533 .0316 .0781 .1316 1.1133 SCSCPAA4 BTE 16 .0186 .0271 .0534 .1149 SCSCPAA4 EXE 8239 .0204 .0569 .0934 1.2754 SCSCPJA7 EXE 810 .0035 .0043 .0090 .0297 SCSCPLA1 BTE 8815 .1300 .2044 .3921 10.6563 SCSCPLA2 BTE 6953 .1319 .1954 .3824 10.3505 SCSCPTA1 BTE 6624 .0356 .0792 .1371 1.2963 SCSCPTA2 BTE 4680 .0412 .0891 .1555 1.1289 CICSDFLT *Total* BTE 27139 .0919 .1685 .3079 10.6563 *Total* EXE 10582 .0207 .0587 .0960 1.2754 CICSWORK SCSCPJA7 BTE 31 .0035 .0026 .0068 .0171
Workload Manager Activity Summary by Report Class
Report -------------- Response Time -------------- Class APPLID Phase #Tasks Average Std Dev 90% Peak Maximum WASC SCSCPAA1 BTE 51 .0377 .1073 .1753 .5600 SCSCPAA1 EXE 1533 .0316 .0781 .1316 1.1133 SCSCPAA4 BTE 16 .0186 .0271 .0534 .1149 SCSCPAA4 EXE 8239 .0204 .0569 .0934 1.2754 SCSCPJA7 BTE 31 .0035 .0026 .0068 .0171 SCSCPJA7 EXE 810 .0035 .0043 .0090 .0297 SCSCPLA1 BTE 8815 .1300 .2044 .3921 10.6563 SCSCPLA2 BTE 6953 .1319 .1954 .3824 10.3505 SCSCPTA1 BTE 6624 .0356 .0792 .1371 1.2963 SCSCPTA2 BTE 4680 .0412 .0891 .1555 1.1289
Chapter 17. Analyzing overall system performance 381

In 17.3.3, “Performance List Extended report” on page 373, we calculated the top 10 of the worst CPU consumers. We used CICS PA and the provided sample LISTX Report Form, BADCPU. Using DB2, we show how to produce a report that shows the worst storage consumers.
To do so, we add the fields SC31CHWM (ECDSA) and SC31UHWM (EUDSA) and sort on this sum that we called TOTAL31, as shown in Example 17-2. We also calculate the sum of SC24CHWM (CDSA) and the SC24UHWM (UDSA). Next to that, we show the individual fields that were used in this calculation.
Example 17-2 Worst storage consumers query
SELECT TRAN, APPLID, TASKNO, (SC31CHWM + SC31UHWM) AS TOTAL31, (SC24CHWM + SC24UHWM) AS TOTAL24, SC31CHWM, SC31UHWM, SC24CHWM, SC24UHWM, SC31GSHR, SC24GSHR FROM ITSO.CICSPATB A WHERE 10 >= (SELECT COUNT(*) FROM ITSO.CICSPATB B WHERE (A.SC31CHWM + A.SC31UHWM) <= (B.SC31CHWM + B.SC31UHWM) ) ORDER BY TOTAL31 DESC;
Figure 17-36 shows the output of this query.
Figure 17-36 Worst storage consumers query output
DB2 Version 7 introduced new SQL statements that allow you to select a limited number of rows. We used the FETCH FIRST 10 ROWS ONLY statement to create a query similar to the one shown in Figure 17-2. The query and the SPUFI output are shown in Figure 17-37.
---------+---------+---------+---------+---------+---------+---------+---------+---------+---------+---------+---------+---------+------TRAN APPLID TASKNO TOTAL31 TOTAL24 SC31CHWM SC31UHWM SC24CHWM SC24UHWM SC31GSHR SC24GSHR ---------+---------+---------+---------+---------+---------+---------+---------+---------+---------+---------+---------+---------+------CWBA SCSCPJA6 29847 8634288 576 32784 8601504 0 576 0 0 CWBA SCSCPJA6 29835 8634256 0 32784 8601472 0 0 0 0 CWBA SCSCPJA6 27816 8634240 0 32784 8601456 0 0 0 0 CWBA SCSCPJA6 29956 8599248 0 5744 8593504 0 0 0 0 CWBA SCSCPJA6 28401 8599248 0 5744 8593504 0 0 0 0 CWBA SCSCPJA6 28405 120880 0 2400 118480 0 0 0 0 CWBA SCSCPJA6 29840 120880 0 2400 118480 0 0 0 0 CWBA SCSCPJA6 29960 120880 0 2400 118480 0 0 0 0 CWBA SCSCPJA6 29915 120880 0 2400 118480 0 0 0 0 CWBA SCSCPJA6 27822 120880 0 2400 118480 0 0 0 0 DSNE610I NUMBER OF ROWS DISPLAYED IS 10 DSNE616I STATEMENT EXECUTION WAS SUCCESSFUL, SQLCODE IS 100 ---------+---------+---------+---------+---------+---------+---------+---------+---------+---------+---------+---------+---------+----
382 CICS Performance Analyzer

Figure 17-37 DB2 Version 7 query for CWBA transaction
The output of this SQL statement shows only CWBA transactions in region SCSCPJA6. The query shown in Figure 17-38 lists 10 different transactions with the worst storage usage from all of our CICS regions.
Figure 17-38 Worst storage consumers DB2 Version 7 query
---------+---------+---------+---------+---------+---------+---------+---------+---------+---------+---------+---------+---------+- SELECT TRAN, APPLID, TASKNO, (SC31CHWM + SC31UHWM) AS TOTAL31, (SC24CHWM + SC24UHWM) AS TOTAL24, SC31CHWM, SC31UHWM, SC24CHWM, SC24UHWM, SC31GSHR, SC24GSHR FROM ITSO.CICSPATB ORDER BY TOTAL31 DESC FETCH FIRST 10 ROWS ONLY ---------+---------+---------+---------+---------+---------+---------+---------+---------+---------+---------+---------+---------+-TRAN APPLID TASKNO TOTAL31 TOTAL24 SC31CHWM SC31UHWM SC24CHWM SC24UHWM SC31GSHR SC24GSHR---------+---------+---------+---------+---------+---------+---------+---------+---------+---------+---------+---------+---------+-CWBA SCSCPJA6 29847 8634288 576 32784 8601504 0 576 0 0CWBA SCSCPJA6 29835 8634256 0 32784 8601472 0 0 0 0CWBA SCSCPJA6 27816 8634240 0 32784 8601456 0 0 0 0CWBA SCSCPJA6 28401 8599248 0 5744 8593504 0 0 0 0CWBA SCSCPJA6 29956 8599248 0 5744 8593504 0 0 0 0CWBA SCSCPJA6 29960 120880 0 2400 118480 0 0 0 0CWBA SCSCPJA6 29915 120880 0 2400 118480 0 0 0 0CWBA SCSCPJA6 29840 120880 0 2400 118480 0 0 0 0CWBA SCSCPJA6 28405 120880 0 2400 118480 0 0 0 0CWBA SCSCPJA6 27822 120880 0 2400 118480 0 0 0 0
SELECT TRAN, APPLID, MAX(SC31CHWM + SC31UHWM) AS TOTAL31, MAX(SC24CHWM + SC24UHWM) AS TOTAL24 FROM ITSO.CICSPATB GROUP BY TRAN,APPLID ORDER BY TOTAL31 DESC,TRAN ASC FETCH FIRST 10 ROWS ONLY ; ---------+---------+---------+---------+---------+---------+---------+---------+---------+---------+---------+---------+---------+--TRAN APPLID TOTAL31 TOTAL24 ---------+---------+---------+---------+---------+---------+---------+---------+---------+---------+---------+---------+---------+--CWBA SCSCPJA6 8634288 576 CLER SCSCPJA6 97760 1168 CETR SCSCPJA6 61632 12384 CIRP SCSCPJA6 33248 0 CSMI SCSCPJA6 32320 0 CEMT SCSCPJA6 26256 0 CIRR SCSCPLA2 21632 0 CIRR SCSCPLA1 21632 0 CEOT SCSCPJA6 21088 96 CECI SCSCPJA6 21072 96
Chapter 17. Analyzing overall system performance 383

384 CICS Performance Analyzer

Chapter 18. Using CICS Performance Analyzer reports for problem determination
This chapter demonstrates how to use CICS Performance Analyzer (PA) reports to diagnose a new response time problem. The various CICS Performance Analyzer reports we use to analyze the problem are discussed in detail.
18
© Copyright IBM Corp. 2003. All rights reserved. 385

18.1 CICS VSAM problem determination scenario descriptionTo produce useful and realistic performance data for the problem determination scenario project, we used a traditional 3270 COBOL VSAM application as referred to in other projects earlier in this book. We also added one new transaction, BR1.
The base application uses nine VSAM files. We chose to place the files in a File Owning Region (FOR) to mimic a common customer environment. We used the Teleprocessing Network Simulator (TPNS) to simulate a realistic 3270 workload environment.
The 3270 VSAM application workload consists of four business applications:
� Hotelres: A simple 3270 hotel reservation application using two VSAM data sets. Two transactions, HX1 and HX2, are available which drive the application.
� Inventory: An inventory tracking application. It mainly uses two transactions to manage the inventory. Transaction IX8 updates the inventory, and transaction IX2 is used to inquire about part locations within the inventory.
� Specification: A bill of material management application. It uses two transactions (PX2 and PX3) to inquire on information about part lists.
� Stock: A stock control application. Transaction SX2 is used to update any inventory, transaction SX4 allows you to insert new vendors, and transaction SX6 is used to delete parts from the stock. Our new transaction BR1 is part of this application. It performs inquiries on the vendor file.
Figure 18-1 illustrates the VSAM file usage of the entire workload. We do not describe non-VSAM related aspects of the workload, such as program and map design, since they are not relevant to our problem determination scenario.
Refer to Chapter 5, “System setup and scenario overview” on page 129, for a full description of the CICS environment setup that we used to run the workload.
Figure 18-1 3270 VSAM application workload
18.1.1 Workload generationWe used Teleprocessing Network Simulator (TPNS) to generate an appropriate 3270 VSAM workload for our scenario. TPNS is a terminal and network simulation tool. You can find a
TPNSHX1HX2
HOTEL1X EMPACTDX ITEMACTX LABOPSDX DEPSUMDX ITEMMASX COMPOSDX VENDORX INVENTOX
SX2SX4BR1
SX6PX2Px3
IX2 IX8
SC66
386 CICS Performance Analyzer

brief overview of its capabilities in 6.2.1, “RLS workload generation” on page 141. The only difference between what we used for this scenario and what is described in 6.2.1, “RLS workload generation” on page 141, is the list of transactions and the probability of distribution for our workload. Example 18-1 shows our transaction list and how we specified the probability of distribution for our workload scenario.
Example 18-1 Probability of distribution
1 PATH PX3,PX2,IX8,IX1,IX2,HX1, SX6,SX2,SX4,TX1,BR1 * 1 DIST 90,100,80,30,60,30, 100,30,20,40,40
18.1.2 Performance objectivesThe performance objectives and priorities depend very much on user expectations. From our previous experiences with the application and the files in an FOR configuration, we know what average response times we can expect for different transactions. From the point of view of a terminal user, this is the most important characteristic.
Table 18-1 summarizes our performance objectives.
Table 18-1 VSAM FOR scenario performance objectives
We are ready to start the VSAM workload using TPNS. We gather the necessary baseline performance data and analyze the results using a CICS Performance Analyzer summary report.
18.2 Running the scenarioThis section describes the tasks that we performed to collect the performance data for our VSAM application. First we used CICS Performance Analyzer functionality to provide an overview of the performance behavior of the application. We performed the following steps:
1. Start TPNS and run the entire application for about 15 minutes. The application runs through region PAA1, which is used as both a TOR and AOR, a setup common in many environments, and PTA1, which was optimized to function as an FOR for this scenario.
2. Stop TPNS.
Application Transaction Response average Response maximum
HOTEL HX1 < 0,02 0,2
INVENTORY IX8 <0,05 0,3
INVENTORY IX2 <0,03 0,28
SPECIFIC PX2,PX3 <0,04 0,46
STOCK SX2SX4,SX6BR1
<0,06<0,03<0,01
0,80,30,08
Chapter 18. Using CICS Performance Analyzer reports for problem determination 387
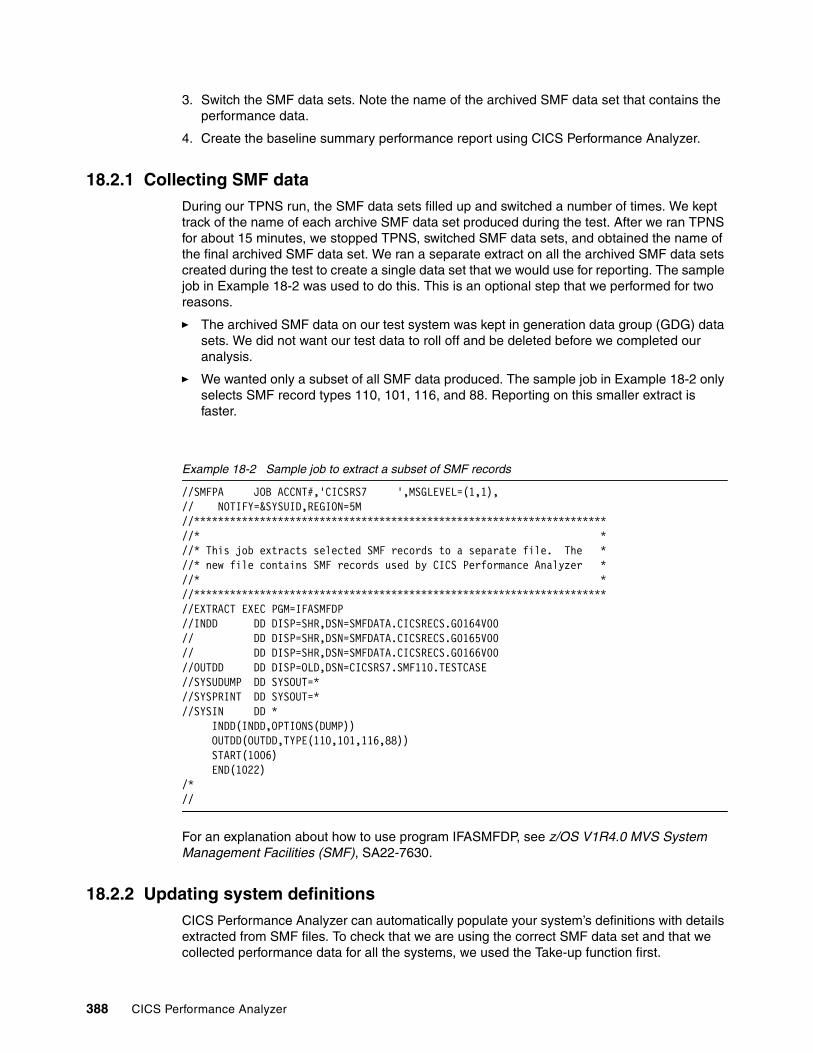
3. Switch the SMF data sets. Note the name of the archived SMF data set that contains the performance data.
4. Create the baseline summary performance report using CICS Performance Analyzer.
18.2.1 Collecting SMF dataDuring our TPNS run, the SMF data sets filled up and switched a number of times. We kept track of the name of each archive SMF data set produced during the test. After we ran TPNS for about 15 minutes, we stopped TPNS, switched SMF data sets, and obtained the name of the final archived SMF data set. We ran a separate extract on all the archived SMF data sets created during the test to create a single data set that we would use for reporting. The sample job in Example 18-2 was used to do this. This is an optional step that we performed for two reasons.
� The archived SMF data on our test system was kept in generation data group (GDG) data sets. We did not want our test data to roll off and be deleted before we completed our analysis.
� We wanted only a subset of all SMF data produced. The sample job in Example 18-2 only selects SMF record types 110, 101, 116, and 88. Reporting on this smaller extract is faster.
Example 18-2 Sample job to extract a subset of SMF records
//SMFPA JOB ACCNT#,'CICSRS7 ',MSGLEVEL=(1,1), // NOTIFY=&SYSUID,REGION=5M //*********************************************************************//* *//* This job extracts selected SMF records to a separate file. The *//* new file contains SMF records used by CICS Performance Analyzer *//* *//*********************************************************************//EXTRACT EXEC PGM=IFASMFDP //INDD DD DISP=SHR,DSN=SMFDATA.CICSRECS.G0164V00 // DD DISP=SHR,DSN=SMFDATA.CICSRECS.G0165V00 // DD DISP=SHR,DSN=SMFDATA.CICSRECS.G0166V00 //OUTDD DD DISP=OLD,DSN=CICSRS7.SMF110.TESTCASE //SYSUDUMP DD SYSOUT=* //SYSPRINT DD SYSOUT=* //SYSIN DD * INDD(INDD,OPTIONS(DUMP)) OUTDD(OUTDD,TYPE(110,101,116,88)) START(1006) END(1022) /* //
For an explanation about how to use program IFASMFDP, see z/OS V1R4.0 MVS System Management Facilities (SMF), SA22-7630.
18.2.2 Updating system definitionsCICS Performance Analyzer can automatically populate your system’s definitions with details extracted from SMF files. To check that we are using the correct SMF data set and that we collected performance data for all the systems, we used the Take-up function first.
388 CICS Performance Analyzer

To perform the data take-up from our SMF extract, we performed these steps:
1. From the CICS Performance Analyzer Primary Option Menu, select option 1.
2. One the System Definitions menu, select option 4.
3. Update the Data Take-Up from SMF screen with the SMF data set name as shown in Figure 18-2. Press Enter to generate a batch job to extract the details from the SMF data set.
When the job completes, you are prompted to update the system definitions with the results of the batch job. The prompt appears when you arrive at the System Definitions screen the next time.
Figure 18-2 Data Take-Up from SMF screen
When the generated batch job completed, we verified that we had SMF records for MVS image SC66 as well as for the CICS systems participating in the workload. We also checked that the time interval of our TPNS run was processed using this SMF data set. Figure 18-3 shows the output that was produced by the take-up job.
Figure 18-3 Take-Up from SMF output
Take-up processing updates the system definitions automatically. From the System Definitions Menu, we selected option 1 to open the Systems Definitions screen. Figure 18-4
------------------------- System Definitions ------------------------- File Options Help ------------------------------------------------------------------- Data Take-Up from SMF Command ===> Specify the SMF File for data take-up. Data Set Name . . . 'CICSRS7.SMF110.TESTCASE' Specify details if data set is not cataloged: UNIT . . . . . + VOLSER . . . + SEQ Number . . (1 to 255) Execution Mode: 2 1. Submit Batch JCL 2. Edit Batch JCL
This is the SMF data set we created using the job in Example 18-2
We select Execution Mode option 2 to edit the JCL first
V1R3M0 13:34:20 9/24/2003 CICS Performance Analyzer Page 1 Take-up from SMF ________________ CPA2012I Processing started for SMF file SMFIN001 CPA2017I SMF records for System SC66 start at 9/24/2003 10:06:00.06 CPA2014I CMF record for CICS system found, APPLID=SCSCPAA1 Release=6.2.0 CPA2014I CMF record for CICS system found, APPLID=SCSCPTA1 Release=6.2.0 CPA2014I CMF record for CICS system found, APPLID=SCSCPFA1 Release=5.3.0 CPA2014I CMF record for CICS system found, APPLID=SCSCPJA3 Release=6.2.0 CPA2014I CMF record for CICS system found, APPLID=SCSCPJA6 Release=6.2.0 CPA2014I CMF record for CICS system found, APPLID=SCSCPJA7 Release=6.2.0 CPA2014I CMF record for CICS system found, APPLID=SCSCPTA2 Release=6.2.0 CPA2014I CMF record for CICS system found, APPLID=SCSCPAA4 Release=6.2.0 CPA2016I MVS System Logger record found, System=SC66LOGR CPA2015I DB2 Accounting record found, DB2 SSID=D7Q2 Release=7.1 CPA2014I CMF record for CICS system found, APPLID=SCSCPJA9 Release=6.2.0 CPA2013I Processing ended for SMF file SMFIN001 - 11 system(s) found CPA2000I Take-up processing has completed, RC=0
Chapter 18. Using CICS Performance Analyzer reports for problem determination 389

shows the System Definition screen after processing Take-Up from SMF. It shows that the CICS systems we used were added automatically during take-up processing.
Figure 18-4 System Definitions after Take-Up from SMF
We typed line action S next to the SC66 Image entry to select it. Figure 18-5 shows the MVS Image screen that is displayed.
Figure 18-5 System Definition for MVS Image after Take-Up from SMF
We verified that the SMF data set name listed was the one we used in our take-up job. We pressed F3 to return to the System Definitions screen. Out of curiosity, we selected a few more entries from the table by typing line action S, and then pressing F3 repeatedly until we returned to the CICS Performance Analyzer Primary Option Menu.
18.3 Producing the baseline Performance Summary reportThis section explains how we produced our baseline Performance Summary Report.
File Edit Filter View Options Help ------------------------------------------------------------------------------ System Definitions Row 1 from 12 Command ===> Scroll ===> CSR Select a System to edit its definition, SMF Files and Groups. SMF Files / System Type Image Description System S SC66 Image System added by take-up SC66 SCSCPAA1 CICS SC66 System added by take-up SC66 SCSCPTA1 CICS SC66 System added by take-up SC66 SCSCPFA1 CICS SC66 System added by take-up SC66 SCSCPJA3 CICS SC66 System added by take-up SC66 SCSCPJA6 CICS SC66 System added by take-up SC66 SCSCPJA7 CICS SC66 System added by take-up SC66 SCSCPTA2 CICS SC66 System added by take-up SC66 SCSCPAA4 CICS SC66 System added by take-up SC66 SC66LOGR Logger SC66 System added by take-up SC66 D7Q2 DB2 SC66 System added by take-up SC66 SCSCPJA9 CICS SC66 System added by take-up SC66 ********************************* End of list *********************************
---------------------------- System Definitions ----------------------------- File Edit View Options Help -------------------------------------------------------------------------- MVS Image Row 1 of 1 More: > Command ===> Scroll ===> CSR MVS Image definition: MVS Image . . . . . SC66 Description . . . . System added by take-up / Exc SMF Data Set Name + UNIT + SEQ VOLSER + 'CICSRS7.SMF110.TESTCASE' DASD ********************************* End of list *****************************
390 CICS Performance Analyzer
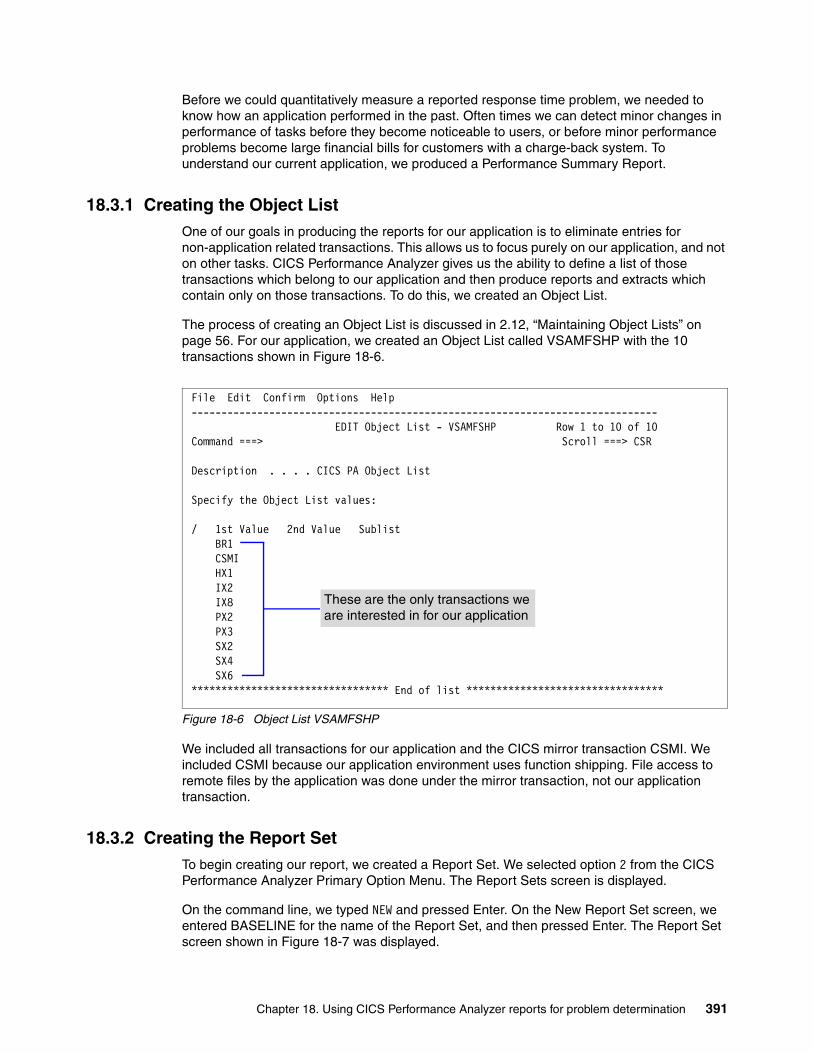
Before we could quantitatively measure a reported response time problem, we needed to know how an application performed in the past. Often times we can detect minor changes in performance of tasks before they become noticeable to users, or before minor performance problems become large financial bills for customers with a charge-back system. To understand our current application, we produced a Performance Summary Report.
18.3.1 Creating the Object ListOne of our goals in producing the reports for our application is to eliminate entries for non-application related transactions. This allows us to focus purely on our application, and not on other tasks. CICS Performance Analyzer gives us the ability to define a list of those transactions which belong to our application and then produce reports and extracts which contain only on those transactions. To do this, we created an Object List.
The process of creating an Object List is discussed in 2.12, “Maintaining Object Lists” on page 56. For our application, we created an Object List called VSAMFSHP with the 10 transactions shown in Figure 18-6.
Figure 18-6 Object List VSAMFSHP
We included all transactions for our application and the CICS mirror transaction CSMI. We included CSMI because our application environment uses function shipping. File access to remote files by the application was done under the mirror transaction, not our application transaction.
18.3.2 Creating the Report SetTo begin creating our report, we created a Report Set. We selected option 2 from the CICS Performance Analyzer Primary Option Menu. The Report Sets screen is displayed.
On the command line, we typed NEW and pressed Enter. On the New Report Set screen, we entered BASELINE for the name of the Report Set, and then pressed Enter. The Report Set screen shown in Figure 18-7 was displayed.
File Edit Confirm Options Help ------------------------------------------------------------------------------ EDIT Object List - VSAMFSHP Row 1 to 10 of 10 Command ===> Scroll ===> CSR Description . . . . CICS PA Object List Specify the Object List values: / 1st Value 2nd Value Sublist BR1 CSMI HX1 IX2 IX8 PX2 PX3 SX2 SX4 SX6 ********************************* End of list *********************************
These are the only transactions we are interested in for our application
Chapter 18. Using CICS Performance Analyzer reports for problem determination 391

Figure 18-7 Report Set BASELINE
18.3.3 Creating the Performance Summary reportWe typed line action S next to Summary within the Performance Reports category. The Performance Summary Report screen shown in Figure 18-8 was displayed.
File Systems Confirm Options Help ------------------------------------------------------------------------------ EDIT Report Set - BASELINE Row 1 of 34 Command ===> Scroll ===> CSR Description . . . CICS PA Report Set Enter "/" to select action. ** Reports ** Active - Options No Global No - Selection Criteria No Performance No Exception No - Performance Reports No List No List Extended No S Summary No Totals No Wait Analysis No Cross-System Work No Transaction Group No BTS No Workload Activity No - Exception Reports No List No Summary No - Transaction Resource Usage Reports No File Usage Summary No Temporary Storage Usage Summary No Transaction Resource Usage List No - Subsystem Reports No DB2 No WebSphere MQ No - System Reports No System Logger No - Performance Graphs No Transaction Rate No Transaction Response Time No - Extracts No Cross-System Work No Export No Record Selection No ** End of Reports **
392 CICS Performance Analyzer

Figure 18-8 Performance Summary Report screen
We typed line action S next to the Performance selection criteria and pressed Enter. The Performance Select Statement screen in Figure 18-9 was displayed. We wanted to produce a report of our application transactions from a five minute interval in the middle of our TPNS test run. Therefore, we specified a selection condition to include only tasks in our object list VSAMFSHP that started on 09/24/2003 between the time 10:06:29.00 and 10:11:29.00 (Figure 18-9.)
Figure 18-9 Performance Select Statement screen
File Systems Options Help ------------------------------------------------------------------------------ BASELINE - Performance Summary Report Command ===> System Selection: Report Output: APPLID . . + DDname . . . . . . . . . SUMM0001 Image . . + Print Lines per Page . . (1-255) Group . . + Report Format: Form . . . + Title . . Processing Options: Reporting Options: Time Interval . . . 00:01:00 (hh:mm:ss) Exclude Totals Selection Criteria: S Performance
File Edit Object Lists Options Help ------------------------------------------------------------------------------ BASELINE - Performance Select Statement Row 1 of 9 More: > Command ===> Scroll ===> CSR Active --------------- Report Interval ---------------- Inc Start -------- From --------- --------- To ---------- Exc Stop MM/DD/YYYY HH:MM:SS.TH MM/DD/YYYY HH:MM:SS.TH INC START 09/24/2003 10:06:29.00 09/24/2003 10:11:29.00 ------------------------------------------------------------------------------ Inc Field --- Value or Range --- Object / Exc Name + Type Value/From To List + INC TRAN VSAMFSHP ********************************* End of list *********************************
Date and time selection condition
Include only those transactions in our Object List
Chapter 18. Using CICS Performance Analyzer reports for problem determination 393

We entered both the time and transaction selection conditions on a single Performance Select Statement screen. Both conditions must be met before a record is selected for inclusion in the report (AND processing.) If we created two separate select statements for each condition, then a transaction would be included in the report if it met either one (OR processing.) We pressed F3 three times to return to the Report Set screen.
18.3.4 Submitting the batch jobTo submit our job, we typed the RUN line action next to the Summary Report and pressed Enter. The Run Report Set screen was displayed (Figure 18-10.)
Figure 18-10 Run Report Set
We left CICS APPLID blank and only specified a CICS System Selection criteria of SC66. We entered a forward slash (/) next to Edit JCL before submit because we wanted the option to change the job name for each job. Keeping track of which job ran which report is easier when the job names are unique. We pressed Enter. Then we were placed into ISPF Edit mode for our batch JCL, shown in Figure 18-11.
File Systems Options Help ------------------------------------------------------------------------------ CPARSRUN Run Report Set BASELINE Command ===> Specify run Report Set options then press Enter to continue submit. System Selection: CICS APPLID . . + Image . . SC66 + Group . . + DB2 SSID . . . + Image . . + Group . . + MQ SSID . . . . + Image . . + Group . . + Logger . . . . + Image . . + Group . . + Override System Selections specified in Report Set ----- Report Interval ------ Missing SMF Files Option: MM/DD/YYYY HH:MM:SS.TH 1 1. Issue error message From 2. Leave DSN unresolved in JCL To 3. Disregard offending reports Enter "/" to select option / Edit JCL before submit
We leave CICS APPLID blank, and only specify Image SC66
We use the / line action to indicate that we want to edit the JCL before submitting the job
394 CICS Performance Analyzer

Figure 18-11 Performance Summary Report JCL
File Edit Edit_Settings Menu Utilities Compilers Test Help ---------------------------------------------------------------------------------------ISREDDE3 CICSRS7.SC66.SPFTEMP1.CNTL Columns 00001 00080 Command ===> SUBMIT Scroll ===> CSR ****** ********************************* Top of Data **********************************000001 //PERFSUMB JOB ACCNT#,'CICSPA JOB',MSGLEVEL=(1,1),NOTIFY=&SYSUID 000002 /*JOBPARM SYSAFF=SC66 000003 //********************************************************************* 000004 //* * 000005 //* CICSPA V1R3 Report JCL 000006 //CICSPA EXEC PGM=CPAMAIN 000007 //STEPLIB DD DSN=CPA13.SCPALINK,DISP=SHR 000008 //SYSPRINT DD SYSOUT=* 000009 //* SMF Input Files 000010 //SMFIN001 DD DSN=CICSRS7.SMF110.TESTCASE, 000011 // DISP=SHR 000012 //* External Work Data Sets 000013 //CPAXW001 DD DSN=&&CPAXW001,DISP=(NEW,DELETE), 000014 // UNIT=SYSDA,SPACE=(CYL,(300,100)) 000015 //* Sort Work Data Sets 000016 //CPASWK01 DD DSN=&&CPASWK01,DISP=(NEW,DELETE), 000017 // UNIT=SYSDA,SPACE=(CYL,(300,100)) 000018 //CPASWK02 DD DSN=&&CPASWK02,DISP=(NEW,DELETE), 000019 // UNIT=SYSDA,SPACE=(CYL,(300,100)) 000020 //CPASWK03 DD DSN=&&CPASWK03,DISP=(NEW,DELETE), 000021 // UNIT=SYSDA,SPACE=(CYL,(300,100)) 000022 //CPASWK04 DD DSN=&&CPASWK04,DISP=(NEW,DELETE), 000023 // UNIT=SYSDA,SPACE=(CYL,(300,100)) 000024 //SYSOUT DD SYSOUT=* 000025 //* Command Input 000026 //SYSIN DD * 000027 * Report Set =BASELINE 000028 * Description=CICS PA Report Set 000029 * Reports for Image=SC66 000030 * Description=System added by take-up 000031 CICSPA IN(SMFIN001), 000032 NOAPPLID, 000033 LINECNT(60), 000034 FORMAT(':','/'), 000035 SUMMARY(OUTPUT(SUMM0001), 000036 EXTERNAL(CPAXW001), 000037 SELECT(PERFORMANCE( 000038 INC(START(FROM(2003/09/24,10:06:29.00), 000039 TO(2003/09/24,10:11:29.00))), 000040 INC(TRAN(BR1, 000041 CSMI, 000042 HX1, 000043 IX2, 000044 IX8, 000045 PX2, 000046 PX3, 000047 SX2, 000048 SX4, 000049 SX6))))) 000050 /*
We provide a meaningful job name
We verify the SMF data set is the one we want to use
We see the report options and selection criteria that we entered on the ISPF screens are turned into report selection control statements
Chapter 18. Using CICS Performance Analyzer reports for problem determination 395

After providing a unique job name, we entered SUBMIT on the command line and pressed Enter. When the job completed, it produced the output shown in Figure 18-12.
Figure 18-12 Performance Summary Report baseline
The average response times are in line with what we expected from this application in the current environment. Only those transactions that were part of our VSAMFSHP Object are reported, and only those that started during our specified time interval.
If this was a live production application, as part of our normal application monitoring procedures, we would want to produce this report daily and distribute it to our applications management. We would set it up to run through our production job scheduling package, where the input SMF data is updated automatically and the reports are sent to an online viewing facility such as IBM Content Manager OnDemand for iSeries®.
18.4 Application changes implementedNext we simulated our applications development group implementing program changes. Programs and maps were updated and moved to production. The next time our regular Performance Summary report ran after the application changes are made, we saw the report in Figure 18-13.
The average response time for the transactions in our application remained within our expected ranges shown in Table 18-1 on page 387 with the exception of transaction BR1. Comparing the data from our current report in Figure 18-13 with that of our baseline report from Figure 18-12, we see a 571% increase in average response time for transaction BR1. Looking closer at transaction BR1, we also see a 588% increase in average CPU time, 581% increase in average suspend time, 1450% increase in average dispatch wait time, and 752% increase in average IR wait time.
V1R3M0 CICS Performance Analyzer Performance Summary __________________________________________________ SUMM0001 Printed at 13:32:56 9/25/2003 Data from 10:06:29 9/24/2003 to 10:11:29 9/24/2003 Page 1 Avg Max Avg Avg Avg Max Avg Avg Avg Avg Avg Avg Tran #Tasks Response Response Dispatch User CPU Suspend Suspend DispWait FC Wait FCAMRq IR Wait SC24UHWM SC31UHWM Time Time Time Time Time Time Time Time Time BR1 858 .0078 .0857 .0014 .0009 .0064 .0843 .0004 .0000 0 .0044 432 33232 CSMI 12486 .0199 .7749 .0013 .0009 .0186 .7719 .0009 .0055 19 .0127 0 3 HX1 610 .0156 .2118 .0032 .0022 .0125 .2061 .0007 .0000 0 .0087 432 92811 IX2 1303 .0257 .2844 .0057 .0043 .0199 .2771 .0023 .0000 0 .0169 432 92832 IX8 1721 .0333 .3270 .0054 .0040 .0279 .3084 .0025 .0000 0 .0246 432 92771 PX2 2163 .0261 .4537 .0062 .0045 .0198 .4317 .0025 .0000 0 .0168 432 92753 PX3 1962 .0367 .4654 .0087 .0066 .0280 .4490 .0041 .0000 0 .0250 432 92775 SX2 651 .0529 .8121 .0058 .0045 .0471 .8049 .0027 .0000 0 .0443 432 92763 SX4 412 .0249 .3801 .0049 .0036 .0200 .3538 .0020 .0000 0 .0146 432 92596 SX6 2201 .0186 .2507 .0036 .0024 .0150 .2452 .0011 .0000 0 .0118 432 92792
The average response times are in line with what we would expect for this application in the current environment
396 CICS Performance Analyzer

Figure 18-13 Performance Summary Report after application changes
We used Lotus 1-2-3 to create a chart of the average response times for the transactions in our application so we could visually compare the changes (Figure 18-14.)
Figure 18-14 Average response time comparison chart
V1R3M0 CICS Performance Analyzer Performance Summary __________________________________________________ SUMM0001 Printed at 10:35:02 9/24/2003 Data from 10:16:43 9/24/2003 to 10:21:43 9/24/2003 Page 1 Avg Max Avg Avg Avg Max Avg Avg Avg Avg Avg Avg Tran #Tasks Response Response Dispatch User CPU Suspend Suspend DispWait FC Wait FCAMRq IR Wait SC24UHWM SC31UHWM Time Time Time Time Time Time Time Time Time BR1 858 .0446 1.2273 .0074 .0053 .0372 1.2030 .0058 .0000 0 .0331 432 33232 CSMI 12895 .0247 1.2091 .0014 .0011 .0233 1.2053 .0010 .0054 23 .0175 0 3 HX1 609 .0160 .3028 .0032 .0022 .0128 .2956 .0008 .0000 0 .0088 432 92851 IX2 1302 .0270 .3864 .0058 .0043 .0212 .3799 .0030 .0000 0 .0177 432 92818 IX8 1719 .0350 .8573 .0057 .0040 .0293 .8500 .0026 .0000 0 .0262 432 92871 PX2 2158 .0266 .8969 .0061 .0045 .0205 .8865 .0035 .0000 0 .0171 432 92906 PX3 1961 .0388 .9365 .0089 .0067 .0299 .9265 .0052 .0000 0 .0264 432 92853 SX2 651 .0539 1.0864 .0059 .0045 .0480 1.0760 .0038 .0000 0 .0443 432 92814 SX4 414 .0246 .8808 .0052 .0036 .0194 .8743 .0022 .0000 0 .0152 432 92940 SX6 2200 .0193 .7659 .0036 .0025 .0158 .7599 .0013 .0000 0 .0124 432 92875
Increased 571%
Increased 588%
Increased 581%
Increased 1450%
Increased 752%
BR1 CSMI
HX1 IX2
IX8 PX2
PX3 SX2
SX4 SX6
Transaction ID
0
0.01
0.02
0.03
0.04
0.05
0.06
Res
pons
e (s
econ
ds)
Baseline
After applicationchanges
Chapter 18. Using CICS Performance Analyzer reports for problem determination 397

The chart shows the dramatic increase in average response time for transaction BR1. We decided to look closely at the rest of the averages for transaction BR1 (Figure 18-15.)
Figure 18-15 Transaction BR1 averages chart
In our five minute sampling, 858 BR1 transactions ran. If this sample was representative of the entire day, a small increase in CPU utilization per transaction could have a large impact, especially for customers who use charge-back systems.
Taking a proactive approach, we decided to investigate the cause of the increase. Because of the increase in the average suspend time and average IR wait time, we ran the Wait Analysis Report.
18.5 Producing the Wait Analysis reportTo produce the Wait Analysis report, we selected option 2 from the CICS Performance Analyzer Primary Option Menu. Then we typed line action S next to the Report Set we created in Figure 18-7 on page 392 to we return to the Report Sets screen. We typed line action S next to the Wait Analysis report and pressed Enter. The Wait Analysis Report screen shown in Figure 18-16 is displayed.
We wanted to see the difference that the application changes made, so we produced two separate reports. One report shows a wait analysis before any application changes were made. The other report shows a wait analysis after the changes were made.
For the baseline report, we entered an appropriate title on the screen shown in Figure 18-16, typed line action S next to the Performance selection criteria option, and pressed Enter.
Avg RespAvg CPU
Avg SuspAvg Disp Wait
Avg IR Wait0
0.01
0.02
0.03
0.04
0.05
Tim
e (s
econ
ds)
BaselineAfter applicationchanges
398 CICS Performance Analyzer

Figure 18-16 Wait Analysis Report screen
The Performance Select Statement screen in Figure 18-17 was displayed.
Figure 18-17 Performance Select Statement screen
We entered the same selection criteria that we used to produce our baseline Performance Summary report in Figure 18-9 on page 393 and then pressed F3 three times to return to the Wait Analysis Reports screen (Figure 18-18.)
File Edit Object Lists Options Help ------------------------------------------------------------------------------ BASELINE - Performance Select Statement Row 1 of 9 More: > Command ===> Scroll ===> CSR Active --------------- Report Interval ---------------- Inc Start -------- From --------- --------- To ---------- Exc Stop MM/DD/YYYY HH:MM:SS.TH MM/DD/YYYY HH:MM:SS.TH INC START 09/24/2003 10:06:29.00 09/24/2003 10:11:29.00 ------------------------------------------------------------------------------ Inc Field --- Value or Range --- Object / Exc Name + Type Value/From To List + INC TRAN VSAMFSHP ********************************* End of list *********************************
File Systems Options Help ------------------------------------------------------------------------------ BASELINE - Wait Analysis Report Command ===> System Selection: Report Output: APPLID . . + DDname . . . . . . . . . WAIT0001 Image . . + Print Lines per Page . . (1-255) Group . . + Order by: 1 . . + 2 . . + 3 . . + Processing Options: Time Interval . . . (hh:mm:ss) Report Format: Title . . Wait Analysis Baseline Selection Criteria: S Performance
We enter a title and line action S
Chapter 18. Using CICS Performance Analyzer reports for problem determination 399

Figure 18-18 Wait Analysis Reports screen
We wanted to produce both reports with one job, so we entered line action R next to our first selection criteria and pressed Enter. We changed the output DDnames for each selection criteria to indicate which report is being written to it, and then typed line action S next to the second entry to change the date and time selection criteria.
The Wait Analysis Report screen was displayed for our second selection criteria entry (Figure 18-19). Then we changed the title appropriately, typed line action S next to the Performance selection criteria option, and pressed Enter.
Figure 18-19 Wait Analysis Report screen
File Filter Edit Systems Options Help ------------------------------------------------------------------------------ BASELINE - Wait Analysis Reports Row 1 from 2 Command ===> Scroll ===> CSR Select to edit report options. ---- System Selection ----- Selection / Exc APPLID + Image + Group + Output Criteria WAITBASE YES WAITAFTR YES ********************************* End of list *********************************
We want our two reports written to separate DD statements, so we change the DDnames to identify which report is written to it
We enter line action R next to the first entry to repeat the selection criteria, and then type line action S next to the second one to specify different date and time criteria
File Systems Options Help ------------------------------------------------------------------------------ BASELINE - Wait Analysis Report Command ===> System Selection: Report Output: APPLID . . + DDname . . . . . . . . . WAITAFTR Image . . + Print Lines per Page . . (1-255) Group . . + Order by: 1 . . + 2 . . + 3 . . + Processing Options: Time Interval . . . 00:01:00 (hh:mm:ss) Report Format: Title . . Wait Analysis After Application Changes Selection Criteria: S Performance *
We enter a title and line action S
400 CICS Performance Analyzer

The Performance selection criteria screen was displayed. We typed line action S next to our criteria, and pressed Enter. The Performance Select Statement screen shown in Figure 18-20 was displayed.
Figure 18-20 Performance Select Statement screen
After changing the time interval to match the Performance Summary report from Figure 18-13 on page 397, we pressed F3 four times to return to the Report Set screen, and entered line action RUN next to the Wait Analysis report. We entered a / next to Edit JCL before submit and pressed Enter. We entered ISPF edit mode for our batch JCL, as shown in Figure 18-21.
Figure 18-21 JCL for the Wait Analysis Report job
File Edit Object Lists Options Help ------------------------------------------------------------------------------ BASELINE - Performance Select Statement Row 1 of 9 More: > Command ===> Scroll ===> CSR Active --------------- Report Interval ---------------- Inc Start -------- From --------- --------- To ---------- Exc Stop MM/DD/YYYY HH:MM:SS.TH MM/DD/YYYY HH:MM:SS.TH INC START 09/24/2003 10:16:43.00 09/24/2003 10:21:43.00 ------------------------------------------------------------------------------ Inc Field --- Value or Range --- Object / Exc Name + Type Value/From To List + INC TRAN VSAMFSHP
********************************* End of list *********************************
We change the date and time interval fields to match the Performance Summary report, which we ran after the application changes were implemented
File Edit Edit_Settings Menu Utilities Compilers Test Help --------------------------------------------------------------------------------------- EDIT CICSRS7.SC66.SPFTEMP1.CNTL Columns 00001 00080 Command ===> SUBMIT Scroll ===> CSR ****** ********************************* Top of Data ********************************** 000001 //WAITANAL JOB ACCNT#,'CICSPA JOB',MSGLEVEL=(1,1),NOTIFY=&SYSUID 000002 /*JOBPARM SYSAFF=SC66 000003 //********************************************************************* 000004 //* * 000005 //********************************************************************* 000006 //* CICSPA V1R3 Report JCL 000007 //CICSPA EXEC PGM=CPAMAIN 000008 //STEPLIB DD DSN=CPA13.SCPALINK,DISP=SHR 000009 //SYSPRINT DD SYSOUT=* 000010 //* SMF Input Files 000011 //SMFIN001 DD DSN=CICSRS7.SMF110.TESTCASE, 000012 // DISP=SHR 000013 //* Command Input 000014 //SYSIN DD * - - - - - - - - - - - - - - - - - - - - - 42 Line(s) not Displayed 000057 /* 000058 // '''''' ****** ******************************** Bottom of Data ********************************
This SMF data set contains records for our baseline interval and our post-application change interval. It is the data set we created in 18.2.1, “Collecting SMF data” on page 388.
Chapter 18. Using CICS Performance Analyzer reports for problem determination 401

We provided a meaningful job name, entered SUBMIT on the command line, and pressed Enter. When the job completed, we had the two reports shown in Figure 18-22 and Figure 18-23. In the reports that were produced, all transactions from our application were reported. However, we only included transaction BR1 in these examples.
Figure 18-22 Wait Analysis Report before application changes
Figure 18-23 Wait Analysis Report after application changes
The Wait Analysis report has two sections:
� The first section 1 provides a summary of common performance metrics.� The second section 2 provides a detailed breakdown of suspend time by component.
We compared the Dispatch Wait Time 3 in the Summary Data section. This figure increased 1450%. It gives us the elapsed time for which the user task waited for redispatch by the CICS dispatcher domain. It is the aggregate of the wait times between each wait event completion and the user task being redispatched by the CICS dispatcher domain.
V1R3M0 CICS Performance Analyzer Wait Analysis Report __________________________________________________ WAITBASE Printed at 14:39:41 9/26/2003 Data from 10:06:29 9/24/2003 to 10:11:29 9/24/2003 Page 1 Wait Analysis Baseline ------------------------------------------------------------------------------------------------------------------------------------ Tran=BR1 Summary Data -------- Time --------- ------ Count ------ ------ Ratio ------ Total Average Total Average # Tasks 858 Response Time 6.6672 0.0078 Dispatch Time 1.1872 0.0014 6002 7.0 17.8% of Response CPU Time 0.8034 0.0009 6002 7.0 67.7% of Dispatch Suspend Wait Time 5.4727 0.0064 6002 7.0 82.1% of Response Dispatch Wait Time 0.3371 0.0004 5144 6.0 6.2% of Suspend Resource Manager Interface (RMI) elapsed time 0.0000 0.0000 0 0.0 0.0% of Response Resource Manager Interface (RMI) suspend time 0.0000 0.0000 0 0.0 0.0% of Suspend Suspend Detail ------------------- Suspend Time ------------------- ----- Count ----- Total Average %age Graph Total Average IRIOWTT MRO link wait time 3.7627 0.0044 68.8% |************* 5145 6.0 DSPDELAY First dispatch wait time 1.7099 0.0020 31.2% |****** 858 1.0 ------------------------------------------------------------------------------------------------------------------------------------
1
2
3
4
V1R3M0 CICS Performance Analyzer Wait Analysis Report __________________________________________________ WAITAFTR Printed at 14:47:06 9/26/2003 Data from 10:16:43 9/24/2003 to 10:21:43 9/24/2003 Page 1 Wait Analysis After Application Changes ------------------------------------------------------------------------------------------------------------------------------------ Tran=BR1 Summary Data -------- Time --------- ------ Count ------ ------ Ratio ------ Total Average Total Average # Tasks 858 Response Time 38.2913 0.0446 Dispatch Time 6.3530 0.0074 67703 78.9 16.6% of Response CPU Time 4.5703 0.0053 67703 78.9 71.9% of Dispatch Suspend Wait Time 31.9313 0.0372 67703 78.9 83.4% of Response Dispatch Wait Time 4.9502 0.0058 66845 77.9 15.5% of Suspend Resource Manager Interface (RMI) elapsed time 0.0000 0.0000 0 0.0 0.0% of Response Resource Manager Interface (RMI) suspend time 0.0000 0.0000 0 0.0 0.0% of Suspend Suspend Detail ------------------- Suspend Time ------------------- ----- Count ----- Total Average %age Graph Total Average IRIOWTT MRO link wait time 28.4143 0.0331 89.0% |***************** 66853 77.9 DSPDELAY First dispatch wait time 3.5170 0.0041 11.0% |** 858 1.0 ------------------------------------------------------------------------------------------------------------------------------------
1
24
3
402 CICS Performance Analyzer

In the Count Average column, before the application changes were made, each BR1 had an average of 6.0 wait events. After the application changes, each BR1 had an average of 77.8 wait events. Each time a task enters a wait state, it gives up control and must be redispatched by CICS after the wait event completes. This count tells us that something in the application is making the task give up control almost 13 times more often than it used to.
Next we looked at the Suspend Detail section 2. This section details the components of the Suspend Wait Time reported in the Summary Data section 1. The Suspend Detail includes one report line for every Suspend component clock with a non-zero value. The components are reported in descending wait time order. In both reports, IRIOWTT 4 is the wait time that contributes the most to the total task suspend time. However, comparing the average IRIOWTT time from both reports, we see the 752% increase that was shown in the Performance Summary report we produced earlier (Figure 18-13.)
The Wait Analysis report verified that the MRO link wait time is the main contributor to the increase in the total BR1 suspend wait time. It also tells us that each BR1 transaction is incurring approximately 13 times more MRO link wait events that it used to.
Now we need to determine what is causing that increase in MRO link wait events, so we turn to the Cross-System Work report.
18.6 Producing the Cross-System Work reportThis section explains how we used the Cross-System Work report to uncover the details of the increased MRO activity for transaction BR1.
From the CICS Performance Analyzer Primary Option Menu, we selected option 2. Then we typed line action S next to the Report Set we created in Figure 18-7 on page 392 to return to the Report Sets screen. We typed line action S next to the Cross-System Work report and pressed Enter. The Cross-System Work Report screen shown in Figure 18-24 was displayed.
Figure 18-24 Cross-System Work Report screen
File Systems Options Help ------------------------------------------------------------------------------ BASELINE - Cross-System Work Report Command ===> System Selection: Report Output: APPLID . . + DDname . . . . . . . . . CROSBASE Image . . + Print Lines per Page . . (1-255) Group . . + Processing Options: 1 1. UOWs with more than one record 2. UOWs with a single record 3. All UOWs Report Format: Form . . . + Title . . Cross-System Baseline Selection Criteria: S Performance
We changed the DDname to be meaningful
We use Processing Option 1
We enter a title and line action S
Chapter 18. Using CICS Performance Analyzer reports for problem determination 403

Because we again produce two reports with one job, we changed the DDname to something meaningful, selected Processing option 1, provided a report title, and typed line action S next to the Performance selection criteria option.
As we did for the Wait Analysis report, we created two sets of Performance selection criteria, each going to a separate DDname. The first set of selection criteria was for the time range before the application changes were made. The second set was for the time range after the application changes were made. When we completed entering our selection criteria, we pressed F3 repeatedly until we reached the Report Set screen. Then we entered the RUN line action on the Cross-System Work report to submit the job.
When our job was complete, we had the two reports shown in Figure 18-25 and Figure 18-26.
Figure 18-25 Cross-System Work baseline report
In Figure 18-25, you see the Cross-System Work report before any application changes were made. Each line is printed from a single CMF performance class record. Records that are part of the same network unit of work are printed sequentially in groups separated by blank lines. All the transactions that are part of our VSAMFSHP object are reported. For transaction BR1, you see that it is always paired with one CSMI mirror task. We took a single unit of work and described the output.
V1R3M0 CICS Performance Analyzer Cross-System Work __________________________________________________ CROSBASE Printed at 16:37:00 9/27/2003 Data from 10:06:29 9/24/2003 to 10:11:29 9/24/2003 Page 4 Cross-System Baseline Request Fcty Conn UOW R Response A Tran Userid SC TranType Term LUName Type Program T/Name Name NETName Seq APPLID Task T Stop Time Time B IX2 CICSUSER TP U P000 SCSTP000 AP: DSWIX2VV T/P000 USIBMSC.SCSTP000 1 SCSCPAA1 92212 T 10:11:24.546 .0419 CSMI CICSUSER TO UM X4 SCSCPAA1 FS:F--- DFHMIRS T/X4 PAA1 USIBMSC.SCSTP000 1 SCSCPTA1 76708 T 10:11:24.545 .0382 PX2 CICSUSER TP U P000 SCSTP000 AP: DSWPX2VV T/P000 USIBMSC.SCSTP000 1 SCSCPAA1 92404 T 10:11:26.586 .0242 CSMI CICSUSER TO UM X3 SCSCPAA1 FS:F--- DFHMIRS T/X3 PAA1 USIBMSC.SCSTP000 1 SCSCPTA1 76794 T 10:11:26.586 .0206 PX3 CICSUSER TP U P001 SCSTP001 AP: DSWPX3VV T/P001 USIBMSC.SCSTP001 1 SCSCPAA1 64531 T 10:06:34.219 .0620 CSMI CICSUSER TO UM X1 SCSCPAA1 FS:F--- DFHMIRS T/X1 PAA1 USIBMSC.SCSTP001 1 SCSCPTA1 64619 T 10:06:34.218 .0530 SX6 CICSUSER TP U P001 SCSTP001 AP: DSWSX6VV T/P001 USIBMSC.SCSTP001 1 SCSCPAA1 65168 T 10:06:41.678 .0101 CSMI CICSUSER TO UM X2 SCSCPAA1 FS:F--- DFHMIRS T/X2 PAA1 USIBMSC.SCSTP001 1 SCSCPTA1 64911 T 10:06:41.677 .0067 BR1 CICSUSER TO U P001 SCSTP001 AP: BROWSE1 T/P001 USIBMSC.SCSTP001 1 SCSCPAA1 65361 T 10:06:43.686 .0026 CSMI CICSUSER TO UM X1 SCSCPAA1 FS:F--- DFHMIRS T/X1 PAA1 USIBMSC.SCSTP001 1 SCSCPTA1 65004 T 10:06:43.685 .0015 - - - - - - - - - - - - - - - - - - - - - - - - - - - - - - - - - 182 Line(s) not Displayed BR1 CICSUSER TO U P001 SCSTP001 AP: BROWSE1 T/P001 USIBMSC.SCSTP001 1 SCSCPAA1 90002 T 10:11:00.247 .0091 CSMI CICSUSER TO UM X1 SCSCPAA1 FS:F--- DFHMIRS T/X1 PAA1 USIBMSC.SCSTP001 1 SCSCPTA1 75741 T 10:11:00.247 .0071 - - - - - - - - - - - - - - - - - - - - - - - - - - - - - - - - - 20 Line(s) not Displayed
BR1 CICSUSER TO U P001 SCSTP001 AP: BROWSE1 T/P001 USIBMSC.SCSTP001 1 SCSCPAA1 91968 T 10:11:21.828 .0066 CSMI CICSUSER TO UM X1 SCSCPAA1 FS:F--- DFHMIRS T/X1 PAA1 USIBMSC.SCSTP001 1 SCSCPTA1 76608 T 10:11:21.828 .0047
- - - - - - - - - - - - - - - - - - - - - - - - - - - - - - - - - 88 Line(s) not Displayed BR1 CICSUSER TO U P002 SCSTP002 AP: BROWSE1 T/P002 USIBMSC.SCSTP002 1 SCSCPAA1 73876 T 10:08:12.409 .0071 CSMI CICSUSER TO UM X4 SCSCPAA1 FS:F--- DFHMIRS T/X4 PAA1 USIBMSC.SCSTP002 1 SCSCPTA1 68681 T 10:08:12.408 .0045 - - - - - - - - - - - - - - - - - - - - - - - - - - - - - - - - - 72 Line(s) not Displayed BR1 CICSUSER TO U P002 SCSTP002 AP: BROWSE1 T/P002 USIBMSC.SCSTP002 1 SCSCPAA1 84213 T 10:10:00.448 .0280 CSMI CICSUSER TO UM X5 SCSCPAA1 FS:F--- DFHMIRS T/X5 PAA1 USIBMSC.SCSTP002 1 SCSCPTA1 73195 T 10:10:00.448 .0088
1 2 3 4 6 7 8 95
10 12 13 14 15 1611
404 CICS Performance Analyzer

Transaction BR1 1 was attached by terminal input 2. It is a user transaction 3 being entered at termid P001 4. The initial program is BROWSE1 5. The task’s principal facility is a terminal by name of P001 6. The task ran on a CICS region with APPLID of SCSCPAA1 7. It had a task ID of 91968 8, and its response time was .0066 seconds 9. While it was running, the application issued EXEC CICS commands to access files. The files were not in the same CICS region, so CICS generated a function shipping request for file control 12. The function shipping requests were sent over from CICS region SCSCPAA1 11 to a CICS File Owning Region (FOR) with APPLID SCSCPTA1 14 to be executed. In this FOR, the mirror task transaction CSMI 10 ran on session X1 13 as task number 76608 15, and the response time of these function shipping requests were .0047 seconds 16.
Figure 18-26 Cross-System Work report after application changes
Now let’s look at the Cross-System Work report in Figure 18-26 after the application changes were made. You see the same kind of pairing of a single BR1 transaction and a single CSMI
V1R3M0 CICS Performance Analyzer Cross-System Work __________________________________________________ CROSAFTR Printed at 16:37:00 9/27/2003 Data from 10:16:43 9/24/2003 to 10:21:43 9/24/2003 Page 1 Cross-System After Application Changes Request Fcty Conn UOW R Response A Tran Userid SC TranType Term LUName Type Program T/Name Name NETName Seq APPLID Task T Stop Time Time B IX8 CICSUSER TP U P000 SCSTP000 AP: DSWIX8VV T/P000 USIBMSC.SCSTP000 1 SCSCPAA1 4599 T 10:16:46.173 .0228 CSMI CICSUSER TO UM X1 SCSCPAA1 FS:F--- DFHMIRS T/X1 PAA1 USIBMSC.SCSTP000 1 SCSCPTA1 81777 T 10:16:46.172 .0198 SX2 CICSUSER TP U P000 SCSTP000 AP: DSWSX2VV T/P000 USIBMSC.SCSTP000 1 SCSCPAA1 4811 T 10:16:48.617 .0396 CSMI CICSUSER TO UM X2 SCSCPAA1 FS:F--- DFHMIRS T/X2 PAA1 USIBMSC.SCSTP000 1 SCSCPTA1 81869 T 10:16:48.617 .0348 SX6 CICSUSER TP U P000 SCSTP000 AP: DSWSX6VV T/P000 USIBMSC.SCSTP000 1 SCSCPAA1 5190 T 10:16:53.056 .0140 CSMI CICSUSER TO UM X2 SCSCPAA1 FS:F--- DFHMIRS T/X2 PAA1 USIBMSC.SCSTP000 1 SCSCPTA1 82035 T 10:16:53.055 .0096 BR1 CICSUSER TO U P000 SCSTP000 AP: BROWSE1 T/P000 USIBMSC.SCSTP000 1 SCSCPAA1 5378 T 10:16:55.068 .0051 CSMI CICSUSER TO UM X1 SCSCPAA1 FS:F--- DFHMIRS T/X1 PAA1 USIBMSC.SCSTP000 1 SCSCPTA1 82125 T 10:16:55.067 .0029 BR1 CICSUSER TO U P000 SCSTP000 AP: BROWSE1 T/P000 USIBMSC.SCSTP000 1 SCSCPAA1 5410 T 10:16:55.480 .0094 CSMI CICSUSER TO UM X2 SCSCPAA1 FS:F--- DFHMIRS T/X2 PAA1 USIBMSC.SCSTP000 1 SCSCPTA1 82144 T 10:16:55.480 .0068 - - - - - - - - - - - - - - - - - - - - - - - - - - - - - - - - - 127 Line(s) not Displayed BR1 CICSUSER TO U P000 SCSTP000 AP: BROWSE1 T/P000 USIBMSC.SCSTP000 1 SCSCPAA1 23603 T 10:20:05.592 .0396 CSMI CICSUSER TO UM X1 SCSCPAA1 FS:F--- DFHMIRS T/X1 PAA1 USIBMSC.SCSTP000 1 SCSCPTA1 90062 T 10:20:05.592 .0390 CSMI CICSUSER TO UM <AY1 SCSCPTA1 FS:-I-- DFHMIRS T/<AY1 PTA1 USIBMSC.SCSTP000 1 SCSCPJA7 936 T 10:20:05.591 .0380 - - - - - - - - - - - - - - - - - - - - - - - - - - - - - - - - - 8 Line(s) not Displayed BR1 CICSUSER TO U P000 SCSTP000 AP: BROWSE1 T/P000 USIBMSC.SCSTP000 1 SCSCPAA1 25368 T 10:20:23.683 .0023 CSMI CICSUSER TO UM X1 SCSCPAA1 FS:F--- DFHMIRS T/X1 PAA1 USIBMSC.SCSTP000 1 SCSCPTA1 90837 T 10:20:23.682 .0014 - - - - - - - - - - - - - - - - - - - - - - - - - - - - - - - - - 33 Line(s) not Displayed BR1 CICSUSER TO U P000 SCSTP000 AP: BROWSE1 T/P000 USIBMSC.SCSTP000 1 SCSCPAA1 32717 T 10:21:41.648 .0345 CSMI CICSUSER TO UM X1 SCSCPAA1 FS:F--- DFHMIRS T/X1 PAA1 USIBMSC.SCSTP000 1 SCSCPTA1 94057 T 10:21:41.648 .0336 CSMI CICSUSER TO UM <AY1 SCSCPTA1 FS:-I-- DFHMIRS T/<AY1 PTA1 USIBMSC.SCSTP000 1 SCSCPJA7 1212 T 10:21:41.647 .0327 BR1 CICSUSER TO U P001 SCSTP001 AP: BROWSE1 T/P001 USIBMSC.SCSTP001 1 SCSCPAA1 4385 T 10:16:44.273 .1644 CSMI CICSUSER TO UM X3 SCSCPAA1 FS:F--- DFHMIRS T/X3 PAA1 USIBMSC.SCSTP001 1 SCSCPTA1 81677 T 10:16:44.273 .1612 CSMI CICSUSER TO UM <AY1 SCSCPTA1 FS:-I-- DFHMIRS T/<AY1 PTA1 USIBMSC.SCSTP001 1 SCSCPJA7 379 T 10:16:44.273 .1601
- - - - - - - - - - - - - - - - - - - - - - - - - - - - - - - - - 150 Line(s) not Displayed BR1 CICSUSER TO U P001 SCSTP001 AP: BROWSE1 T/P001 USIBMSC.SCSTP001 1 SCSCPAA1 26432 T 10:20:33.884 .0049 CSMI CICSUSER TO UM X1 SCSCPAA1 FS:F--- DFHMIRS T/X1 PAA1 USIBMSC.SCSTP001 1 SCSCPTA1 91296 T 10:20:33.883 .0026 - - - - - - - - - - - - - - - - - - - - - - - - - - - - - - - - - 143 Line(s) not Displayed BR1 CICSUSER TO U P002 SCSTP002 AP: BROWSE1 T/P002 USIBMSC.SCSTP002 1 SCSCPAA1 11351 T 10:17:57.549 .0481 CSMI CICSUSER TO UM X2 SCSCPAA1 FS:F--- DFHMIRS T/X2 PAA1 USIBMSC.SCSTP002 1 SCSCPTA1 84739 T 10:17:57.549 .0471 CSMI CICSUSER TO UM <AY1 SCSCPTA1 FS:-I-- DFHMIRS T/<AY1 PTA1 USIBMSC.SCSTP002 1 SCSCPJA7 589 T 10:17:57.549 .0460
1
2
3 4 5 6 7 8
Chapter 18. Using CICS Performance Analyzer reports for problem determination 405

tasks 1. However, for many units of work, you see multiple CSMI tasks 2. In addition, when there are multiple CSMI tasks associated with a BR1 transaction unit of work, the response times are longer. The interpretation of the data from the BR1 entry and the first CSMI entry shown in area 2 of the report in Figure 18-26 is the same as in Figure 18-25 on page 404 so we only discuss the second CSMI here.
The second CSMI task in area 2 shows that while the application was running, it issued EXEC CICS commands, which caused Interval Control function shipping requests 5 to be sent from region SCSCPTA1 4 to SCSCPJA7 7. The Interval Control requests ran the CSMI mirror transaction 3 in SCSCPJA7 on session <AY1 6 as task number 379 8.
In the Cross-System Work report from after the application changes, we’ve seen that, if a unit of work has only a line for the BR1 transaction and a single line for a CSMI transaction, the response times are approximately the same as they were before application changes were made. It is only those units of work where there are multiple CSMI mirror tasks where the function shipping activity takes longer.
Now we want to investigate the function shipping activity in more detail for these tasks.
18.7 Producing the File Usage detailed list reportThis section uses the File Usage detailed list report to investigate the type of file access changes that were introduced to our application.
We take a closer look at the function shipped file control requests issued during the BR1 transaction’s unit of work. The Cross-System Work reports we produced show us that the file access is performed for our BR1 transaction by the CSMI mirror task in the FOR. The File Usage detailed list report can provide a more granular analysis of file control requests, telling us both which files are accessed as well as what types of access is occurring.
We started by collecting the task numbers for several CSMI tasks appearing in our Cross-System Work report from Figure 18-26 on page 405. We wanted a representative sample from the BR1 units of work that have one CSMI task associated with them, as well as several with multiple CSMI tasks associated with them. We created an Object containing task numbers for CSMI tasks that we want to look at. We did this, because producing the File Usage detailed list report without any selection criteria would produce a much larger report than we wanted to work with. We named our Object List CSMIFSHP, and filled it with the transaction numbers shown in Table 18-2.
Table 18-2 Task numbers for CSMI transactions
We returned to the Report Set screen and typed line action S next to Transaction Resource Usage List report. The screen shown in Figure 18-27 is displayed.
Single CSMI in BR1 unit of work Multiple CSMI in BR1 unit of work
82125821448291084257878488912690837912969213892594
81677833658410584482847398676690062908249278394057
406 CICS Performance Analyzer

Figure 18-27 Transaction Resource Usage Report screen
We selected only the File Usage detailed report, provided a meaningful title, typed line action S next to Performance selection criteria, and pressed Enter. The screen in Figure 18-28 is displayed.
Figure 18-28 Performance Select Statement screen
We left the date and time fields in the Report Interval section blank, and entered an INC selection criteria for task numbers that are in the CSMIFSHP object list that we created. We pressed F3 repeatedly to return to the Report Set screen. Then we entered line action RUN to submit the job. When the job completed, we received the report shown in Figure 18-29.
File Systems Options Help ------------------------------------------------------------------------------ BASELINE - Transaction Resource Usage Report Command ===> System Selection: Report Output: APPLID . . + DDname . . . . . . . . . RESU0001 Image . . + Print Lines per Page . . (1-255) Group . . + Detailed List Reports Required: / File Usage Temporary Storage Report Format: Title . . Selected CSMI File Uses Report Selection Criteria: S Performance
We select only File Usage
We enter a title and line action S
File Edit Object Lists Options Help ------------------------------------------------------------------------------ BASELINE - Performance Select Statement Row 1 of 9 More: > Command ===> Scroll ===> CSR Active --------------- Report Interval ---------------- Inc Start -------- From --------- --------- To ---------- Exc Stop MM/DD/YYYY HH:MM:SS.TH MM/DD/YYYY HH:MM:SS.TH ------------------------------------------------------------------------------ Inc Field --- Value or Range --- Object / Exc Name + Type Value/From To List + INC TASKNO CSMIFSHP
We only want specific task numbers
Chapter 18. Using CICS Performance Analyzer reports for problem determination 407

Figure 18-29 File Use Detail Report for selected CSMI transactions
Report area 1 shows the details for task number 82910, a CSMI for a BR1 task that had only one CSMI task in the unit of work. Area 2 shows the details for task number 83365, a CSMI
V1R3M0 CICS Performance Analyzer Transaction Resource Usage List __________________________________________________ RESU0001 Printed at 8:54:48 9/30/2003 Data from 10:16:44 9/24/2003 Page 1 Selected CSMI File Uses Report Request Fcty Conn UOW R Response Tran Userid SC TranType Term LUName Type Program T/Name Name NETName APPLID Task Seq T Stop Time Time ---- -------- -- -------- ---- -------- ------- -------- ------ ---- ----------------- -------- ---- --- - ------------ -------- CSMI CICSUSER TO UM X3 SCSCPAA1 FS:F--- DFHMIRS T/X3 PAA1 USIBMSC.SCSTP001 SCSCPTA1 81677 1 T 10:16:44.273 .1612 ********************** FC Calls ********************* ******* I/O Waits ******** AccMeth File Get Put Browse Add Delete Total File RLS CFDT Requests -------- -------- -------- -------- -------- -------- -------- -------- -------- -------- -------- VENDORX Elapse .0000 .0000 .0018 .0000 .0000 .0018 .0000 .0000 .0000 Count 0 0 151 0 0 152 0 0 0 153 ---- -------- -- -------- ---- -------- ------- -------- ------ ---- ----------------- -------- ---- --- - ------------ -------- CSMI CICSUSER TO UM X1 SCSCPAA1 FS:F--- DFHMIRS T/X1 PAA1 USIBMSC.SCSTP000 SCSCPTA1 82125 1 T 10:16:55.067 .0029 ********************** FC Calls ********************* ******* I/O Waits ******** AccMeth File Get Put Browse Add Delete Total File RLS CFDT Requests -------- -------- -------- -------- -------- -------- -------- -------- -------- -------- -------- VENDORX Elapse .0000 .0000 .0000 .0000 .0000 .0001 .0000 .0000 .0000 Count 0 0 4 0 0 5 0 0 0 6 ---- -------- -- -------- ---- -------- ------- -------- ------ ---- ----------------- -------- ---- --- - ------------ -------- CSMI CICSUSER TO UM X2 SCSCPAA1 FS:F--- DFHMIRS T/X2 PAA1 USIBMSC.SCSTP000 SCSCPTA1 82144 1 T 10:16:55.480 .0068 ********************** FC Calls ********************* ******* I/O Waits ******** AccMeth File Get Put Browse Add Delete Total File RLS CFDT Requests -------- -------- -------- -------- -------- -------- -------- -------- -------- -------- -------- VENDORX Elapse .0000 .0000 .0000 .0000 .0000 .0001 .0000 .0000 .0000 Count 0 0 4 0 0 5 0 0 0 6 ---- -------- -- -------- ---- -------- ------- -------- ------ ---- ----------------- -------- ---- --- - ------------ -------- CSMI CICSUSER TO UM X1 SCSCPAA1 FS:F--- DFHMIRS T/X1 PAA1 USIBMSC.SCSTP002 SCSCPTA1 82910 1 T 10:17:14.294 .0046 ********************** FC Calls ********************* ******* I/O Waits ******** AccMeth File Get Put Browse Add Delete Total File RLS CFDT Requests -------- -------- -------- -------- -------- -------- -------- -------- -------- -------- -------- VENDORX Elapse .0000 .0000 .0000 .0000 .0000 .0001 .0000 .0000 .0000 Count 0 0 4 0 0 5 0 0 0 6 ---- -------- -- -------- ---- -------- ------- -------- ------ ---- ----------------- -------- ---- --- - ------------ -------- CSMI CICSUSER TO UM X1 SCSCPAA1 FS:F--- DFHMIRS T/X1 PAA1 USIBMSC.SCSTP004 SCSCPTA1 83365 1 T 10:17:25.365 .0846 ********************** FC Calls ********************* ******* I/O Waits ******** AccMeth File Get Put Browse Add Delete Total File RLS CFDT Requests -------- -------- -------- -------- -------- -------- -------- -------- -------- -------- -------- VENDORX Elapse .0000 .0000 .0013 .0000 .0000 .0013 .0000 .0000 .0000 Count 0 0 151 0 0 152 0 0 0 153 ---- -------- -- -------- ---- -------- ------- -------- ------ ---- ----------------- -------- ---- --- - ------------ -------- CSMI CICSUSER TO UM X1 SCSCPAA1 FS:F--- DFHMIRS T/X1 PAA1 USIBMSC.SCSTP005 SCSCPTA1 84105 1 T 10:17:42.664 .0548 ********************** FC Calls ********************* ******* I/O Waits ******** AccMeth File Get Put Browse Add Delete Total File RLS CFDT Requests -------- -------- -------- -------- -------- -------- -------- -------- -------- -------- -------- VENDORX Elapse .0000 .0000 .0014 .0000 .0000 .0014 .0000 .0000 .0000 Count 0 0 151 0 0 152 0 0 0 153 ---- -------- -- -------- ---- -------- ------- -------- ------ ---- ----------------- -------- ---- --- - ------------ -------- CSMI CICSUSER TO UM X1 SCSCPAA1 FS:F--- DFHMIRS T/X1 PAA1 USIBMSC.SCSTP001 SCSCPTA1 84257 1 T 10:17:46.195 .0046 ********************** FC Calls ********************* ******* I/O Waits ******** AccMeth File Get Put Browse Add Delete Total File RLS CFDT Requests -------- -------- -------- -------- -------- -------- -------- -------- -------- -------- -------- VENDORX Elapse .0000 .0000 .0000 .0000 .0000 .0001 .0000 .0000 .0000 Count 0 0 4 0 0 5 0 0 0 6
- - - - - - - - - - - - - - - - - - - - - - - - - - - - - - - - - 177 Line(s) not Displayed
1
2
3
4
408 CICS Performance Analyzer

for a BR1 task that had multiple CSMI tasks in the unit of work. Comparing the rest of the transactions in the report, these two seem to be representative of the pattern of file use.
By comparing the file access patterns, you quickly see that both tasks are browsing file VENDORX. Our tasks with the higher response time are making 151 browse calls to file control 4, while our quickly responding tasks only make four 3.
This file is in an FOR and is remote from where the application program making the request is running. The new changes to program BROWSE1 are causing many more browse requests on the VENDORX file, and these requests are all being function shipped from SCSCPAA1 to SCSCPTA1. Function shipping browse requests causes two flows in the network for each record requested. For large numbers of calls, the overhead can be unacceptably high.
18.8 The second CSMI mirror taskNext we investigate the reason for the second CSMI mirror task associated with these longer running BR1 transactions. We already know that the additional function shipping for browse requests on the VENDORX file are responsible for the longer IRIOWTT suspend. But we wanted to see more details about the CSMI task that is involved in interval control.
To do so, we ran a list report using one of the supplied sample report forms. From the CICS PA Primary Option Menu, we selected option 3 to go to the Report Forms screen. From there, we could either enter the SAMPLES command and press Enter or use the SAMPLES action bar choice and choose option 1 from the list. The Sample Report Forms screen in Figure 18-30 is displayed.
Figure 18-30 Sample Report Forms
We pressed F8 to page down through the list until we reached the ICLST sample form. We typed line action S next to it and pressed Enter. Then we pressed F3 to save our selection.
--------------------------------------------------------------- Sample Report Forms Row 30 to 45 of 90 Command ===> Scroll ===> CSR Select one or more Sample Report Forms then press EXIT. Name Type Description FDSPLST LIST First Dispatch Delay Analysis FDSPSUM SUMMARY First Dispatch Delay Analysis FEPILST LIST FEPI Request Activity FEPISUM SUMMARY FEPI Request Activity S ICLST LIST Interval Control Activity ICSUM SUMMARY Interval Control Activity IMSDBLST LIST Transaction DBCTL Usage Analysis IMSDBSUM SUMMARY Transaction DBCTL Usage Analysis IMSRQLST LIST Transaction DBCTL Req Analysis IMSRQSUM SUMMARY Transaction DBCTL Req Analysis IMSSUM SUMMARY IMS DBCTL PSB Usage Analysis JCLST LIST Journaling/Logging Activity JCSUM SUMMARY Journaling/Logging Activity JVMLST LIST Java Virtual Machine Analysis JVMSUM SUMMARY Java Virtual Machine Analysis PCLST LIST Program Request Activity .......... ..........---------------------------------------------------------------
We paged down and placed the S line action next to Interval Control Activity List report sample form
Chapter 18. Using CICS Performance Analyzer reports for problem determination 409

We returned to the Report Set screen, typed line action S next to the List report, and pressed Enter. We already produced the List report before, so a line entry for a List report is displayed on the screen. We typed line action S and pressed Enter. The screen in Figure 18-31 is displayed.
Figure 18-31 Performance List report screen
We selected APPLID SCSCPJA7 and Report Form ICLST, and entered line action S to edit the Performance selection criteria. To limit the size of the report, we specified that we are only interested in CSMI transactions in a 10 second time interval from 10:16:42 to 10:16:52. We pressed F3 until we returned to the Report Set screen. We entered the RUN line action to submit the job. When the job completed, we received the report shown in Figure 18-32.
Figure 18-32 Interval Control List Report
We find task number 379, which also appeared in our Cross-System Work report in Figure 18-26 on page 405. We see that this task issued one interval control start command. We went back to the application program and found that an EXEC CICS START TRAN command was added as part of the application changes. Our BR1 transaction ran in
File Systems Options Help ------------------------------------------------------------------------------ BASELINE - Performance List Report Command ===> System Selection: Report Output: APPLID . . SCSCPJA7 + DDname . . . . . . . . . LIST0001 Image . . SC66 + Print Lines per Page . . (1-255) Group . . + Report Format: Form . . . ICLST + Title . . Selection Criteria: S Performance *
We placed the cursor in the Form field and pressed F4 to select from the list of available report forms
We use the S line action and specify transaction CSMI and a small time interval in order to reduce the amount of output produced
We select APPLID SCSCPJA7, since we are only concerned about mirror tasks in that region
V1R3M0 CICS Performance Analyzer Performance List __________________________________________________ LIST0001 Printed at 18:55:59 10/07/2003 Data from 10:16:42 9/24/2003 APPLID SCSCPJA7 Page 1 Transaction Interval Control Usage and Wait Analysis - Detail Tran Userid TaskNo Stop ICSTART IC Total IC Delay IC Delay CICSWait CICSWait Time Time Count Time Count CSMI CICSUSER 377 10:16:42.927 1 1 .0000 0 .0000 0 CSMI CICSUSER 379 10:16:44.273 1 1 .0000 0 .0000 0 CSMI CICSUSER 381 10:16:44.640 1 1 .0000 0 .0000 0 CSMI CICSUSER 383 10:16:44.749 1 1 .0000 0 .0000 0 CSMI CICSUSER 385 10:16:45.017 1 1 .0000 0 .0000 0 CSMI CICSUSER 387 10:16:45.324 1 1 .0000 0 .0000 0 CSMI CICSUSER 389 10:16:46.229 1 1 .0000 0 .0000 0 CSMI CICSUSER 391 10:16:46.674 1 1 .0000 0 .0000 0 CSMI CICSUSER 393 10:16:46.933 1 1 .0000 0 .0000 0 CSMI CICSUSER 395 10:16:47.397 1 1 .0000 0 .0000 0 ......... .........
This was the second mirror task from Figure 18-26 on page 405
410 CICS Performance Analyzer

SCSCPAA1, but the transaction that was being started ran in SCSCPJA7, so CICS had to run a mirror task in SCSCPJA7 to start the new application transaction.
All of the CSMI transactions which ran in SCSCPJA7 during our time interval were for interval control start commands. The additional mirror task was not responsible for adding significant suspend time so we did not investigate it further.
At this point, we have enough information to discuss with the applications programming group responsible for program BROWSE1. We can discuss what the program changes were supposed to accomplish and if other more efficient methods exist to accomplish the same task. If there are no programmatic alternatives, there are still some options that the CICS Systems Programmer can take to improve the situation.
18.9 Options to improve transaction BR1 performanceThis section discusses two different options the CICS Systems Programmer has to improve the response time for transaction BR1.
18.9.1 Define the VENDORX file as a CICS Maintained Data TableIf the application cannot perform its task without browsing the VENDORX file, then the CICS Systems Programmer has a couple of options open to them. The first option is to eliminate the function shipping activity for read requests on the VENDORX file.
Our past experience with the VENDORX file indicates that a high percentage of the file requests are for read-only access. This type of access pattern is one of the things that makes it a good candidate for a CICS Maintained Data Table (CMDT). A major benefit of making VENDORX a CMDT is that function shipping is avoided for most read and browse requests. Without function shipping, we eliminate the IRIOWTT MRO link wait time for file control requests from our response time for transaction BR1.
To accomplish this change and measure the impact, we changed the VENDORX File definition to make it a CMDT in region SCSCPTA1. We ran the same TPNS workload and produced a Performance Summary report. Figure 18-33 shows that report.
Figure 18-33 Performance Summary with VENDORX as a CMDT
V1R3M0 CICS Performance Analyzer Performance Summary __________________________________________________ SUMM0001 Printed at 8:19:07 10/01/2003 Data from 07:43:53 10/01/2003 to 07:48:53 10/01/2003 Page 1 File VENDORX changed to a CMDT Avg Max Avg Avg Avg Max Avg Avg Avg Avg Avg Avg Tran #Tasks Response Response Dispatch User CPU Suspend Suspend DispWait FC Wait FCAMRq IR Wait SC24UHWM SC31UHWM Time Time Time Time Time Time Time Time Time BR1 859 .0097 .4000 .0051 .0037 .0045 .3201 .0006 .0000 0 .0023 432 33232 CSMI 12491 .0207 1.1531 .0012 .0009 .0194 1.1485 .0009 .0066 18 .0123 0 3 HX1 608 .0151 .4401 .0029 .0021 .0122 .4347 .0012 .0000 0 .0094 432 92758 IX2 1306 .0269 .9202 .0054 .0041 .0215 .8844 .0040 .0000 0 .0177 432 92758 IX8 1719 .0352 1.2923 .0049 .0039 .0302 1.2826 .0033 .0000 0 .0273 432 92721 PX2 2161 .0248 .9254 .0056 .0043 .0192 .9134 .0035 .0000 0 .0160 432 92682 PX3 1961 .0356 1.1494 .0081 .0064 .0274 1.1171 .0057 .0000 0 .0237 432 92741 SX2 651 .0612 1.2326 .0055 .0043 .0557 1.2238 .0056 .0000 0 .0521 432 92748 SX4 414 .0215 .4005 .0044 .0035 .0171 .3943 .0013 .0000 0 .0134 432 92594 SX6 2203 .0176 .6675 .0032 .0024 .0144 .6479 .0015 .0000 0 .0114 432 92703
Compare with the figures from Figure 18-13 on page 397
Chapter 18. Using CICS Performance Analyzer reports for problem determination 411

In the report, the average response time for transaction BR1 was reduced to .0097 from the high of .0446 seconds in Figure 18-13 on page 397. Also the average Dispatch Wait time, which increased by 1450%, is now comparable to what it was before any application changes were made. And the average IR Wait Time is now less than its original value from Figure 18-12 on page 396.
18.9.2 Define the VENDORX file locallyIn the CMDT scenario, we let CICS load the entire VENDORX file into a data table. For large application files, this may not be a viable option. Another option that you can choose to help improve transaction BR1 response time is to move the VENDORX file out of the FOR and back into SCSCPAA1. This eliminates all function shipping for VENDORX file requests from applications in this AOR.
To accomplish this change and measure the impact, we changed the VENDORX File definition to make it a local file in SCSCPAA1. We then ran the same TPNS workload and produced a Performance Summary report. Figure 18-34 shows that report.
Figure 18-34 Performance Summary with VENDORX as a local file
Now the average response time for transaction BR1 is reduced to .0090 from the high of .0446 seconds in Figure 18-13 on page 397. Also the average Dispatch Wait time and the average IR Wait Time are back to their levels before any application changes were implemented.
An added benefit of moving the file to the AOR is that the average response time for transaction SX4, which updates the VENDORX file, is reduced by 63% from what we saw in Figure 18-12 on page 396.
18.10 Future problem determination effortsWe created several reports, all of which are useful in diagnosing future performance problems with this application. Instead of running them individually in separate jobs, you can run all reports in a single pass of SMF data. This is the benefit of the Report Set.
We specified the report interval in the selection criteria for each report. To use these reports as a set in the future, we don’t want to have to update each report with new time ranges. CICS PA allows you to specify the time range independent of each individual report.
V1R3M0 CICS Performance Analyzer Performance Summary __________________________________________________ SUMMLOCL Printed at 8:39:08 10/01/2003 Data from 08:07:13 10/01/2003 to 08:12:13 10/01/2003 Page 1 File VENDORX changed to be a local file Avg Max Avg Avg Avg Max Avg Avg Avg Avg Avg Avg Tran #Tasks Response Response Dispatch User CPU Suspend Suspend DispWait FC Wait FCAMRq IR Wait SC24UHWM SC31UHWM Time Time Time Time Time Time Time Time Time BR1 859 .0090 .1404 .0051 .0038 .0039 .1246 .0002 .0000 80 .0021 432 33232 CSMI 11458 .0163 .5656 .0012 .0009 .0151 .5640 .0008 .0039 17 .0109 0 3 HX1 611 .0128 .1293 .0030 .0021 .0098 .1266 .0004 .0000 0 .0074 432 92569 IX2 1303 .0224 .2652 .0052 .0041 .0172 .2587 .0022 .0000 0 .0146 432 92535 IX8 1723 .0283 .2049 .0049 .0039 .0234 .2001 .0017 .0000 0 .0213 432 92532 PX2 2166 .0218 .3717 .0055 .0043 .0163 .3635 .0022 .0000 0 .0138 432 92514 PX3 1969 .0307 .5760 .0081 .0064 .0226 .5575 .0032 .0000 0 .0202 432 92468 SX2 652 .0581 .6916 .0076 .0057 .0505 .6817 .0083 .0257 36 .0000 432 92429 SX4 413 .0092 .1210 .0044 .0034 .0048 .1151 .0005 .0026 27 .0000 432 92688 SX6 2208 .0154 .4924 .0031 .0023 .0123 .4651 .0007 .0000 0 .0101 432 92490
Compare with the figures from Figure 18-13 on page 397
412 CICS Performance Analyzer
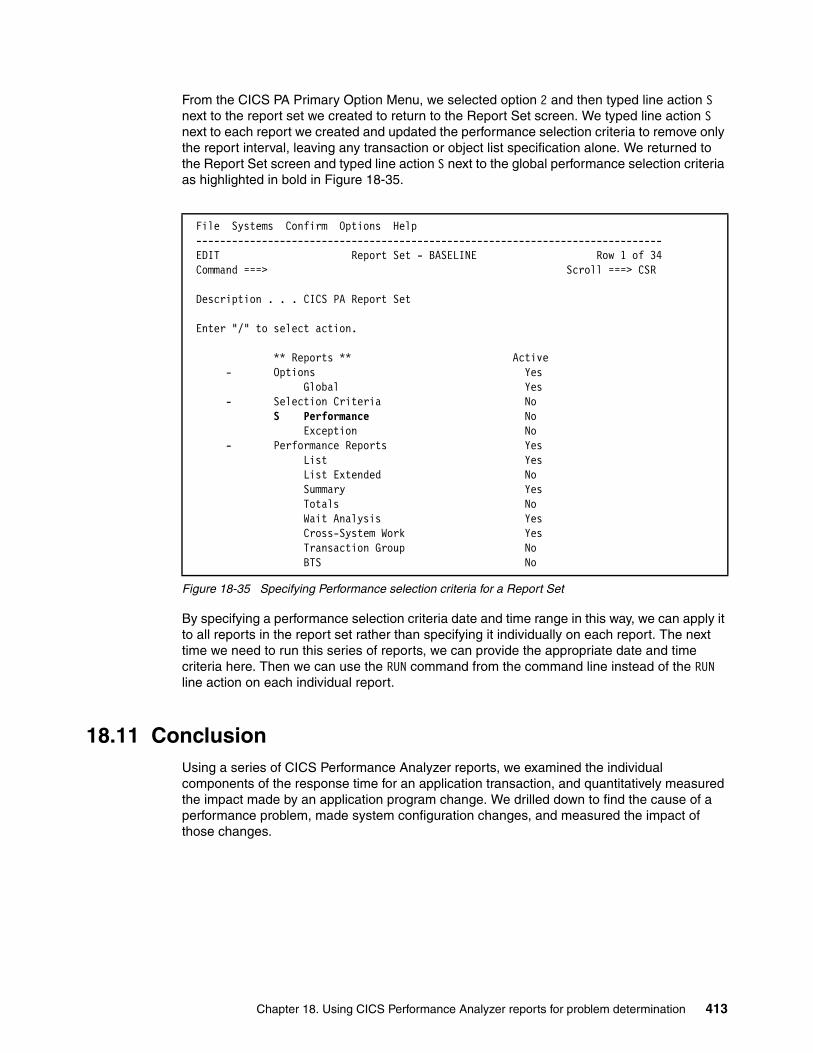
From the CICS PA Primary Option Menu, we selected option 2 and then typed line action S next to the report set we created to return to the Report Set screen. We typed line action S next to each report we created and updated the performance selection criteria to remove only the report interval, leaving any transaction or object list specification alone. We returned to the Report Set screen and typed line action S next to the global performance selection criteria as highlighted in bold in Figure 18-35.
Figure 18-35 Specifying Performance selection criteria for a Report Set
By specifying a performance selection criteria date and time range in this way, we can apply it to all reports in the report set rather than specifying it individually on each report. The next time we need to run this series of reports, we can provide the appropriate date and time criteria here. Then we can use the RUN command from the command line instead of the RUN line action on each individual report.
18.11 ConclusionUsing a series of CICS Performance Analyzer reports, we examined the individual components of the response time for an application transaction, and quantitatively measured the impact made by an application program change. We drilled down to find the cause of a performance problem, made system configuration changes, and measured the impact of those changes.
File Systems Confirm Options Help ------------------------------------------------------------------------------ EDIT Report Set - BASELINE Row 1 of 34 Command ===> Scroll ===> CSR Description . . . CICS PA Report Set Enter "/" to select action. ** Reports ** Active - Options Yes Global Yes - Selection Criteria No S Performance No Exception No - Performance Reports Yes List Yes List Extended No Summary Yes Totals No Wait Analysis Yes Cross-System Work Yes Transaction Group No BTS No
Chapter 18. Using CICS Performance Analyzer reports for problem determination 413
414 CICS Performance Analyzer

Chapter 19. Historical Database
CICS Performance Analyzer (PA) V1.3 introduces the Historical Database (HDB), which enables you to collect and manage historical performance data for your CICS systems. It is a repository of CICS-related performance data by which you can maintain a history of CICS transactions. Reporting can be done on a list or a summary base. For more details, see Part 4 “Using the Historical Database (HDB)” in the CICS Performance Analyzer for z/OS User’s Guide, SC34-6307.
This chapter explains how to use the Historical Database. We concentrate on the summary Historical Database. We work through a workload scenario and show the different functions and reports that are available in the HDB.
19
© Copyright IBM Corp. 2003. All rights reserved. 415

19.1 Introduction to the HDBFigure 19-1 provides a visual overview of the HDB. The register is a VSAM KSDS that can contain information about several different HDBs. An HDB is a description of data that is loaded in containers. The data in the containers is copied from CICS system management facility (SMF) records. The most important characteristics that are kept in an HDB tell which type of data is collected, summary or list. They also indicate which SMF fields are copied to the container records, the filtering criteria, the location of the data sets that represent the containers, and how long the containers must exist before deletion.
Figure 19-1 Overview of the HDB
19.2 System setup and scenario overviewFigure 19-2 shows the system setup of the Teleprocessing Network Simulator (TPNS) environment and the CICS regions that we used in this scenario.
Figure 19-2 System setup for DB2 workload
Container
HDB
HDB
HDBCharacteristics
Type: summ/listSelected fieldsRetention periodFiltering criteriaLoaded data
Container
Container
Register
TPNS
3270 DB2 workload
PTA2PTA1
PJA7PJA6
SC66
SC47
DB2
416 CICS Performance Analyzer

On MVS image SC47, we used TPNS to simulate a 3270 workload on the shown CICS regions in MVS image SC66.
PTA1 and PTA2 are the SYSIDs of two TOR regions. PJA6 and PJA7 are the AORs. PTA1 does static routing of all incoming transactions to PJA7. PTA2 does static routing to PJA6. The two AORs are connected to the same DB2 system.
In a first run, three DB2 transactions are executed:
� DB2N executes program PROGDB2N, which executes 15 fetches from the DB2 provided sample table DSN8710.EMP. Between each fetch, there is a non-threadsafe EXEC CICS command. PROGDB2N is defined with CONCURRENCY(QUASIRENT).
� DB2R executes program PROGDB2R, which executes 15 fetches from the DB2 provided sample table DSN8710.EMP. There are no non-threadsafe EXEC CICS commands in this program so that it is defined with CONCURRENCY(THREADSAFE).
� DB2U executes program PROGDB2U that is an update application. It sends a BMS map to the 3270 screen. It gives the option to cancel the application or to perform a retrieve and update on the PHONENO field of table DSN8710.EMP. PROGDB2U is defined with CONCURRENCY(THREADSAFE).
In a later phase of the scenario, a fourth transaction is added. DB2V executes program PROGDB2V, which is a second update application. It contains only one SQL statement that performs an update of the PHONENO field of table DSN8710.EMP. PROGDB2V is defined with CONCURRENCY(QUASIRENT).
19.3 CICS changesAuthorized program analysis report (APAR) PQ76703 adds new monitoring and statistics functions to CICS TS 2.2. One of the new options specifies whether you want additional monitoring performance class data to be collected for the resource managers used by your transactions. This way, the time spent in the External Resource Managers (ERM) is added in different new Resource Manager Interface (RMI) fields in the SMF record. This option is activated via a new RMI parameter on the TYPE=INITIAL macro of the monitoring control table (MCT).
Before running this scenario, we assembled the MCT that is shown in Example 19-1. It shows the specification of the RMI=YES parameter and the suffix that we must specify for the MCT parameter in the SIT or SYSIN overriding of CICS.
Example 19-1 MCT with RMI=YES
RMI DFHMCT TYPE=INITIAL, * APPLNAME=YES, * FILE=10, * RMI=YES, * SUFFIX=RM * DFHMCT TYPE=FINAL END
In this scenario, we include the DB2 RMI field in the reports that we print with CICS PA.
Chapter 19. Historical Database 417

19.4 Using the HDBThis chapter goes through the different options that are introduced by the Historical Database Manager. It starts by showing the different steps we had to go through to load and report from a Summary HDB. Then it discusses additional maintenance and housekeeping functions. Finally it uses a List HDB to demonstrate the export function that allows you to load the data from an HDB into a DB2 table.
19.4.1 Summary HDBThe usage of a summary HDB is similar to using performance summary reports. The records that are written to the HDB summarize transaction activity over a specified time interval. This reduces the amount of data written to the HDB. By measuring a set of transactions that issue DB2 SQL requests, we show you how to load, report, and interpret summary data.
From the CICS Performance Analyzer Primary Option Menu, we entered option 5 to select Historical Database as shown in Figure 19-3.
Figure 19-3 Primary Option Menu: Selecting Historical Database
The Historical Database Menu (Figure 19-4) that opens shows the facilities of the Historical Database Manager.
Figure 19-4 HDB primary menu
You must specify the name of the HDB register before you enter any option from the HDB menu. The HDB register is the inventory of all information associated with the CICS PA Historical Database Manager. The HDB register contains HDB definitions, data set definitions for HDB containers and the HDB templates. You can define as many registers as required.
V1R3M0 CICS Performance Analyzer - Primary Option Menu Option ===> 5_________________________________________________________ 0 CICS PA Profile Customize your CICS PA dialog profile 1 System Definitions Specify CICS Systems, SMF Files and Groups 2 Report Sets Request and submit reports and extracts 3 Report Forms Define Report Forms 4 Object Lists Define Object Lists 5 Historical Database Collect and process historical data X Exit Terminate CICS PA
File Options Help ------------------------------------------------------------------------------ Historical Database Menu Option ===> 1 1 Templates Design HDB Templates 2 Define Define a new HDB 3 Load Load data into the HDBs 4 Report Submit HDB report requests 5 Export Export HDB data sets to DB2 6 Maintenance Maintain HDB definitions and data sets 7 Housekeeping Perform HDB housekeeping HDB Register . . . 'CICSRS4.CICSPA.HDB.DB2TREND' +
418 CICS Performance Analyzer

However, only one register can be used at a time. We recommend that you define only one register. This allows users to share performance data.
As shown in Figure 19-5, we selected option 1 to create an HDB template and specified the name of the HDB register we wanted to use. Since this is the first action, the HDB register must still be created. CICS PA prompts for the required information to create the VSAM KSDS for the HDB register. As suggested in the CICS Performance Analyzer for z/OS User’s Guide, SC34-6307, we specified the allocation unit of cylinders with a primary and secondary quantity of 1. We decided that the HDB register had to be allocated on volume TOTSTR.
Figure 19-5 HDB allocation information
CICS PA automatically allocates the VSAM data set for the HDB and shows the IDCAMS output, as shown in Figure 19-6.
Figure 19-6 IDCAMS output from the DEFINE CLUSTER of the HDB register
We pressed F3 to go to the empty HDB Templates screen (Figure 19-7). HDB templates allow you to define the type and format of the data in the HDB. This is similar to the way Report
---------------------------- Historical Database ---------------------------- Define HDB Register Command ===> Enter "/" to select option Edit IDCAMS command Browse errors only HDB Register Name . . 'CICSRS4.CICSPA.HDB.DB2TREND' Cluster Level Information: Space Units . . . . . 1 1. Cylinders Primary Quantity . . . 1 2. Tracks Secondary Quantity . . 1 3. Records 4. Kilobytes 5. Megabytes Volume . . . . . . . . TOTSTR Data Class . . . . . . Management Class . . . Storage Class . . . .
IDCAMS SYSTEM SERVICES TIME: 11:11:01 10/02/03 PAGE 1 DEFINE CLUSTER(NAME(CICSRS4.CICSPA.HDB.DB2TREND) - INDEXED - CYLINDERS(1 1) - SHR(3,3) - FREESPACE(10 10) - REUSE - VOLUMES(TOTSTR) - ) - DATA(NAME(CICSRS4.CICSPA.HDB.DB2TREND.DATA) - KEYS(64 0)- RECORDSIZE(1024 32756)) - INDEX(NAME(CICSRS4.CICSPA.HDB.DB2TREND.INDEX)) IDC0508I DATA ALLOCATION STATUS FOR VOLUME TOTSTR IS 0 IDC0509I INDEX ALLOCATION STATUS FOR VOLUME TOTSTR IS 0 IDC0001I FUNCTION COMPLETED, HIGHEST CONDITION CODE WAS 0 IDC0002I IDCAMS PROCESSING COMPLETE. MAXIMUM CONDITION CODE WAS 0 **************************************************** Bottom of Data *****************************************************
Chapter 19. Historical Database 419

Forms define the type and format of the data in a report. Using the NEW command, we entered the name of the template that we were going to define, which was DB2TRNDS.
Figure 19-7 HDB Templates screen to create the DB2TRNDS template
CICS PA presents a pop-up screen (Figure 19-8), where we selected the type of template that we wanted to use. We selected option 2 for a summary template because we wanted to look for a trend in the DB2 transactions.
Figure 19-8 Selecting a summary template
The next screen asks for the contents of the template. On this screen, we edited the template format and content to meet our specific reporting and analysis requirements. For this summary template, we chose to have the fields as shown in Figure 19-9. Notice also that we typed line action S next to the Performance selection criteria option. Selection criteria can be specified to apply filtering to the data being collected by the HDB template.
File Options Help ------------------------------------------------------------------------------ HDB Templates Command ===> NEW DB2TRNDS Scroll ===> CSR Select to edit Template. Enter NEW command to define a new Template. / Name Type Description Changed ID ********************************* End of list *********************************
--------------------- Historical Database --------------------- File Systems Options Help ------------------------------------------------------------ New HDB Template Command ===> Specify the name of the new Template and its options. Name . . . . . DB2TRNDS APPLID . . . . + Version (VRM) . . + MVS Image . . Field Categories Type 2 1. List 2. Summary
420 CICS Performance Analyzer

Figure 19-9 Field selection of the DB2TRNDS template
Presuming that CICS is running all day, we entered a five minute time interval from a peak period in the Performance Select Statement screen (Figure 19-10). We did not specify a date, because we intended to look at an extract of the SMF records that is taken every day at the same time. We chose only to have reports about transactions with names that start with DB2.
File Edit Confirm Upgrade Options Help ------------------------------------------------------------------------------ EDIT Summary Template - DB2TRNDS Row 1 of 231 More: > Command ===> Scroll ===> CSR Description . . . Summary Template for DB2TREND Version (VRM): 620 Selection Criteria: s Performance Time Interval . . 00:01:00 (hh:mm:ss) Field / Name + K Description START A Task start time APPLID A CICS Generic APPLID TRAN A Transaction identifier TASKCNT Total Task count RESPONSE Transaction response time DISPATCH Dispatch time CPU CPU time SUSPEND Suspend time L8CPU CICS L8 TCB dispatch time DISPWAIT Redispatch wait time DB2CONWT DB2 Connection wait time DB2RDYQW DB2 Thread wait time DB2REQCT DB2 requests DB2WAIT DB2 SQL/IFI wait time
CHMODECT Change-TCB modes requests MAXOTDLY MAXOPENTCBS wait time RMIDB2 RMI elapsed time for DB2 requests IRWAIT MRO link wait time DSPDELAY First dispatch wait time RMIOTHER RMI other elapsed time RMITOTAL RMI total elapsed time RMIOTIME Resource Manager Interface (RMI) other time RMISUSP Resource Manager Interface (RMI) suspend time RMITIME Resource Manager Interface (RMI) elapsed time
Chapter 19. Historical Database 421

Figure 19-10 DB2TRNDS selection criteria
This ends the creation of the summary template. We pressed F3 until we reached the Historical Database Menu, where we entered option 2 to define the HDB itself. As shown in Figure 19-11, we entered the name and description, the name of the template to be used, the data retention period, and the information for the storage space allocation and attributes for the container data set that will hold the data. Since this is a summary HDB, we did not have to allocate big data sets.
Figure 19-11 DB2TRNDS HDB definition
File Edit Object Lists Options Help ------------------------------------------------------------------------------ DB2TRNDS - Performance Select Statement Row 1 of 1 More: > Command ===> Scroll ===> CSR Active --------------- Report Interval ---------------- Inc Start -------- From --------- --------- To ---------- Exc Stop MM/DD/YYYY HH:MM:SS.TH MM/DD/YYYY HH:MM:SS.TH INC START 10:55:00.00 11:00:00.00 ------------------------------------------------------------------------------ Inc Field --- Value or Range --- Object / Exc Name + Type Value/From To List + INC TRAN DB2* ********************************* End of list *********************************
File Systems Options Help ------------------------------------------------------------------------------ New HDB Definition Command ===> Specify new HDB definition options then press EXIT to save. Name . . . . . . DB2TRNDS APPLID + Image Description . . DB2TREND HDB HDB Format: Selection Criteria: Template . . . DB2TRNDS + Performance Data Retention Period: Years . . Months . . Weeks . . 1 Days . . Hours . . Data Set Allocation Settings: DSN Prefix . . . . . . CICSRS4 Management class . . . (Blank for default management class) Storage class . . . . (Blank for default storage class) Volume serial . . . . (Blank for system default volume) Device type . . . . . (Generic unit or device address) Data class . . . . . . (Blank for default data class) Space Units . . . . . CYLS (TRKS, CYLS) Primary quantity . . 1 (In above units) Secondary quantity 1 (In above units)
422 CICS Performance Analyzer

We pressed F3 to create the definition. Back on the Historical Database Menu, we selected option 3 to load the data into a container. Figure 19-12 shows the Load HDBs screen with our first HDB, which we selected.
Figure 19-12 Selecting DB2TRNDS HDB on the Load HDBs screen
Figure 19-13 shows Load Summary screen which is displayed next. We did not complete any parameters on this screen. We pressed Enter twice to see the generated JCL of the load job.
Figure 19-13 Load SUMMARY for DB2TRNDS HDB
The JCL in Example 19-2 shows that we are using multiple SMF input data sets. In our scenario, the SMF data sets filled up and switched several times. The original SMF data sets were archived to the data sets that you see in the different SMFINxx data sets. The archived data sets are in a generation data group (GDG) that contains 30 data sets. SMF data that must be kept for a longer time requires a manual copy. After loading the HDB, we no longer needed these data sets because all the reporting came from the data stored in the HDB.
Example 19-2 Generated JCL for loading the DB2TRNDS HDB
// JOB //* CICSPA V1R3 HDB LOAD JCL //CICSPA EXEC PGM=CPAMAIN //STEPLIB DD DSN=CPA13.SCPALINK, // DISP=SHR //CPAHDBRG DD DSN=CICSRS4.CICSPA.HDB.DB2TREND, // DISP=SHR //SYSPRINT DD SYSOUT=*
File Options Help ------------------------------------------------------------------------------ Load HDBs Row 1 to 1 of 1 Command ===> Scroll ===> CSR Select to load an HDB. Name Type Description Changed ID s DB2TRNDS SUMMARY DB2TREND HDB 2003/10/02 13:23 CICSRS4 ********************************* End of list *********************************
File Systems Options Help -------------------------------------------------------------------------- Load SUMMARY HDB DB2TRNDS Command ===> Specify HDB load options then press Enter to continue submit. ----- Report Interval ------ System Selection: MM/DD/YYYY HH:MM:SS.TH APPLID . . + From Image . . SC66 + To Group . . + Enter "/" to select option / Edit JCL before submit
Chapter 19. Historical Database 423

//* SMF Input Files //SMFIN001 DD DSN=SMFDATA.CICSRECS.G0409V00, // DISP=SHR //SMFIN002 DD DSN=SMFDATA.CICSRECS.G0410V00, // DISP=SHR //SMFIN003 DD DSN=SMFDATA.CICSRECS.G0411V00, // DISP=SHR //SMFIN004 DD DSN=SMFDATA.CICSRECS.G0412V00, // DISP=SHR //SMFIN005 DD DSN=SMFDATA.CICSRECS.G0413V00, // DISP=SHR //SMFIN006 DD DSN=SMFDATA.CICSRECS.G0414V00, // DISP=SHR//SMFIN007 DD DSN=SMFDATA.CICSRECS.G0415V00, // DISP=SHR //SMFIN008 DD DSN=SMFDATA.CICSRECS.G0416V00, // DISP=SHR //* Command Input //SYSIN DD * * Report Set =DB2TRNDS * Description=CICSPA HDB request * Reports for Image=SC66 * Description=System added by take-up CICSPA IN(SMFIN001, SMFIN002, SMFIN003, SMFIN004, SMFIN005, SMFIN006, SMFIN007, SMFIN008), NOAPPLID, LINECNT(60), FORMAT(':','/'), HDB(OUTPUT(HDBL0001),LOAD(DB2TRNDS)) /*
Notice that the time selection that we entered in the template Performance select statement in Figure 19-10 on page 422 is kept in the HDB. It is not visible in the CICS PA commands. If you need to change the time limits, you go again through the CICS PA screens to update the template selection criteria before you submit the job.
We entered the SUB command on the JCL edit screen to submit the load job. Figure 19-14 shows the recap report of the load job.
Figure 19-14 HDB LOAD Recap Report
V1R3M0 CICS Performance Analyzer HDB LOAD Recap Report __________________________________________________ HDBL0001 Printed at 15:53:04 10/02/2003 Data from 10:54:00 10/02/2003 to 10:59:00 10/02/2003 Page 1 LOAD requested for HDB: DB2TRNDS Register DSN: CICSRS4.CICSPA.HDB.DB2TREND The following Container(s) were created and loaded: Container DSN: CICSRS4.DB2TRNDS.D03275.T155302.HDB No of Records: 62 Start Timestamp: 2003-10-02-10.54.00 End Timestamp: 2003-10-02-10.59.00 LOAD process complete.
424 CICS Performance Analyzer
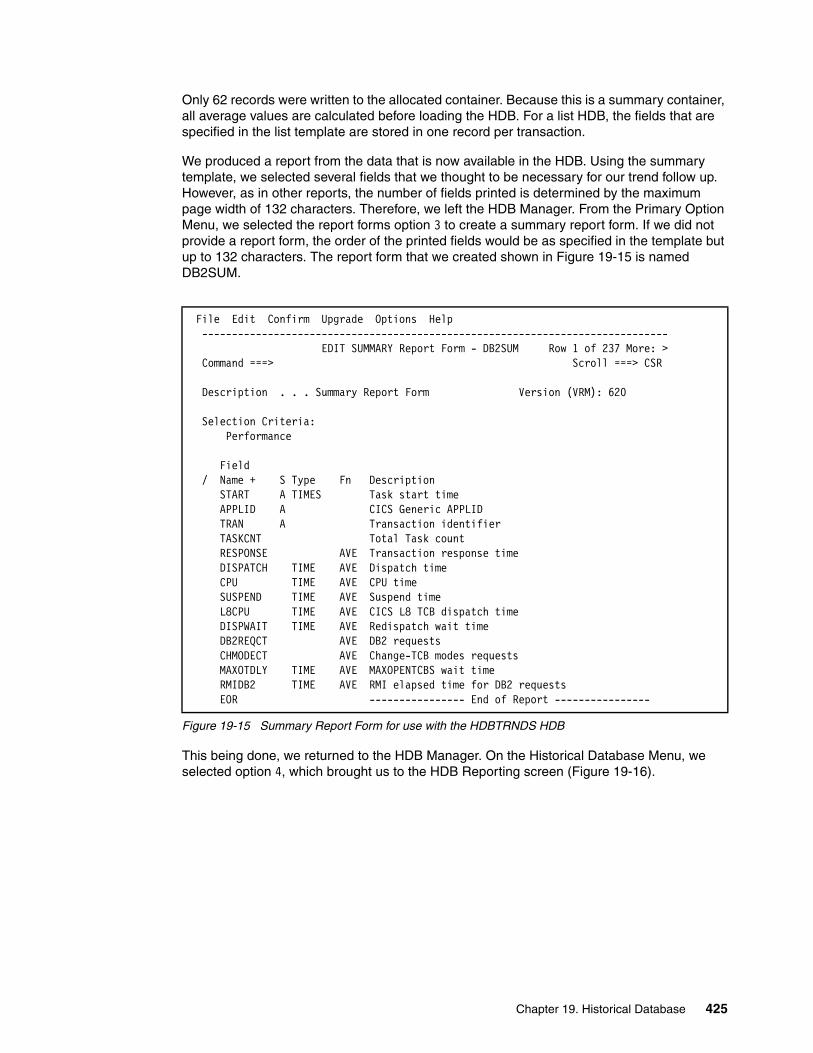
Only 62 records were written to the allocated container. Because this is a summary container, all average values are calculated before loading the HDB. For a list HDB, the fields that are specified in the list template are stored in one record per transaction.
We produced a report from the data that is now available in the HDB. Using the summary template, we selected several fields that we thought to be necessary for our trend follow up. However, as in other reports, the number of fields printed is determined by the maximum page width of 132 characters. Therefore, we left the HDB Manager. From the Primary Option Menu, we selected the report forms option 3 to create a summary report form. If we did not provide a report form, the order of the printed fields would be as specified in the template but up to 132 characters. The report form that we created shown in Figure 19-15 is named DB2SUM.
Figure 19-15 Summary Report Form for use with the HDBTRNDS HDB
This being done, we returned to the HDB Manager. On the Historical Database Menu, we selected option 4, which brought us to the HDB Reporting screen (Figure 19-16).
File Edit Confirm Upgrade Options Help ------------------------------------------------------------------------------ EDIT SUMMARY Report Form - DB2SUM Row 1 of 237 More: > Command ===> Scroll ===> CSR Description . . . Summary Report Form Version (VRM): 620 Selection Criteria: Performance Field / Name + S Type Fn Description START A TIMES Task start time APPLID A CICS Generic APPLID TRAN A Transaction identifier TASKCNT Total Task count RESPONSE AVE Transaction response time DISPATCH TIME AVE Dispatch time CPU TIME AVE CPU time SUSPEND TIME AVE Suspend time L8CPU TIME AVE CICS L8 TCB dispatch time DISPWAIT TIME AVE Redispatch wait time DB2REQCT AVE DB2 requests CHMODECT AVE Change-TCB modes requests MAXOTDLY TIME AVE MAXOPENTCBS wait time RMIDB2 TIME AVE RMI elapsed time for DB2 requests
EOR ---------------- End of Report ----------------
Chapter 19. Historical Database 425

Figure 19-16 Selecting the DB2TRNDS HDB for reporting
We selected the DB2TRNDS Historical Database. Then the Run SUMMAR HDB Report screen (Figure 19-17) is displayed. We entered the name of the summary report form that we created and left all other fields on their default value.
Figure 19-17 Run SUMMARY HDB report for HDB DB2TRNDS
Example 19-3 shows the resulting JCL that is generated. At the bottom of the JCL, you can see a DD statement for the container data set that is used for printing the requested report. If there were more containers, they would all be listed in this generated JCL. As the comments in the JCL explain, this DD statement is there only for reference and is not required.
Example 19-3 Generated JCL for printing the DB2TRNDS HDB
// JOB //* CICSPA V1R3 HDB Report JCL //CICSPA EXEC PGM=CPAMAIN //STEPLIB DD DSN=CPA13.SCPALINK, // DISP=SHR //CPAHDBRG DD DSN=CICSRS4.CICSPA.HDB.DB2TREND, // DISP=SHR //SYSPRINT DD SYSOUT=* //* Command Input
File Options Help ------------------------------------------------------------------------------ HDB Reporting Row 1 to 1 of 1 Command ===> Scroll ===> CSR Select to run report. Name Type Description Changed ID s DB2TRNDS SUMMARY DB2TREND HDB 2003/10/02 13:23 CICSRS4 ********************************* End of list *********************************
File Options Help --------------------------------------------------------------------------- Run SUMMARY HDB Report - DB2TRNDS Command ===> Specify Report request options then press Enter to continue submit. Report Format: ----- Report Interval ------ Report Form . . DB2SUM + MM/DD/YYYY HH:MM:SS.TH From To Processing Options: Reporting Options: Time Interval . . 00:01:00 (hh:mm:ss) Exclude Totals Enter "/" to select option / Edit JCL before submit HDB contains data from 2003/10/02 10:54 to 2003/10/02 10:59.
426 CICS Performance Analyzer

//SYSIN DD * * Report Set =DB2TRNDS * Description=CICSPA HDB request CICSPA NOAPPLID, LINECNT(60), FORMAT(':','/'), HDB(OUTPUT(HDBR0001),REPORT(DB2TRNDS), INTERVAL(00:01:00), FIELDS(START(TIMES), APPLID, TRAN, TASKCNT,
RESPONSE(AVE), DISPATCH(TIME(AVE)), CPU(TIME(AVE)), SUSPEND(TIME(AVE)), L8CPU(TIME(AVE)), DISPWAIT(TIME(AVE)), DB2REQCT(AVE), CHMODECT(AVE), MAXOTDLY(TIME(AVE)), RMIDB2(TIME(AVE)))) /* //* HDB Container Data Sets. HDB Report processing does not require //* these data sets to be included in the JCL as they are dynamically //* allocated when required. They are included: //* 1) for your reference //* 2) to ensure that all required data sets are cataloged //* 3) to allow DFHSM to recall required data sets up front //HDB00001 DD DISP=SHR,DSN=CICSRS4.DB2TRNDS.D03275.T155302.HDB
After submitting this JCL, we received our first report shown in Figure 19-18 and Figure 19-19 on page 429.
You can ignore the first lines of this report. They show a start time of 10:54. These are transactions that started before but ended within the time interval that we specified. We do not print them again in the following reports.
Within the time interval, you see, for each APPLID, a list of the selected transactions. After each group of transactions, a total for this group is inserted and at the end of each time interval an additional grand total is printed. Note that these totals can be left out by selecting the Exclude Totals option on the Run SUMMARY HDB Reporting screen.
This is a rather long report because this example shows a one minute default time interval. Bigger time intervals result in less data written to the container and therefore smaller reports. An optimal reporting interval must be found between the amount of data loaded and the level of detail of the report. We decided that for the next results, we would report on the five minutes interval that we collect data for our measurements.
Chapter 19. Historical Database 427

Figure 19-18 Summary report output of the DB2TRNDS HDB (Part 1 of 2)
V1R3M0 CICS Performance Analyzer Historical Database Summary __________________________________________________ HDBR0001 Printed at 15:59:08 10/02/2003 Data from 10:54:00 10/02/2003 to 10:59:00 10/02/2003 Page 1
Avg Avg Avg Avg Avg Avg Avg Avg Avg Avg Start APPLID Tran Tasks Response Dispatch User CPU Suspend L8 CPU DispWait DB2 Reqs ChngMode MaxOTDly RMI DB2 Interval Time Time Time Time Time Time Time Time 2003/10/02 10:54 SCSCPJA6 DB2N 1 .2476 .0056 .0035 .2420 .0025 .2399 17 36 .0000 .0040 2003/10/02 10:54 SCSCPJA6 DB2U 6 .1907 .0445 .0012 .1461 .0006 .0735 1 2 .0000 .0070 2003/10/02 10:54 SCSCPJA6 7 .1988 .0390 .0015 .1598 .0009 .0972 3 7 .0000 .0065 2003/10/02 10:54 7 .1988 .0390 .0015 .1598 .0009 .0972 3 7 .0000 .0065 2003/10/02 10:55 SCSCPJA6 DB2N 1224 .0215 .0077 .0027 .0137 .0017 .0121 17 36 .0000 .0062 2003/10/02 10:55 SCSCPJA6 DB2R 1418 .0114 .0071 .0022 .0043 .0016 .0027 17 4 .0000 .0060 2003/10/02 10:55 SCSCPJA6 DB2U 6895 .0063 .0038 .0009 .0025 .0004 .0012 0 2 .0000 .0030 2003/10/02 10:55 SCSCPJA6 9537 .0090 .0048 .0013 .0042 .0007 .0028 5 7 .0000 .0039 2003/10/02 10:55 SCSCPJA7 DB2N 1276 .0206 .0072 .0026 .0134 .0017 .0117 17 36 .0000 .0058 2003/10/02 10:55 SCSCPJA7 DB2R 1421 .0114 .0071 .0022 .0043 .0015 .0028 17 4 .0000 .0059 2003/10/02 10:55 SCSCPJA7 DB2U 6794 .0062 .0037 .0009 .0024 .0004 .0012 0 2 .0000 .0029 2003/10/02 10:55 SCSCPJA7 9491 .0089 .0047 .0013 .0042 .0007 .0028 5 7 .0000 .0037 2003/10/02 10:55 SCSCPTA1 DB2N 1276 .0317 .0014 .0004 .0304 .0000 .0021 0 0 .0000 .0000 2003/10/02 10:55 SCSCPTA1 DB2R 1421 .0228 .0014 .0004 .0214 .0000 .0026 0 0 .0000 .0000 2003/10/02 10:55 SCSCPTA1 DB2U 6794 .0178 .0017 .0003 .0161 .0000 .0019 0 0 .0000 .0000 2003/10/02 10:55 SCSCPTA1 9491 .0204 .0016 .0003 .0188 .0000 .0020 0 0 .0000 .0000 2003/10/02 10:55 SCSCPTA2 DB2N 1224 .0321 .0013 .0003 .0308 .0000 .0017 0 0 .0000 .0000 2003/10/02 10:55 SCSCPTA2 DB2R 1418 .0223 .0013 .0004 .0209 .0000 .0023 0 0 .0000 .0000 2003/10/02 10:55 SCSCPTA2 DB2U 6895 .0177 .0017 .0003 .0160 .0000 .0018 0 0 .0000 .0000 2003/10/02 10:55 SCSCPTA2 9537 .0203 .0016 .0003 .0186 .0000 .0019 0 0 .0000 .0000 2003/10/02 10:55 38056 .0146 .0032 .0008 .0115 .0004 .0024 3 3 .0000 .0019
2003/10/02 10:56 SCSCPJA6 DB2N 1180 .0218 .0077 .0027 .0142 .0017 .0120 17 36 .0002 .0062 2003/10/02 10:56 SCSCPJA6 DB2R 1423 .0120 .0072 .0022 .0048 .0015 .0028 17 4 .0001 .0060 2003/10/02 10:56 SCSCPJA6 DB2U 6825 .0065 .0038 .0009 .0027 .0004 .0012 1 2 .0000 .0030 2003/10/02 10:56 SCSCPJA6 9428 .0093 .0048 .0013 .0045 .0007 .0028 5 7 .0001 .0038 2003/10/02 10:56 SCSCPJA7 DB2N 1216 .0213 .0075 .0026 .0138 .0017 .0121 17 36 .0001 .0060 2003/10/02 10:56 SCSCPJA7 DB2R 1469 .0113 .0069 .0022 .0044 .0015 .0028 17 4 .0001 .0057 2003/10/02 10:56 SCSCPJA7 DB2U 6695 .0066 .0039 .0009 .0026 .0004 .0012 1 2 .0000 .0031 2003/10/02 10:56 SCSCPJA7 9380 .0092 .0048 .0013 .0044 .0008 .0029 5 7 .0001 .0039 2003/10/02 10:56 SCSCPTA1 DB2N 1216 .0326 .0014 .0004 .0312 .0000 .0019 0 0 .0000 .0000 2003/10/02 10:56 SCSCPTA1 DB2R 1469 .0223 .0014 .0004 .0209 .0000 .0024 0 0 .0000 .0000 2003/10/02 10:56 SCSCPTA1 DB2U 6695 .0183 .0018 .0003 .0165 .0000 .0018 0 0 .0000 .0000 2003/10/02 10:56 SCSCPTA1 9380 .0208 .0017 .0003 .0191 .0000 .0019 0 0 .0000 .0000 2003/10/02 10:56 SCSCPTA2 DB2N 1180 .0321 .0014 .0003 .0308 .0000 .0021 0 0 .0000 .0000 2003/10/02 10:56 SCSCPTA2 DB2R 1423 .0238 .0013 .0004 .0224 .0000 .0030 0 0 .0000 .0000 2003/10/02 10:56 SCSCPTA2 DB2U 6825 .0181 .0018 .0003 .0163 .0000 .0019 0 0 .0000 .0000 2003/10/02 10:56 SCSCPTA2 9428 .0207 .0017 .0003 .0191 .0000 .0021 0 0 .0000 .0000 2003/10/02 10:56 37616 .0150 .0032 .0008 .0118 .0004 .0024 3 3 .0000 .0019 2003/10/02 10:57 SCSCPJA6 DB2N 1181 .0229 .0077 .0027 .0153 .0017 .0132 17 36 .0000 .0061 2003/10/02 10:57 SCSCPJA6 DB2R 1393 .0124 .0077 .0022 .0047 .0016 .0031 17 4 .0000 .0065 2003/10/02 10:57 SCSCPJA6 DB2U 6893 .0073 .0042 .0009 .0030 .0004 .0013 1 2 .0000 .0034 2003/10/02 10:57 SCSCPJA6 9467 .0100 .0052 .0013 .0048 .0007 .0031 5 7 .0000 .0042 2003/10/02 10:57 SCSCPJA7 DB2N 1193 .0224 .0081 .0026 .0143 .0017 .0124 17 36 .0000 .0066 2003/10/02 10:57 SCSCPJA7 DB2R 1490 .0127 .0077 .0022 .0050 .0015 .0032 17 4 .0000 .0064 2003/10/02 10:57 SCSCPJA7 DB2U 6712 .0071 .0043 .0009 .0028 .0004 .0013 0 2 .0000 .0035 2003/10/02 10:57 SCSCPJA7 9395 .0100 .0053 .0013 .0046 .0007 .0030 5 7 .0000 .0043 2003/10/02 10:57 SCSCPTA1 DB2N 1193 .0354 .0014 .0004 .0340 .0000 .0022 0 0 .0000 .0000 2003/10/02 10:57 SCSCPTA1 DB2R 1490 .0266 .0014 .0004 .0251 .0000 .0034 0 0 .0000 .0000
428 CICS Performance Analyzer

Figure 19-19 Summary report output of the DB2TRNDS HDB (Part 2 of 2)
Loading the HDB with summary records can be a daily process so that a trend in transaction behavior is easy to follow in the report. A graph produced with these daily results would show severe fluctuations when they would appear.
For the next load of data to the HDB, we could have gone to the Systems Definition Menu of CICS PA and assigned a set of new SMF input data sets to system SC66. Then we again could have used the load option on the Historical Database Menu to generate a new load JCL and submit the job.
However, when we submitted the load job the first time, we decided to save the JCL in a separate JCL library. CICS PA uses a temporary library for generating the JCL. You find the name of this data set on the EDIT line of the ISPF panel (Figure 19-20).
V1R3M0 CICS Performance Analyzer Historical Database Summary __________________________________________________ DBR0001 Printed at 15:59:08 10/02/2003 Data from 10:54:00 10/02/2003 to 10:59:00 10/02/2003 Page 2
Avg Avg Avg Avg Avg Avg Avg Avg Avg Avg Start APPLID Tran Tasks Response Dispatch User CPU Suspend L8 CPU DispWait DB2 Reqs ChngMode MaxOTDly RMI DB2 Interval Time Time Time Time Time Time Time Time 2003/10/02 10:57 SCSCPTA1 DB2U 6712 .0209 .0018 .0003 .0191 .0000 .0024 0 0 .0000 .0000 2003/10/02 10:57 SCSCPTA1 9395 .0237 .0017 .0004 .0219 .0000 .0025 0 0 .0000 .0000 2003/10/02 10:57 SCSCPTA2 DB2N 1181 .0352 .0014 .0004 .0338 .0000 .0018 0 0 .0000 .0000 2003/10/02 10:57 SCSCPTA2 DB2R 1393 .0262 .0016 .0004 .0246 .0000 .0031 0 0 .0000 .0000 2003/10/02 10:57 SCSCPTA2 DB2U 6893 .0210 .0018 .0003 .0191 .0000 .0025 0 0 .0000 .0000 2003/10/02 10:57 SCSCPTA2 9467 .0235 .0017 .0003 .0218 .0000 .0025 0 0 .0000 .0000 2003/10/02 10:57 37724 .0168 .0035 .0008 .0133 .0004 .0028 3 3 .0000 .0021 2003/10/02 10:58 SCSCPJA6 DB2N 1149 .0230 .0079 .0027 .0151 .0017 .0128 17 36 .0002 .0064 2003/10/02 10:58 SCSCPJA6 DB2R 1489 .0122 .0072 .0022 .0049 .0015 .0028 17 4 .0002 .0061 2003/10/02 10:58 SCSCPJA6 DB2U 6711 .0069 .0039 .0009 .0029 .0004 .0012 0 2 .0001 .0032 2003/10/02 10:58 SCSCPJA6 9349 .0097 .0049 .0013 .0047 .0008 .0029 5 6 .0002 .0040 2003/10/02 10:58 SCSCPJA7 DB2N 1167 .0223 .0079 .0026 .0144 .0017 .0127 17 36 .0000 .0065 2003/10/02 10:58 SCSCPJA7 DB2R 1477 .0128 .0079 .0022 .0048 .0015 .0031 17 4 .0001 .0068 2003/10/02 10:58 SCSCPJA7 DB2U 6715 .0066 .0040 .0009 .0025 .0004 .0012 1 2 .0000 .0032 2003/10/02 10:58 SCSCPJA7 9359 .0095 .0051 .0013 .0044 .0007 .0029 5 7 .0000 .0042 2003/10/02 10:58 SCSCPTA1 DB2N 1167 .0347 .0014 .0004 .0334 .0000 .0023 0 0 .0000 .0000 2003/10/02 10:58 SCSCPTA1 DB2R 1477 .0263 .0014 .0004 .0248 .0000 .0031 0 0 .0000 .0000 2003/10/02 10:58 SCSCPTA1 DB2U 6719 .0197 .0018 .0003 .0179 .0000 .0022 0 0 .0000 .0000 2003/10/02 10:58 SCSCPTA1 9363 .0226 .0017 .0003 .0209 .0000 .0023 0 0 .0000 .0000 2003/10/02 10:58 SCSCPTA2 DB2N 1149 .0354 .0014 .0003 .0339 .0000 .0021 0 0 .0000 .0000 2003/10/02 10:58 SCSCPTA2 DB2R 1489 .0244 .0014 .0004 .0230 .0000 .0024 0 0 .0000 .0000 2003/10/02 10:58 SCSCPTA2 DB2U 6718 .0201 .0018 .0003 .0184 .0000 .0022 0 0 .0000 .0000 2003/10/02 10:58 SCSCPTA2 9356 .0227 .0017 .0003 .0210 .0000 .0022 0 0 .0000 .0000 2003/10/02 10:58 37427 .0161 .0034 .0008 .0128 .0004 .0026 3 3 .0000 .0021 2003/10/02 10:59 SCSCPJA6 DB2N 1471 .0251 .0082 .0026 .0168 .0017 .0134 17 36 .0014 .0068 2003/10/02 10:59 SCSCPJA6 DB2R 1758 .0151 .0084 .0022 .0067 .0015 .0033 17 4 .0012 .0073 2003/10/02 10:59 SCSCPJA6 DB2U 7941 .0083 .0047 .0009 .0036 .0004 .0013 0 2 .0005 .0040 2003/10/02 10:59 SCSCPJA6 11170 .0115 .0057 .0013 .0058 .0008 .0032 5 7 .0007 .0049 2003/10/02 10:59 SCSCPJA7 DB2N 1432 .0257 .0086 .0026 .0171 .0017 .0139 17 36 .0007 .0072 2003/10/02 10:59 SCSCPJA7 DB2R 1647 .0136 .0081 .0022 .0055 .0015 .0030 17 4 .0003 .0071 2003/10/02 10:59 SCSCPJA7 DB2U 8151 .0079 .0045 .0009 .0033 .0004 .0014 0 2 .0003 .0037 2003/10/02 10:59 SCSCPJA7 11230 .0110 .0056 .0013 .0054 .0007 .0032 5 7 .0003 .0047 2003/10/02 10:59 SCSCPTA1 DB2N 1437 .0417 .0017 .0004 .0400 .0000 .0037 0 0 .0000 .0000 2003/10/02 10:59 SCSCPTA1 DB2R 1653 .0301 .0015 .0004 .0286 .0000 .0041 0 0 .0000 .0000 2003/10/02 10:59 SCSCPTA1 DB2U 8163 .0236 .0019 .0003 .0217 .0000 .0032 0 0 .0000 .0000 2003/10/02 10:59 SCSCPTA1 11253 .0269 .0018 .0004 .0251 .0000 .0034 0 0 .0000 .0000 2003/10/02 10:59 SCSCPTA2 DB2N 1472 .0396 .0015 .0003 .0381 .0000 .0034 0 0 .0000 .0000 2003/10/02 10:59 SCSCPTA2 DB2R 1759 .0301 .0015 .0004 .0286 .0000 .0039 0 0 .0000 .0000 2003/10/02 10:59 SCSCPTA2 DB2U 7952 .0243 .0020 .0003 .0223 .0000 .0033 0 0 .0000 .0000 2003/10/02 10:59 SCSCPTA2 11183 .0272 .0019 .0003 .0254 .0000 .0034 0 0 .0000 .0000 2003/10/02 10:59 44836 .0192 .0037 .0008 .0154 .0004 .0033 3 3 .0003 .0024
Chapter 19. Historical Database 429

Figure 19-20 Load JCL created in a temporary library
In ISPF split screen mode, we edited a new member from a JCL library and copied the content of the temporary data set containing the load JCL as shown in Example 19-2 on page 423 into our private library. As a second step of this job, in the same way, after the copy of the load job, we copied the JCL of the report job that is shown in Example 19-3 on page 426. The resulting job is shown in Example 19-4.
Because all information is contained in the HDB, there is no need to change the HDB control statement of the load step. We only had to change the SMF input data set names and eventually adapt the list of SMFINxxx DD cards in the CICS PA IN command.
As mentioned earlier, we decided to change the time interval for the report to 5 minutes. To do so, we manually changed the INTERVAL parameter of the report step.
Finally, we commented out the last line of the report step. The DD statement is there as reference for the container being used to print the report but is not required. We commented it out to avoid a JCL error in case the container would no longer exist.
The next day, when new SMF data sets became available, we submitted this job to produce a second report.
Example 19-4 Two step load and report job to be submitted from a private library
//CICSRS4L JOB (ACCOUNT),'NORBERT',MSGLEVEL=(1,1),NOTIFY=&SYSUID /*JOBPARM SYSAFF=SC66 //* CICSPA V1R3 HDB LOAD JCL //CICSPA EXEC PGM=CPAMAIN //STEPLIB DD DSN=CPA13.SCPALINK, // DISP=SHR //CPAHDBRG DD DSN=CICSRS4.CICSPA.HDB.DB2TREND, // DISP=SHR //SYSPRINT DD SYSOUT=* //* SMF Input Files //SMFIN001 DD DSN=SMFDATA.CICSRECS.G0449V00, // DISP=SHR //SMFIN002 DD DSN=SMFDATA.CICSRECS.G0450V00, // DISP=SHR //SMFIN003 DD DSN=SMFDATA.CICSRECS.G0451V00, // DISP=SHR //SMFIN004 DD DSN=SMFDATA.CICSRECS.G0452V00, // DISP=SHR
EDIT CICSRS4.SC66.SPFTEMP1.CNTL Columns 00001 00080 Command ===> Scroll ===> PAGE ****** ********************************* Top of Data ********************************** 000001 // JOB
000002 //* CICSPA V1R3 HDB LOAD JCL 000003 //CICSPA EXEC PGM=CPAMAIN 000004 //STEPLIB DD DSN=CPA13.SCPALINK, 000005 // DISP=SHR 000006 //CPAHDBRG DD DSN=CICSRS4.CICSPA.HDB.DB2TRND, 000007 // DISP=SHR 000008 //SYSPRINT DD SYSOUT=* 000009 //* SMF Input Files 000010 //SMFIN001 DD DSN=SMFDATA.CICSRECS.G0136V00, 000011 // DISP=SHR . . .
430 CICS Performance Analyzer

//SMFIN005 DD DSN=SMFDATA.CICSRECS.G0453V00, // DISP=SHR //* Command Input //SYSIN DD * * Report Set =DB2TRNDS * Description=CICSPA HDB request * Reports for Image=SC66 * Description=System added by take-up CICSPA IN(SMFIN001, SMFIN002, SMFIN003, SMFIN004, SMFIN005), NOAPPLID, LINECNT(60), FORMAT(':','/'), HDB(OUTPUT(HDBL0001),LOAD(DB2TRNDS)) /* //* CICSPA V1R3 HDB Report JCL //CICSPA EXEC PGM=CPAMAIN //STEPLIB DD DSN=CPA13.SCPALINK, // DISP=SHR //CPAHDBRG DD DSN=CICSRS4.CICSPA.HDB.DB2TREND, // DISP=SHR //SYSPRINT DD SYSOUT=* //* Command Input //SYSIN DD * * Report Set =DB2TRNDS * Description=CICSPA HDB request CICSPA NOAPPLID, LINECNT(60), FORMAT(':','/'), HDB(OUTPUT(HDBR0001),REPORT(DB2TRNDS), INTERVAL(00:05:00), FIELDS(START(TIMES), APPLID, TRAN, TASKCNT, RESPONSE(AVE), DISPATCH(TIME(AVE)), CPU(TIME(AVE)), SUSPEND(TIME(AVE)), L8CPU(TIME(AVE)), DISPWAIT(TIME(AVE)), DB2REQCT(AVE),
CHMODECT(AVE), MAXOTDLY(TIME(AVE)), RMIDB2(TIME(AVE)))) /* //* HDB Container Data Sets. HDB Report processing does not require //* these data sets to be included in the JCL as they are dynamically //* allocated when required. They are included: //* 1) for your reference //* 2) to ensure that all required data sets are cataloged //* 3) to allow DFHSM to recall required data sets up front //*HDB00001 DD DISP=SHR,DSN=CICSRS4.DB2TRNDS.D03275.T155302.HDB
The HDB LOAD Recap Report in Figure 19-21 shows the new container data set name and the updated time range of the data.
Chapter 19. Historical Database 431

Figure 19-21 HDB LOAD Recap Report from the second data load
Figure 19-22 shows the new report that is based on a reporting interval of five minutes.
Figure 19-22 HDB report containing the second day
V1R3M0 CICS Performance Analyzer HDB LOAD Recap Report __________________________________________________ HDBL0001 Printed at 15:09:27 10/03/2003 Data from 10:54:00 10/03/2003 to 10:59:00 10/03/2003 Page 1 LOAD requested for HDB: DB2TRNDS Register DSN: CICSRS4.CICSPA.HDB.DB2TREND The following Container(s) were created and loaded: Container DSN: CICSRS4.DB2TRNDS.D03276.T150925.HDB No of Records: 83 Start Timestamp: 2003-10-03-10.54.00 End Timestamp: 2003-10-03-10.59.00 LOAD process complete.
V1R3M0 CICS Performance Analyzer Historical Database Summary __________________________________________________ HDBR0001 Printed at 16:46:25 10/03/2003 Data from 10:54:00 10/02/2003 to 10:59:00 10/03/2003 Page 1 Avg Avg Avg Avg Avg Avg Avg Avg Avg Avg Start APPLID Tran Tasks Response Dispatch User CPU Suspend L8 CPU DispWait DB2 Reqs ChngMode MaxOTDly RMI DB2 Interval Time Time Time Time Time Time Time Time .
. 2003/10/02 10:55 SCSCPJA6 DB2N 6205 .0229 .0078 .0027 .0151 .0017 .0127 17 36 .0004 .0064 2003/10/02 10:55 SCSCPJA6 DB2R 7481 .0127 .0075 .0022 .0052 .0015 .0030 17 4 .0004 .0064 2003/10/02 10:55 SCSCPJA6 DB2U 35265 .0071 .0041 .0009 .0030 .0004 .0012 0 2 .0001 .0033 2003/10/02 10:55 SCSCPJA6 48951 .0100 .0051 .0013 .0048 .0008 .0029 5 7 .0002 .0042 2003/10/02 10:55 SCSCPJA7 DB2N 6284 .0226 .0079 .0026 .0147 .0017 .0126 17 36 .0002 .0064 2003/10/02 10:55 SCSCPJA7 DB2R 7504 .0124 .0075 .0022 .0048 .0015 .0030 17 4 .0001 .0064 2003/10/02 10:55 SCSCPJA7 DB2U 35067 .0069 .0041 .0009 .0028 .0004 .0012 0 2 .0001 .0033 2003/10/02 10:55 SCSCPJA7 48855 .0098 .0051 .0013 .0046 .0007 .0030 5 7 .0001 .0042 2003/10/02 10:55 SCSCPTA1 DB2N 6289 .0354 .0015 .0004 .0340 .0000 .0025 0 0 .0000 .0000 2003/10/02 10:55 SCSCPTA1 DB2R 7510 .0257 .0014 .0004 .0243 .0000 .0031 0 0 .0000 .0000 2003/10/02 10:55 SCSCPTA1 DB2U 35083 .0202 .0018 .0003 .0184 .0000 .0023 0 0 .0000 .0000 2003/10/02 10:55 SCSCPTA1 48882 .0230 .0017 .0003 .0213 .0000 .0025 0 0 .0000 .0000 2003/10/02 10:55 SCSCPTA2 DB2N 6206 .0351 .0014 .0003 .0337 .0000 .0023 0 0 .0000 .0000 2003/10/02 10:55 SCSCPTA2 DB2R 7482 .0256 .0014 .0004 .0241 .0000 .0030 0 0 .0000 .0000 2003/10/02 10:55 SCSCPTA2 DB2U 35283 .0204 .0018 .0003 .0185 .0000 .0024 0 0 .0000 .0000 2003/10/02 10:55 SCSCPTA2 48971 .0230 .0017 .0003 .0213 .0000 .0025 0 0 .0000 .0000 2003/10/02 10:55 195659 .0164 .0034 .0008 .0130 .0004 .0027 3 3 .0001 .0021 . .
2003/10/03 10:55 SCSCPJA6 DB2N 5819 .0243 .0093 .0027 .0150 .0018 .0126 17 36 .0003 .0078 2003/10/03 10:55 SCSCPJA6 DB2R 6991 .0139 .0086 .0022 .0052 .0016 .0031 17 4 .0002 .0075 2003/10/03 10:55 SCSCPJA6 DB2U 32380 .0078 .0048 .0009 .0030 .0004 .0013 0 2 .0001 .0040 2003/10/03 10:55 SCSCPJA6 DB2V 2281 .0147 .0103 .0013 .0044 .0009 .0024 1 4 .0002 .0097 2003/10/03 10:55 SCSCPJA6 47471 .0111 .0062 .0013 .0049 .0008 .0030 5 7 .0002 .0053 2003/10/03 10:55 SCSCPJA7 DB2N 5773 .0250 .0096 .0028 .0155 .0017 .0128 17 36 .0004 .0079 2003/10/03 10:55 SCSCPJA7 DB2R 6848 .0140 .0087 .0022 .0054 .0015 .0031 17 4 .0003 .0075 2003/10/03 10:55 SCSCPJA7 DB2U 32575 .0078 .0047 .0009 .0031 .0004 .0013 1 2 .0001 .0039 2003/10/03 10:55 SCSCPJA7 DB2V 2296 .0148 .0104 .0013 .0044 .0008 .0024 1 4 .0002 .0098 2003/10/03 10:55 SCSCPJA7 47492 .0112 .0062 .0014 .0050 .0008 .0030 5 7 .0002 .0052 2003/10/03 10:55 SCSCPTA1 DB2N 5771 .0388 .0014 .0004 .0373 .0000 .0025 0 0 .0000 .0000 2003/10/03 10:55 SCSCPTA1 DB2R 6851 .0287 .0015 .0004 .0272 .0000 .0036 0 0 .0000 .0000 2003/10/03 10:55 SCSCPTA1 DB2U 32577 .0220 .0019 .0004 .0201 .0000 .0025 0 0 .0000 .0000 2003/10/03 10:55 SCSCPTA1 DB2V 2296 .0301 .0013 .0003 .0288 .0000 .0030 0 0 .0000 .0000 2003/10/03 10:55 SCSCPTA1 47495 .0254 .0018 .0004 .0236 .0000 .0027 0 0 .0000 .0000 2003/10/03 10:55 SCSCPTA2 DB2N 5819 .0373 .0015 .0004 .0358 .0000 .0024 0 0 .0000 .0000 2003/10/03 10:55 SCSCPTA2 DB2R 6991 .0285 .0015 .0004 .0270 .0000 .0032 0 0 .0000 .0000 2003/10/03 10:55 SCSCPTA2 DB2U 32380 .0213 .0019 .0003 .0194 .0000 .0023 0 0 .0000 .0000 2003/10/03 10:55 SCSCPTA2 DB2V 2281 .0295 .0014 .0003 .0282 .0000 .0029 0 0 .0000 .0000 2003/10/03 10:55 SCSCPTA2 47471 .0247 .0018 .0004 .0229 .0000 .0025 0 0 .0000 .0000 2003/10/03 10:55 189929 .0181 .0040 .0009 .0141 .0004 .0028 2 3 .0001 .0026
432 CICS Performance Analyzer

This report shows one total per transaction per CICS region. We see that a new transaction, DB2V, was added to the running set of applications. Looking at the summary records for DB2N, DB2R and DB2U, we see that the second set of data shows an increase in the average response and suspend time.
We used Lotus 1-2-3 to visualize these reports by means of some charts. The bars in the charts represent the results from our first and second run ordered by transaction ID. Knowing that TOR PTA1 is routing all transactions to AOR PJA7, the graph in Figure 19-23 shows that the increase in PTA1 came from an increase in PJA7.
Figure 19-23 TOR PTA1 - AOR PJA7 response time comparison
Figure 19-24 shows that in PJA7 the dispatch time also increased for the three transactions. The CPU time only increased for DB2N. For the two other transactions, there is no difference. This comparison did not lead to a conclusion.
Figure 19-24 PJA7 Dispatch time and CPU time comparison
The new DB2 RMI time shown in Figure 19-25 shows that the increased elapsed time came from the longer time that we spent in the DB2 attachment.
DB2N DB2R DB2U DB2V0
0.01
0.02
0.03
0.04
0.05
PTA1 - Response time
DB2N DB2R DB2U DB2V0
0.005
0.01
0.015
0.02
0.025
0.03
PJA7 - Response time
DB2N DB2R DB2U DB2V0
0.002
0.004
0.006
0.008
0.01
0.012
PJA7 - Dispatch time
DB2N DB2R DB2U DB2V0
0.5
1
1.5
2
2.5
3
Tho
usan
dths
PJA7 - CPU time
Chapter 19. Historical Database 433
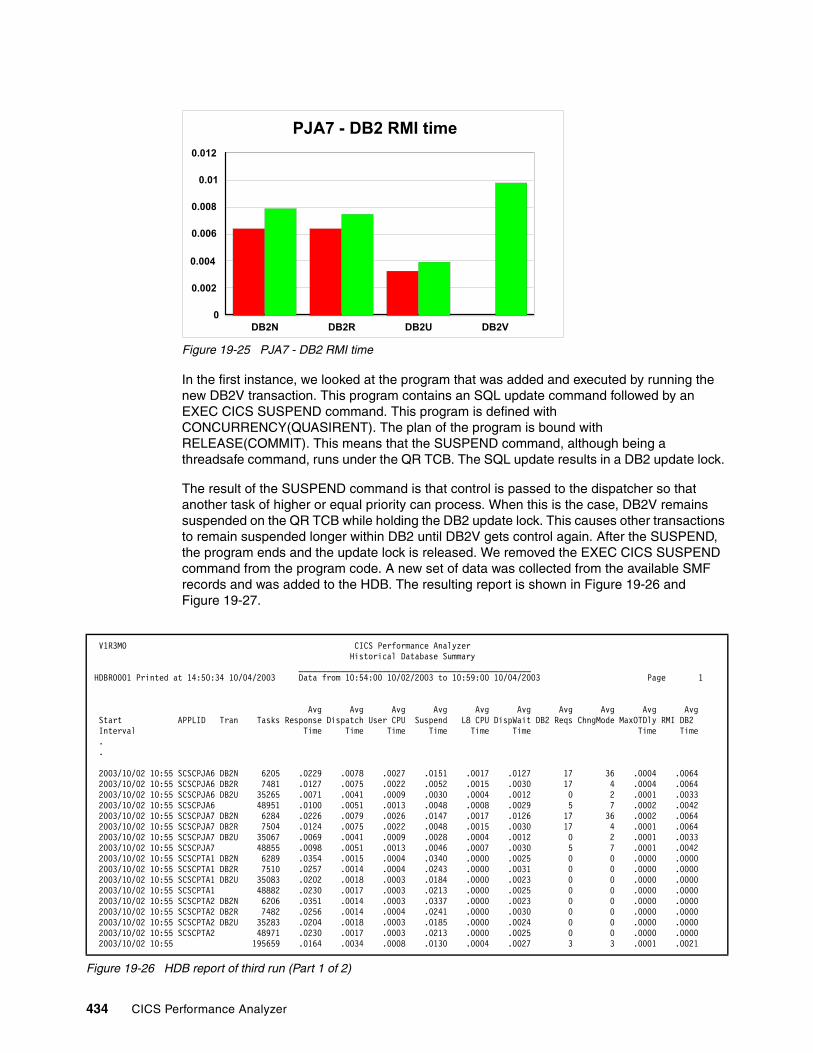
Figure 19-25 PJA7 - DB2 RMI time
In the first instance, we looked at the program that was added and executed by running the new DB2V transaction. This program contains an SQL update command followed by an EXEC CICS SUSPEND command. This program is defined with CONCURRENCY(QUASIRENT). The plan of the program is bound with RELEASE(COMMIT). This means that the SUSPEND command, although being a threadsafe command, runs under the QR TCB. The SQL update results in a DB2 update lock.
The result of the SUSPEND command is that control is passed to the dispatcher so that another task of higher or equal priority can process. When this is the case, DB2V remains suspended on the QR TCB while holding the DB2 update lock. This causes other transactions to remain suspended longer within DB2 until DB2V gets control again. After the SUSPEND, the program ends and the update lock is released. We removed the EXEC CICS SUSPEND command from the program code. A new set of data was collected from the available SMF records and was added to the HDB. The resulting report is shown in Figure 19-26 and Figure 19-27.
Figure 19-26 HDB report of third run (Part 1 of 2)
DB2N DB2R DB2U DB2V0
0.002
0.004
0.006
0.008
0.01
0.012
PJA7 - DB2 RMI time
V1R3M0 CICS Performance Analyzer Historical Database Summary __________________________________________________ HDBR0001 Printed at 14:50:34 10/04/2003 Data from 10:54:00 10/02/2003 to 10:59:00 10/04/2003 Page 1 Avg Avg Avg Avg Avg Avg Avg Avg Avg Avg Start APPLID Tran Tasks Response Dispatch User CPU Suspend L8 CPU DispWait DB2 Reqs ChngMode MaxOTDly RMI DB2 Interval Time Time Time Time Time Time Time Time . . 2003/10/02 10:55 SCSCPJA6 DB2N 6205 .0229 .0078 .0027 .0151 .0017 .0127 17 36 .0004 .0064 2003/10/02 10:55 SCSCPJA6 DB2R 7481 .0127 .0075 .0022 .0052 .0015 .0030 17 4 .0004 .0064 2003/10/02 10:55 SCSCPJA6 DB2U 35265 .0071 .0041 .0009 .0030 .0004 .0012 0 2 .0001 .0033 2003/10/02 10:55 SCSCPJA6 48951 .0100 .0051 .0013 .0048 .0008 .0029 5 7 .0002 .0042 2003/10/02 10:55 SCSCPJA7 DB2N 6284 .0226 .0079 .0026 .0147 .0017 .0126 17 36 .0002 .0064 2003/10/02 10:55 SCSCPJA7 DB2R 7504 .0124 .0075 .0022 .0048 .0015 .0030 17 4 .0001 .0064 2003/10/02 10:55 SCSCPJA7 DB2U 35067 .0069 .0041 .0009 .0028 .0004 .0012 0 2 .0001 .0033 2003/10/02 10:55 SCSCPJA7 48855 .0098 .0051 .0013 .0046 .0007 .0030 5 7 .0001 .0042 2003/10/02 10:55 SCSCPTA1 DB2N 6289 .0354 .0015 .0004 .0340 .0000 .0025 0 0 .0000 .0000 2003/10/02 10:55 SCSCPTA1 DB2R 7510 .0257 .0014 .0004 .0243 .0000 .0031 0 0 .0000 .0000 2003/10/02 10:55 SCSCPTA1 DB2U 35083 .0202 .0018 .0003 .0184 .0000 .0023 0 0 .0000 .0000 2003/10/02 10:55 SCSCPTA1 48882 .0230 .0017 .0003 .0213 .0000 .0025 0 0 .0000 .0000 2003/10/02 10:55 SCSCPTA2 DB2N 6206 .0351 .0014 .0003 .0337 .0000 .0023 0 0 .0000 .0000 2003/10/02 10:55 SCSCPTA2 DB2R 7482 .0256 .0014 .0004 .0241 .0000 .0030 0 0 .0000 .0000 2003/10/02 10:55 SCSCPTA2 DB2U 35283 .0204 .0018 .0003 .0185 .0000 .0024 0 0 .0000 .0000 2003/10/02 10:55 SCSCPTA2 48971 .0230 .0017 .0003 .0213 .0000 .0025 0 0 .0000 .0000 2003/10/02 10:55 195659 .0164 .0034 .0008 .0130 .0004 .0027 3 3 .0001 .0021
434 CICS Performance Analyzer

Figure 19-27 HDB report of third run (Part 1 of 2)
The report shows that the transaction suspend times are again down to their normal values. The graphs in Figure 19-28 through Figure 19-30 on page 436 give a more visual representation that we returned to the situation from before the DB2V transaction was added and that the DB2V, after correction, has much less influence on the other transactions.
. . 2003/10/03 10:55 SCSCPJA6 DB2N 5819 .0243 .0093 .0027 .0150 .0018 .0126 17 36 .0003 .0078 2003/10/03 10:55 SCSCPJA6 DB2R 6991 .0139 .0086 .0022 .0052 .0016 .0031 17 4 .0002 .0075 2003/10/03 10:55 SCSCPJA6 DB2U 32380 .0078 .0048 .0009 .0030 .0004 .0013 0 2 .0001 .0040 2003/10/03 10:55 SCSCPJA6 DB2V 2281 .0147 .0103 .0013 .0044 .0009 .0024 1 4 .0002 .0097 2003/10/03 10:55 SCSCPJA6 47471 .0111 .0062 .0013 .0049 .0008 .0030 5 7 .0002 .0053 2003/10/03 10:55 SCSCPJA7 DB2N 5773 .0250 .0096 .0028 .0155 .0017 .0128 17 36 .0004 .0079 2003/10/03 10:55 SCSCPJA7 DB2R 6848 .0140 .0087 .0022 .0054 .0015 .0031 17 4 .0003 .0075 2003/10/03 10:55 SCSCPJA7 DB2U 32575 .0078 .0047 .0009 .0031 .0004 .0013 1 2 .0001 .0039 2003/10/03 10:55 SCSCPJA7 DB2V 2296 .0148 .0104 .0013 .0044 .0008 .0024 1 4 .0002 .0098 2003/10/03 10:55 SCSCPJA7 47492 .0112 .0062 .0014 .0050 .0008 .0030 5 7 .0002 .0052 2003/10/03 10:55 SCSCPTA1 DB2N 5771 .0388 .0014 .0004 .0373 .0000 .0025 0 0 .0000 .0000 2003/10/03 10:55 SCSCPTA1 DB2R 6851 .0287 .0015 .0004 .0272 .0000 .0036 0 0 .0000 .0000 2003/10/03 10:55 SCSCPTA1 DB2U 32577 .0220 .0019 .0004 .0201 .0000 .0025 0 0 .0000 .0000 2003/10/03 10:55 SCSCPTA1 DB2V 2296 .0301 .0013 .0003 .0288 .0000 .0030 0 0 .0000 .0000 2003/10/03 10:55 SCSCPTA1 47495 .0254 .0018 .0004 .0236 .0000 .0027 0 0 .0000 .0000 2003/10/03 10:55 SCSCPTA2 DB2N 5819 .0373 .0015 .0004 .0358 .0000 .0024 0 0 .0000 .0000 2003/10/03 10:55 SCSCPTA2 DB2R 6991 .0285 .0015 .0004 .0270 .0000 .0032 0 0 .0000 .0000 2003/10/03 10:55 SCSCPTA2 DB2U 32380 .0213 .0019 .0003 .0194 .0000 .0023 0 0 .0000 .0000 2003/10/03 10:55 SCSCPTA2 DB2V 2281 .0295 .0014 .0003 .0282 .0000 .0029 0 0 .0000 .0000 2003/10/03 10:55 SCSCPTA2 47471 .0247 .0018 .0004 .0229 .0000 .0025 0 0 .0000 .0000 2003/10/03 10:55 189929 .0181 .0040 .0009 .0141 .0004 .0028 2 3 .0001 .0026 V1R3M0 CICS Performance Analyzer Historical Database Summary __________________________________________________ HDBR0001 Printed at 14:50:34 10/04/2003 Data from 10:54:00 10/02/2003 to 10:59:00 10/04/2003 Page 1 Avg Avg Avg Avg Avg Avg Avg Avg Avg Avg Start APPLID Tran Tasks Response Dispatch User CPU Suspend L8 CPU DispWait DB2 Reqs ChngMode MaxOTDly RMI DB2 Interval Time Time Time Time Time Time Time Time 2003/10/04 10:55 SCSCPJA6 DB2N 5799 .0224 .0081 .0027 .0142 .0017 .0119 17 36 .0003 .0067 2003/10/04 10:55 SCSCPJA6 DB2R 7094 .0125 .0075 .0022 .0050 .0016 .0029 17 4 .0003 .0064 2003/10/04 10:55 SCSCPJA6 DB2U 32458 .0072 .0041 .0009 .0031 .0004 .0013 1 2 .0002 .0033 2003/10/04 10:55 SCSCPJA6 DB2V 2311 .0126 .0082 .0012 .0044 .0008 .0022 1 4 .0005 .0075 2003/10/04 10:55 SCSCPJA6 47662 .0101 .0053 .0013 .0048 .0008 .0029 5 7 .0002 .0044 2003/10/04 10:55 SCSCPJA7 DB2N 5752 .0221 .0085 .0026 .0136 .0017 .0116 17 36 .0002 .0071 2003/10/04 10:55 SCSCPJA7 DB2R 6940 .0123 .0079 .0022 .0044 .0015 .0028 17 4 .0002 .0067 2003/10/04 10:55 SCSCPJA7 DB2U 32768 .0069 .0042 .0009 .0028 .0004 .0012 1 2 .0001 .0034 2003/10/04 10:55 SCSCPJA7 DB2V 2334 .0125 .0085 .0013 .0039 .0008 .0021 1 4 .0002 .0080 2003/10/04 10:55 SCSCPJA7 47794 .0098 .0054 .0013 .0044 .0007 .0027 5 6 .0002 .0045 2003/10/04 10:55 SCSCPTA1 DB2N 5749 .0342 .0014 .0004 .0327 .0000 .0020 0 0 .0000 .0000 2003/10/04 10:55 SCSCPTA1 DB2R 6939 .0247 .0015 .0004 .0232 .0000 .0028 0 0 .0000 .0000 2003/10/04 10:55 SCSCPTA1 DB2U 32765 .0191 .0018 .0003 .0173 .0000 .0021 0 0 .0000 .0000 2003/10/04 10:55 SCSCPTA1 DB2V 2334 .0242 .0012 .0003 .0229 .0000 .0019 0 0 .0000 .0000 2003/10/04 10:55 SCSCPTA1 47787 .0220 .0017 .0003 .0203 .0000 .0022 0 0 .0000 .0000 2003/10/04 10:55 SCSCPTA2 DB2N 5798 .0339 .0014 .0003 .0325 .0000 .0020 0 0 .0000 .0000 2003/10/04 10:55 SCSCPTA2 DB2R 7092 .0248 .0015 .0004 .0233 .0000 .0026 0 0 .0000 .0000 2003/10/04 10:55 SCSCPTA2 DB2U 32454 .0199 .0018 .0003 .0181 .0000 .0022 0 0 .0000 .0000 2003/10/04 10:55 SCSCPTA2 DB2V 2313 .0257 .0014 .0003 .0243 .0000 .0021 0 0 .0000 .0000 2003/10/04 10:55 SCSCPTA2 47657 .0226 .0017 .0003 .0210 .0000 .0022 0 0 .0000 .0000 2003/10/04 10:55 190900 .0161 .0035 .0008 .0126 .0004 .0025 2 3 .0001 .0022
Chapter 19. Historical Database 435

Figure 19-28 PTA1-PJA7 response times after DB2V correction
Figure 19-29 PJA7 response and CPU times after DB2V correction
Figure 19-30 PJA7 - DB2 RMI time after DB2V correction
DB2N DB2R DB2U DB2V0
0.01
0.02
0.03
0.04
0.05
PTA1 - Response time
DB2N DB2R DB2U DB2V0
0.005
0.01
0.015
0.02
0.025
0.03
PJA7 - Response time
DB2N DB2R DB2U DB2V0
0.005
0.01
0.015
0.02
0.025
0.03
PJA7 - Response time
DB2N DB2R DB2U DB2V0
0.5
1
1.5
2
2.5
3
Tho
usan
dths
PJA7 - CPU time
DB2N DB2R DB2U DB2V0
0.002
0.004
0.006
0.008
0.01
0.012
PJA7 - DB2 RMI time
436 CICS Performance Analyzer

19.4.2 List HDBThe usage of a list HDB is similar to using performance list reports. The records that are written to the HDB represent single transaction records. The selected fields of each CMF performance record are copied as one record in the HDB. This way large amounts of data can be copied to the HDB. Thus the list HDB is considered to have a short life span and should be used for detailed analysis of recent transaction events.
The creation of templates, the definition of the HDB, and loading and reporting a list HDBs are similar to the usage of the summary HDB. We show the usage of a list HDB in 19.4.5, “Export HDB data sets to DB2” on page 441.
19.4.3 HDB maintenanceHDB maintenance allows you to change the options or to flag containers from the HDB as deleted. We entered option 5 to enter the HDB maintenance option. Then, we were presented the list of the HDBs. Figure 19-31 shows that we selected the DB2TRNDS HDB.
Figure 19-31 HDB maintenance HDB definitions list
We selected an HDB and then had two view options. First is the Maintain options view where you can alter the options of the HDB (Figure 19-32).
File Options Help ------------------------------------------------------------------------------ HDB Maintenance Row 1 to 2 of 2 Command ===> Scroll ===> CSR Select to maintain HDB definition and its data sets. / Name Type Description Changed ID DB2TRNDL LIST DB2trndl HDB 2003/09/27 15:07 CICSRS4 s DB2TRNDS SUMMARY DB2trnds HDB 2003/09/29 11:24 CICSRS4 ********************************* End of list *********************************
Chapter 19. Historical Database 437

Figure 19-32 HDB Maintenance: Options view
Second is the Maintain data sets view. You can request to have this view by changing the Specify View value or by pressing F11, which allows you to switch between the two views. Figure 19-33 shows the list of allocated containers in the HDB. It shows that the first container is expired.
Figure 19-33 HDB Maintenance: Data Sets view
File Systems Options Help ------------------------------------------------------------------------------ Maintain HDB More: > Command ===> Review and update HDB definition options then press EXIT to save. Name . . . . . : DB2TRNDS Type SUMMARY APPLID + Image Description . . DB2TREND HDB Specify View . . 1 1. Options 2. Data Sets More: + HDB Format: Selection Criteria: Template . . . DB2TRNDS + Performance Data Retention Period: Years . . Months . . Weeks . . 1 Days . . Hours . . Data Set Allocation Settings: DSN Prefix . . . . . . CICSRS4 Management class . . . (Blank for default management class) Storage class . . . . (Blank for default storage class) Volume serial . . . . (Blank for system default volume) Device type . . . . . (Generic unit or device address) Data class . . . . . . (Blank for default data class) Space Units . . . . . CYLS (TRKS, CYLS)
Primary quantity . . 10 (In above units) Secondary quantity 5 (In above units)
File Systems Options Help ------------------------------------------------------------------------------ Maintain HDB Row 1 of 4 More: > Command ===> Scroll ===> CSR Maintain HDB data sets. Name . . . . . : DB2TRNDS Type SUMMARY APPLID + Image Description . . DB2TREND HDB Specify View . . 2 1. Options 2. Data Sets / Data Set Name Start Volume CICSRS4.DB2TRNDS.D03265.T121845.HDB 2003/09/19 10:54:00 *EXPIRE CICSRS4.DB2TRNDS.D03267.T111310.HDB 2003/09/24 10:54:00 TOTSTH s CICSRS4.DB2TRNDS.D03270.T120538.HDB 2003/09/27 10:55:00 TOTTSW CICSRS4.DB2TRNDS.D03272.T112941.HDB 2003/09/29 10:55:00 TOTTSU ********************************* End of list *********************************
438 CICS Performance Analyzer

We selected the third container to see additional details about the container itself and about the data that is available in it. Figure 19-34 shows this detail.
Figure 19-34 HDB Maintenance: Container details
We pressed F3 to return to the previous screen where we entered a D in front of the container name to flag it as deleted. Figure 19-35 shows the deleted status of the selected container. You can undo this status by typing line action U next to the container name. Undo is available until you run housekeeping.
Figure 19-35 HDB Maintenance: An expired and deleted container
19.4.4 HDB housekeepingHDB housekeeping allows you to generate JCL to physically delete the containers that are flagged as expired or deleted. It also allows you to generate JCL for doing an IDCAMS VERIFY on a broken HDB register KSDS. This can be required if you receive message IEC161I after a failed HDB dialog or batch request.
When we selected housekeeping, the screen shown in Figure 19-36 is displayed.
---------------------------- Maintain HDB ----------------------------- HDB Data Set Command ===> Data Set Name . . : CICSRS4.DB2TRNDS.D03270.T120538.HDB VOLSER . . . . . . : TOTTSW Status . . . . . . : Active Creation Date . . : 2003/09/27 12:05:39 Expiry Date . . . : 2003/10/04 16:05:39 Data Start . . . . : 2003/09/27 10:55:00 Data End . . . . . : 2003/09/27 10:59:00 Record Count . . . : 80
File Systems Options Help ------------------------------------------------------------------------------ Maintain HDB Row 1 of 4 More: > Command ===> Scroll ===> CSR Maintain HDB data sets. Name . . . . . : DB2TRNDS Type SUMMARY APPLID + Image Description . . DB2TREND HDB Specify View . . 2 1. Options 2. Data Sets / Data Set Name Start Volume CICSRS4.DB2TRNDS.D03265.T121845.HDB 2003/09/19 10:54:00 *EXPIRE CICSRS4.DB2TRNDS.D03267.T111310.HDB 2003/09/24 10:54:00 TOTSTH CICSRS4.DB2TRNDS.D03270.T120538.HDB 2003/09/27 10:55:00 *DELETE CICSRS4.DB2TRNDS.D03272.T112941.HDB 2003/09/29 10:55:00 TOTTSU ********************************* End of list *********************************
Chapter 19. Historical Database 439

Figure 19-36 HDB Housekeeping options
Figure 19-35 shows an expired and a deleted container. To physically delete them, we selected option 1 on the HDB Housekeeping screen to run the HDB housekeeping job. Example 19-5 shows the two step JCL that was submitted.
Example 19-5 HDB housekeeping JCL
// JOB //* CICSPA V1R3 HDB HOUSEKEEPING JCL //HKEEP EXEC PGM=CPAMAIN //STEPLIB DD DSN=CPA13.SCPALINK, // DISP=SHR //CPAHDBRG DD DSN=CICSRS4.CICSPA.HDB.DB2TRND, // DISP=SHR //SYSPRINT DD SYSOUT=* //SYSIN DD * CICSPA HDB(HKEEP) /* //CPAHKDEL DD DSN=&CPAHKDEL,DISP=(NEW,PASS), // SPACE=(CYL,(1,1)) //* //DELETE EXEC PGM=IDCAMS,COND=(0,NE,HKEEP) //SYSPRINT DD SYSOUT=* //SYSIN DD DSN=&CPAHKDEL,DISP=(OLD,DELETE)
Figure 19-37 shows the output of the two steps of the HDB housekeeping job. It also shows that the DB2TRNDL HDB had two expired containers. This job should be submitted periodically to physically delete the expired containers.
--------------------------------------------------------------- HDB Housekeeping Command ===> Register . . : CICSRS4.CICSPA.HDB.DB2TRND Select one of the following options 1 1. Submit HDB Housekeeping JCL 2. Repair HDB Register using VERIFY command Enter "/" to select option / Edit JCL before submit
440 CICS Performance Analyzer

Figure 19-37 HDB housekeeping output
We selected option 2 on the HDB Housekeeping menu for the Repair HDB Register using the VERIFY command. No job was submitted but the VERIFY command was executed dynamically. The result is shown on the Historical Database Menu (Figure 19-38).
Figure 19-38 Execution result of the VERIFY command
19.4.5 Export HDB data sets to DB2To perform more extended analysis on SMF data, you may try loading SMF data into DB2 tables. The Export function of the Historical Database Manager allows you in an easy way to
V1R3M0 CICS Performance Analyzer HDB Housekeeping Report __________________________________________________ Housekeeping is being performed against HDB Register CICSRS4.CICSPA.HDB.DB2TRND Page 1 The following Containers were deleted from the Register: Container DSN: CICSRS4.DB2TRNDL.D03270.T150745.HDB Reason: Expired No of Records: 94,200 Created: 2003-09-27-15.10.47.236842 ; Record Range is from 2003-09-27-10.53.18.779172 to 2003-09-27-10.59.36.543344 Container DSN: CICSRS4.DB2TRNDL.D03270.T150927.HDB Reason: Expired No of Records: 72,468 Created: 2003-09-27-15.10.47.236842 ; Record Range is from 2003-09-27-10.55.18.784232 to 2003-09-27-10.59.59.977244 Container DSN: CICSRS4.DB2TRNDS.D03265.T121845.HDB Reason: Expired No of Records: 61 Created: 2003-09-22-12.18.46.000000 ; Record Range is from 2003-09-19-10.54.00.000000 to 2003-09-19-10.59.00.000000 Container DSN: CICSRS4.DB2TRNDS.D03270.T120538.HDB Reason: Deleted No of Records: 80 Created: 2003-09-27-12.05.39.000000 ; Record Range is from 2003-09-27-10.55.00.000000 to 2003-09-27-10.59.00.000000 Housekeeping process complete.
IDCAMS SYSTEM SERVICES TIME: 19:49:25 09/29/03 PAGE 1 DELETE CICSRS4.DB2TRNDL.D03270.T150745.HDB IDC0550I ENTRY (A) CICSRS4.DB2TRNDL.D03270.T150745.HDB DELETED IDC0001I FUNCTION COMPLETED, HIGHEST CONDITION CODE WAS 0 DELETE CICSRS4.DB2TRNDL.D03270.T150927.HDB IDC0550I ENTRY (A) CICSRS4.DB2TRNDL.D03270.T150927.HDB DELETED IDC0001I FUNCTION COMPLETED, HIGHEST CONDITION CODE WAS 0 DELETE CICSRS4.DB2TRNDS.D03265.T121845.HDB IDC0550I ENTRY (A) CICSRS4.DB2TRNDS.D03265.T121845.HDB DELETED IDC0001I FUNCTION COMPLETED, HIGHEST CONDITION CODE WAS 0 DELETE CICSRS4.DB2TRNDS.D03270.T120538.HDB IDC0550I ENTRY (A) CICSRS4.DB2TRNDS.D03270.T120538.HDB DELETED IDC0001I FUNCTION COMPLETED, HIGHEST CONDITION CODE WAS 0 IDC0002I IDCAMS PROCESSING COMPLETE. MAXIMUM CONDITION CODE WAS 0
File Options Help ------------------------------------------------------------------------------ Historical Database Menu VERIFY successful Option ===> 1 Templates Design HDB Templates 2 Define Define a new HDB 3 Load Load data into the HDBs 4 Report Submit HDB report requests 5 Export Export HDB data sets to DB2 6 Maintenance Maintain HDB definitions and data sets 7 Housekeeping Perform HDB housekeeping HDB Register . . . 'CICSRS4.CICSPA.HDB.DB2TRND' +
Chapter 19. Historical Database 441

generate the required jobs to create the DDL to define a DB2 table and a job to load the data into this table.
We show you how we used a list HDB to load a DB2 table. Since it is very to create the required jobs to define a table and load a DB2 table, it is easier to work with small tables that contain only the data that you require. However, to understand our storage requirements, we decided to create a table with all available columns.
First we created a list template with name DB2ALL. On the Historical Database Menu, we selected option 1 to enter the templates option. We entered the NEW command and then entered the name of the template that we wanted to create. A pop-up screen appeared where we selected to have a list template. Figure 19-39 shows that we selected all fields to be included in the template by moving the End of HDB marker to the last line of all selectable fields.
Figure 19-39 HDB template with all fields selected
Then, on the main menu, we selected option 2 to define the HDB. Figure 19-40 shows the HDB definition panel with the options we specified. This HDB is only used briefly so we specified a retention period of one day. We specified a specific volume serial because we were sure there was enough space available on that volume. For primary space allocation, we specified 30 cylinders. The secondary allocation was set to 5.
File Edit Confirm Upgrade Options Help ------------------------------------------------------------------------------
EDIT List Template - DB2ALL Row 250 of 262 More: > Command ===> Scroll ===> CSR Description . . . List HDB Template Version (VRM): 620 Selection Criteria: Performance Field / Name + K Description WAITEXT External ECB wait time WBBROWSE Web Browse requests WBCHRIN Web characters received count WBCHROUT Web characters sent count WBEXTRCT Web EXTRACT requests WBRCV Web RECEIVE requests WBREAD Web READ requests WBREPRCT Shared TS Repository read requests WBREPWCT Shared TS Repository write requests WBSEND Web SEND requests WBTOTAL Web Total requests WBWRITE Web WRITE requests EOD ---------------- End of HDB -----------------
442 CICS Performance Analyzer

Figure 19-40 DB2ALL HDB definition
Next we loaded the data into the HDB. We selected the load option 3 and selected the just created DB2ALL HDB. Figure 19-41 shows that we selected to have only the SMF records for APPLID SCSCPJA7. We pressed Enter to preview the JCL which we then submitted.
Figure 19-41 DB2ALL HDB load options
Figure 19-42 shows part of the job log and the recap report of the load job. The abend B37 indicates that the storage space allocation for the data container was too small. This did not cause a problem for us. When CICS PA detects an abend x37, it closes the file and continues loading data in a new allocated container. This job had an abend B37 resulting in two containers being allocated for holding all of the data. The fact of having two containers
File Systems Options Help ------------------------------------------------------------------------------
New HDB Definition Command ===> Specify new HDB definition options then press EXIT to save. Name . . . . . . DB2ALL APPLID + Image Description . . HDB containing all SMF fields HDB Format: Selection Criteria: Template . . . DB2ALL + Performance Data Retention Period: Years . . Months . . Weeks . . Days . . 1 Hours . . Data Set Allocation Settings: DSN Prefix . . . . . . CICSRS4 Management class . . . (Blank for default management class) Storage class . . . . (Blank for default storage class) Volume serial . . . . TOTPB8 (Blank for system default volume) Device type . . . . . (Generic unit or device address) Data class . . . . . . (Blank for default data class) Space Units . . . . . CYLS (TRKS, CYLS) Primary quantity . . 30 (In above units) Secondary quantity 5 (In above units)
File Systems Options Help --------------------------------------------------------------------------
Load LIST HDB DB2ALL Command ===> Specify HDB load options then press Enter to continue submit. ----- Report Interval ------ System Selection: MM/DD/YYYY HH:MM:SS.TH APPLID . . SCSCPJA7 + From Image . . SC66 + To Group . . + Enter "/" to select option / Edit JCL before submit
Chapter 19. Historical Database 443

instead of one is transparent to the report function but not to the export function that can export only one container at a time.
Figure 19-42 Job log and Load recap Report showing an abend B37
We returned to the main HDB menu and selected option 5 to create the jobs for loading the container data into a DB2 table. We selected our DB2ALL HDB and were presented the screen as shown in Figure 19-43. We selected the first container and pressed Enter.
Figure 19-43 Available containers for DB2ALL Export HDB function
Figure 19-44 shows the screen that we received with the selected container name. This screen is used twice. First we selected option 1 to create the DDL to define the DB2 table.
Next for the required information about the DB2 system that we were going to use, we entered CPA13 as the name of the DB2 database that has to be created to contain our DB2 table. We did not enter a VCAT value because we decided to use the default storage group, SYSDEFLT. We also entered the primary and secondary allocation units for the DB2 tablespace.
Finally, we chose to have both time and count values for the timer fields. A CMF performance class clock field consists of a timer value and a count value. The timer value represents the total time value as it was accumulated during one or more measurement periods. The count value gives the number of these different periods. We did not select the Include Sums of Squares option since this does not apply to a list HDB.
.
.IEF403I CICSRS4L - STARTED - TIME=15.53.35 - ASID=0028 - SC66 IEC030I B37-04,IFG0554A,CICSRS4L,CICSPA,SYS00001,3B40,TOTPB8,CICSRS4.DB2ALL.D03281.T155336.HDB ..V1R3M0 CICS Performance Analyzer HDB LOAD Recap Report __________________________________________________ HDBL0001 Printed at 15:56:16 10/08/2003 Data from 18:54:35 10/06/2003 to 19:00:59 10/06/2003 Page 1 LOAD requested for HDB: DB2ALL Register DSN: CICSRS4.CICSPA.HDB.DB2TREND The following Container(s) were created and loaded: Container DSN: CICSRS4.DB2ALL.D03281.T155336.HDB No of Records: 47,250 Start Timestamp: 2003-10-06-18.54.35.608548 End Timestamp: 2003-10-06-18.59.38.569366 Container DSN: CICSRS4.DB2ALL.D03281.T155543.HDB No of Records: 12,706 Start Timestamp: 2003-10-06-18.59.35.587090 End Timestamp: 2003-10-06-19.00.59.947900 LOAD process complete.
File Options Help ------------------------------------------------------------------------------ Export HDB Row 1 to 2 of 2 Command ===> Scroll ===> CSR Export HDB data set. Name . . : DB2ALL Data Set Name Start Volume s CICSRS4.DB2ALL.D03281.T155336.HDB 2003/10/06 18:54:35 TOTPB8 CICSRS4.DB2ALL.D03281.T155543.HDB 2003/10/06 18:59:35 TOTPB8 ********************************* End of list *********************************
444 CICS Performance Analyzer

Figure 19-44 DB2 options for generating the DDL to create a DB2 table
Example 19-6 shows the job that was generated. We recognized our parameters in the CREATE DATABASE, TABLESPACE, and TABLE commands. For a typical field, such as CPU time, we saw that two columns are included: CPU_TIME and CPU_COUNT. At the end of the job, we noticed also that an index is built for the table.
Example 19-6 DB2 DDL for creating a table to load HDB data into
// JOB /*JOBPARM SYSAFF=SC66 //* CICSPA V1R3 HDB - DDL TO DEFINE DB2 TABLE //RUNTIAD EXEC PGM=IKJEFT01,DYNAMNBR=20 //STEPLIB DD DISP=SHR,DSN=DB7Q7.SDSNLOAD // DD DISP=SHR,DSN=DB7Q7.SDSNEXIT //SYSTSPRT DD SYSOUT=* //SYSTSIN DD * DSN SYSTEM(D7Q2) RUN PROGRAM(DSNTIAD) - LIB('DB7QU.RUNLIB.LOAD') PLAN(DSNTIA71) /* //SYSPRINT DD SYSOUT=* //SYSUDUMP DD SYSOUT=* //SYSIN DD * CREATE DATABASE CPA13; COMMIT;
File Options Help ------------------------------------------------------------------------------ Export HDB Data Set Top of data Command ===> HDB Name . . . : DB2ALL Data Set Name . : CICSRS4.DB2ALL.D03281.T155336.HDB More: + Select option 1 1. Create DDL to define table 2. Load data into table Create Options Load Options / Create Database 1 1. Resume Create Storage Group 2. Replace DB2 Settings: DB2 Subsystem ID . . . D7Q2 DSNTIAD Plan Name . . DSNTIA71 DB2 Load Library . . . 'DB7Q7.SDSNLOAD' DB2 Exit Library . . . 'DB7Q7.SDSNEXIT' DB2 RUNLIB Library . . 'DB7QU.RUNLIB.LOAD' Database . . . . . . . CPA13 Storage Group . . SYSDEFLT VCAT Catalog name . . Volume . . . . . . TOTDCT
Allocation: Primary 5000 Secondary . . . . 500 Include Clock Field Components Summary Options 1 1. Time and Count Include Sums of Squares 2. Time only 3. Count only
Chapter 19. Historical Database 445

CREATE TABLESPACE DB2ALL IN CPA13
LOCKSIZE ANY BUFFERPOOL BP0 CLOSE NO SEGSIZE 32 USING STOGROUP SYSDEFLT PRIQTY 5000 SECQTY 500 ERASE NO ;
CREATE TABLE CPA13.DB2ALL ( START TIMESTAMP,
TMVSID CHAR(4), APPLID CHAR(8), TRAN CHAR(4), USERID CHAR(8), PROGRAM CHAR(8), TASKNO INTEGER, RESPONSE_TIME FLOAT, DISPATCH_TIME FLOAT, DISPATCH_COUNT INTEGER, CPU_TIME FLOAT,
CPU_COUNT INTEGER, SUSPEND_TIME FLOAT, SUSPEND_COUNT INTEGER, DISPWAIT_TIME FLOAT, DISPWAIT_COUNT INTEGER, FCWAIT_TIME FLOAT, FCWAIT_COUNT INTEGER, ...
WBTOTAL INTEGER, WBWRITE INTEGER ) IN CPA13.DB2ALL; CREATE TYPE 2 UNIQUE INDEX CPA13.DB2ALL_IX ON CPA13.DB2ALL ( START, MVSID, APPLID, TRAN, USERID, PROGRAM ) USING STOGROUP SYSDEFLT PRIQTY 10 SECQTY 10 ERASE NO CLUSTER BUFFERPOOL BP0 CLOSE NO ;
446 CICS Performance Analyzer

We submitted this job and returned to the Export screen (Figure 19-44). We then chose option 2 to generate the job for loading the data into the newly created table. Example 19-7 shows the generated JCL and the first lines of the LOAD commands.
Example 19-7 Generated job for loading the HDB data into the generated DB2 table
//CICSRS4 JOB (ACCOUNT),'NORBERT',MSGLEVEL=(1,1),NOTIFY=&SYSUID /*JOBPARM SYSAFF=SC66 //* CICSPA V1R3 HDB - LOAD DATA INTO DB2 TABLE //DSNUPROC EXEC PGM=DSNUTILB,REGION=0M, // PARM='D7Q2' //STEPLIB DD DISP=SHR,DSN=DB7Q7.SDSNLOAD // DD DISP=SHR,DSN=DB7Q7.SDSNEXIT //SYSPRINT DD SYSOUT=* //UTPRINT DD SYSOUT=* //SYSUDUMP DD SYSOUT=* //SYSREC DD DSN=CICSRS4.DB2ALL.D03281.T155543.HDB, // DISP=SHR //SYSUT1 DD UNIT=SYSDA,SPACE=(4000,(20,20),,,ROUND) //SORTOUT DD UNIT=SYSDA,SPACE=(4000,(20,20),,,ROUND) //SYSIN DD * LOAD DATA RESUME YES INTO TABLE CPA13.DB2ALL ( START POSITION(1) TIMESTAMP EXTERNAL(26), MVSID POSITION(27) CHAR(4), APPLID POSITION(31) CHAR(8), TRAN POSITION(39) CHAR(4),. . .
We modified the SYSREC DD statement to concatenate the second container that was created when the data was loaded to the HDB.
We submitted the job with the concatenated containers but received a DB2 abend S04E. Figure 19-45 shows the error messages. Reason code 00D70014 indicates the failure of an attempt to extend the tablespace.
Figure 19-45 DB2 error messages from the DB2 load job
At this time, we were not able to perform any action on the DB2 resources because the DB2 load utility was still in progress. We entered the DB2I interface in TSO as shown in Figure 19-46 to determine the exact status of the load utility and to take an appropriate action to remove this status. We selected option 7 to enter the DB2 commands option.
Attention: Be careful when concatenating the container data sets as described here. Ensure that the template has not changed between times.
DSNU398I -D7Q2 DSNURWBF - UNEXPECTED PROCESSING ERROR, REASON=X'00E40318' ON TABLE - CPA13.DB2ALLDSNT500I DSNUGBAC - RESOURCE UNAVAILABLE REASON 00D70014 TYPE 00000220 NAME DB7QU.DSNDBC.CPA13.DB2ALL.I0001.A001 DSNU017I DSNUGBAC - UTILITY DATA BASE SERVICES MEMORY EXECUTION ABENDED, REASON=X'00E40318'
Chapter 19. Historical Database 447
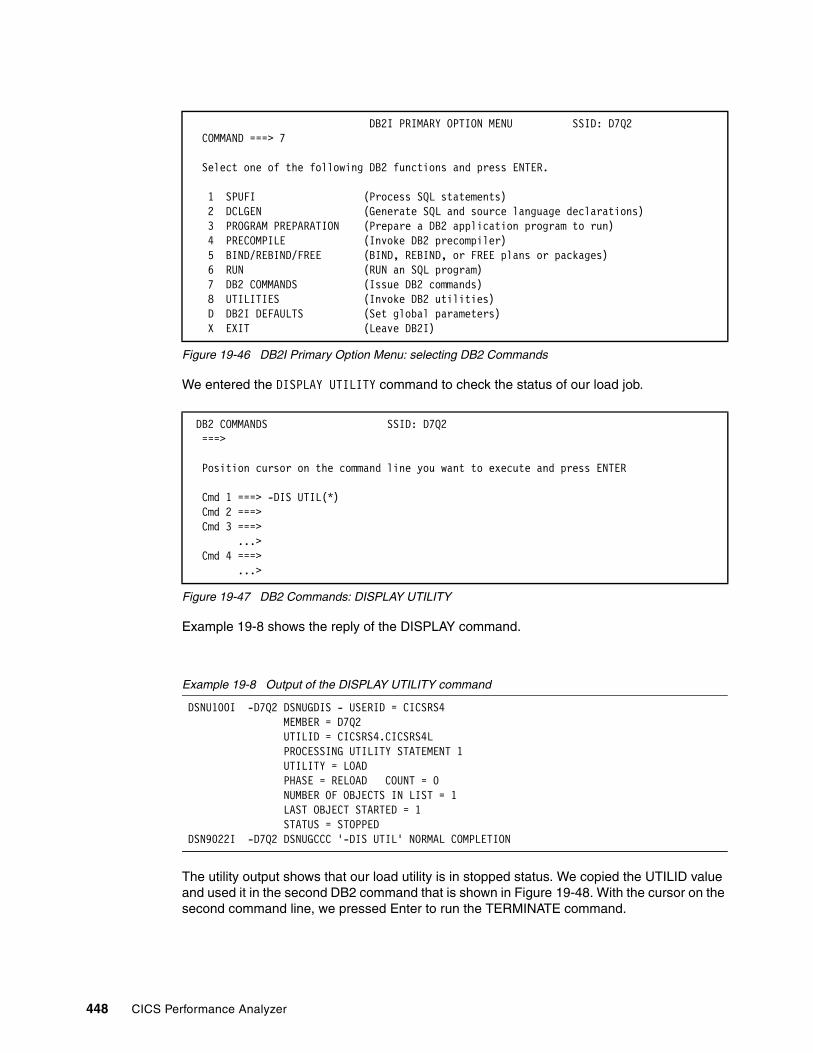
Figure 19-46 DB2I Primary Option Menu: selecting DB2 Commands
We entered the DISPLAY UTILITY command to check the status of our load job.
Figure 19-47 DB2 Commands: DISPLAY UTILITY
Example 19-8 shows the reply of the DISPLAY command.
Example 19-8 Output of the DISPLAY UTILITY command
DSNU100I -D7Q2 DSNUGDIS - USERID = CICSRS4 MEMBER = D7Q2 UTILID = CICSRS4.CICSRS4L PROCESSING UTILITY STATEMENT 1 UTILITY = LOAD PHASE = RELOAD COUNT = 0 NUMBER OF OBJECTS IN LIST = 1 LAST OBJECT STARTED = 1 STATUS = STOPPED DSN9022I -D7Q2 DSNUGCCC '-DIS UTIL' NORMAL COMPLETION
The utility output shows that our load utility is in stopped status. We copied the UTILID value and used it in the second DB2 command that is shown in Figure 19-48. With the cursor on the second command line, we pressed Enter to run the TERMINATE command.
DB2I PRIMARY OPTION MENU SSID: D7Q2 COMMAND ===> 7 Select one of the following DB2 functions and press ENTER. 1 SPUFI (Process SQL statements) 2 DCLGEN (Generate SQL and source language declarations) 3 PROGRAM PREPARATION (Prepare a DB2 application program to run) 4 PRECOMPILE (Invoke DB2 precompiler) 5 BIND/REBIND/FREE (BIND, REBIND, or FREE plans or packages) 6 RUN (RUN an SQL program) 7 DB2 COMMANDS (Issue DB2 commands) 8 UTILITIES (Invoke DB2 utilities) D DB2I DEFAULTS (Set global parameters) X EXIT (Leave DB2I)
DB2 COMMANDS SSID: D7Q2 ===> Position cursor on the command line you want to execute and press ENTER Cmd 1 ===> -DIS UTIL(*) Cmd 2 ===> Cmd 3 ===> ...> Cmd 4 ===> ...>
448 CICS Performance Analyzer

Figure 19-48 DB2 commands: TERMINATE the load utility
Figure 19-49 shows the output of the TERMINATE command.
Figure 19-49 Output of the TERMINATE command
The utility was terminated, so we could drop the DB2 objects. Still in the DB2I application, we entered SPUFI and executed the following commands:
DROP TABLE CPA13.DB2ALL; DROP TABLESPACE CPA13.DB2ALL;DROP DATABASE CPA13;
Then we returned to the Export HDB screen (Figure 19-44 on page 445) and changed the primary allocation value for the tablespace to 50000 and the secondary value to 5000. We re-ran the DDL job to create the DB2 table and the load job for the DB2 table. This time, both jobs ran without problems. Figure 19-50 shows the last DB2 messages of the load job output. The output shows that the table was loaded with 59956 records, which is the sum of the number of records in the two data containers.
Figure 19-50 Load job output messages
We again entered SPUFI and executed a SELECT on SYSIBM.SYSTABLES to look for the characteristics of our table. The output in Figure 19-51 shows that our table has 334 columns.
DB2 COMMANDS SSID: D7Q2 ===> DSNE294I SYSTEM RETCODE=000 USER OR DSN RETCODE=0 Position cursor on the command line you want to execute and press ENTER Cmd 1 ===> -DIS UTIL(*) Cmd 2 ===> -TERM UTIL(CICSRS4.CICSRS4L) Cmd 3 ===> ...> Cmd 4 ===> ...>
DSNU166I -D7Q2 DSNUGTER - LOAD UTILITY, UTILID = CICSRS4.CICSRS4L NOT EXECUTING, CLEANUP COMPLETE DSN9022I -D7Q2 DSNUGCCC '-TERM UTIL' NORMAL COMPLETION ***
DSNU320I -D7Q2 DSNURWI - RESUME(YES) WAS SPECIFIED FOR EMPTY TABLESPACE DSNU304I -D7Q2 DSNURWT - (RE)LOAD PHASE STATISTICS - NUMBER OF RECORDS=59956 FOR TABLE CPA13.DB2ALL DSNU302I DSNURILD - (RE)LOAD PHASE STATISTICS - NUMBER OF INPUT RECORDS PROCESSED=59956 DSNU300I DSNURILD - (RE)LOAD PHASE COMPLETE, ELAPSED TIME=00:01:46 DSNU042I DSNUGSOR - SORT PHASE STATISTICS - NUMBER OF RECORDS=59956 ELAPSED TIME=00:00:01 DSNU349I -D7Q2 DSNURBXA - BUILD PHASE STATISTICS - NUMBER OF KEYS=59956 FOR INDEX CPA13.DB2ALL_IX DSNU258I DSNURBXD - BUILD PHASE STATISTICS - NUMBER OF INDEXES=1 DSNU259I DSNURBXD - BUILD PHASE COMPLETE, ELAPSED TIME=00:00:10 DSNU010I DSNUGBAC - UTILITY EXECUTION COMPLETE, HIGHEST RETURN CODE=4
Chapter 19. Historical Database 449

Figure 19-51 DB2ALL table information
To look at the contents of our table, we ran a SELECT * SQL statement. Figure 19-52 shows this SQL statement as well as the first screen of output.
Figure 19-52 SQL SELECT command output
To have a decimal representation instead of a floating-point representation of the time fields, as an example, we selected specific fields and asked for a decimal representation. For such fields, we also re-specified the column name. Example 19-9 demonstrates how we did this.
Example 19-9 Table content with decimal number representation
SELECT TRAN, TASKNO, DEC(RESPONSE_TIME,8,4) AS RESPONSE_TIME, DEC(DISPATCH_TIME,8,4) AS DISPATCH_TIME, DISPATCH_COUNT, DEC(CPU_TIME,8,4) AS CPU_TIME FROM CPA13.DB2ALL WHERE TRAN LIKE ('DB2_') ORDER BY RESPONSE_TIME DESC ---------+---------+---------+---------+---------+---------+---------+------TRAN TASKNO RESPONSE_TIME DISPATCH_TIME DISPATCH_COUNT CPU_TIME ---------+---------+---------+---------+---------+---------+---------+------DB2N 39974 .6276 .5533 38 .0034 DB2R 39972 .5887 .5533 7 .0027 DB2U 39970 .5885 .5411 7 .0014 DB2U 39969 .5877 .5507 6 .0019 DB2U 39968 .5873 .5499 6 .0017 DB2U 39966 .5583 .5509 5 .0018 DB2V 39965 .5581 .4989 6 .0017 DB2N 39962 .5521 .4644 37 .0035 DB2N 71697 .5508 .0440 37 .0035 DB2N 71698 .5481 .4010 37 .0036
SELECT * FROM SYSIBM.SYSTABLES WHERE NAME='DB2ALL' ---------+---------+---------+---------+---------+---------+---------+---------+-NAME CREATOR TYPE DBNAME TSNAME DBID OBID COLCOUNT ---------+---------+---------+---------+---------+---------+---------+---------+-DB2ALL CPA13 T CPA13 DB2ALL 269 3 334
SELECT * FROM CPA13.DB2ALL ---------+---------+---------+---------+---------+---------+---------+---------+---------+---------+---------+---------+---------+--START MVSID APPLID TRAN USERID PROGRAM TASKNO RESPONSE_TIME DISPATCH_TIME---------+---------+---------+---------+---------+---------+---------+---------+---------+---------+---------+---------+---------+--2003-10-06-18.54.39.804789 SC66 SCSCPJA7 DB2U CICSUSER PROGDB2U 21779 +0.2539000000000000E-01 +0.1878400000000000E-012003-10-06-18.54.39.813802 SC66 SCSCPJA7 DB2R CICSUSER PROGDB2R 21782 +0.1670200000000000E-01 +0.1435200000000000E-012003-10-06-18.54.39.816094 SC66 SCSCPJA7 DB2R CICSUSER PROGDB2R 21784 +0.1597000000000000E-01 +0.1467200000000000E-012003-10-06-18.54.39.816128 SC66 SCSCPJA7 DB2U CICSUSER PROGDB2U 21785 +0.1622000000000000E-01 +0.1462400000000000E-012003-10-06-18.54.39.848980 SC66 SCSCPJA7 DB2U CICSUSER PROGDB2U 21787 +0.8840000000000000E-03 +0.4639999999999999E-032003-10-06-18.54.39.849064 SC66 SCSCPJA7 DB2U CICSUSER PROGDB2U 21789 +0.2284000000000000E-02 +0.1120000000000000E-022003-10-06-18.54.39.851756 SC66 SCSCPJA7 DB2U CICSUSER PROGDB2U 21791 +0.1080000000000000E-02 +0.1024000000000000E-022003-10-06-18.54.39.851808 SC66 SCSCPJA7 DB2U CICSUSER PROGDB2U 21793 +0.1747000000000000E-02 +0.4800000000000000E-032003-10-06-18.54.39.848959 SC66 SCSCPJA7 DB2N CICSUSER PROGDB2N 21786 +0.1342500000000000E-01 +0.9823999999999999E-022003-10-06-18.54.39.849042 SC66 SCSCPJA7 DB2U CICSUSER PROGDB2U 21788 +0.1380700000000000E-01 +0.1161600000000000E-012003-10-06-18.54.39.849108 SC66 SCSCPJA7 DB2U CICSUSER PROGDB2U 21790 +0.1463900000000000E-01 +0.1073600000000000E-012003-10-06-18.54.39.851784 SC66 SCSCPJA7 DB2R CICSUSER PROGDB2R 21792 +0.1306900000000000E-01 +0.1099200000000000E-01
450 CICS Performance Analyzer

19.5 ConclusionThis chapter showed how you can use the Historical Database. The creation, loading, and reporting from a summary HDB was demonstrated by going through an error scenario. The way the data is accumulated in an HDB allows for an easy way to detect eventual changes in the performance of your transactions or complete CICS system.
We used a list HDB to show the export function in more detail. The export function provides a flexible way to load selected CICS performance data into a DB2 table.
We also showed the easy-to-use maintenance and housekeeping functions of the Historical Database Manager.
Chapter 19. Historical Database 451

452 CICS Performance Analyzer

ronyms
ACB access control block
ACID atomicity, consistency, isolation, durability
AID automatic initiate descriptor
AOR application owning region
APAR authorized program analysis report
API application programming interface
APPC advanced program-to-program communication
ARM automatic restart manager
ASCII American Standard Code for Information Interchange
ATI automatic transaction initiation
BMS basic mapping support
BTS business transaction services
CAS coordinating address space
CF coupling facility
CICS Customer Information Control System
CICS PA CICS Performance Analyzer for OS/390
CICS TS Customer Information Control System Transaction server
CMAS CICSPlex System Manager address space
CMF CICS Monitoring Facility
CORBA Common Object Request Broker Architecture
CSA common system area
CSD CICS system definition
CTG CICS Transaction Gateway
CUA Common User Access
CWA common work area
CWS CICS Web Support
DASD direct access storage device
DBCTL database control
DCT destination control table
DPL distributed program link
DSA dynamic storage area
EBCIDIC Extended Binary Coded Decimal Interchange Code
ECB event control block
ECI external call interface
Abbreviations and ac
© Copyright IBM Corp. 2003. All rights reserved.
EDSA extended dynamic storage area
EIB EXEC interface block
EIP EXEC interface program
EJB Enterprise JavaBean
ELPA extended link pack area
EMP event monitoring point
EPI external presentation interface
ESDS entry sequenced data set
ESM external security manager
EXCI external CICS interface
FEPI front-end programming interface
FOR file owning region
GLUE global user exit
GMT Greenwich Mean Time
GTF Generalized Trace Facility
GUI graphical user interface
HDB Historical Database
HFS hierarchical file system
HLL high level language
HTML Hypertext Markup Language
HTTP hypertext transfer protocol
IBM International Business Machines
ICF Integrated Catalog Facility
IDE integrated development environment
IIOP Internet Inter-ORB Protocol
IMS Information Management System
IPCS Interactive Program Control System
IPL initial program load
IRC interregion communication
ISC intersystem communication
ISPF Interactive System Productivity Facility
ISV Independent Software Vendor
IT information technology
ITSO International Technical Support Organization
J2EE Java 2 Platform, Enterprise Edition
JCL job control language
JCT journal control table
JDK Java Development Kit
453

JNI Java native interface
JVM Java Virtual Machine
KSDS key sequenced data set
LE Language Environment
LPA link pack area
LPAR logical partition
LSR local shared resources
LU logical unit
LUW logical unit of work
MAS managed address space
MCT monitoring control table
MRO multiregion operation
MVS multiple virtual storage
OLTP online transaction processing
ORB Object Request Broker
OTE Open Transaction Environment
PDS partitioned data set
PDSE partitioned data set extended
PLT program list table
PLTPI program list table post initialization
PLTSD program list table shutdown
PTF program temporary fix
RACF® Resource Access Control Facility
RDO resource definition online
RLS record level sharing
RMF Resource Management Facility
RRDS relative record data set
SIT system initialization table
SMF system management facility
SMS storage management subsystem
SNA Systems Network Architecture
SOS short on storage
SQL Structured Query Language
SSL Secure Sockets Layer
SVC supervisor call
TCB task control block
TCP/IP Transmission Control Protocol/Internet Protocol
TCT terminal control table
TCTTE terminal control table terminal entry
TCTUA terminal control table user area
TD transient data
TIOA terminal input output area
TOR terminal owning region
TPNS Teleprocessing Network Simulator
TRUE task related user exit
TS temporary storage
TWA transaction work area
UOW unit of work
URL Uniform Resource Locator
URM user replaceable module
VSAM Virtual Storage Access Method
VTAM Virtual Telecommunications Access Method
WLM workload management
WUI Web User Interface
XML Extensible Markup Language
XPI exit programming interface
454 CICS Performance Analyzer

Related publications
The publications listed in this section are considered particularly suitable for a more detailed discussion of the topics covered in this IBM Redbooks publication.
IBM RedbooksFor information about ordering these publications, see “How to get IBM Redbooks” on page 456. Note that some of the documents referenced here may be available in softcopy only.
� Accounting and Chargeback with Tivoli Decision Support for OS/390, SG24-6044
� CICS Transaction Gateway V5: The WebSphere Connector for CICS, SG24-6133
� Enterprise JavaBeans for z/OS and OS/390 CICS Transaction Server V2.2, SG24-6284
� DB2 for z/OS and OS/390 Tools and Performance Management, SG24-6508
� DB2 Table Editor Tool Version 4.2, SG24-6833
Other publicationsThese publications are also relevant as further information sources:
� OS/390 V2R10.0 MVS Workload Management Services, GC28-1773
� OS/390 V2R10.0 MVS System Management Facilities (SMF), GC28-1783
� CICS Transaction Server for z/OS Release Guide, GC34-5983
� CICS Transaction Server for z/OS Migration Guide, GC34-5984
� z/OS V1R4.0 MVS System Management Facilities (SMF), SA22-7630
� DB2 UDB for OS/390 and z/OS Administration Guide, SC26-9931
� OS/390 Resource Management Facility User’s Guide, SC28-1949
� OS/390 Resource Management Facility Report Analysis, SC28-1950
� OS/390 Resource Management Facility Performance Management Guide, SC33-1951
� z/OS Resource Management Facility User’s Guide, SC33-7990
� z/OS Resource Management Facility Report Analysis, SC33-7991
� z/OS Resource Management Facility Performance Management Guide, SC33-7992
� CICS Transaction Server for z/OS CICS System Definition Guide, SC34-5988
� CICS Transaction Server for z/OS CICS Customization Guide, SC34-5989
� CICS Transaction Server for z/OS CICS Resource Definition Guide, SC34-5990
� CICS Transaction Server for z/OS CICS Operations and Utilities Guide, SC34-5991
� CICS Transaction Server for z/OS CICS Supplied Transactions, SC34-5992
� CICS Transaction Server for z/OS CICS Application Programming Guide, SC34-5993
� CICS Transaction Server for z/OS CICS Application Programming Reference, SC34-5994
� CICS Transaction Server for z/OS CICS System Programming Reference, SC34-5995
© Copyright IBM Corp. 2003. All rights reserved. 455

� CICS Transaction Server for z/OS Java Applications in CICS, SC34-6000
� CICS Transaction Server for z/OS Performance Guide, SC34-6009
� CICS Transaction Server for z/OS CICS DB2 Guide, SC34-6014
� WebSphere MQ for z/OS System Setup Guide, SC34-6052
� CICS Performance Analyzer for z/OS User’s Guide, SC34-6307
� CICS Performance Analyzer for z/OS Report Reference, SC34-6308
Online resourcesThese Web sites and URLs are also relevant as further information sources:
� CICS TS V2.2 online library
http://www.software.ibm.com/ts/cics/library/cicstsforzos22.html
� CICS Performance Analyzer online Library
http://www.software.ibm.com/ts/cics/library/cicspa.html/#books
� Fundi Software
http://www.fundi.com.au
How to get IBM RedbooksYou can search for, view, or download Redbooks, Redpapers, Hints and Tips, draft publications and Additional materials, as well as order hardcopy Redbooks or CD-ROMs, at this Web site:
ibm.com/redbooks
Help from IBMIBM Support and downloads
ibm.com/support
IBM Global Services
ibm.com/services
456 CICS Performance Analyzer

Index
Numerics3270 Bridge
interface 257two task model 80
Aabend B37 443accounting
CLASS 1 15class 1, class 3 15CLASS 2 15
ACCOUNTREC parameter 179ACCOUNTREC(TASK) 15ACCOUNTREC(UOW 15activity keypoint interval 236advanced program-to-program communication (APPC) 5AKPFREQ 226, 234APAR
PQ33097 263PQ34321 268PQ38838 321PQ63141 26, 139, 311PQ63143 26, 139, 311PQ63527 26, 311PQ76695 139PQ76701 139PQ76703 207PQ79058 26
API 7APPC connections 243Application Naming 311APPLID 90APPLID (MULTIPLE 101APPLID/MVS ID 100auto-journals 224auxiliary storage 216
BBTE execution phase 379BTS report 35, 61, 81Business Transaction Services report 82BWO facility 9
CCALL command 136capacity planning 16CBLPSHPOP 320CEDX 251CEECCICS 320CEECOPT 320CEEDOPT 320CEEROPT 320
© Copyright IBM Corp. 2003. All rights reserved.
CEEUOPT 321CEEWCOPT 320CEMT
INQUIRE JVM 303INQUIRE MONITOR 10INQUIRE TCPIPSERVICE 253SET DISPATCH 282SET DSN QUIESCE ALL 157SET MONITOR 10
CEMT SET MONITOR 164CETR transaction 324CICS
CICS-DB2 Attachment Facility xiii, 470CICS-VSAM interface xiii, 470data and utilities 17DB2 task-related user exit (TRUE) 173GTF data 22monitoring 10statistics 18
CICS and DB2 connectivity 173command threads 173entry threads 173pool threads 173
CICS Business Event Publisher for MQSeries 3–4, 8CICS Business Transaction Services (BTS) 81CICS DB2 Attachment Facility
functions 172overview 172reporting 179
CICS Interdependency Analyzer 3, 8CICS Monitoring Facility
data fields 48data transfer to SMF 10data types 10DFH$MCTD 14dictionary record 34exception class data 10–11, 25exception class records 51output processing 14performance class data 10–11, 25performance data 25performance records 44transaction resource class data 10, 12, 25–26user fields 34
CICS Online Transmission Time Optimizer 3CICS Performance Analyzer
Active status 41and Transaction Resource Monitoring 165benefits 7Class 3 list report sorted by transaction 213commands 64
for HDB processing 64for reports and extracts 64
comparison with CICS PM 8creating Report Sets data sets 35
457

data used 10default report format 65defining a new system 32dialog 25dictionary 34Edit Object List 56Edit Report Form 46Exception reports 61, 84Exclude Totals option 427exporting HDB data sets to DB2 441extracts 63EXWAIT field 344Function keys 26Global Options 38HDB housekeeping 439HDB maintenance 437importing extracted data
into Lotus 1-2-3 110into Microsoft Access 118into Microsoft Excel 113
invocation 29JCL edit 429JCL generation 42List Export 69maintaining Object Lists 56MCT specification 34Object Lists 56, 146Performance extracts 99Performance Graph reports 97Performance List Extended report 67Performance List report 65Performance reports 65Performance select statement 292Performance Summary report 70Performance Totals report 72preparing the SMF data 28Primary Option Menu 29, 143, 389Processing extracts with Microsoft Excel 112Profile Options Menu 29Recap report 77, 179Record Selection 271report format 73Report Set 60report tailoring 68reporting 34reporting CICS DB2 Attachment Facility 179Reports list 40requesting reports and extracts 35running reports 40sample forms 273selection criteria 347specifying report options 39submitting the Report Set 40Subsystem reports 62Summary Export 72System Definitions Menu 30system grouping 33System Logger report 96tailoring Report Forms 44take-up 30, 389
job 271Take-Up from SMF 143, 159Take-up function 208Transaction Group report 261Transaction Resource Usage report 62Wait Analysis report 75Web report 261working with different CICS releases 358
CICS Performance Analyzer commandsCROSS 64DB2 64EXPORT 64FIND command 47GRAPH(RESPONSE) 64GRAPH(TRANRATE) 64LIST 64LISTEXC 64LISTX 64LOGGER 64MQ 64NEW command 32RECSEL 64RESUSAGE(FILESUM) 64RESUSAGE(TRANLIST) 64RESUSAGE(TSSUM) 64RUN command 54SAMPLES command 45SUMEXC 64SUMMARY 64TOTAL 64TRANGROUP 64VERIFY command 441WAITANAL 64WORKLOAD 64
CICS Performance Analyzer commands for HDB pro-cessing
HDB(HKEEP) 65HDB(LOAD(hdbname) 64HDB(REPORT(hdbname)) 65
CICS Performance Analyzer DB2 Reports content 179Buffer Manager statistics 179Class 1 Thread elapsed and CPU times 179Class 2 In-DB2 elapsed and CPU times 179Class 3 Suspend times 179DB2 Thread Identification 179Locking statistics 179SQL DML statistics 179
CICS Performance Analyzer fieldsAPPLPROG 312APPLTRAN 312Count with DASD Write 227Count without DASD Write 227DB2CONWT 178, 192, 197DB2RDYQW 178DB2REQCT 178DB2WAIT 179DISPWAIT 178EXWAIT 344MAXJTDLY 279ORIGIN 261
458 CICS Performance Analyzer

RMI MQ time field 216RMISUSP 178RMITIME 178TDWAIT 48
CICS Performance Analyzer functionsFIELDS/BY 312Maintain SMF files 249Take-up from SMF 179
CICS Performance Analyzer Report Forms 45TDLST 45TDSUM 45
CICS Performance Analyzer reportsBTS report 61, 81Business Transaction Services 82Cross-System Work Extended 377Cross-System Work extract 63, 80Cross-System Work report 61, 77
UOWs selection 375DB2 List 179DB2 report 62, 89DB2 Summary 179Exception List report 84, 353Exception reports 61, 84Exception Summary report 85, 353exclusion list
CFQR - RLS quiesce 363CFQS - RLS quiesce 363CKTI - MQSeries default listener task initiator 363COHT - CICSPlex SM completed task history re-corder 363COI0 - CICSPlex SM CMAS communication task 363COIE - CICSPlex SM hearbeat task 363CONL - CICSPlex SM MAS initialization and con-trol transaction 363CONM - CICSPlex SM monitoring task 363CSHQ - Scheduler services 363CSKL - TCP/IP default Sockets listener 363CSNC - IRC connection manager 363CSNE - VTAM node abnormal 363CSOL - TCP/IP listener 363CSSY - CICS internal task 363CSTP - CICS internal task 363CSZI - FEPI 363
Export extract 63File Usage Summary report 62, 86List report temporary storage usage of MQ transac-tions 216Logstream Summary report 232Performance Graph 97Performance List Extended report 65, 68Performance List report 61, 65Performance selection criteria 261Performance Summary report 61, 65Performance Totals report 61, 65Recap report 179Record Selection extract 63Report Set screen 260sample reports
Report Form CPULST 359
SSTORLST 263USTORLST 263
System Logger - Logstream Summary report 96System Logger report 94Temporary Storage Usage Summary report 62, 87Transaction Group option 260Transaction Group report 61Transaction Rate Graph report 63, 97Transaction Resource Usage List report 62, 88Transaction Response Time Graph report 63, 98–99Wait Analysis report 61
section 1 402section 2 402
WebSphere MQ report 62, 91Workload Activity report 61, 82, 378Workload Activity Summary report 378
CICS Performance Monitorbenefits 7comparison with CICS PA 8history definitional 6monitoring component 6reporting component 6server component 6threshold definitional component 6view sets
CICS dispatcher 6CICS region 6CICS storage (DSA and subpool usage) 6DB2 connection 6enqueue pools 6global and task related user exits 7JVM pool 7loader 6recovery manager, including UOW analysis 6temporary storage 6transaction manager 6transient data 6
workstation client 6CICS resources
connections 7files, data tables, and local shared resource (LSR) pools 7journals 7log streams 7programs 7temporary storage queues 7terminals 7transaction classes 7transactions 7transient data queues 7
CICS SMF records 416CICS statistics data
DFH0STAT 19end-of-day 18interval 18processing 19requested 18requested reset 18unsolicited 18
CICS system definition after take-up update 160
Index 459

CICS temporary storage queue 206CICS tools
CICS Business Event Publisher for MQSeries 3, 8CICS Interdependency Analyzer 3–4, 8CICS Online Transmission Time Optimizer 3–4, 8CICS Performance Analyzer 4CICS Performance Monitor 4CICS VSAM Recovery 3, 9IBM Session Manager for z/OS 3, 9
CICS Transaction Gateway 131, 241–242CICS Transaction Server xiii, 470
V1.3 xiii, 470V2.2 xiii, 470
CICS TS V2.2 195CICS VSAM interface 140CICS VSAM Recovery 3, 5, 9CICS Web Support (CWS) 80CICS/ESA V4.1 242CICS/VSE 2.3 242CICSPFOR 34CICSPlex SM 130
address space (CMAS) 130Web User Interface (WUI) 6
CICSPlex System Manager (CICSPlex SM) 6CICSVR 9CIEP transaction 253CIRP transaction 300, 376Class 1 91Class 3 91Class 3 List report
detailed look at MQ activity 211sorted by transaction 213
-classpath parameter 246CLER transaction 321client daemon 242CLIENTCLASSPATH variable 246CLOCK operand 323CMF 6
data fields 48dictionary 358dictionary record 34, 358exception class data 61exception class records 51fields 35, 53, 100input data 77performance class clock field 444performance class data 61–63
summarized by transaction and program 184performance class record 35, 51, 65, 67, 70, 73, 78, 90, 207performance data 105performance fields 359performance record 44, 359
making a subset 356suspend components 77transaction resource class data 62transaction resource class record 51user fields 34–35
CMF monitor dataexception class data 10
performance class data 10transaction resource class data 10
COBOL 245, 386command threads 173COMMAREA 245Common User Access (CUA) 9CONCURRENCY parameter 194CONCURRENCY(THREADSAFE) parameter 176connections 7CORBA 268correlating performance data
between CICS and DB2 90, 186, 197between CICS PA and DB2 PM 38between multiple CICS systems 61by CICS BTS process ID 61by network UOW ID 12by transaction group 80by transaction sequence number 12Cross-System Work Extended report 377Cross-System Work report 77in a Cross-System Work report 61Workload Activity report 378
coupling facilitydata table 85log structure 224
CPA0311E 359CPMI transaction 255CPU 105CPU and Dispatch statistics 73CPUSUM report form 368CREA transaction 287CROSS command 64Cross-System Work Extended report 377Cross-System Work extract 35, 63, 99Cross-System Work report 35, 61, 77, 376, 403
default format 78tailoring 79
CSMI transaction 249–250CSOL transaction 258, 363CSQ4CVJ1 206CSQ4CVK1 206CTG is V5.0.1 242CTG_RRMNAME environment variable 255CUA (Common User Access) 9CWBA transaction 263CWS URL 258CWXN storage consumption 263CWXN transaction 257, 260, 266
DDASD offloading 224DASD shift 224, 227, 233DASD-only 224DB2 6, 24
abend S04E 447attachment 433CICS-DB2 Attachment Facility xiii, 470command 448database 444messages 449
460 CICS Performance Analyzer

objects 449RMI 433SQL 418table 449tablespace 444update 434
DB2 accounting data 14DB2 accounting trace 14DB2 Attachment Facility
API 172attachment commands 172DB2 commands 172
DB2 authorization checking 172DB2 command 64DB2 command thread 173DB2 entry threads 173DB2 List report 186DB2 Performance Monitor (DB2 PM) 90DB2 Performance Monitor for OS/390 5DB2 Plan name 90DB2 PM 38, 90DB2 report 35, 62, 89–90
List 197Long Summary 185, 193, 197Recap 179Short Summary 184, 192, 197
DB2 SQL Performance Analyzer for OS/390 5DB2 SSID (subsystem ID) 182DB2 table 451DB2 time stamps 38DB2 V7.1 address space 171DB2CONN
ACCOUNTREC parameter 15definition 176, 194
DB2ConWt field 192DB2ENTRY
ACCOUNTREC parameter 15definition 179, 187, 193–194PROTECTNUM parameter 173THREADLIMIT parameter 173
DB2I interface 447DB2Wait field 177DBCTL 13, 67
statistics 67DDL 444Debug Tool for z/OS and OS/390 5DELETEQ TS 217DFH$JVM group 269DFH$MCTD 14DFH$MOLS 5, 20DFH$SOT 263DFH0STAT 5, 19DFHAPPL 26DFHBWTTA 258DFHCSDUP 18DFHJUP 17, 21DFHLOG 225–227, 233DFHLSCU 228, 236DFHMCT 12, 14, 139DFHMCTA$ 14
DFHMCTD$ 14DFHMCTF$ 14DFHMCTT$ 14DFHMNDUP 20, 35DFHMNRDS 164DFHRMI 26DFHSHUNT 226, 233DFHSIT parameters 251DFHSTUP 5, 19DFHWBTTA 258, 263DFJ$TS1 program 269DFSMS 140DFSMSdss 9DFSMShsm 9dictionary 358dictionary record 325, 358, 360Distributed Program Link (DPL) 78distributed routing 131DSECT 19DSNC 172DSNCLI 173, 287duplexed 224dynamic transaction backout 224
EECI interface 131, 243ECI over TCP/IP 246ECI_EXTENDED parameter 255ECI_LUW_NEW parameter 252ECI_NON_EXTEND parameter 252ECI_NON_EXTENDED parameter 255ECIRequest 132ECIRequest Java class 245Edit Report Form 46EMP (event monitoring point) 12, 312, 321Enterprise JavaBean 268
definition 268entity bean 269in CICS 135session beans 268workloads 130
entry threads 173EPI interface 131, 243ESI interface 243event monitoring point (EMP) 12, 312, 321
user-defined in MCT 73exception class data 11, 61exception class records 344Exception List report 61, 84, 353Exception records 11
Wait for auxiliary temporary storage 11Wait for auxiliary temporary storage buffer 12Wait for auxiliary temporary storage string 12Wait for coupling facility data tables locking (request) slot 12Wait for coupling facility data tables non-locking (re-quest) slot 12Wait for file buffer 12Wait for file string 12Wait for LSRPOOL string 12
Index 461

Wait for storage in the CDSA 11Wait for storage in the ECDSA 11Wait for storage in the ERDSA 11Wait for storage in the ESDSA 11Wait for storage in the EUDSA 11Wait for storage in the RDSA 11Wait for storage in the SDSA 11Wait for storage in the UDSA 11
Exception reports 61, 84Exception List 61Exception Summary 61
exception selection criteria 51Exception Summary report 61, 85, 353EXCI calls 131EXCI interface 131, 246Exclude Totals option 427EXE execution phase 380EXEC CICS
ASSIGN PROGRAM 318COLLECT STATISTICS 19HANDLE 320IGNORE 320INQUIRE MONITOR 10INQUIRE STATISTICS 19LINK 268MONITOR 323POP HANDLE 320PUSH HANDLE 320RETURN 320SET MONITOR 10, 312START TRANSACTION 268SUSPEND 434
Export extract 63, 101External Call Interface (ECI) over TCP/IP 80External Resource Managers (ERM) 417extract record format 100, 104extract record tailoring 103extracts 63
Cross-System Work 80, 99DB2 example 202Export 101importing data into Lotus 1-2-3 110importing into Microsoft Access 118importing into Microsoft Excel 113LINK/CALL example 340processing with Lotus 1-2-3 108, 332processing with Microsoft Access 118processing with Microsoft Excel 112Record Selection 104VSAM example 156
EXWAIT field 344EYU9XLOP 131, 300
FFile Control (F) 78File Usage detailed list report 406File Usage Summary report 62, 86, 167filtering
see selection criteriathe report 51
FIND command 53forward recovery logs 224function shipping 140function shipping request 78
Ggateway daemon 242Generalized Trace Facility (GTF) 22GET requests 213GETMAIN 265gettype 206global options 37group of systems 42, 361GTF (Generalized Trace Facility) 22
HHDB
exporting data sets to DB2 441housekeeping 439–440list 437maintenance 437overview 416primary menu 418register 419register KSDS 439templates 419
HDB LOAD 431HDB Manager 425HDB Report panel 427HDB Reporting panel 425HFS 270HFS, jvm.properties file location 270HIGHOFFLOAD 225Historical Database (HDB) 23
list HDB 25summary HDB 25
Historical Database Menu 441historical performance database xiii, 470home interface 131HP-UX 242HTTP header 262HTTP protocol 258HTTPNSSL TCPIPSERVICE 263HTTPS 243
II SMF command 288, 302IBM CICS Transaction Gateway (CTG) 242IBM Fault Analyzer for z/OS and OS/390 5IBM File Manager for z/OS and OS/390 5IBM Session Manager for z/OS 3–4, 9IBM VTAM 9IBM WebSphere Application Server 242IDCAMS VERIFY 439IFASMFDP 388IIOP inbound requests 131IIOP listener regions 130IMS 6
462 CICS Performance Analyzer

IMS (DBCTL) 24Integrated Development Environment (IDE) 268interim storage 16Internet Inter-ORB Protocol (IIOP) 80Interval Control (I) 78IXCMIAPU utility 227IXGRPT1 94
JJAR files 242Java applications in CICS 135Java class library 242Java enterprise beans 242Java Native Interface 243Java servlets 242JCICS 268JCICS (VSAM) workload 307JCICS classes 135JCL
generation 42Report Set JCL 55
JDBC 269interface 135support in CICS 268, 287workload 305
JNDI API 131JOURNALMODEL definition 227journals 7JVM performance measurement 271JVM properties file 270JVMPROFILE
CLASSPATH 270JVMPROPS 269–270parameter 269Xresettable 270
KKeep-alive HTTP header 262KY8 CPU Time 359
LLanguage Environment run-time options
ALL31(ON) 322CEECOPT 320CEEDOPT 320CEEROPT 320CEEUOPT 321CEEWCOPT 320CEEWROPT 320CEEWUOPT 321
LDAP server 131LE/370 environment 136Linux for S/390 242LIST command 64list HDB 437list of network UOWs with DB2 activity 186LISTEXC command 64LISTX command 64
LISTX Report Forms 373BADCPU 373BADRESP 373
local shared resources (LSR) 140log stream 7
coupling facility 16, 224DASD-only 16, 224
LOGGER command 64logstream definition parameters
HIGHOFFLOAD 225LOWOFFLOAD 226LS_SIZE 226STG_SIZE 226
logstream parametersDSEXTENT 233LOWOFFLOAD 236
Lotus 1-2-3 108importing extracted data to Lotus 1-2-3 110
LOTUS123 109LOWOFFLOAD 225, 228LSR (local shared resources) 140
MMAXOPENTCBS 176, 198MCT 314
EMP1.1 323EMP1.2 323SCLOCK(2) 323SCPUCLK(1) 323
MCT (monitoring control table) 67measurement criteria 4messages
CPA0311E 359CPA0329E 360CPA1028E 54CPA1030E 54
Microsoft Access 107, 118importing data into Microsoft Access 118
Microsoft Excel 107, 113, 151, 156importing extracted data into Microsoft Excel 113Processing extracts with Microsoft Excel 112
Microsoft Graph 2000 118mirror tasks 251mirror transaction 245MNEXC=ON 12MNRES=ON 164monitoring control table 14, 321
APPLNAME parameter 312DFHMCT TYPE=EMP 13DFHMCT TYPE=INITIAL 14, 312DFHMCT TYPE=RECORD 14EMP entry 13event monitoring point 321FILE parameter 164samples 14
monitoring control table (MCT) 35, 67monitoring domain exit 164MQ accounting trace 16MQGET 206MQPUT 206
Index 463

MRO 5, 33MROLRM SIT parameter 252msglength 206multithread enterprise bean 300MVGT transaction 208MVPT transaction 213MVS ID (CICS) 101MVS Workload Manager 24MVS Workload Manager (WLM) service 61
NNEW command 36, 48, 56New Report Form 48nonshared resources (NSR) 140non-threadsafe environment 174non-volatile coupling facility 224NSR (nonshared resources) 140nummsgs 206
OObject List
creation 146EJB example 308excluding CICS system transactions 364maintaining 56VSAM example 146
Open Transaction Environment (OTE) 171, 173OS/390 242Overall CICS System Usage 73
Ppadchar 206Parallel Sysplex 130performance class clock field 444performance class data 11, 61–63
summarized by transaction and program 184performance class record 35, 65, 67, 70, 73, 78, 90, 207performance criteria 364performance data 25, 105performance data record 10Performance extracts 99performance fields 359Performance Graph report 63, 97Performance List Extended report 61, 67
default format 68export to extract data set 69tailoring 68VSAM example 153
Performance List report 61, 65Application Naming example 312CICS Transaction Gateway example 251CICS Web Support example 264DBCTL example 66default format 65EJB example 294export to extract data set 67Java example 275tailoring 66
VSAM example 152performance objectives 4, 142, 158, 387performance record 359
making a subset 356Performance reports 65Performance select statement 148, 154Performance selection criteria 51, 57Performance Summary report 61, 70
CICS Transaction Gateway example 250, 255default format 70EJB example 294export to extract data set 72Java example 276tailoring 70VSAM example 145
Performance Totals report 61, 72, 362persistence 206Personal Communications 150pool threads 173Primary Option Menu 29PROGRAM definition 269programs 7PROTECTNUM parameter 173PTF 12
UQ68396 26UQ68398 26UQ68400 26UQ70905 26UQ70908 26UQ70913 26
Qqname 206QR TCB 174, 434quasi-re-entrant TCB 174QUASIRENT 417
RRecap report 101Record Level Sharing (RLS) 140Record Selection extract 63, 104Record Selection report 271record type 88 16Redbooks Web site 456
Contact us xvReport Form
data set 44field categories 48list 45sample 45TDSUM 46types 44using in your report 49
report format default 65Report Set 60
creation 147Global Options 38
REQUESTMODEL definition 287Resource Management Facility 22
464 CICS Performance Analyzer
Resource Manager Interface (RMI) 417Resource Utilization statistics 73restricting report output size 373RESUSAGE(FILESUM) command 64RESUSAGE(TRANLIST) command 64RFIND command 53RLS (Record Level Sharing) 140RMI MQ field 221RMI parameter 207RMIMQM field 216RO CPU Time 359RUN command 54, 191
SSCEERUN library 320SCEESAMP library 320SCS-type printers 8SDFHLOAD 35selection criteria 52Session Manager for z/OS 9SETTINGS command 27sharable application classpath 270single thread enterprise bean 287SIT parameters
AKPFREQ 226, 234LGDFINT 228MAXJVMTCBS 270, 277MAXOPENTCBS 176, 194, 199MN 10, 164MNEXC 10MNPER 10, 20MNRES 10, 163MROFSE 251MROLRM 251RUWAPOOL 320, 336STATRCD 19TCBLIMIT 187TCP=YES 363
SMF (system management facility) 5, 25SMF 101 DB2 accounting records 63SMF 101 record 14SMF 110 CMF performance records 63SMF 110 record 10SMF 116 record 15SMF 116 WebSphere MQ accounting records 63SMF command I SMF 28SMF dump program (IFASMFDP) 28SMF records
CICS Monitoring Facility (110) 5DB2 Accounting (101) 5, 14SMF 101 DB2 accounting records 63SMF 110 CMF performance records 63SMF 116 WebSphere MQ accounting records 63System Logger (88) 5, 16, 226
Socket Listener 258socket TCB 266SOCKETCLOSE 258SOCKETCLOSE parameter 257SPUFI 449SQL statements
GRANT 172REVOKE 172SELECT with FETCH FIRST 10 ROWS ONLY option 382
SQLJ 269, 287SQLJ interface 135SQLJ support in CICS 268, 287SQLJ workload 302SSL 243Staging Data Set Threshold Hit condition 232staging-data-set-full event 227stateful session beans 269stateless CORBA objects 268stateless session beans 269STATISTICS 19structure alter event 95Subsystem report 62, 89SUMEXC command 64SUMMARY command 64Summary Report Form 145Sun Solaris 242suspend components 77SYNCONRETURN option 251syncpoint 206, 251SYSDEFLT 444SYSIBM.SYSTABLES 449System Logger 6
List report 238Logstream Summary report 232report 94
system management facility (SMF) 5, 25System reports 62, 94system resources manager (SRM) 22
TTake-up command 188Take-Up from SMF 249
update information 159Take-up function 208task-related user exit 173TCB
open (L8) 175quasi-reentrant 266socket 266thread 173
TCBLIMIT parameter 176, 194, 197TCP/IP 131TCP/IP interfaces 253TCP62 243TCPIPSERVICE definition 253, 257–258Teleprocessing Network Simulator (TPNS) 130, 140–141, 386temporary storage 78
queues 7Temporary Storage Usage Summary report 62, 87terminals 7THREADLIMIT 198, 203THREADLIMIT parameter 187, 193–194THREADSAFE 417threadsafe environment 175
Index 465

time zone 38Tivoli Decision Support 19Tivoli Decision Support for OS/390 22TOTAL command 64TRANGROUP command 64transaction 7transaction classes 7transaction execution phases
begin-to-end 379execution 379
Transaction Group option 260Transaction Group report 35, 80, 260Transaction Rate Graph report 63, 97–98transaction resource class data 12, 26, 62transaction resource data record 11Transaction Resource Monitoring 14, 165Transaction Resource Monitoring support 163Transaction Resource Usage List report 62, 168Transaction Resource Usage report 62, 85, 88Transaction Response Time Graph report 63, 98–99transaction routing 130Transient Data (D) 78transient data queue 7
CESE 321TSPUTAux column 217TXSeries CICS Servers 243TYPE=INITIAL macro 207
UUOW 186User Field statistics 73user fields 13, 136, 319user journals 224user-replaceable modules (URM)
DFHWBADX 259program autoinstall 338
VVERIFY command 441view sets
CICS dispatcher 6CICS region 6CICS storage (DSA and subpool usage) 6DB2 connection 6enqueue pools 6global task related user exits 7JVM pool 7loader 6recovery manager, including UOW analysis 6temporary storage 6transaction manager 6transient data 6
volatile coupling facility 224VSAM 386
CICS-VSAM interface xiii, 470KSDS 416Local Shared Resource 130nonshared resource 140Record Level Sharing 130, 140
VSE/ESA V1 242VTAM Generic Resource 130
WWait Analysis report 61, 75, 398WAITANAL command 64WebSphere Accounting 206WebSphere Application Server
Application Assembly Tool 245, 252connectivity with CICS 243
WebSphere MQ 6, 24, 205–206accounting data 15API calls MQGET and MQPUT 206CICS PA reports overview 206MQFI START TRACE 207queue manager 206SMF accounting records 205transactions
MVGT,nummsgs,gettype,syncpoint,qname 206MVPT,nummsgs,padchar,msglength,persis-tence,qname 206
WebSphere MQ reports 62, 91, 134, 211Class 1 List and Summary reports 134Class 3 List and Summary reports 134
WebSphere Studio Application Developer 268Windows 2000 241Windows NT 242wizard icon 115Workload Activity Report 61, 82–83
Workload Manager Activity List report 378Workload Manager Activity Summary by Service Class 381Workload Manager Activity Summary report 380
Workload Activity report 35Workload Manager Activity List report 378Workload Manager Activity Summary by Service Class 381Workload Manager Activity Summary report 380
XXMNOUT 164Xresettable parameter 270
Zz/OS 241
CICS Transaction Gateway 131Generalized Trace Facility 22Lightweight Directory Access Protocol 131Resource Measurement Facility 61Resource Recovery Services 255System Logger 224System Management Facility 5
zSeries toolsApplication Development 5CICS tools 5data management 5system management 5
466 CICS Performance Analyzer
(1.0” spine)0.875”<
->1.498”
460 <->
788 pages
CICS Performance Analyzer


®
SG24-6063-00 ISBN 0738499013
INTERNATIONAL TECHNICALSUPPORTORGANIZATION
BUILDING TECHNICAL INFORMATION BASED ON PRACTICAL EXPERIENCE
IBM Redbooks are developed by the IBM International Technical Support Organization. Experts from IBM, Customers and Partners from around the world create timely technical information based on realistic scenarios. Specific recommendations are provided to help you implement IT solutions more effectively in your environment.
For more information:ibm.com/redbooks
CICS Performance Analyzer
Gain insight to the IBM WebSphere MQ reporting capabilities
Explore enhanced CICS Monitoring Facility (CMF) resource class reporting
Learn how to work with historical performance data
This IBM Redbooks publication targets CICS Transaction Server V1.3 and V2.2 customers who plan to implement IBM CICS Performance Analyzer. With this tool, you can produce a wide range of reports and extracts to help you tune and manage CICS systems.
The first part of this book begins with an overview of CICS-provided tools and utilities that help you gather and analyze performance data. It introduces the CICS Performance Analyzer product and its various report generating options. It also shows you how to import the extracted performance data into spreadsheets for further analysis.
The second part of this book takes you through a series of scenarios that cover major CICS components and interfaces. These include CICS-VSAM interface, CICS-DB2 Attachment Facility, CICS use of the MVS System Logger, Java applications in CICS, and others. For each scenario, you see how you can extract the relevant performance data using CICS Performance Analyzer. You can then use this data to improve the overall system performance or to compare different execution options at run time.
This Redbooks publication explores the new functionality of CICS PA Release 1.3, including IBM WebSphere MQ and how CICS PA now handles System Management Facility (SMF) 116 records. It looks at the new CICS Monitoring Facility (CMF) reports such as the Wait Analysis and Temporary Storage Usage reports. It aslo explains the Historical Database (HDB) facility for maintaining a history of CMF performance data for longer term reporting or exporting to DB2.
Back cover