cibc investor presentation – first quarter 2020€¦ · investor presentation first quarter 2020...
TRANSCRIPT

Investor PresentationFirst Quarter 2020February 26, 2020

Forward-Looking Statements
2
A NOTE ABOUT FORWARD-LOOKING STATEMENTS: From time to time, we make written or oral forward-looking statements within the meaning of certain securities laws, including in this report, in other filings with Canadian securities regulators or the SEC and in other communications. All such statements are made pursuant to the “safe harbour” provisions of, and are intended to be forward-looking statements under applicable Canadian and U.S. securities legislation, including the U.S. Private Securities Litigation Reform Act of 1995. These statements include, but are not limited to, statements made in the “Financial performance overview – Economic outlook”, “Financial performance overview – Significant events”, “Financial performance overview –Financial results review”, “Financial condition – Capital management”, “Management of risk – Risk overview”, “Management of risk – Top and emerging risks”, “Management of risk – Credit risk”, “Management of risk – Market risk”, “Management of risk – Liquidity risk”, “Accounting and control matters – Critical accounting policies and estimates”, “Accounting and control matters –Accounting developments”, and “Accounting and control matters – Other regulatory developments” sections of this report and other statements about our operations, business lines, financial condition, risk management, priorities, targets, ongoing objectives, strategies, the regulatory environment in which we operate and outlook for calendar year 2020 and subsequent periods. Forward-looking statements are typically identified by the words “believe”, “expect”, “anticipate”, “intend”, “estimate”, “forecast”, “target”, “objective” and other similar expressions or future or conditional verbs such as “will”, “should”, “would” and “could”. By their nature, these statements require us to make assumptions, including the economic assumptions set out in the “Financial performance overview – Economic outlook” section of this report, and are subject to inherent risks and uncertainties that may be general or specific. A variety of factors, many of which are beyond our control, affect our operations, performance and results, and could cause actual results to differ materially from the expectations expressed in any of our forward-looking statements. These factors include: credit, market, liquidity, strategic, insurance, operational, reputation, conduct and legal, regulatory and environmental risk; the effectiveness and adequacy of our risk management and valuation models and processes; legislative or regulatory developments in the jurisdictions where we operate, including the Dodd-Frank Wall Street Reform and Consumer Protection Act and the regulations issued and to be issued thereunder, the Organisation for Economic Co-operation and Development Common Reporting Standard, and regulatory reforms in the United Kingdom and Europe, the Basel Committee on Banking Supervision’s global standards for capital and liquidity reform, and those relating to bank recapitalization legislation and the payments system in Canada; amendments to, and interpretations of, risk-based capital guidelines and reporting instructions, and interest rate and liquidity regulatory guidance; the resolution of legal and regulatory proceedings and related matters; the effect of changes to accounting standards, rules and interpretations; changes in our estimates of reserves and allowances; changes in tax laws; changes to our credit ratings; political conditions and developments, including changes relating to economic or trade matters; the possible effect on our business of international conflicts and terrorism; natural disasters, public health emergencies, disruptions to public infrastructure and other catastrophic events; reliance on third parties to provide components of our business infrastructure; potential disruptions to our information technology systems and services; increasing cyber security risks which may include theft or disclosure of assets, unauthorized access to sensitive information, or operational disruption; social media risk; losses incurred as a result of internal or external fraud; anti-money laundering; the accuracy and completeness of information provided to us concerning clients and counterparties; the failure of third parties to comply with their obligations to us and our affiliates or associates; intensifying competition from established competitors and new entrants in the financial services industry including through internet and mobile banking; technological change; global capital market activity; changes in monetary and economic policy; currency value and interest rate fluctuations, including as a result of market and oil price volatility; general business and economic conditions worldwide, as well as in Canada, the U.S. and other countries where we have operations, including increasing Canadian household debt levels and global credit risks; our success in developing and introducing new products and services, expanding existing distribution channels, developing new distribution channels and realizing increased revenue from these channels; changes in client spending and saving habits; our ability to attract and retain key employees and executives; our ability to successfully execute our strategies and complete and integrate acquisitions and joint ventures; the risk that expected synergies and benefits of an acquisition will not be realized within the expected time frame or at all; and our ability to anticipate and manage the risks associated with these factors. This list is not exhaustive of the factors that may affect any of our forward-looking statements. These and other factors should be considered carefully and readers should not place undue reliance on our forward-looking statements. Any forward-looking statements contained in this report represent the views of management only as of the date hereof and are presented for the purpose of assisting our shareholders and financial analysts in understanding our financial position, objectives and priorities and anticipated financial performance as at and for the periods ended on the dates presented, and may not be appropriate for other purposes. We do not undertake to update any forward-looking statement that is contained in this report or in other communications except as required by law.
Investor Relations contacts:Geoff Weiss, Senior Vice-President 416 980-5093Investor Relations Fax Number 416 980-5028Visit the Investor Relations section at www.cibc.com

CIBC OverviewVictor DodigPresident and Chief Executive Officer

First Quarter 2020 Key Performance Measures
4
EPS Q1/20 EPS
Reported $2.63
Adjusted1 $3.24+8% YoY
2020 Guidance Low Single Digit
Efficiency Ratio Q1/20 EffieiencyRatio
Reported 63.1%
Adjusted1 55.0%+60 bps YoY
2022 Guidance2 53.5% - 54.0%
CET1 Ratio Q1/20 CET1 Ratio
11.3% +4 bps YoY
2020 Guidance 11.0% - 11.5%
ROE Q1/20 ROE
Reported 13.1%
Adjusted1 16.1%+10 bps YoY
Target3 15%+
PCL Ratio on Impaired
Q1/20 PCL Ratio on
impaired
0.24% -6 bps YoY
2020 Guidance <0.30%
Dividend Payout Ratio – Trailing 12 Months
Q1/20 Trailing 12 months dividend payout ratio
Reported 50.6%
Adjusted1 46.7%+200 bps YoY
Target3 40% - 50%
1 Adjusted results are non-GAAP financial measures. See slide 28 for further details. 2 2017 Investor Day target of 52.0% by F2022, adjusted for macroeconomic factors.3 2017 Investor Day through the cycle target.

Accelerating our transformation journey
5
Purpose-led culture
• A relentless focus on deepening client relationships
• Investing in new technology to service our clients
• Flexible, progressive workplace that inspires and enables greater connectivity
Optimize efficiency
• Leveraging technologies to drive efficiencies
• Enterprise-wide restructuring to accelerate delivery on priorities
• Reskilling / upskilling talent base aligned to priorities
Disciplined capital deployment
• Growing U.S. earnings contribution through organic and inorganic investments
• Deploying capital to core businesses
• Accelerating pace of share buybacks
• Increasing quarterly dividend by $0.02 to $1.46 per share

Financial ReviewHratch PanossianSenior Executive Vice-President and Chief Financial Officer

Strong earnings driven by Capital Markets
7
Reported ($MM) Q1/20 YoY QoQRevenue 4,855 6% 2%
Net interest income 2,761 6% (1%)Non-interest income 2,094 6% 6%
Non-Interest Expenses 3,065 11% 8%Provision for Credit Losses 261 (23%) (35%)Net Income 1,212 3% 2%Diluted EPS $2.63 1% 2%Efficiency Ratio 63.1% 260 bps 360 bpsROE 13.1% (70) bps 20 bpsCET1 Ratio 11.3% 4 bps (28) bps
Adjusted1 ($MM) Q1/20 YoY QoQRevenue 4,855 7% 3%
Net interest income 2,761 7% 1%Non-interest income 2,094 6% 6%
Non-Interest Expenses 2,699 8% 2%Pre-Provision Earnings2 2,156 5% 6%Provision for Credit Losses 261 (23%) (35%)Net Income 1,483 9% 13%Diluted EPS $3.24 8% 14%Efficiency Ratio 55.0% 60 bps (100) bpsROE 16.1% 10 bps 190 bps
Earnings – Adjusted1
• EPS growth of 8% YoY
• ROE of 16.1%
Revenue• Strong trading and underwriting activity in Capital Markets
• Double-digit volume growth in Canadian and U.S. Commercial businesses
• Continued deposit growth, stabilization of RESL volumes and YoY NIM expansion in Canadian Personal & Small Business Banking
Expenses• Expense growth driven by higher performance-based
compensation and continued investments to fuel future growth
• Reported results include restructuring charge of $339MM (after-tax: $250MM), primarily relating to employee severance
Provision for Credit Losses (PCL)• PCL ratio on impaired of 24 bps, down 6 bps YoY and 9 bps
QoQ
• Total PCL ratio of 26 bps, down 9 bps YoY and 14 bps QoQ
1 Adjusted results are non-GAAP financial measures. See slide 28 for further details. 2 Pre-provision earnings is revenue net of non-interest expenses and is a non-GAAP measure. See slide 28 for further details.

Capital position continues to be strong
8
CET1 Ratio
11.6%
11.3%
33 bps
(36) bps(10) bps
Q4/19 Earnings net ofDividends
RWAs(excl. FX)
RestructuringCharge
Regulatory/ModelUpdates and Other
Q1/20
(14) bps
Pro forma 11.7%
Q1 Highlights• Strong internal capital generation
• Strong organic RWA growth which includes some timing related items
• Share buyback included in Other (-7 bps)
• Pro forma CET1 ratio of 11.7% after expected sale of controlling interest in FCIB
• Liquidity coverage ratio of 125% and leverage ratio of 4.3%

Continuing progress in Personal and Small Business Banking
9
Reported ($MM) Q1/20 YoY QoQRevenue 2,214 2% (0%)
Net interest income 1,618 4% (1%)Non-interest income 596 (1%) 0%
Non-Interest Expenses 1,159 (13%) 0%Provision for Credit Losses 215 3% (16%)Net Income 617 34% 3%
Adjusted1 ($MM) Q1/20 YoY QoQRevenue 2,214 2% (0%)
Net interest income 1,618 4% (1%)Non-interest income 596 (1%) 0%
Non-Interest Expenses 1,157 5% 0%Pre-Provision Earnings2 1,057 (1%) (1%)Provision for Credit Losses 215 3% (16%)Net Income 619 (2%) 3%
• Higher net interest income driven by growth in deposit volumes and margin expansion
• Deposit balances up 6% YoY
• NIM up 9 bps YoY and stable sequentially
• Continued investments in our front-line capabilities, infrastructure and technology
• Provision for Credit Losses:
• PCL ratio on impaired of 30 bps
• Total PCL ratio of 33 bps
Loans and Deposits Efficiency Ratio – Adjusted1
1 Adjusted results are non-GAAP financial measures. See slide 28 for further details. 2 Pre-provision earnings is revenue net of non-interest expenses and is a non-GAAP measure. See slide 28 for further details.

Strong volume growth in Canadian Commercial and Wealth
10
Reported ($MM) Q1/20 YoY QoQRevenue 1,055 7% 3%
Net interest income 315 1% 4%Non-interest income 740 10% 2%
Non-Interest Expenses 561 9% 6%Provision for Credit Losses 35 (19%) (56%)Net Income 336 7% 10%
Adjusted1 ($MM) Q1/20 YoY QoQRevenue 1,055 7% 3%
Net interest income 315 1% 4%Non-interest income 740 10% 2%
Non-Interest Expenses 561 9% 6%Pre-Provision Earnings2 494 5% (1%)Provision for Credit Losses 35 (19%) (56%)Net Income 336 7% 10%
• Continued volume growth driving growth in net interest income, largely offset by lower margins
• Commercial loan balances up 9% YoY
• Commercial deposit balances up 14% YoY
• NIM of 3.22%, up 14 bps QoQ and down 8 bps YoY
• Non-interest income up 10% YoY
• Strong results in Wealth Management, driven by double-digit growth in AUM and AUA and higher net sales
• Higher fee income in Commercial Banking
• Provision for Credit Losses:
• PCL ratio on impaired of 21 bps
• Total PCL ratio of 22 bps
Commercial Banking
3
Wealth Management
4 4
1 Adjusted results are non-GAAP financial measures. See slide 28 for further details.2 Pre-provision earnings is revenue net of non-interest expenses and is a non-GAAP measure. See slide 28 for further details.3 Comprises loans and acceptances and notional amount of letters of credit.4 Assets under management (AUM) are included in assets under administration (AUA).
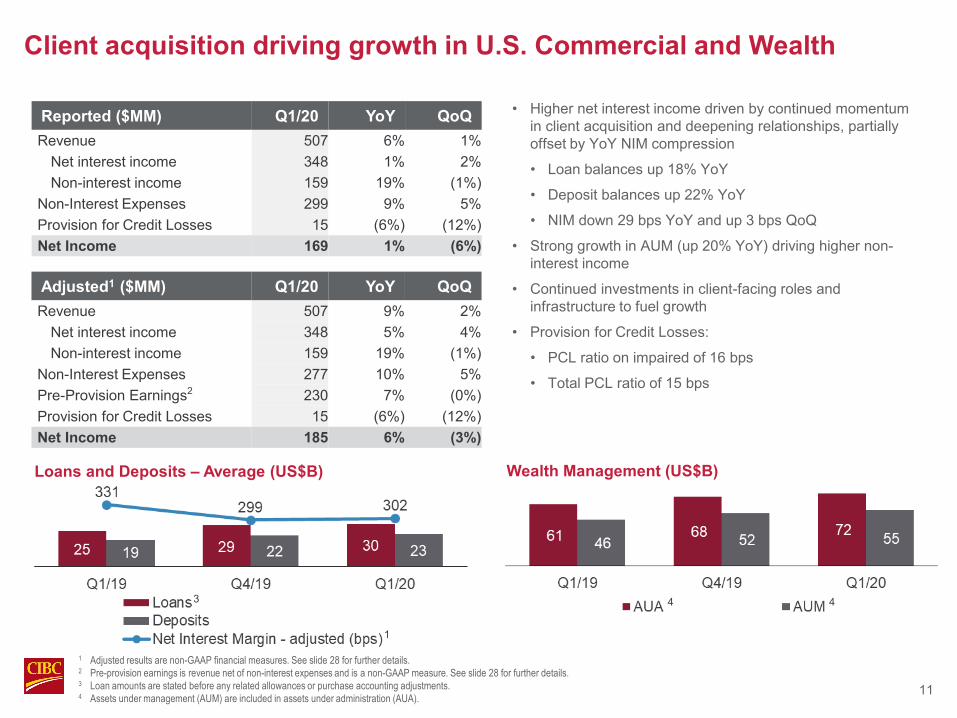
Client acquisition driving growth in U.S. Commercial and Wealth
11
Reported ($MM) Q1/20 YoY QoQRevenue 507 6% 1%
Net interest income 348 1% 2%Non-interest income 159 19% (1%)
Non-Interest Expenses 299 9% 5%Provision for Credit Losses 15 (6%) (12%)Net Income 169 1% (6%)
Adjusted1 ($MM) Q1/20 YoY QoQRevenue 507 9% 2%
Net interest income 348 5% 4%Non-interest income 159 19% (1%)
Non-Interest Expenses 277 10% 5%Pre-Provision Earnings2 230 7% (0%)Provision for Credit Losses 15 (6%) (12%)Net Income 185 6% (3%)
• Higher net interest income driven by continued momentum in client acquisition and deepening relationships, partially offset by YoY NIM compression
• Loan balances up 18% YoY
• Deposit balances up 22% YoY
• NIM down 29 bps YoY and up 3 bps QoQ
• Strong growth in AUM (up 20% YoY) driving higher non-interest income
• Continued investments in client-facing roles and infrastructure to fuel growth
• Provision for Credit Losses:
• PCL ratio on impaired of 16 bps
• Total PCL ratio of 15 bps
Loans and Deposits – Average (US$B)
1
3
Wealth Management (US$B)
4 4
1 Adjusted results are non-GAAP financial measures. See slide 28 for further details.2 Pre-provision earnings is revenue net of non-interest expenses and is a non-GAAP measure. See slide 28 for further details.3 Loan amounts are stated before any related allowances or purchase accounting adjustments. 4 Assets under management (AUM) are included in assets under administration (AUA).

Very strong results in Capital Markets
12
Reported & Adjusted1 ($MM) Q1/20 YoY QoQRevenue2 871 22% 18%
Net interest income 384 32% 6%Non-interest income 487 16% 29%
Non-Interest Expenses 419 14% 9%Pre-Provision Earnings3 452 31% 28%Provision for (reversal of) Credit Losses (10) NM NM
Net Income 335 63% 46%
• Strong performance in Global Markets broadly across trading and financing activities
• Higher underwriting activity YoY
• Double-digit revenue growth in U.S. region
• Expense growth driven by higher performance-based compensation
Revenue ($MM)2 U.S. Region Revenue ($MM)2
1 Adjusted results are non-GAAP financial measures. See slide 28 for further details. 2 Revenue is reported on a taxable equivalent basis (TEB).3 Pre-provision earnings is revenue net of non-interest expenses and is a non-GAAP measure. See slide 28 for further details.

Corporate and Other
13
Reported ($MM) Q1/20 YoY QoQRevenue1 208 (8%) (25%)
Net interest income 96 16% (41%)Non-interest income 112 (22%) (4%)
Non-Interest Expenses 627 NM 31%Provision for Credit Losses 6 20% 20%Net Income (245) NM NM
Adjusted2 ($MM) Q1/20 YoY QoQRevenue1 208 (8%) (2%)
Net interest income 96 16% 1%Non-interest income 112 (22%) (4%)
Non-Interest Expenses 285 6% (12%)Pre-Provision Earnings3 (77) (79%) 31%Provision for Credit Losses 6 20% 20%Net Income 8 (79%) NM
• Reported results include restructuring charge primarily relating to employee severance
• Strong performance in FCIB driven by higher fee income
• Offset by lower treasury revenues
1 Revenue is reported on a taxable equivalent basis (TEB).2 Adjusted results are non-GAAP financial measures. See slide 28 for further details.3 Pre-provision earnings is revenue net of non-interest expenses and is a non-GAAP measure. See slide 28 for further details.

Risk ReviewLaura Dottori-AttanasioSenior Executive Vice-President and Chief Risk Officer

Provision for Credit Losses
15
Reported & Adjusted1 ($MM) Q1/19 Q4/19 Q1/20Cdn. Personal & Small Business 208 255 215
Impaired 192 218 192 Performing 16 37 23
Cdn. Commercial Banking & Wealth 43 80 35 Impaired 48 71 34 Performing (5) 9 1
U.S. Commercial Banking & Wealth 16 17 15 Impaired 5 13 16 Performing 11 4 (1)
Capital Markets 66 45 (10)Impaired 42 24 (5)Performing 24 21 (5)
Corporate & Other 5 5 6 Impaired 8 4 7 Performing (3) 1 (1)
Total PCL 338 402 261 Impaired 295 330 244 Performing 43 72 17
Total Provision for Credit Losses down YoY & QoQ• Lower impairments during the current quarter
• Performing provisions were lower as forward looking indicators remained relatively stable
Provision for Credit Losses Ratio
1 Adjusted results are non-GAAP financial measures. See slide 28 for further details.

Credit Quality — Gross Impaired Loans
16
Reported Q1/19 Q4/19 Q1/20Canadian Residential Mortgages 0.27% 0.28% 0.30%
Canadian Personal Lending 0.34% 0.37% 0.37%
Business & Government Loans1 0.61% 0.60% 0.59%
CIBC FirstCaribbean (FCIB) 4.54% 3.96% 3.80%
Total 0.46% 0.47% 0.47%
Gross Impaired Loans stable YoY and QoQ• Slightly higher impairments in Canadian residential
mortgages
• The gross impaired loan ratio remained stable
Gross Impaired Loan Ratio
1 Excludes CIBC FirstCaribbean business & government loans.

Credit Quality — Canadian Consumer Net Write-offs
17
Reported Q1/19 Q4/19 Q1/20Canadian Residential Mortgages 0.01% 0.01% 0.01%
Canadian Credit Cards 3.02% 3.20% 3.16%
Personal Lending 0.76% 0.86% 0.77%
Total 0.27% 0.30% 0.28%
Net Write-offs stable YoY & down QoQ• Write-offs remained relatively stable in our consumer
portfolio
Net Write-off Ratio

Credit Quality — Canadian Consumer Delinquencies
18
90+ Days Delinquency Rates
Q1/19 Q4/19 Q1/20
Canadian Residential Mortgages 0.27% 0.28% 0.30%
Uninsured 0.21% 0.22% 0.24%
Insured 0.37% 0.41% 0.43%
Canadian Credit Cards 0.82% 0.76% 0.82%
Personal Lending 0.34% 0.37% 0.37%
Total 0.31% 0.33% 0.34%
90+ Days Delinquency rates up YoY & QoQ• Delinquency rates have increased primarily as a result of
seasoning of the mortgage portfolio
Balances ($B; spot)

Appendix

Canadian Personal and Commercial Banking
20
Net Income – Adjusted ($MM)1 Net Interest Margin (bps)
Average Loans & Acceptances2 ($B) Average Deposits ($B)
1 Adjusted results are non-GAAP financial measures. See slide 28 for further details.2 Loan amounts are stated before any related allowances.

Canadian Personal Banking Digital Transformation1
21
Digital Adoption Rate2 Active Mobile Users3 (Millions)
Banking Centres Self-Serve Transactions4 (%)
1 Excludes Simplii Financial.2 Digital Adoption Rate calculated using 90-day active users.3 Active Mobile Users represent the 90-day Active clients in Canadian Personal Banking.4 Reflect financial transactions only.

Improved Diversification - Continued Growth in the U.S. Region
22
U.S. Region Earnings Contribution – Adjusted1
U.S Region AUA ($B)2
1 Adjusted results are non-GAAP financial measures. See slide 28 for further details.2 Assets under management (AUM) are included in assets under administration (AUA).

Canadian Real Estate Secured Personal Lending
23
90+ Days Delinquency Rates
Q1/19 Q4/19 Q1/20
Total Mortgages 0.27% 0.28% 0.30%
Uninsured Mortgages 0.21% 0.22% 0.24%
Uninsured Mortgages in GVA1 0.10% 0.15% 0.15%
Uninsured Mortgages in GTA1 0.13% 0.13% 0.14%Uninsured Mortgages in Oil Provinces2 0.54% 0.65% 0.69%
• Total mortgage delinquency rate trended slightly higher in Q1/20
• The Greater Vancouver Area1 (GVA) and Greater Toronto Area1 (GTA) continue to outperform the Canadian average
Mortgage Balances ($B; spot)
1 1
HELOC Balances ($B; spot)
1 1
1 GVA and GTA definitions based on regional mappings from Teranet.2 Alberta, Saskatchewan and Newfoundland.

Canadian Uninsured Residential Mortgages —Q1/20 Originations
24
Beacon Distribution
2 2
Loan-to-Value (LTV)1 Distribution
2 2
• Originations of $9B in Q1/20
• Average LTV1 in Canada: 64%
• GVA2: 57%
• GTA2: 61%
1 LTV ratios for residential mortgages are calculated based on weighted average. See page 24 of the Q1 2020 Quarterly Report for further details.2 GVA and GTA definitions based on regional mappings from Teranet.

Canadian Uninsured Residential Mortgages
25
Beacon Distribution
2 2
Loan-to-Value (LTV)1 Distribution
2 2
• Better current Beacon and LTV1 distributions in GVA2 and GTA2 than the Canadian average
• Less than 1% of this portfolio has a Beacon score of 650 or lower and an LTV1 over 75%
• Average LTV1 in Canada: 53%
• GVA2: 47%
• GTA2: 50%
1 LTV ratios for residential mortgages are calculated based on weighted average. See page 24 of the Q1 2020 Quarterly Report for further details. 2 GVA and GTA definitions based on regional mappings from Teranet.

Trading Revenue (TEB)1 Distribution2
26
(15)
(10)
(5)
0
5
10
15
20
(15)
(10)
(5)
0
5
10
15
20
Trading Revenue VaR
($MM) ($MM)
Nov-19 Dec-19 Jan-20
1 Non-GAAP financial measure. See slide 28 for further details.2 Trading revenue (TEB) comprises both trading net interest income and non-interest income and excludes underwriting fees, commissions, certain
month-end transfer pricing and other miscellaneous adjustments. Trading revenue (TEB) excludes certain exited portfolios.

Q1 2020 Items of Note
27
Item
Pre-Tax Effect ($MM)
After-Tax & NCI Effect ($MM)
EPSEffect
($/Share) Reporting Segments
Restructuring charge primarily relating to employee severance 339 250 0.56 Corporate & Other
Amortization of acquisition-related intangible assets 27 21 0.05
Canadian Personal & Small Business Banking/ U.S. Commercial Banking & Wealth Management/
Corporate & Other
Adjustment to Net Income attributable to common shareholders and EPS 366 271 0.61 Not Applicable

Non-GAAP Financial Measures
28
We use a number of financial measures to assess the performance of our business lines. Some measures are calculated in accordance with GAAP (IFRS), while other measures do not have a standardized meaning under GAAP, and accordingly, these measures may not be comparable to similar measures used by other companies. Investors may find these non-GAAP measures useful in understanding how management views underlying business performance.
Adjusted results are non-GAAP financial measures that do not have any standardized meaning prescribed by GAAP and are therefore unlikely to be comparable to similar measures presented by other issuers. Adjusted results remove items of note from reported results. For further details on items of note, see slide 27 of this presentation.
For additional information about our non-GAAP measures see pages 1 to 3 of the Q1/20 Supplementary Financial Information package and pages 13 and 14 of the 2019 Annual Report available on www.cibc.com.