chutes and ladders in dairy - datcp home homepage and ladders in dairy ... the global dairy market...
TRANSCRIPT
1
Chutes and Ladders in Dairy
A few more ladders than chutes
October 2016

2
Food & Agribusiness Research and Advisory
Rabobank’s unique global team of 94 analysts – supporting knowledge based banking

3
Upfront summaryThe global dairy market faces more upside in months to come, but there are some chutes.
Six out of seven major dairy exporting regions currently have milk supply contracting.
Global exportable surplus is now tighter than any time since 2009.
Intl dairy prices have responded accordingly with 35% increases in prices.
Production will be slow to respond to higher prices.
Intl prices will have upward pressure for months to come.
But, US butter and cheese prices have some headwinds due to inventories.
Global inventories are also very weighty on prices, but less of a concern.
The strong USD will affect affordability in already struggling oil dependent markets.

4
Current market status
Downward pressure on prices – ‘chutes’
Section 1
Section 2
Section 4 Upward pressure on prices – ‘ladders’
Section 5 Price forecasts and alternative scenarios
5
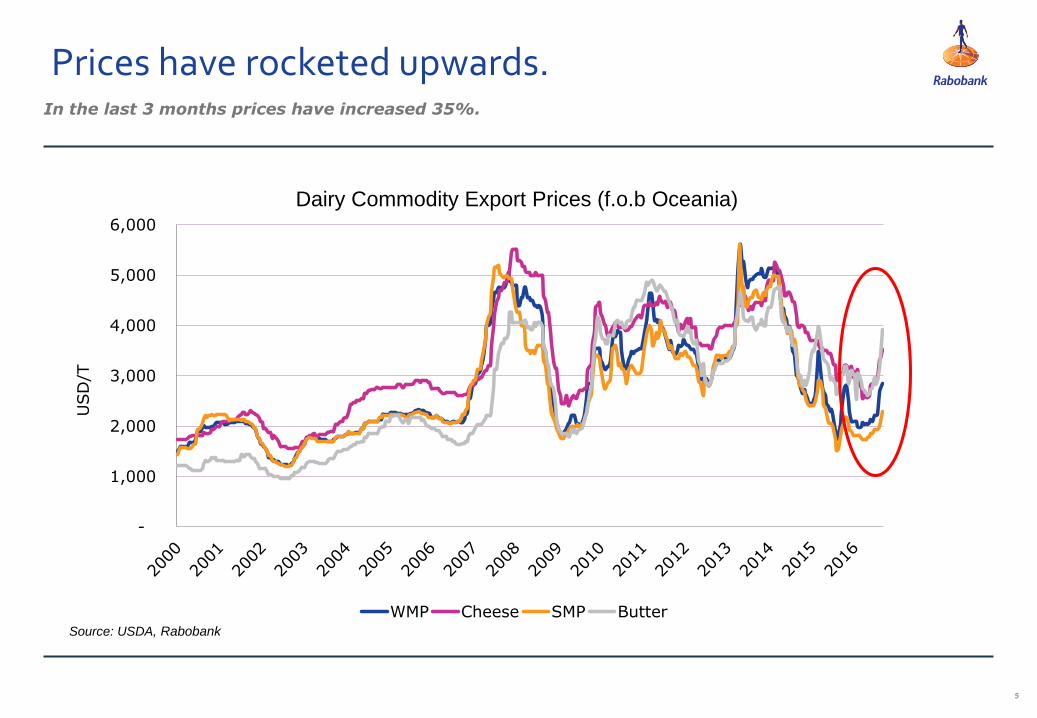
In the last 3 months prices have increased 35%.
Prices have rocketed upwards.
-
1,000
2,000
3,000
4,000
5,000
6,000
USD
/T
WMP Cheese SMP Butter
Commodity Export Prices Dairy Commodity Export Prices (f.o.b Oceania)
Source: USDA, Rabobank

6
Tough margins, bad weather, and fewer cows are biting into NZ supply.
New Zealand milk supply is now falling.
Source: DCANZ, Rabobank
New Zealand annual milk production
-40.0%
-30.0%
-20.0%
-10.0%
0.0%
10.0%
20.0%
30.0%
40.0%
50.0%
Jan
Mar
May
Jul
Sep
Nov
Jan
Mar
May
Jul
Sep
Nov
Jan
Mar
May
Jul
Sep
Nov
Jan
Mar
May
Jul
Sep
Nov
Jan
Mar
May
Jul
Sep
Nov
Jan
Mar
May
Jul
2011 2012 2013 2014 2015 2016
7
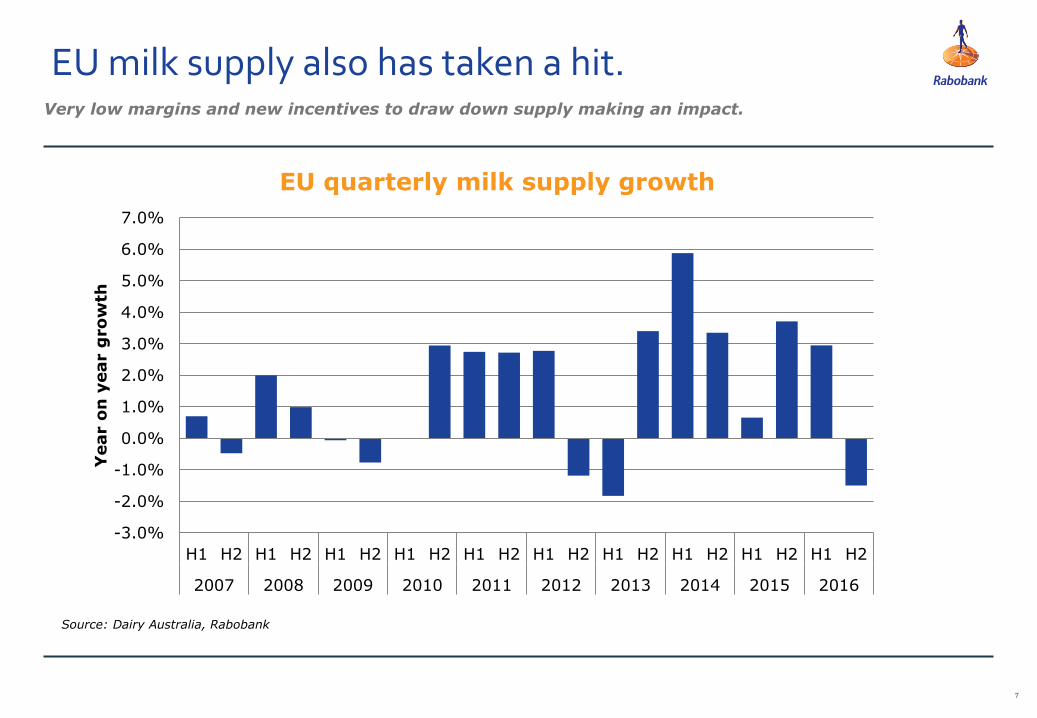
Very low margins and new incentives to draw down supply making an impact.
EU milk supply also has taken a hit.
Source: Dairy Australia, Rabobank
EU quarterly milk supply growth
-3.0%
-2.0%
-1.0%
0.0%
1.0%
2.0%
3.0%
4.0%
5.0%
6.0%
7.0%
H1 H2 H1 H2 H1 H2 H1 H2 H1 H2 H1 H2 H1 H2 H1 H2 H1 H2 H1 H2
2007 2008 2009 2010 2011 2012 2013 2014 2015 2016
Year o
n y
ear g
ro
wth

8
High prices for butter and cheese and low feed costs have driven growth.
US milk supply is still growing.
-1.0%
0.0%
1.0%
2.0%
3.0%
4.0%
5.0%
Jun
Aug
Oct
Dec
Feb
Apr
Jun
Aug
Oct
Dec
Feb
Apr
Jun
Aug
Oct
Dec
Feb
Apr
Jun
Aug
Oct
Dec
Feb
Apr
Jun
Aug
Oct
Dec
Feb
Apr
Jun
Aug
Oct
Dec
Feb
Apr
2011 2012 2013 2014 2015 2016
Year o
n y
ear g
ro
wth
Source: Rabobank, USDA Note: Mar to Jun 2013 breakdown is an est (due to govt shutdown)
US monthly milk supply growth

9
At current trajectory, Wisconsin will become the US’ largest producer by Oct 2019.
Growth is slowly moving back east.
2000
2200
2400
2600
2800
3000
3200
3400
3600
3800
Sep-1
6
Dec-1
6
Mar-
17
Jun-1
7
Sep-1
7
Dec-1
7
Mar-
18
Jun-1
8
Sep-1
8
Dec-1
8
Mar-
19
Jun-1
9
Sep-1
9
Dec-1
9
Mar-
20
Jun-2
0
Million lbs.
Cali vs. Wisconsin
Wisconsin California
Source: Rabobank, USDA
US milk supply growth 3 months to Aug 2016.
Source: Rabobank, USDA

10
The bottom line, global supply is shrinking.
Milk supply from the big exporters is falling.
Milk Production Growth of the ‘Big 7’
Source: RabobankNote: includes EU 27, USA, NZ, Australia, Brazil, Argentina, and Uruguay
-4%
-2%
0%
2%
4%
6%
Jan
Mar
May
Jul
Sep
Nov
Jan
Mar
May
Jul
Sep
Nov
Jan
Mar
May
Jul
Sep
Nov
Jan
Mar
May
Jul
Sep
Nov
Jan
Mar
May
Jul
Sep
Nov
Jan
Mar
May
Jul
2011 2012 2013 2014 2015 2016
Yoy
gro
wth
Big 6 milk supply growth

11
Most farmgate prices have moved up.Farmer margins are starting to look a little better.
Source: Rabobank
0
5
10
15
20
25
30
35
USD
/CW
T
Farmgate milk prices (USD equivalent) - select regions
China Netherlands (FCampina)NZ (Fonterra) US (All Milk Price)Ireland

12
We have passed the import hump.Global import demand is looking healthy again.
52
53
54
55
56
57
58
59
Jan Mar May Jul Sep Nov Jan Mar May Jul Sep Nov Jan Mar May
2014 2015 2016
Rollin
g 1
2 m
onth
(M
il M
T L
ME)
Exports from the Big 6
Source: Rabobank, GTIS

13
Global import growth is diverse.A diverse list of markets have shown solid import growth.
Global import growth – 3 months to July
Source: Rabobank, GTIS
14
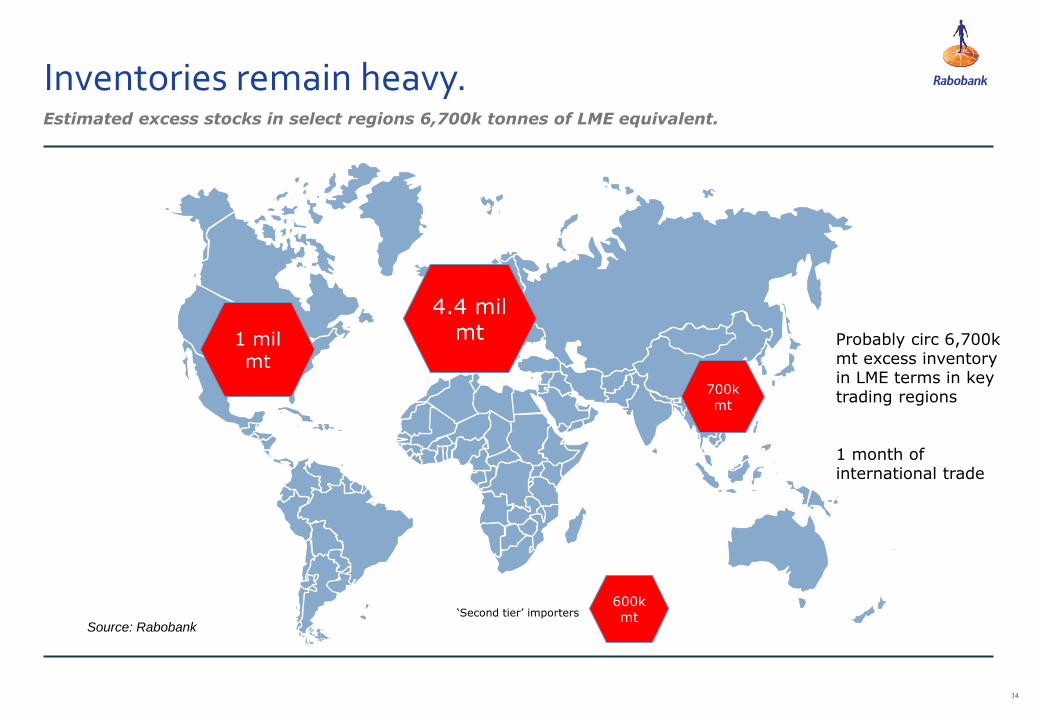
Inventories remain heavy.
700kmt
4.4 milmt1 mil
mt
600k mt
Estimated excess stocks in select regions 6,700k tonnes of LME equivalent.
‘Second tier’ importers
Probably circ 6,700k mt excess inventory in LME terms in key trading regions
1 month of international trade
Source: Rabobank

15
Stocks for cheese and butter are weighing on domestic prices.
US has realigned with international prices.
2,000
3,000
4,000
5,000
6,000
7,000
Jan-1
3
Apr-
13
Jul-
13
Oct-
13
Jan-1
4
Apr-
14
Jul-
14
Oct-
14
Jan-1
5
Apr-
15
Jul-
15
Oct-
15
Jan-1
6
Apr-
16
Jul-
16
US
D/
MT
Butter Markets
Oceania EU US CME
2000
3000
4000
5000
6000
Jan-1
3
Apr-
13
Jul-
13
Oct-
13
Jan-1
4
Apr-
14
Jul-
14
Oct-
14
Jan-1
5
Apr-
15
Jul-
15
Oct-
15
Jan-1
6
Apr-
16
Jul-
16
US
D/
MT
Cheese Markets
Oceania US CME
Source: Rabobank, USDA

16
Commercial disappearance was up 2.6% through 1H 2016.
US retail demand continues to grow.
-5%
0%
5%
10%
Apr
Jul
Sep
Dec
Mar
Jun
Aug
Nov
Feb
May
Aug
Oct
Jan
Apr
Jul
2013 2014 2015 2016
Natural Cheese Sales
-20%
-10%
0%
10%
20%
30%
Apr
Jul
Sep
Dec
Mar
Jun
Aug
Nov
Feb
May
Aug
Oct
Jan
Apr
Jul
2013 2014 2015 2016
Butter sales
-10%
-5%
0%
5%
10%
Apr
Jul
Sep
Dec
Mar
Jun
Aug
Nov
Feb
May
Aug
Oct
Jan
Apr
Jul
2013 2014 2015 2016
Yogurt Sales
-6%
-4%
-2%
0%
Apr
Jul
Sep
Dec
Mar
Jun
Aug
Nov
Feb
May
Aug
Oct
Jan
Apr
Jul
2013 2014 2015 2016
Milk Sales
Source: IRI
Yoy
change in v
ol

17
US exports are picking back up, despite USD.
70
75
80
85
90
95
100
105
600
700
800
900
1,000
1,100Ja
n-1
3
Apr-
13
Jul-
13
Oct-
13
Jan-1
4
Apr-
14
Jul-
14
Oct-
14
Jan-1
5
Apr-
15
Jul-
15
Oct-
15
Jan-1
6
Apr-
16
Jul-
16
USD
Index
K M
T L
ME
US exports vs. USD
US exports USD
Source: Rabobank, GTIS, OANDA

18
Summary of current market status.
6/7 export markets’ supply contracting.
Developed market demand growing.
China back in the market.
Buyers are shrugging the strong USD.
Significant inventory overhang remains.
US prices have realigned with the world.
1
2
3
4
5
6
19
Section 1
Section 2
Section 4 Upward pressure on prices – ‘ladders’
Section 5 Price forecasts and alternative scenarios
Downward price pressure – ‘chutes’
Current market status

20
Prices to remain low, keeping US dairy margins manageable.
Low feed prices helping boost milk supply.
Corn
250
300
350
400
450
500
550
600
650
700
750
USc /
bushel
CBOT Corn Previous forecast Rabobank forecast
Source: Rabobank

21
Low feed prices and an uptick in milk prices should boost US milk supply.
US production will continue to grow.
-1.0%
0.0%
1.0%
2.0%
3.0%
4.0%
5.0%
Jun
Sep
Dec
Mar
Jun
Sep
Dec
Mar
Jun
Sep
Dec
Mar
Jun
Sep
Dec
Mar
Jun
Sep
Dec
Mar
Jun
Sep
Dec
Mar
Jun
Sep
Dec
Mar
Jun
Sep
2011 2012 2013 2014 2015 2016 2017
US Milk Production Growth
Source: Rabobank, USDA Note: Mar to Jun 2013 breakdown is an est (due to govt shutdown)
Forecast

22
Affordability will be a major factor for many developing markets moving forward.
Strong USD to keep pressure on prices.
60
65
70
75
80
85
90
95
100
105
-
1,000
2,000
3,000
4,000
5,000
6,000
Nov-0
7
Jul-
08
Mar-
09
Nov-0
9
Jul-
10
Mar-
11
Nov-1
1
Jul-
12
Mar-
13
Nov-1
3
Jul-
14
Mar-
15
Nov-1
5
Jul-
16
USD
index
USD
/MT
USD vs. WMP
WMP USD
Source: Rabobank & OANDA

23
Continual GPD growth downgrades and rising debt a big concern for economists.
The global economy is still a little ‘wobbly’.
200
225
250
275
'95 '97 '99 '01 '03 '05 '07 '09 '11 '13 '15
Debt/GDP
BRICS and "developed world" private non-financialand public sector debt as a % of "world" GDP*
*Data collated from 13 economies accounting for 68% of world nominal GDP
Global Economic Growth Forecasts (WEO)
Worrying Debt Levels
3
3
3
4
4
4
2014 2015 2016 2017 2018 2019
Yoy
gro
wth
%
April 2015 WEO April 2016 WEO
Source: Rabobank & WEO

24
Buyers know the market is still long milk.Estimated excess stocks in select regions 6,700k tonnes of LME equivalent.
High stock levels. Makes higher prices a tough argument.
Source: Rabobank

25
High inventories in the US will mean discounting and promotions to clear product.
US cheese and butter stocks a little too high.
0%
2%
4%
6%
8%
10%
12%
1995
1997
1999
2001
2003
2005
2007
2009
2011
2013
2015
Sto
cks t
o u
se r
atio
Cheese
0%
2%
4%
6%
8%
10%
12%
14%
16%
1995
1997
1999
2001
2003
2005
2007
2009
2011
2013
2015
Butter
2016 est.
2016 est.
Source: Rabobank & USDA
26
Current market status
Downward pressure on prices – ‘chutes’
Section 1
Section 2
Section 4 Upward pressure on prices – ‘ladders’
Section 5 Price forecasts and alternative scenarios
Upward pressure on prices – ‘ladders’

27
The biggest part of the recovery is the rapid decline in EU supply.
EU milk production will continue to contract.
-3.0%
-2.0%
-1.0%
0.0%
1.0%
2.0%
3.0%
4.0%
5.0%
6.0%
7.0%
H1 H2 H1 H2 H1 H2 H1 H2 H1 H2 H1 H2 H1 H2 H1 H2 H1 H2 H1 H2 H1 H2
2007 2008 2009 2010 2011 2012 2013 2014 2015 2016 2017
EU Milk Production Growth
Yo
ych
an
ge
Forecast
Source: EU commission, Rabobank

28
Production growth to continue slowing.
-6.0%
-4.0%
-2.0%
0.0%
2.0%
4.0%
6.0%
Jan
May
Sep
Jan
May
Sep
Jan
May
Sep
Jan
May
Sep
Jan
May
Sep
Jan
May
Sep
Jan
May
Sep
Jan
May
Sep
Jan
May
Sep
Jan
May
Sep
2008 2009 2010 2011 2012 2013 2014 2015 2016 2017
YO
Y p
ro
du
cti
on
gro
wth
Milk production growth of Big 7 exporters combined
Actual Recorded Growth
Rabo Forecast (by half)
Source: RabobankNote: includes EU 27, USA, NZ, Australia, Brazil, Argentina, and Uruguay
We have another 6 months of supply contraction ahead of us.

29
But US supply not keeping up with demand.
-4%
-3%
-2%
-1%
0%
1%
2%
3%
4%
5%
6%
Jan-1
1
Apr-
11
Jul-
11
Oct-
11
Jan-1
2
Apr-
12
Jul-
12
Oct-
12
Jan-1
3
Apr-
13
Jul-
13
Oct-
13
Jan-1
4
Apr-
14
Jul-
14
Oct-
14
Jan-1
5
Apr-
15
Jul-
15
Oct-
15
Jan-1
6
Apr-
16
Jul-
16
Year
on y
ear
change
US Milk Supply vs. Demand
Supply Demand
High Prices hurt demand
Demand now outpacing supply for 18 months
Source: Rabobank & USDA

30
Market will remain under pressure.
(3)
(2)
(2)
(1)
(1)
-
1
1
2
2
3
3
Q1 Q2 Q3 Q4 Q1 Q2 Q3 Q4 Q1 Q2 Q3 Q4 Q1 Q2 Q3 Q4 Q1 Q2 Q3 Q4 Q1 Q2 Q3
2012 2013 2014 2015 2016 2017
Million M
T L
ME
Exportable surplus vs. Import requirements
Others Asia MEA China Surplus
Forecast
Source: Rabobank

31
Effective dates, Oct 2016 – Mar 2017.
150 m EUR to be spent paying premiums to farms who reduce
supply.
Could theoretically remove 1 billion liters from the market.
Some markets will match the buy back prices.
It is unclear how effective the proposed measures will be.
Government Intervention.
EU Supply Reduction US Cheese Buy Backs
California FMMO Litigation
Will California be brought under the FMMO?
Proposal to be announced late 2016/ early 2017.
Then farmers provide feedback.
The objective is to raise farmgate milk prices in Cali.
US allocated $20 million to purchase cheese.
The purpose is to support the milk prices for farmers.
The $20 can only buy 5k MT of product – less than 1%
of US production.
Unlikely to be effective – but signals a renewed
willingness of the US government to intervene in price
support.

32
Current market status
Downward pressure on prices – ‘chutes’
Section 1
Section 2
Section 4 Upward pressure on prices – ‘ladders’
Section 5 Price forecasts and alternative scenariosPrice forecasts and conclusion

33
Rabobank dairy price forecasts: FOB Oceania
WMP prices fob Oceania: Historic and Rabo forecasts
-
1,000
2,000
3,000
4,000
5,000
6,000
Jan 2
006
Jul 2006
Jan 2
007
Jul 2007
Jan 2
008
Jul 2008
Jan 2
009
Jul 2009
Jan 2
010
Jul 2010
Jan 2
011
Jul 2011
Jan 2
012
Jul 2012
Jan 2
013
Jul 2013
Jan 2
014
Jul 2014
Jan 2
015
Jul 2015
Jan 2
016
Jul 2016
Jan 2
017
Jul 2017
USD
/MT
Source: Rabobank & USDA

34
Rabobank dairy price forecasts: US Wholesale
Class III: Rabo Forecast V CME Curve Class IV: Rabo Forecast V CME Curve
15
16
17
18
Q3e Q4f Q1f Q2f Q3f
2017
Class III Class III - Fut
12
13
14
15
16
17
Q2 Q3e Q4f Q1f Q2f
2016 2017
Class IV Class IV - Fut
USD
/CW
T
USD
/CW
T
Source: Rabobank, USDA, CME

35
An improvement in margins, but still uninspiring.
Producer margins.
IOFC BenchmarkCorn and Soy future prices as at Sep 30 2016
USD
/CW
T
-
2
4
6
8
10
12
14
16
18Ja
n-0
7
Jun-0
7
Nov-0
7
Apr-
08
Sep-0
8
Feb-0
9
Jul-
09
Dec-0
9
May-1
0
Oct-
10
Mar-
11
Aug-1
1
Jan-1
2
Jun-1
2
Nov-1
2
Apr-
13
Sep-1
3
Feb-1
4
Jul-
14
Dec-1
4
May-1
5
Oct-
15
Mar-
16
Aug-1
6
Jan-1
7
Jun-1
7
Historic IOFC indicative breakeven Series1
Source: Rabobank & USDA

36
While generally improving, the dairy market still has some ups and downs in it.
Summary.
LaddersChutes
Massive supply adjustment underway.
Global demand expected to continue to chug along.
US still isn’t producing enough milk to meet needs.
Significant inventory overhang remains.
Global economy is still wobbly.
USD remains strong.
Government intervention good or bad, wont move the dial too much.

37
So what does it mean for dairy in the US
While profitable, milk prices will remain uninspiring for producers for the next 6-12 months.
The move back east. Producers and processors.
More pressure on government to help farmers.
More consolidation of US dairy farmers looking for margins.
Constant volatility in the market. More hedging.
1
2
3
4
5

38
Contact details
Tom Bailey
Senior Dairy Analyst
Food & Agribusiness Research and Advisory
“The financial link in the global
food chain”™