church plant attendance - mission to north america
TRANSCRIPT

RESEARCH REPORT
A Publication of the Center for Missional Research, North American Mission Board
Church Plant Survivability and Health Study 2007
Ed Stetzer Phillip Connor

Church Plant Survivability and Health Study 2007
Ed Stetzer Phillip Connor
February 2007
North American Mission Board Roy Fish, Interim President
Missions Section Harry Lewis, Vice President
Center for Missional Research Ed Stetzer, Senior Director and Missiologist Marilynn Kelly, Administrative Secretary 770-410-6386 Richie C. Stanley, Research Director Jerry Chamness, Director of Consulting and Delivery Systems Mike Cogland, Director of Missional Networks Phillip Connor, Research Missiology Manager Diane Browne, Administrative Secretary 7770-410-6332
i
Table of Contents
Page
Acknowledgements ........................................................................................................... iii Methodology and Response Rate..................................................................................... 1 Church Plant Attendance of Church Plants................................................................... 2 Worship Attendance.......................................................................................................... 2
Figure 1 Mean annual church plant attendance, all denominations........................... 2 Factors Associated with Higher Attendance..................................................................... 3 Factors Associated with Lower Attendance ..................................................................... 3
Church Plant Baptisms of Church Plants ...................................................................... 4 Baptisms............................................................................................................................ 4
Figure 2 Mean annual church plant baptisms, all denominations.............................. 4 Factors Associated with Higher Baptism Counts ............................................................. 5
Descriptive Statistics for Church Plants ......................................................................... 6 Year Begun ....................................................................................................................... 6
Table 1 Church plants by year begun ....................................................................... 6 Evangelical Context .......................................................................................................... 7 Facilities............................................................................................................................ 7
Table 2 Facility type for church plants..................................................................... 7 Promotion.......................................................................................................................... 7
Table 3 Promotion type used by church plants ........................................................ 7 Church Planting Models ................................................................................................... 7 Worship Styles .................................................................................................................. 8
Table 4 Worship styles used by church plants ......................................................... 8 Sponsoring Churches ........................................................................................................ 8 Denominational Assistance............................................................................................... 8 Staff Team......................................................................................................................... 8 Church Planter Education ................................................................................................. 8 Funding ............................................................................................................................. 9
Figure 3 Mean annual church plant funding, all denominations ............................... 9 Church Plant Receipts (Income) ....................................................................................... 10
Figure 4 Mean annual church receipts, all denominations ........................................ 10

ii
Page
Church Planting Training.................................................................................................. 11 Church Planter Work Level and Compensation ............................................................... 11
Figure 5 Church planter work level by financial compensation received ................. 11 Financial Self-Sufficiency ................................................................................................ 12
Figure 6 Percent self-sufficient by year..................................................................... 12 Church Plant Survivability .............................................................................................. 13 Survival by Church Plant Year ......................................................................................... 13
Figure 7 Percent church plant survivability by year, all denominations ................... 13 Factors Associated with Church Plant Survivability .................................................... 14 Significant Factors .......................................................................................................... 14 Church Plant Expectations................................................................................................ 14 Church Member Leadership Development ....................................................................... 14 Church Planter Peer Group ............................................................................................... 14 Stewardship Plan............................................................................................................... 14 Door-to-Door Evangelism ................................................................................................ 14
Church Plant Health......................................................................................................... 15 Mean Annual Growth ....................................................................................................... 15
Figure 8 Mean annual growth rate for worship attendance ....................................... 15 Mean Annual Baptism Rate .............................................................................................. 16
Figure 9 Mean annual baptism rate............................................................................ 16
Appendix A Survey Instrument ...................................................................................................... 17
Appendix B Graphs for Factors Associated with Church Plant Attendance .................................. 37
Appendix C Graphs for Factors Associated with Church Plant Baptisms ..................................... 40
iii
Acknowledgements
The 2006 Church Planting Survivability and Health Survey was truly a team effort of both the Church Planting Group (CPG) and the Center for Missional Research (CMR) of the North American Mission Board. This study is the brainchild of Dr. Richard Harris, vice-president of CPG. The CPG provided many staff to contribute to the survey instrument including Joe Hernandez, Rod Earls, Ken Weathersby, John M. Bailey, and David Terry. Richie Stanley, Director for Research at CMR, provided considerable guidance to the research methodology for this study. Much appreciation is given to the 20 plus telephone interviewers, mostly students from New Orleans Baptist Theological Seminary, who poured hours of time in calling hundreds upon hundreds of church planters. These interviewers would not have been discovered if it were not for Jerry Chamness, Director of Delivery Services, and his administrative ability to acquire these interviewers as well as negotiate their individual contracts month to month. Thanks is also extended to Diane Browne in the CMR office, who managed incoming interview data and provided interviewers with the most current contact data. Last but not least, Marilynn Kelly, team administrative secretary for CMR, performed the final edits on this report and we are extremely thankful for her assistance.
1
Methodology and Response Rate In September 2006, the Church Planting Group and the Center for Missional Research of the North American Mission Board (SBC) jointly sponsored the Church Survivability and Health Study. Its objectives were to identify the survivability rate for church plants among Southern Baptist church planters as well as factors that contribute to the growth and survival of church plants. For the purposes of understanding the state of church plant survivability and health in the United States, multiple denominations were invited to participate. Those denominations/networks accepting the invitation include: Southern Baptists, Sovereign Grace Ministries, Baptist General Conference, Leadership Network, General Baptists, Wesleyan, New Thing Network, Assemblies of God, Evangelical Free, Foursquare, Southern Baptist, Christian Church, and Lutheran Church Missouri Synod. All denominations or networks who participated are considered evangelical.1 Among Southern Baptists, attempts were made to contact all Nehemiah Project church planter missionaries for the survey. A sample of non-Nehemiah church planter missionaries was also selected. The criteria for sample inclusion was the funding of a church planter with Cooperative Program support through the North American Mission Board (NAMB) between 2000 and 2005. Contact data was procured from NAMB’s database using Personnel Action Forms (PAFs). After the removal of duplicates, 247 Nehemiah contacts and 632 non-Nehemiah contacts were selected. Among all denominations, including Southern Baptists, a total sample of 2,266 church plants was selected for potential interview. The criteria of selection was similar to the selection of Southern Baptist church plants in which the church plant had received church planting funding during the years 2000 through 2005. The larger denominations had a portion of their church plants from 2000 through 2005 selected (43%) while denominations with fewer than 50 church plants were retained completely. The number of completed surveys in all was 500. This provides an overall response rate of 22 percent.
Through interviews, brief phone conversations, and extensive Internet searches, we were able to determine the survivability of 2,080 out of the possible 2,266 church plants, representing approximately 92 percent. Out of those 2,080 church plants determined for survivability, 500 were ascertained by interview, 444 by a brief phone conversation or denomination verification, and the remainder by Internet searches. Those church plants that did not meet the criteria or whose continued existence could not be determined, were removed from the sample.
Phone calls and interviews were conducted from September 15, 2006 through January 15, 2007, principally by seminary students. More than 20 different interviewers were part of the process. The survey was conducted in English, Korean, and Spanish. Of those church plants surveyed whose primary ethnicity is known, 57 percent were Anglo, 17 percent Hispanic, 5 percent African-American, 6 percent multi-ethnic and 15 percent among a variety of other language groups
1 An evangelical Christian is a person who believes that Jesus Christ is the sole source of salvation through faith in Him, has personal faith and conversion with regeneration by the Holy Spirit, recognizes the inspired Word of God as the only basis for faith and Christian living, and is committed to biblical preaching and evangelism that brings others to faith in Jesus Christ.
2
Church Plant Attendance
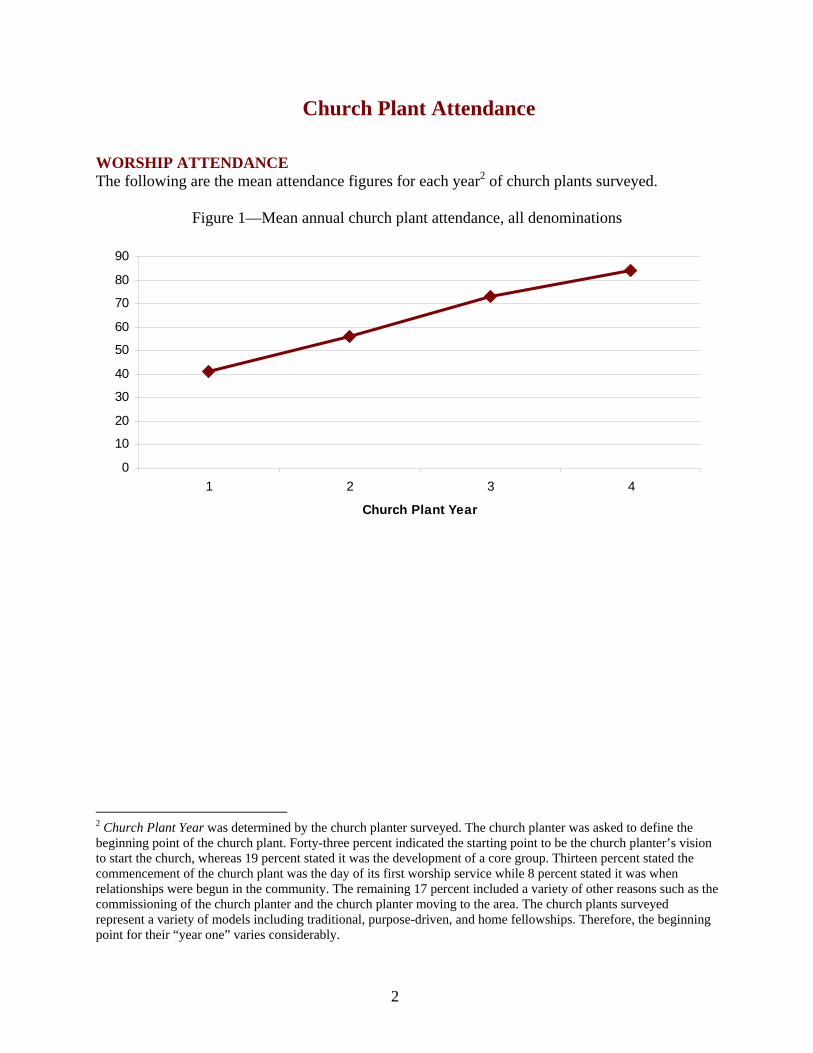
WORSHIP ATTENDANCE The following are the mean attendance figures for each year2 of church plants surveyed.
Figure 1—Mean annual church plant attendance, all denominations
0
10
20
30
40
50
60
70
80
90
1 2 3 4
Church Plant Year
2 Church Plant Year was determined by the church planter surveyed. The church planter was asked to define the beginning point of the church plant. Forty-three percent indicated the starting point to be the church planter’s vision to start the church, whereas 19 percent stated it was the development of a core group. Thirteen percent stated the commencement of the church plant was the day of its first worship service while 8 percent stated it was when relationships were begun in the community. The remaining 17 percent included a variety of other reasons such as the commissioning of the church planter and the church planter moving to the area. The church plants surveyed represent a variety of models including traditional, purpose-driven, and home fellowships. Therefore, the beginning point for their “year one” varies considerably.
3
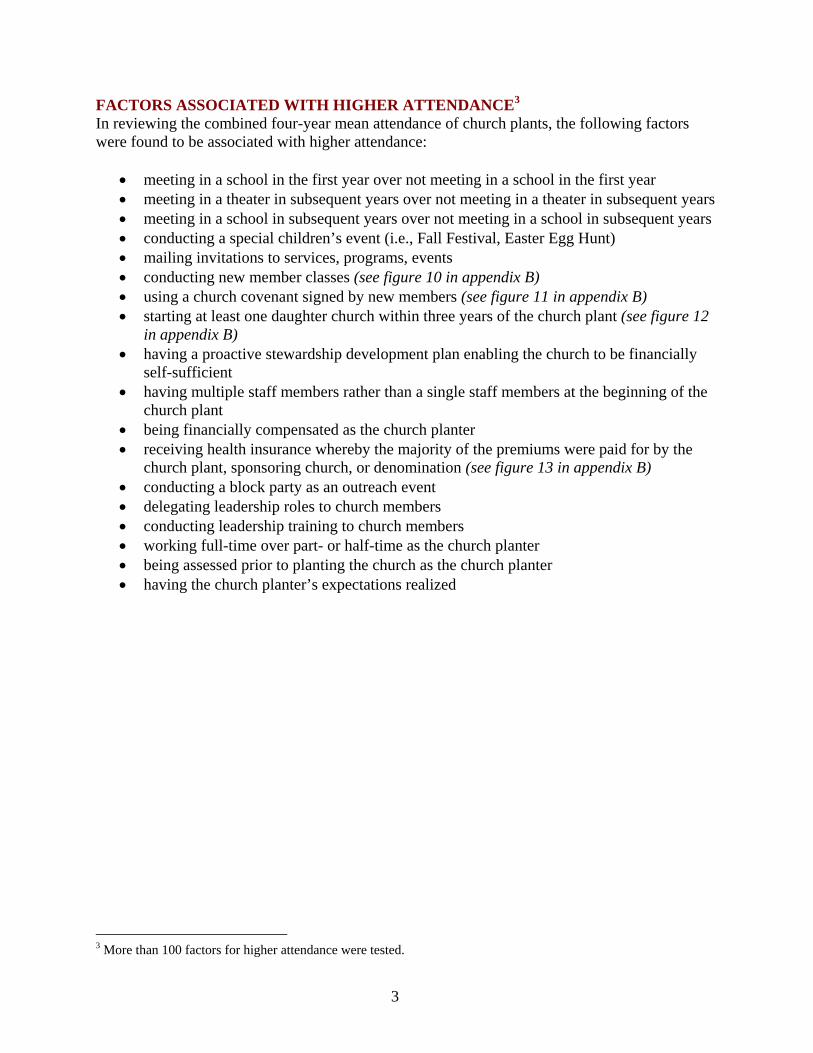
FACTORS ASSOCIATED WITH HIGHER ATTENDANCE3 In reviewing the combined four-year mean attendance of church plants, the following factors were found to be associated with higher attendance:
• meeting in a school in the first year over not meeting in a school in the first year • meeting in a theater in subsequent years over not meeting in a theater in subsequent years • meeting in a school in subsequent years over not meeting in a school in subsequent years • conducting a special children’s event (i.e., Fall Festival, Easter Egg Hunt) • mailing invitations to services, programs, events • conducting new member classes (see figure 10 in appendix B) • using a church covenant signed by new members (see figure 11 in appendix B) • starting at least one daughter church within three years of the church plant (see figure 12
in appendix B) • having a proactive stewardship development plan enabling the church to be financially
self-sufficient • having multiple staff members rather than a single staff members at the beginning of the
church plant • being financially compensated as the church planter • receiving health insurance whereby the majority of the premiums were paid for by the
church plant, sponsoring church, or denomination (see figure 13 in appendix B) • conducting a block party as an outreach event • delegating leadership roles to church members • conducting leadership training to church members • working full-time over part- or half-time as the church planter • being assessed prior to planting the church as the church planter • having the church planter’s expectations realized
3 More than 100 factors for higher attendance were tested.
4
Church Plant Baptisms
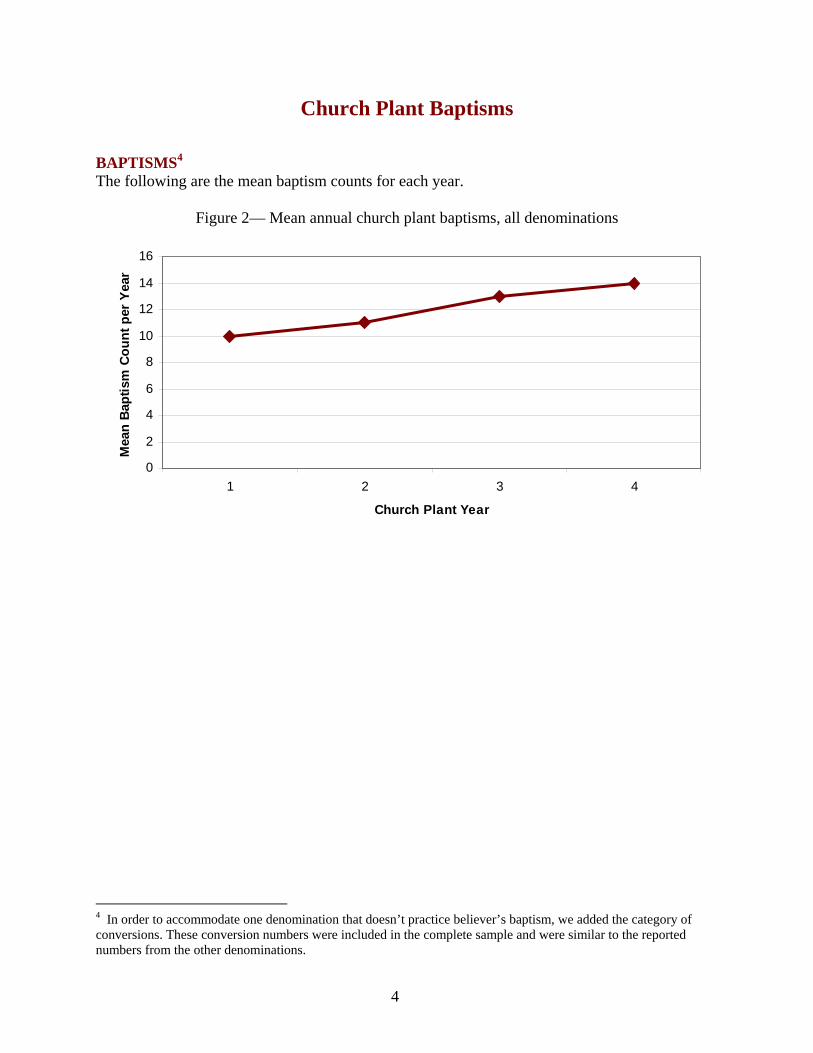
BAPTISMS4 The following are the mean baptism counts for each year.
Figure 2— Mean annual church plant baptisms, all denominations
0
2
4
6
8
10
12
14
16
1 2 3 4
Church Plant Year
Mea
n Ba
ptis
m C
ount
per
Yea
r
4 In order to accommodate one denomination that doesn’t practice believer’s baptism, we added the category of conversions. These conversion numbers were included in the complete sample and were similar to the reported numbers from the other denominations.
5
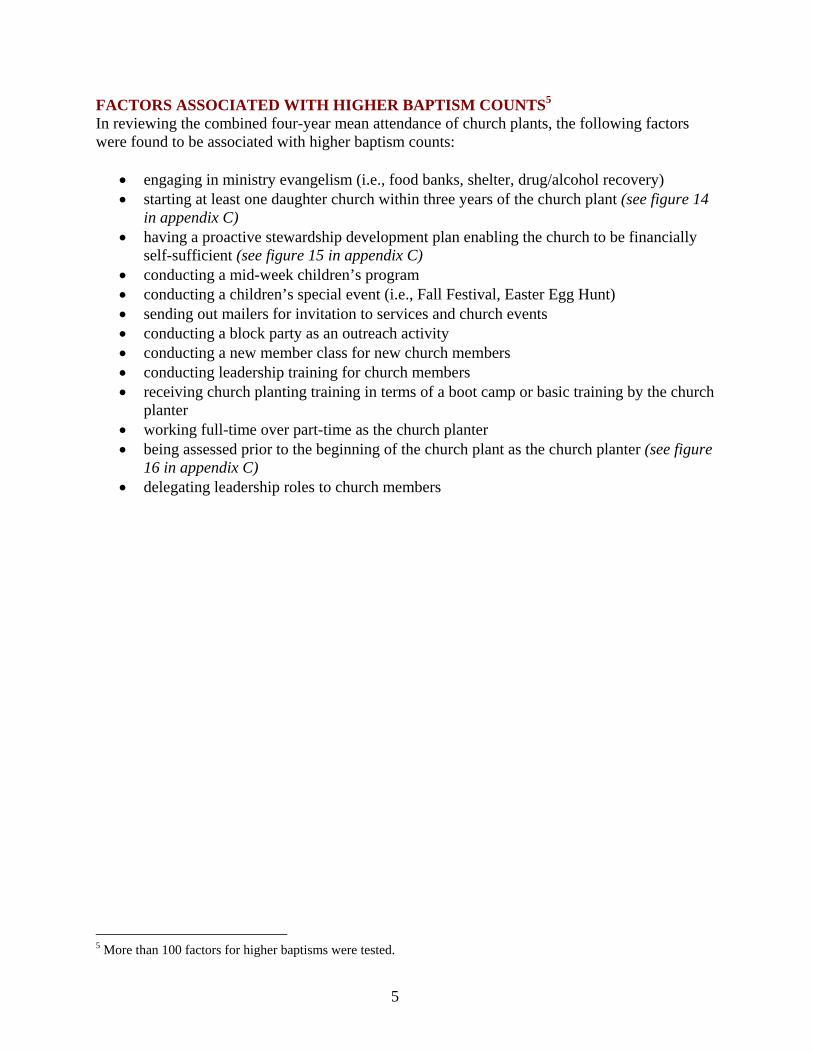
FACTORS ASSOCIATED WITH HIGHER BAPTISM COUNTS5 In reviewing the combined four-year mean attendance of church plants, the following factors were found to be associated with higher baptism counts:
• engaging in ministry evangelism (i.e., food banks, shelter, drug/alcohol recovery) • starting at least one daughter church within three years of the church plant (see figure 14
in appendix C) • having a proactive stewardship development plan enabling the church to be financially
self-sufficient (see figure 15 in appendix C) • conducting a mid-week children’s program • conducting a children’s special event (i.e., Fall Festival, Easter Egg Hunt) • sending out mailers for invitation to services and church events • conducting a block party as an outreach activity • conducting a new member class for new church members • conducting leadership training for church members • receiving church planting training in terms of a boot camp or basic training by the church
planter • working full-time over part-time as the church planter • being assessed prior to the beginning of the church plant as the church planter (see figure
16 in appendix C) • delegating leadership roles to church members
5 More than 100 factors for higher baptisms were tested.
6
Descriptive Statistics for Church Plants
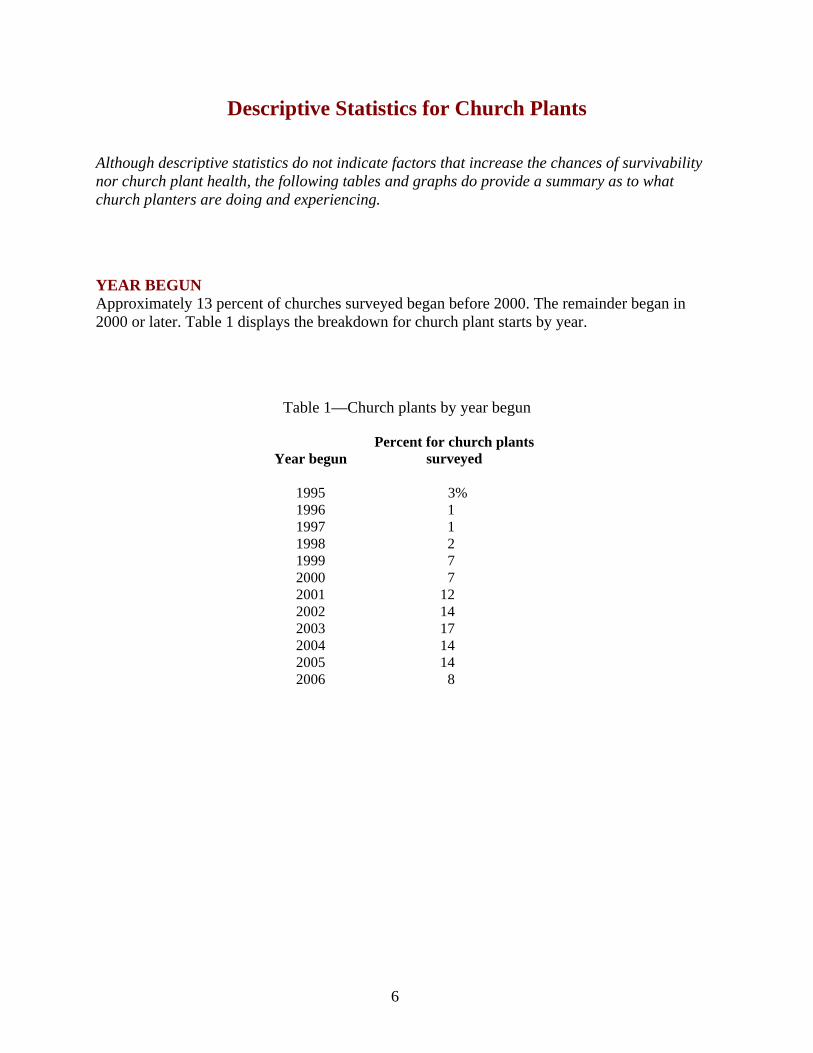
Although descriptive statistics do not indicate factors that increase the chances of survivability nor church plant health, the following tables and graphs do provide a summary as to what church planters are doing and experiencing. YEAR BEGUN Approximately 13 percent of churches surveyed began before 2000. The remainder began in 2000 or later. Table 1 displays the breakdown for church plant starts by year.
Table 1—Church plants by year begun
Year begun Percent for church plants
surveyed
1995 3% 1996 1 1997 1 1998 2 1999 7 2000 7 2001 12 2002 14 2003 17 2004 14 2005 14 2006 8
7
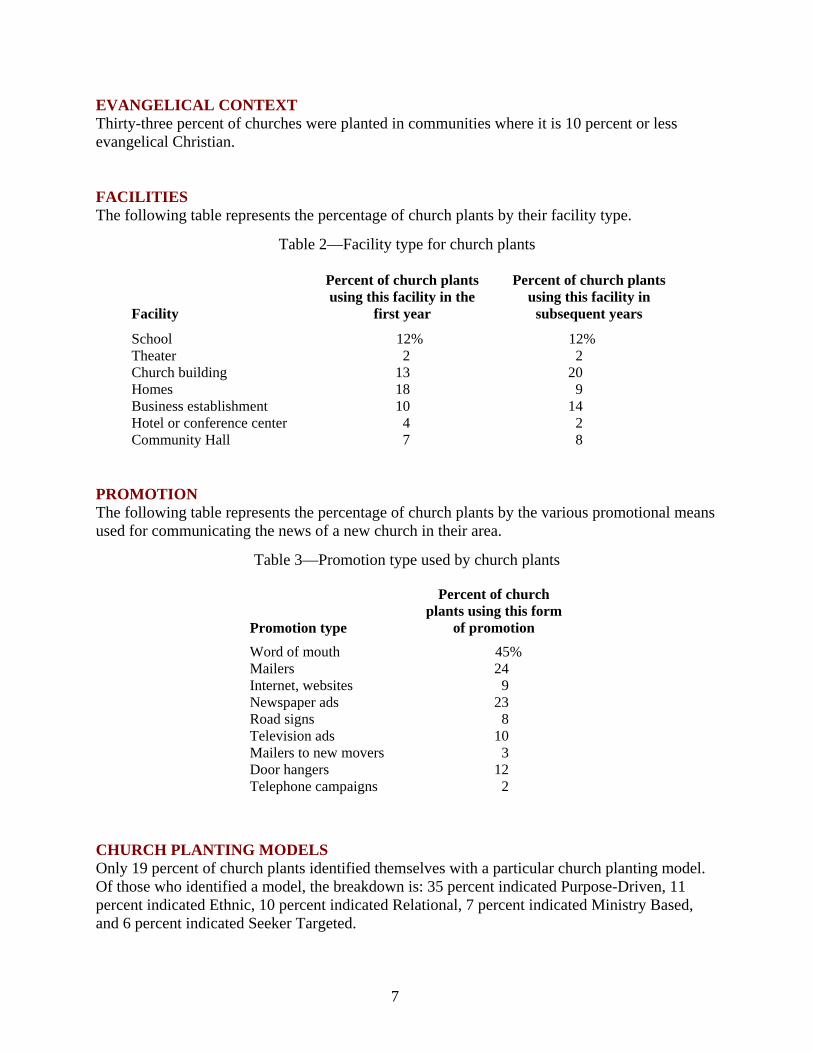
EVANGELICAL CONTEXT Thirty-three percent of churches were planted in communities where it is 10 percent or less evangelical Christian.
FACILITIES The following table represents the percentage of church plants by their facility type.
Table 2—Facility type for church plants
Facility
Percent of church plants using this facility in the
first year
Percent of church plants using this facility in
subsequent years
School 12% 12% Theater 2 2 Church building 13 20 Homes 18 9 Business establishment 10 14 Hotel or conference center 4 2 Community Hall 7 8
PROMOTION The following table represents the percentage of church plants by the various promotional means used for communicating the news of a new church in their area.
Table 3—Promotion type used by church plants
Promotion type
Percent of church plants using this form
of promotion Word of mouth 45% Mailers 24 Internet, websites 9 Newspaper ads 23 Road signs 8 Television ads 10 Mailers to new movers 3 Door hangers 12 Telephone campaigns 2
CHURCH PLANTING MODELS Only 19 percent of church plants identified themselves with a particular church planting model. Of those who identified a model, the breakdown is: 35 percent indicated Purpose-Driven, 11 percent indicated Ethnic, 10 percent indicated Relational, 7 percent indicated Ministry Based, and 6 percent indicated Seeker Targeted.
8
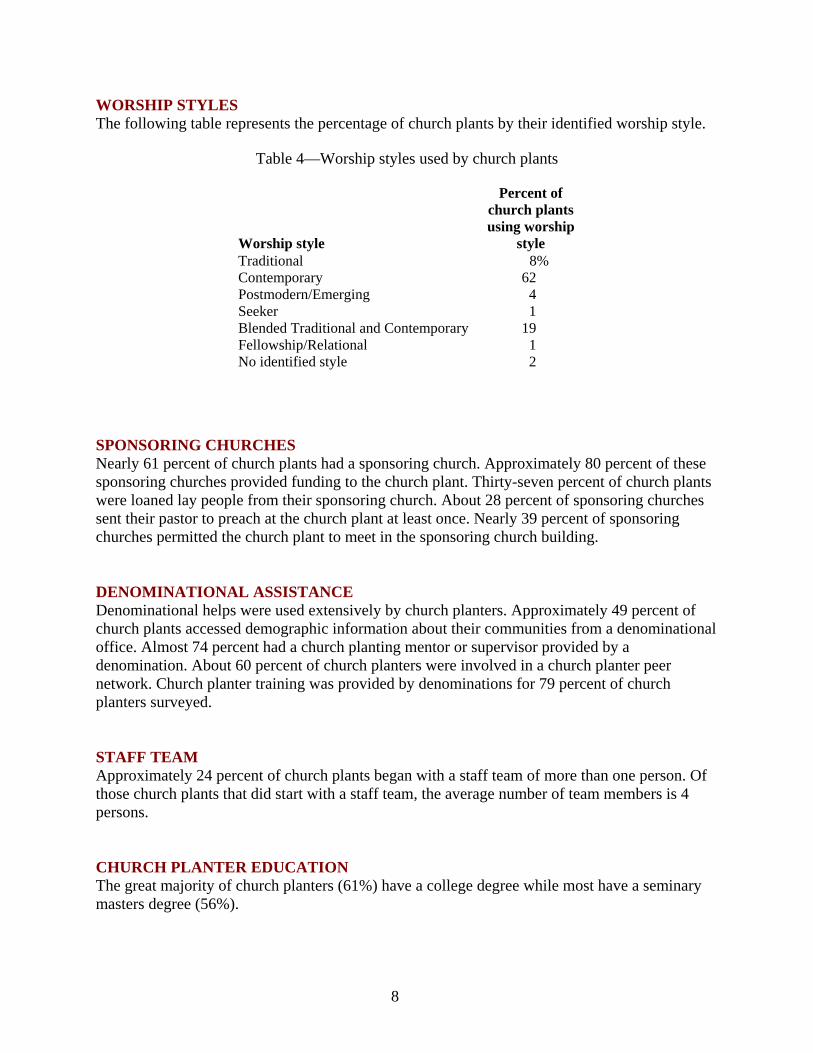
WORSHIP STYLES The following table represents the percentage of church plants by their identified worship style.
Table 4—Worship styles used by church plants
Worship style
Percent of church plants using worship
style Traditional 8% Contemporary 62 Postmodern/Emerging 4 Seeker 1 Blended Traditional and Contemporary 19 Fellowship/Relational 1 No identified style 2
SPONSORING CHURCHES Nearly 61 percent of church plants had a sponsoring church. Approximately 80 percent of these sponsoring churches provided funding to the church plant. Thirty-seven percent of church plants were loaned lay people from their sponsoring church. About 28 percent of sponsoring churches sent their pastor to preach at the church plant at least once. Nearly 39 percent of sponsoring churches permitted the church plant to meet in the sponsoring church building.
DENOMINATIONAL ASSISTANCE Denominational helps were used extensively by church planters. Approximately 49 percent of church plants accessed demographic information about their communities from a denominational office. Almost 74 percent had a church planting mentor or supervisor provided by a denomination. About 60 percent of church planters were involved in a church planter peer network. Church planter training was provided by denominations for 79 percent of church planters surveyed.
STAFF TEAM Approximately 24 percent of church plants began with a staff team of more than one person. Of those church plants that did start with a staff team, the average number of team members is 4 persons. CHURCH PLANTER EDUCATION The great majority of church planters (61%) have a college degree while most have a seminary masters degree (56%).

9
FUNDING The following graph represents the mean annual funding from all outside sources (i.e., denomination, sponsoring church, individual support) for church plants.
Figure 3— Mean annual church plant funding, all denominations
0
5000
10000
15000
20000
25000
30000
35000
40000
1 2 3 4
Church Plant Year
Dolla
rs

10
CHURCH PLANT RECEIPTS (INCOME) The following graph represents the mean annual church receipts (income) for church plants.
Figure 4— Mean annual church plant receipts, all denominations
01000020000
3000040000500006000070000
8000090000
100000
1 2 3 4
Church Plant Year
Dol
lars
11
CHURCH PLANTING TRAINING Of those stating they receive church planting training, nearly 52 percent of church planters participated in Basic Training or a similar boot camp while about 9 percent had been involved in a church planting internship prior to planting their church.
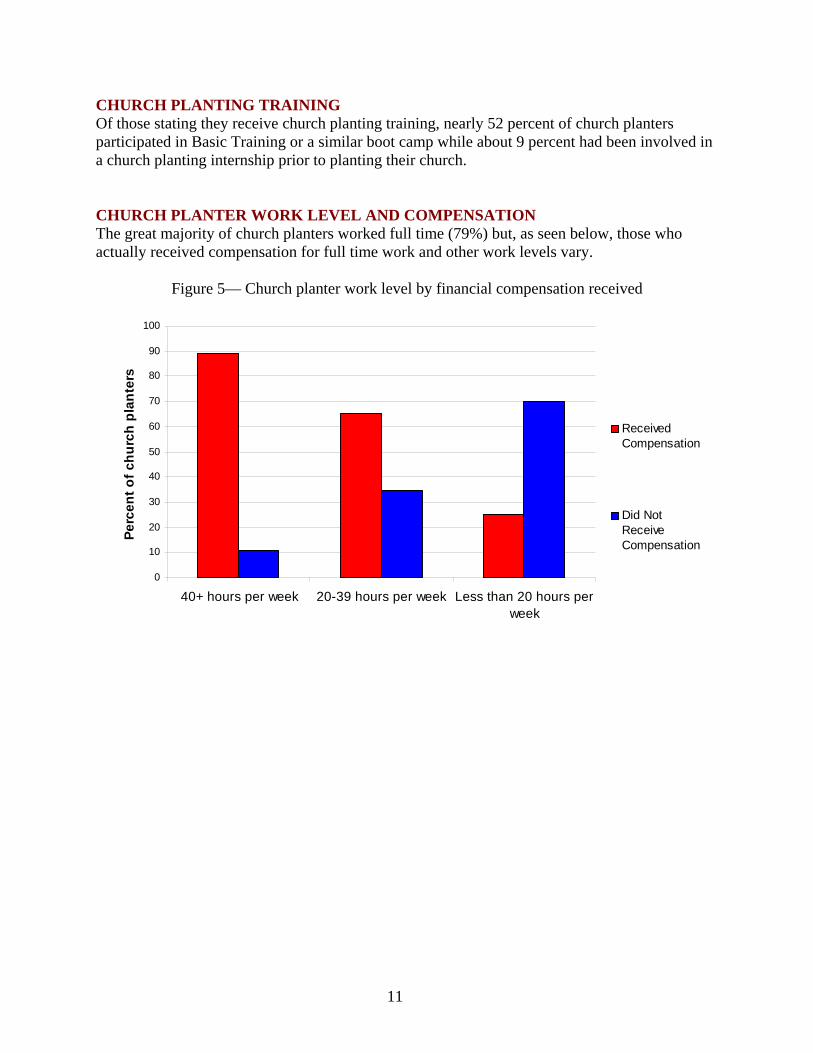
CHURCH PLANTER WORK LEVEL AND COMPENSATION The great majority of church planters worked full time (79%) but, as seen below, those who actually received compensation for full time work and other work levels vary.
Figure 5— Church planter work level by financial compensation received
0
10
20
30
40
50
60
70
80
90
100
40+ hours per week 20-39 hours per week Less than 20 hours perweek
Perc
ent o
f chu
rch
plan
ters
ReceivedCompensation
Did NotReceiveCompensation
12
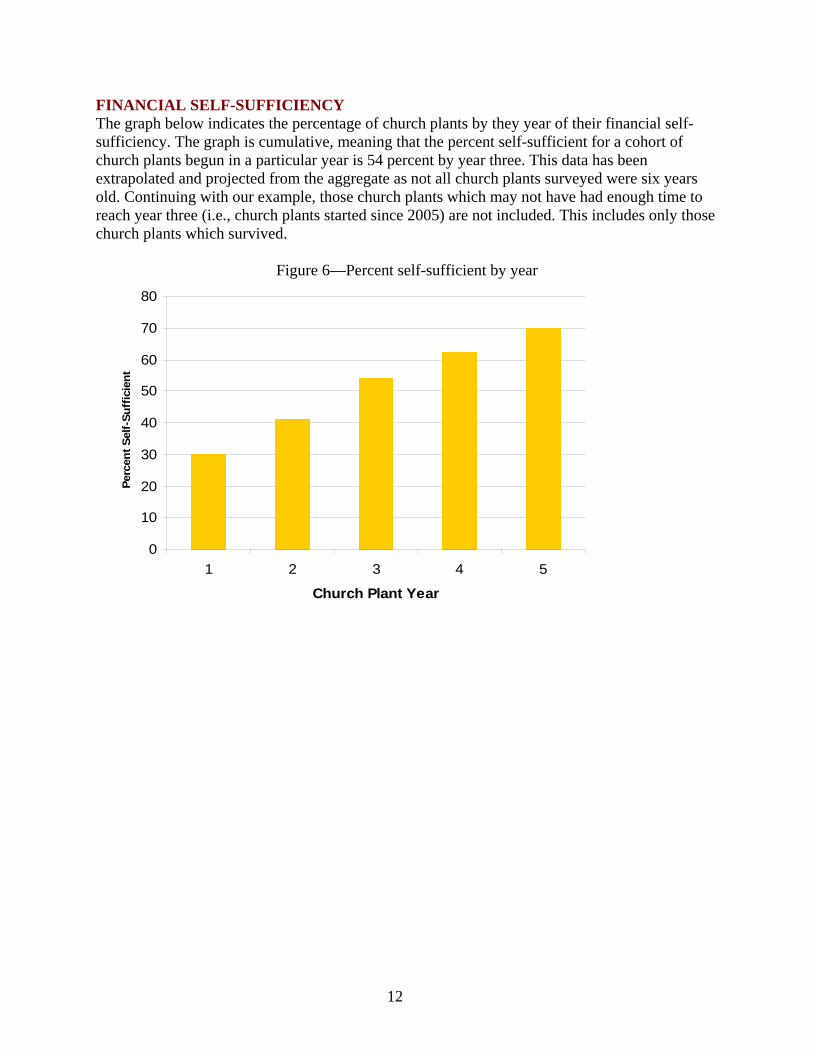
FINANCIAL SELF-SUFFICIENCY The graph below indicates the percentage of church plants by they year of their financial self-sufficiency. The graph is cumulative, meaning that the percent self-sufficient for a cohort of church plants begun in a particular year is 54 percent by year three. This data has been extrapolated and projected from the aggregate as not all church plants surveyed were six years old. Continuing with our example, those church plants which may not have had enough time to reach year three (i.e., church plants started since 2005) are not included. This includes only those church plants which survived.
Figure 6—Percent self-sufficient by year
0
10
20
30
40
50
60
70
80
1 2 3 4 5
Church Plant Year
Perc
ent S
elf-
Suff
icie
nt
13
Church Plant Survivability Rates
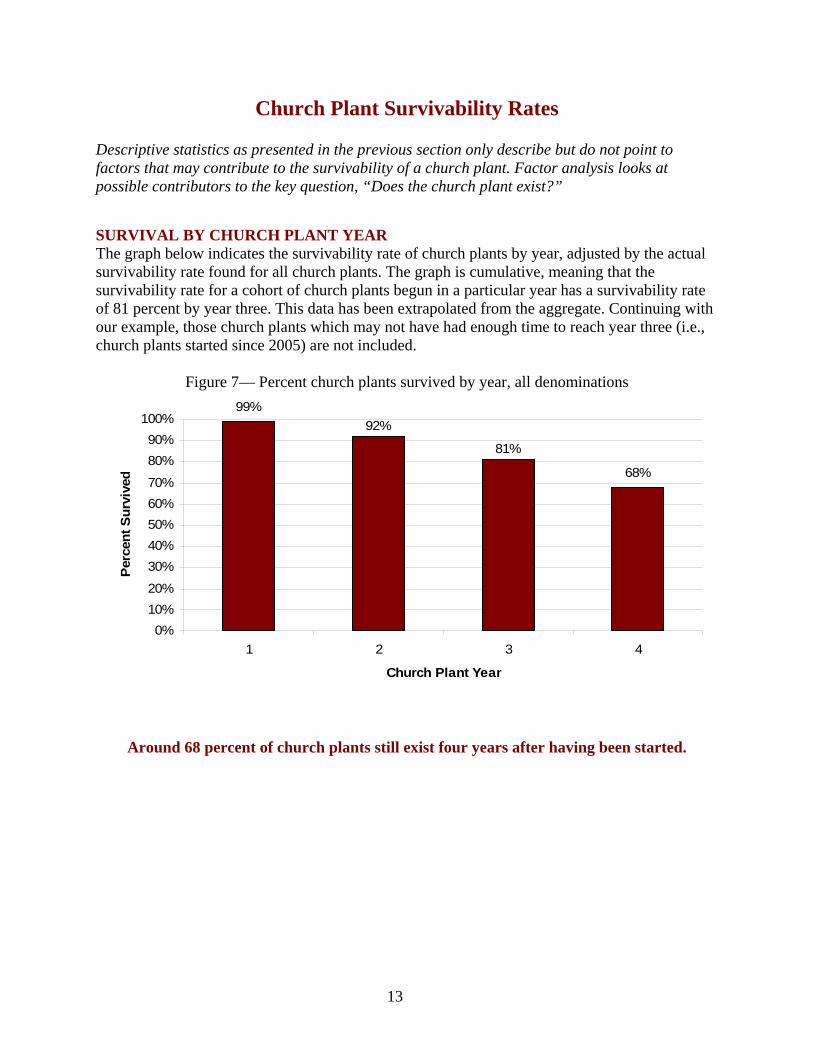
Descriptive statistics as presented in the previous section only describe but do not point to factors that may contribute to the survivability of a church plant. Factor analysis looks at possible contributors to the key question, “Does the church plant exist?” SURVIVAL BY CHURCH PLANT YEAR The graph below indicates the survivability rate of church plants by year, adjusted by the actual survivability rate found for all church plants. The graph is cumulative, meaning that the survivability rate for a cohort of church plants begun in a particular year has a survivability rate of 81 percent by year three. This data has been extrapolated from the aggregate. Continuing with our example, those church plants which may not have had enough time to reach year three (i.e., church plants started since 2005) are not included.
Figure 7— Percent church plants survived by year, all denominations
99%
68%
81%
92%
0%10%20%
30%40%50%60%70%
80%90%
100%
1 2 3 4
Church Plant Year
Per
cent
Sur
vive
d
Around 68 percent of church plants still exist four years after having been started.

14
Factors Associated with Church Plant Survivability
The following factors associated with church plant survivability were determined by factor analysis using logistic regression methodology. Analysis was adjusted to match the actual survival rates for church plants surveyed. Factors not listed were found to be statistically insignificant. More than 100 factors were tested for church plant survivability.
Significant Factors6
CHURCH PLANT EXPECTATIONS If, for the church planter, the expectations of the church plant meet the reality of the church planting experience, the chance of survivability increases by over 400 percent. Of those who said their expectations were realized, 87 percent of their churches survived compared to only 61 percent of church plants survived among those who did not have their expectations met.
CHURCH MEMBER LEADERSHIP DEVELOPMENT If the church planter provides leadership development training for new church members, the odds of survivability increase by over 250 percent. Of those church planters who provided leadership training to church members, 79 percent of their churches survived compared to only 59 percent of church plants survived among those who did not provide leadership training. CHURCH PLANTER PEER GROUP The church planter meeting with a group of church planting peers at least monthly increases the odds of survivability by 135 percent. We found that out of those church planters who were part of a peer group, 83 percent of their churches survived whereas only 67 percent of church plants among those who did not have a peer group survived. STEWARDSHIP PLAN The church plant having a proactive stewardship development plan enabling the church to be financially self-sufficient increases the odds of survivability by over 178 percent. Of those church plants who had a stewardship development plan, 81 percent of churches survived whereas only 68 percent of church plants survived among those who did not have a stewardship plan.
6 Significant indicates that the factor has a probability value (p-value) less than 0.05 (5%) or a 1 in 20 chance that the described conclusion is a statistical anomaly. These factors should be taken seriously and deserve attention. For all factor analysis, percent evangelical Christian for the community in which the church was planted was controlled. To be certain that these factors were not the result of a larger proportion of younger versus older churches, the mean church plant year for each answer (i.e., “yes” expectations were met versus “no” expectations were not met) were compared. The difference in mean years was marginal and did not amount to more than 0.8 of a year for any given factor.
15
Church Plant Health
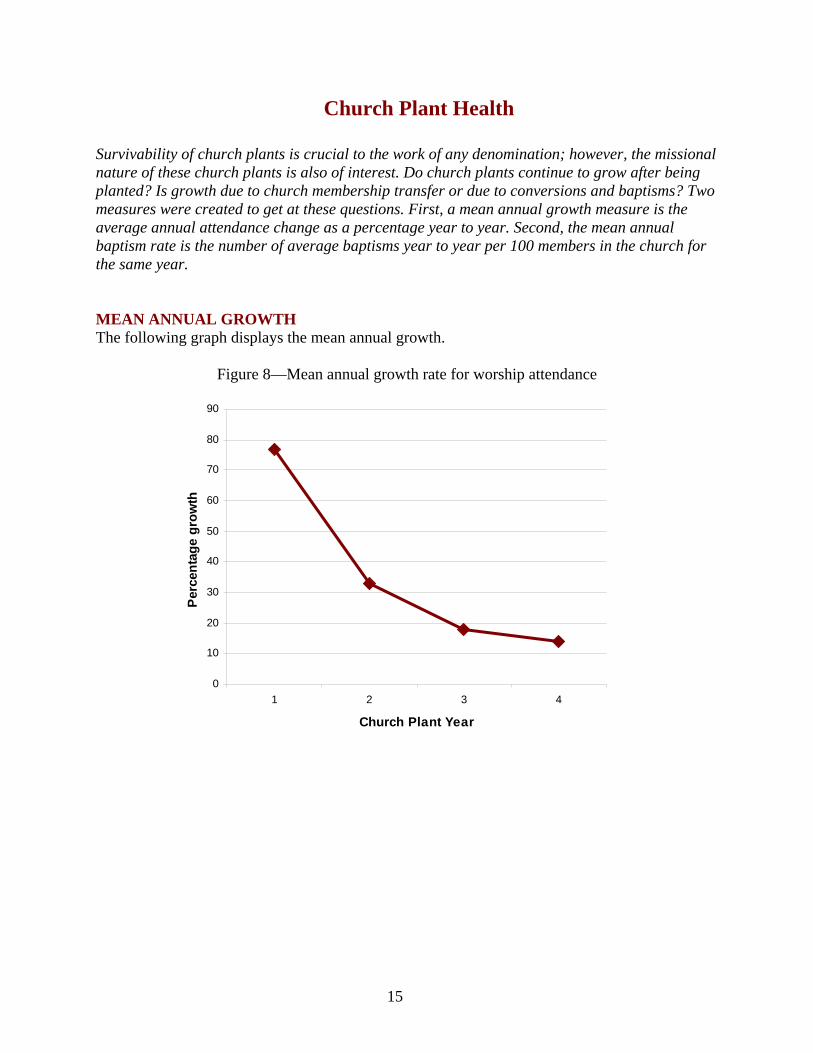
Survivability of church plants is crucial to the work of any denomination; however, the missional nature of these church plants is also of interest. Do church plants continue to grow after being planted? Is growth due to church membership transfer or due to conversions and baptisms? Two measures were created to get at these questions. First, a mean annual growth measure is the average annual attendance change as a percentage year to year. Second, the mean annual baptism rate is the number of average baptisms year to year per 100 members in the church for the same year.
MEAN ANNUAL GROWTH The following graph displays the mean annual growth.
Figure 8—Mean annual growth rate for worship attendance
0
10
20
30
40
50
60
70
80
90
1 2 3 4
Church Plant Year
Per
cent
age
grow
th

16
MEAN ANNUAL BAPTISM RATE The following graph displays the annual baptism rate for number of baptisms per 100 church members for each church plant year.
Figure 9—Mean annual baptism rate
0
5
10
15
20
25
30
35
1 2 3 4
Church Plant Year
Bap
tism
s pe
r 100
Mem
bers

17
APPENDIX A
18
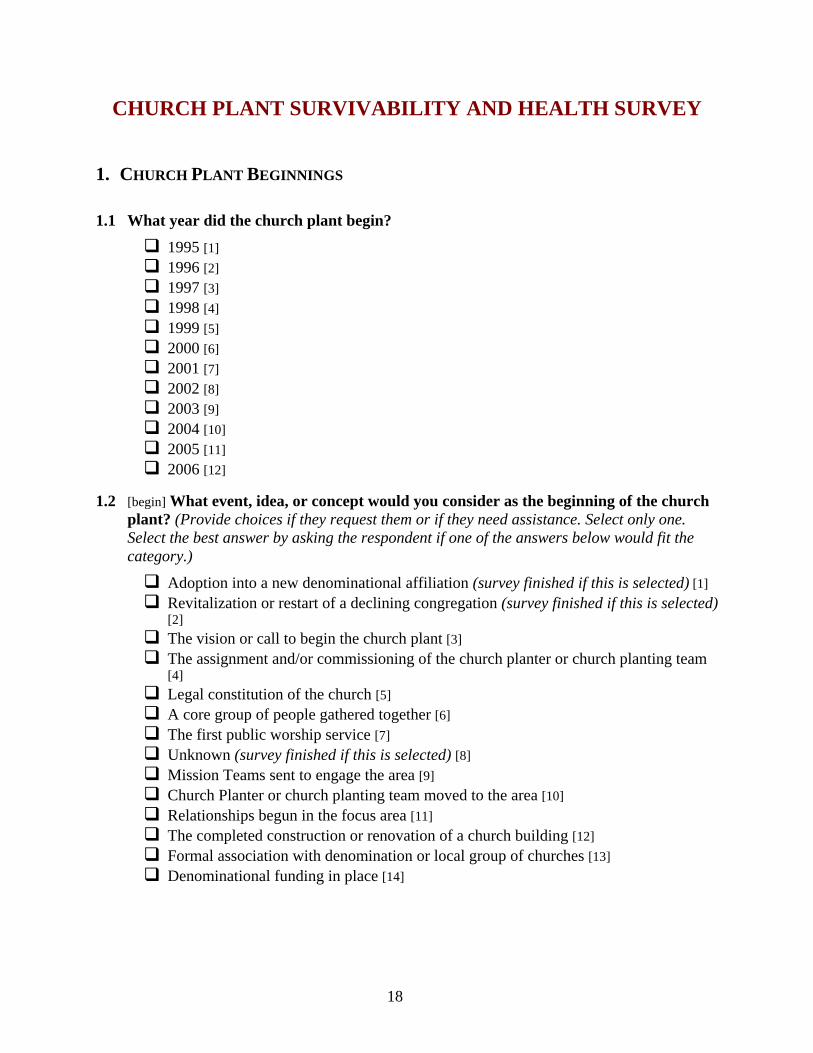
CHURCH PLANT SURVIVABILITY AND HEALTH SURVEY 1. CHURCH PLANT BEGINNINGS
1.1 What year did the church plant begin?
1995 [1] 1996 [2] 1997 [3] 1998 [4] 1999 [5] 2000 [6] 2001 [7] 2002 [8] 2003 [9] 2004 [10] 2005 [11] 2006 [12]
1.2 [begin] What event, idea, or concept would you consider as the beginning of the church plant? (Provide choices if they request them or if they need assistance. Select only one. Select the best answer by asking the respondent if one of the answers below would fit the category.)
Adoption into a new denominational affiliation (survey finished if this is selected) [1] Revitalization or restart of a declining congregation (survey finished if this is selected)
[2] The vision or call to begin the church plant [3] The assignment and/or commissioning of the church planter or church planting team
[4] Legal constitution of the church [5] A core group of people gathered together [6] The first public worship service [7] Unknown (survey finished if this is selected) [8] Mission Teams sent to engage the area [9] Church Planter or church planting team moved to the area [10] Relationships begun in the focus area [11] The completed construction or renovation of a church building [12] Formal association with denomination or local group of churches [13] Denominational funding in place [14]

19
1.3 [existnow] Does the church still exist? Yes [1] No [2]
1.3.1 [existyr]If no, what year did the church cease to exist?
1995 [1] 1996 [2] 1997 [3] 1998 [4] 1999 [5] 2000 [6] 2001 [7] 2002 [8] 2003 [9] 2004 [10] 2005 [11] 2006 [12]
1.3.2 [exist] If no, under what circumstances did the church plant cease to operate? (Provide choices if they request them of if they need assistance. Select only one. Select the best answer by asking the respondent if one of the answers below would fit the category.)
It merged with another congregation [1] The congregation disbanded [2] The church planting pastor or church planting team resigned [3] The church plant never really began [4] The church plant had a false start—good beginning but did not endure [5] Lack of financial support [6]
20
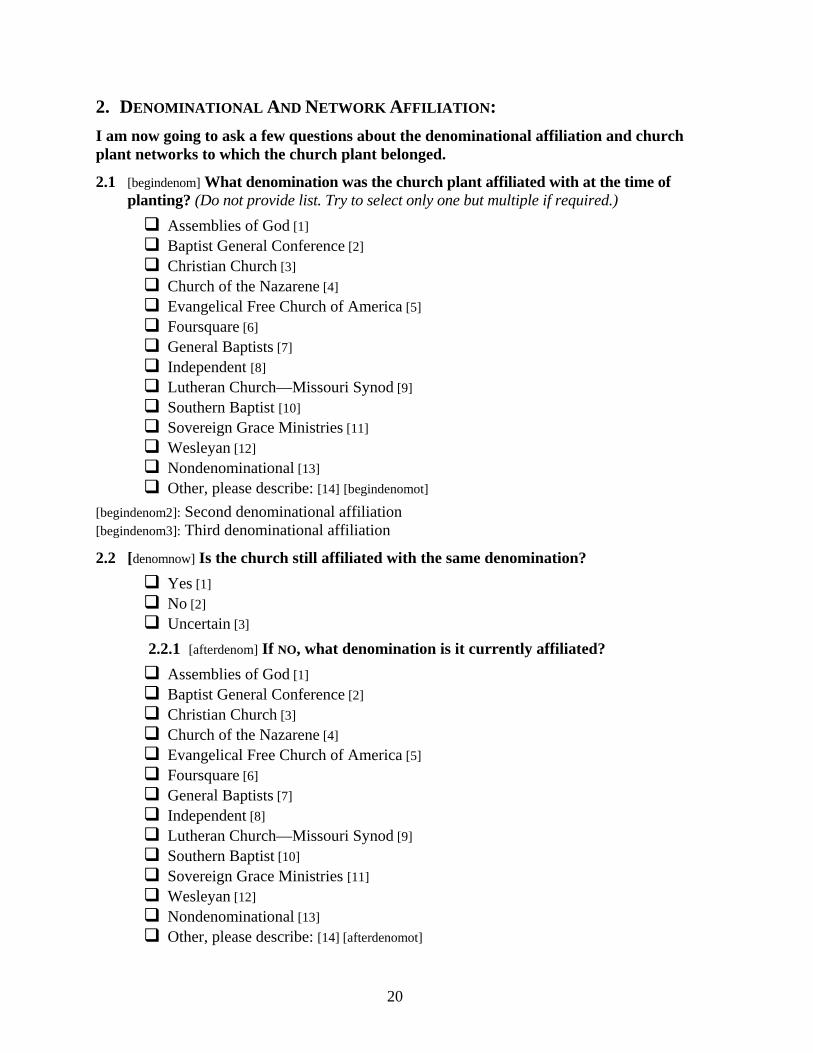
2. DENOMINATIONAL AND NETWORK AFFILIATION: I am now going to ask a few questions about the denominational affiliation and church plant networks to which the church plant belonged.
2.1 [begindenom] What denomination was the church plant affiliated with at the time of planting? (Do not provide list. Try to select only one but multiple if required.)
Assemblies of God [1] Baptist General Conference [2] Christian Church [3] Church of the Nazarene [4] Evangelical Free Church of America [5] Foursquare [6] General Baptists [7] Independent [8] Lutheran Church—Missouri Synod [9] Southern Baptist [10] Sovereign Grace Ministries [11] Wesleyan [12] Nondenominational [13] Other, please describe: [14] [begindenomot]
[begindenom2]: Second denominational affiliation [begindenom3]: Third denominational affiliation
2.2 [denomnow] Is the church still affiliated with the same denomination? Yes [1] No [2] Uncertain [3]
2.2.1 [afterdenom] If NO, what denomination is it currently affiliated? Assemblies of God [1] Baptist General Conference [2] Christian Church [3] Church of the Nazarene [4] Evangelical Free Church of America [5] Foursquare [6] General Baptists [7] Independent [8] Lutheran Church—Missouri Synod [9] Southern Baptist [10] Sovereign Grace Ministries [11] Wesleyan [12] Nondenominational [13] Other, please describe: [14] [afterdenomot]

21
[afterdenom2]: Second denominational affiliation [afterdenom3]: Third denominational affiliation
2.3 [network] Is or was the church plant part of a national church planting network? (Provide list in 2.3.1 if respondent asks for it.)
Yes [1] No [2] Uncertain [3]
2.3.1 [network1] If YES, what network or networks was the church plant a part of? (Provide list if respondent asks for it or needs assistance. Can select multiple networks)
Acts 29 [1] Association of Related Churches [2] The Bridge—Church Network [3] Burning Bush/Leadership Network [4] Campus Church Networks [5] Church Multiplication Training Center [6] Church Resource Ministries [7] Dynamic Church Planting International [8] Emerging Church Network [9] Emerging Leadership Initiative [10] The Fellowship Connection [11] Fellowship of Church Planters—Rhode Island [12] Global Church Advancement [13] Glocalnet [14] Great Commission Ministries [15] Growing Healthy Congregations Network [16] Harvest International Ministry [17] Imagine a Church Network [18] Kairos [19] Leadership Network/Burning Bush [20] Mission Alive [21] Mission Catalyst [22] Multicultural Church Network [23] New Church Initiatives [24] New Thing Network [25] The Next Church Network [26] Northeast Church Planting Network [27] Northwest Church Planting Network [28] Orchard Group [29] Spanish River Church—Global Outreach [30]

22
Sovereign Grace Ministries [31] Stadia [32] Vision 2020 [33] Vision USA [34] World Impact [35] Xpansion [36] Other (Please describe): [37]
network2: Second network selected network3: Third network selected
networkot: Other network
23
3. CHURCH PLANT STATISTICS
I am going to ask you some questions regarding worship attendance, baptisms, and financial offerings of the church plant. Please answer using the best of your knowledge.
3.1 For each year the church has been in existence please tell me the average worship attendance. (State 1st year, 2nd year, etc. If they cannot recall, ask them to make an estimate. If it is not applicable, enter nothing.)
1st year: __________ [attendy1] 2nd year: __________ [attendy2] 3rd year: __________ [attendy3] 4th year: __________ [attendy4] 5th year: __________ [attendy5]
3.2 For each year the church has been in existence please tell me the annual number of baptisms or conversions (State 1st year, 2nd year, etc. If they cannot recall, ask them to make an estimate. If it is not applicable, enter nothing.)
1st year: __________ [baptismy1] 2nd year: __________ [baptismy2] 3rd year: __________ [baptismy3] 4th year: __________ [baptismy4] 5th year: __________ [baptismy5]
24
4. CHURCH PLANT CONTEXT
I am going to ask you a few questions about the community in which the church was started.
4.1 [percentxian] What do you estimate the percentage of evangelical Christians to be in the community the church was started? (Do not provide answers. Select the best category based on the respondent’s answer.)
Less than 5% [1] Between 5 and 10% [2] Between 11 and 20% [3] More than 21% [4] Unknown [5]
4.2 [religion] What religion or denomination would be predominate in the community where the church was started. (Do not provide list. Select the best category based on the respondent’s answer.)
An evangelical Christian denomination (i.e., Baptists, Pentecostal, Assemblies of God) [1]
A mainline Christian denomination (i.e., Presbyterian, Episcopalian, Methodist) [2] Catholic [3] No religion [4] Personal spirituality [5] Some other world religion (i.e., Islam, Hinduism, Buddhist) [6] Sect (i.e., Mormonism, Jehovah Witness) [7] Unknown [8]
4.3 [demo] Has there been a major shift in demographics (i.e., income, ethnicity, education, age) in the community since the church plant began?
Yes [1] No [2] Unknown [3] Yes, the church plant restarted or moved to a new community [4]
4.3.1 If the second YES in 4.3, ask: [move] What ZIP code did the church plant move to?
___________ Enter ZIP code
25
4.3.2 If the first YES in 4.3, ask: [demoshift1, demoshift2 demoshift3] What major demographic shift took place? (Provide list only if the respondent needs assistance. Select one or multiple responses.)
Community aged [1] Community became younger [2] New housing developments—population growth [3] Vacant housing—population decline [4] Ethnic change [5] Median income dropped [6] Median income rose [7] Unknown [8]
26
5. CHURCH PLANT
I am now going to ask you some specific questions about the church plant itself.
5.1 [facilityy1a; facilityy1b; facilityy1c] What facility or facilities did the church use for their weekly worship meetings within the first year the church began? (List the facilities below if the respondent asks for the options. Try to fit their response into one of the categories below. Select multiple responses if applicable.)
School [1] Movie theatre [2] Church building [3] Home(s) [4] Day care [5] A business establishment (i.e., mall, restaurant, store front) [6] Hotel or conference center [7] Community hall [8] Unknown [9]
5.2 [facadequate] Was this facility adequate in size and functionality for the church plant? Yes [1] No [2] Unknown [3]
5.3 [facvisible] Was this facility in a high visibility area (i.e., along a major highway or roadway)?
Yes [1] No [2] Unknown [3]
5.4 [facilityy2a; facilityy2b; facilityy2c] What other facilities did the church plant use during the first 5 years of existence. (Can select multiple facilities. Try to fit their response into one of the categories below.)
School [1] Movie theatre [2] Church building [3] Home(s) [4] Day care [5] A business establishment (i.e., mall, restaurant, store front) [6] Hotel or conference center [7] Community hall [8] Unknown [9]
27
5.5 [promo1; promo2; promo3] What were the top 3 forms of publicity used to communicate the news of a new church in the community (Provide list if respondent needs assistance. Select only three.)
Word of mouth and/or personal relationships [1] Mailers [2] Internet communication (websites, e-mail blasts) [3] Newspaper ads [4] Billboards and/or road signs [5] Radio or television ads [6] Mailers to new movers [7] Door hangers [8] Telephone campaigns [9]
5.6 [worship] How would you describe the worship style of the church plant? (List if respondent requires it. Try to fit their description in the best category.)
Liturgical (formal, solemn, majestic) [1] Traditional (orderly, majestic, contemplative) [2] Contemporary (expressive, celebrative, informal) [3] Postmodern or emerging (ancient yet future, use of technology, visual art) [4] Seeker (made relevant to the unchurched, celebrative, contemporary, informal) [5] Blended traditional and contemporary [6] Fellowship (relational, small groups) [7] Gospel [8] No particular, identified style [9] Unknown [10]
5.7 [model] Was an identifiable church planting model or method used in planting the church?
Yes [1] No [2] Unknown[3]
5.7.1 If yes, answer this question. [model1; model2; model3] What model or models used in planting the church. (Provide list if necessary. Multiple selections are permitted.)
Purpose-Driven (church that focuses on the five purposes identified by Rick Warren) [1]
Seeker Targeted (churches that intentionally target a specific seeker population; for example, Willow Creek.) [2]
Relational (church that will intentionally stay small enough that all relationships are face to face; for example cell or house church) [3]
Programmatic Model (church that will minister through a variety of programs such as Sunday school and organized visitation) [4]

28
Ministry based (churches that go into the community, impact people’s lives and draw them to the gospel) [5]
Affinity (churches based around a leisure activity, occupation; for example Cowboy church) [6]
Ethnic (a church that operates in a language other than English; for example, Korean or Hispanic) [7]
No particular model [8] Unknown [9]
5.8 I’m going to read a number of intentional outreach activities conducted by a number of church plants. Please state “yes,” “no,” or “unknown” after I read each activity indicating if it was used by the church plant for the purposes of evangelistic outreach. (Read through the list below and pause for the respondent to say “yes” or “no.”) yes=1, no=2, unknown=3
_______ Revival meetings [revival] _______ Children’s weekday ministries [childweek] _______ Children’s special events (i.e., Easter Egg Hunt, Fall Festival) [childspecial] _______ Prayer walking [prayerwalk] _______ Servant Evangelism [servant] _______ Ministry evangelism (i.e., food banks, shelters, drug/alcohol recovery) [ministry] _______ Mail invitations to services, programs, events [mailers] _______ Outreach Bible studies [outreachbible] _______ Evangelistic visitation for identifying prospects [visit] _______ Block party [blockparty] _______ Door-to-door (Cold Call evangelism) [door]
5.9 I’m going to read a number of activities conducted by a number of church plants and church planters in preparing and strengthening of the church plant. Please state “yes,” “no,” or “uncertain” after I read each activity indicating if it occurred or not in the church plant. yes=1, no=2, uncertain=3
______ A demographic analysis and assessment of the community was conducted [demoanalysis]
______ Weekly small group discipleship program (community groups, life groups) [disciplegroup]
______ Intentional weekly prayer meeting for church membership [prayermeeting] ______ A new member class [newmember] ______ A church covenant signed by new members [covenant] ______ The church plant started at least one daughter church within 3 years of existence
[reproduce] ______ A church plant restart after a change in the community, pastor, or membership
[restart]

29
______ Delegation of key leadership roles to volunteers [delegation] ______ A proactive stewardship development plan enabling the church to be financially
self-sufficient [stewardplan] ______ Leadership training for new church members [leadertraining] ______ Evangelistic Training class (i.e., one day workshop) [evangelismtraining]

30
6. CHURCH PLANT SUPPORT
I am going to ask you a few questions about support the church plant received from a denomination, church planting network, and/or sponsoring church or churches.
6.1. I will read a list of possible sources of the church plant’s funding (including the church planter or church plant team’s salary). Please select “yes,” “no,” or “uncertain” if this was a source of funding for the church plant. yes=1, no=2, uncertain=3
_____ Church plant core members (church plant receipts) [fundingreceipts] _____ Affiliated denomination whether it be a local, state, or national office [fundingdenom] _____ Personal financial support network created by the church planter or church planting
team [fundingnetwork] _____ One or multiple sponsoring (mother) church(es) [fundingsponsor] _____ A single individual or non-profit foundation. [fundingind] _____ Directly from the church planter or church planting team
[fundingpersonal]_______________________________
6.2. For each year of the church plant’s existence, please state the amount of total dollars received from outside sources, This does not include funds given by church plant members. 1st year: _____________ [fundingy1] 2nd year: _____________ [fundingy2] 3rd year: _____________ [fundingy3] 4th year: _____________ [fundingy4] 5th year: _____________ [fundingy5]
6.3. For each year of the church plant’s existence, please state the amount of total dollars received from church plant members and attenders.
1st year: ____________ [receiptsy1] 2nd year: ____________ [receiptsy2] 3rd year: ____________ [receiptsy3] 4th year: ____________ [receiptsy4] 5th year: ____________ [receiptsy5]

31
6.4. [selfsufficient] Please tell me which year the church became financially self-sufficient—meaning no financial support is being received from outside sources. (List options for respondent.)
1st year [1] 2nd year [2] 3rd year [3] 4th year [4] 5th year [5] 5 + years [6] Not self-sufficient [7] Uncertain [8]
6.5 I am going to list other forms of support a church plant could receive from a denomination or network. Please indicate “yes,” “no,” “uncertain” after each resource I state. yes=1, no=2, uncertain=3
_______ Demographics and/or research expertise [denomdemo] _______ Church Planter mentoring, coaching, and/or supervision [denommentor] _______ Church Planter peer network [denompeer] _______ Training for church planter and/or team [denomtraining]
6.6 [sponsor] Did the church plant have a sponsoring church or churches? Yes [1] No [2] Uncertain [3]
If YES, ask question 6.6.1 6.6.1 Please state “yes,” “no,” or “unknown” to the following list describing the
level of assistance by the sponsoring church or churches during the first 5 years of existence:
yes=1 , no=2, unknown=3 _______ Provided funding [sponsorfunding] _______ Loaned lay people for specific time period as workers [sponsorlay] _______ The sponsoring church pastor preached occasionally at the church plant
[sponsorpastor] _______ Active prayer support [sponsorprayer] _______ Permitted the church plant to meet in the sponsoring church building
[sponsorbuilding] _______ Bought property and/or a facility for the church plant to meet in [sponsorproperty] _______ Provided mentorship to the church planter or church planting team
[sponsormentor]
32
7. CHURCH PLANTER
I am going to ask you some questions about the church planter and the church planting team.
7.1 [staff] Did the church planter arrive with a staffed team and/or built a staffed team funded by sources exterior to funds given by church plant members?
Yes [1] No [2] Uncertain [3]
7.1.1 If yes, ask: [staffcount] How many people were on the staffed church planting team?
1 2 3 4 5+
7.1.2 If church planting team in 7.1, ask: What leadership roles were included in the initial church planting team and were they acting in that role full-time (40 hours a week or more), half-time (20-39 hours a week) or part-time (less than 20 hours a week), whether they received financial compensation or not. (Do not provide list unless respondent requires assistance. Please select the best answer.)
Full time=1, Half-time=2, Part-time=3 _______ Lead or Senior Pastor [stafflead] _______ Teaching Pastor [staffteach] _______ Co-pastor, Associate or Assistant Pastor [staffassoc] _______ Children’s Ministry Pastor/Director/Coordinator [staffchild] _______ Worship Pastor [staffworship] _______ Discipleship Pastor [staffdisciple] _______ Evangelism/Outreach/Missions Pastor [staffmissions] _______ Student/Youth Pastor _______ Communications/Marketing Pastor [staffcomm] _______ Administrative Assistant [staffadmin] _______ Financial Secretary [stafffinance] _______ Administration/Executive Pastor [staffexec] _______ Elder/Deacon [staffelder] _______ Other, [staffother] _______ Other description: [staffotherdes]
_____________________________________________
33
The following questions relate to the lead church planter or pastor. If the church was planted by a church planting team, please select one lead individual to answer the following questions. Note: if you are not interviewing the lead church planter, many of these questions will be unknown.
7.1 [educ] What was the highest level of formal education taken by the lead church planter? Do not include formal theological education. (Only provide list if necessary. Select the best answer.)
Some high school [1] High School graduate [2] Some college [3] College graduate [4] Some graduate studies [5] Graduate degree (Masters and/or doctorate) [6]
7.3 [theoeduc] What is the highest level of theological education taken by the lead church planter?
Bachelor [1] Master [2] Doctor of Ministry [3] Ph.D. [4] No formal theological education [5]
7.4 [training] Did the lead church planter receive specific training for church planting prior to planting the church?
Yes [1] No [2] Unsure [3]
7.4.1 If yes, ask: [training1; training2; training3] What sort of training was received? Was it…
Seminary or Bible College training [1] Boot camp/Basic Training provided by the denomination and/or sponsoring church [2] Month long training course provided by the denomination and/or sponsoring church
[3] Several month long Internship—Several months training provided by the denomination and/or sponsoring church [4]
Training courses provided by a non-denominational or parachurch organization [5] Uncertain [6]
34
7.5 [worklevel] What level of involvement did the church planter contribute to the church plant? I will provide you some choices:
Worked 40 hours a week or more [1] Worked 20 to 39 hours a week [2] Worked less than 20 hours a week [3] Unsure [4]
7.6 [compensation] Related to the question I just asked you, did the church planter receive any financial compensation for his work?
Yes [1] No [2] Unsure [3]
7.6.1 If yes, [compadequate] In your opinion, was the financial compensation received adequate to meet the basic needs of the church planter and his family in the church planting setting?
Yes [1] No [2] Unsure [3]
7.7 I am going to list common attributes and preparation strategies for a church planter.
Please state “yes,” “no,” or “unsure” after each statement indicating if it is true for the lead church planter. yes=1, no=2, unsure=3
_______ The church planter had previous ministry experience as a pastor or church staff prior to planting the church. [cppastor]
_______ The church planter had previous ministry experience as a bivocational church leader. [cpbivo]
_______ The church planter had previous church planting experience as part of a church planting team. [cpteam]
_______ The church planter had previous church planting experience as a lead church planting pastor. [cplead]
_______ The church planter had a definite calling from the Lord to the geographic location of the church plant. [cpgeo]
_______ The church planter had a definite calling from the Lord to a specific people for the church plant. [cppeople]
_______ The church planter’s cultural background matched the church plant setting. [cpbackground]
_______ The church planter’s geographic roots are relatively near the church plant setting. [cproots]
_______ The church planter participated in a church planter’s assessment by a denomination, network, or sponsoring church prior to planting the church. [cpassess]

35
_______ The church planter met at least monthly with a supervisor who guided him in the church planting work [cpsupervisor]
_______ The church planter met at least monthly with a church planting mentor who guided him both in the church planting work and his own personal spiritual formation. [cpmentor]
_______ The church planter met at least monthly with church planting peers for accountability and support. [cppeer]
_______ The church planter enlisted several personal prayer partners prior to the church plant and continued to engage their prayer support during the first few years of the church plant. [cpprayer]
_______ The church planter was actively engaged in a plan of personal spiritual formation for the duration of the church plant. [cpspiritual]
_______ The church planter provided leadership development training for new church members. [cpleaderdev]
_______ The church planter quickly delegated church roles and responsibilities to capable lay people and volunteers [cpdelegate]
_______ The church planter’s expectations of the church plant met the reality of the church planting experience [cpexpect]
7.9 [spsupport] Please describe the spousal support of the lead church planter for the church plant. I will provide some choices. Please note that the spousal support may not always have a direct correlation to the number of hours the spouse worked in the church plant.
Very supportive [1] Supportive [2] Somewhat supportive [3] Not supportive [4] Unsure [5] Not applicable [6]
7.10 [spsupportdes] Please select the best level of involvement for the spouse of the lead church planter in the church plant. I will provide some choices.
Spouse served as a staff member on the church planting team [1] Spouse devoted to a particular church ministry within the church plant (i.e., prayer, teaching, women’s ministries, children’s ministry) [2]
Spouse assisted wherever necessary working almost as many hours as the lead church planter [3]
Spouse had no active involvement in the church plant [4] The lead church planting pastor was single at the time [5] Unsure [6] Not applicable [7]
36
7.11 [cpfamily] What would you say was the average number of hours per week that the lead church planter devoted to personal family activities? Provide answers if necessary.
Large (20 hours a week or more) [1] Moderate (10-19 hours a week) [2] Little (5-10 hours a week) [3] Practically none (less than 5 hours a week) [4] Not applicable [5]
7.12 [parents] Did the parents of the church planter or church planter’s spouse live more than 300 miles from the church planting site at any time during the first 5 years of the church plant?
Yes [1] No [2] Unsure [3]
7.13 [medical] Did the church planter and his family have health insurance where the majority of the premiums were paid for by the church plant, the sponsoring church, or the denomination or network?
Yes [1] No [2] Unsure [3]

37
APPENDIX B

38
Graphs for Factors Associated with Church Plant Attendance
Figure 10—Mean attendance by year and new member class
0
10
20
30
40
50
60
70
80
90
100
Yr 1 Yr 2 Yr 3 Yr 4
Did NOT have a new member class Did have a member class
Figure 11 - Mean Attendance by Year and Church Covenant
0
10
20
30
40
50
60
70
80
90
100
Yr 1 Yr 2 Yr 3 Yr 4
Did NOT use a church covenant Did use a church covenant

39
Figure 12—Mean attendance by year and church reproduction
0
20
40
60
80
100
120
140
Yr 1 Yr 2 Yr 3 Yr 4
Did NOT plant a daughter church within 3 years Did plant a daughter church within 3 years
Figure 13—Mean attendance by year and medical insurance
0
20
40
60
80
100
120
Yr 1 Yr 2 Yr 3 Yr 4
Did NOT have medical insurance provided by denomination or sponsoring churchDid have medical insurance provided by denomination or sponsoring church

40
APPENDIX C

41
Graphs for Factors Associated with Church Plant Baptisms
Figure 14—Mean baptism count by year and church reproduction
0
5
10
15
20
25
Yr 1 Yr 2 Yr 3 Yr 4
Did NOT plant a daughter church within 3 years Did plant a daughter church within 3 years
Figure 15—Mean baptism count by year and stewardship plan
0
2
4
6
8
10
12
14
16
18
20
Yr 1 Yr 2 Yr 3 Yr 4
Did NOT have a stewardship plan for self-sufficiency Did have a stewardship plan for self-sufficiency

42
Figure 16—Mean baptism count by church planter assessment and year
0
2
4
6
8
10
12
14
16
Yr 1 Yr 2 Yr 3 Yr 4
Church Planter NOT assessed Church Planter assessed