church growth drivers speaker: tim sims, sydney location: science museum ‘an evidence based...
TRANSCRIPT

Church Growth Drivers
Speaker: Tim Sims, Sydney
Location: Science Museum
‘An Evidence Based Approach to Seeking Church Growth Under God’

1. What are we really up against?
2. What should this mean for more effective ministry under God?
3. What real challenges do we face along the way?
DIAGNOSTIC FRAMEWORK

SYSTEMATIC RESEARCH
*All initiatives considered in the context of Biblical theology
Literature Search: 120+ *
Expert Interviews: 75+
Field Questionnaires: 42
Workshops 12
Beta sites 6
+ National Church Life Survey data and research 1991 – 2011

DECLINE IN REGULAR CHURCH ATTENDANCE *
Source: Spirit Matters, AuSSA09, Australian Soul Bouma, * Australian national statistIcs
1 1 1 1 1 1 1 1 1 10%
20%
40%
60%
80% Catholic
Pentecostal
Uniting / Meth / Presb
Anglican
Percent attending monthly or more

DEMOGRAPHIC DISASTER
Source: Church life profile p23 NCLS06, exceeds 100% based on optical adjustment to 15-19 year oldsNote Australian average life expectancy 82
15-19 % eq.
20-29 30-39 40-49 50-59 60-69 70-79 800%
5%
10%
15%
20%
DOB @ 2006:
1991-87
1986-77 1979-67 1966-57 1956-47 1946-37 1936-27 >1927
Percent of attendees
Large Established Denominations

LAZY CHURCH: INTRIGUING CORRELATION
Sources: ABS census data, Build my church p22Note: The data does not demonstrate cause, only correlation
1954 1961 1966 1971 1976 1981 1986 1991 1996 2001 20060%
20%
40%
60%
80%
100%
120%
Attendance
Births to stable marriages
Index
92% Correlation

1901
1911
1921
1933
1947
1954
1961
1966
1971
1976
1981
1986
1991
1996
2001
2006
0
1
2
3
4
5
6
7Anglican
Catholic
Other Re-ligion
Not stated
Millions of Peo-ple
INSTUTIONAL ONSLAUGHT
Source: ABS Census Data
1901 – 2006+
National Institutions
Schools
Families
Individuals

DISORGANISED / INEFFECTIVE RESPONSE
Sources: Church life profile NCLS01, NCLS06, DYB 2008, Numbers as at September 21st
Note the score profile is very different in the youth ministry
Community ServiceInspiringChristian
Clear & Open
Aware &Committed
To Plan
Small Groups
Private DevotionsFrequentMuch Personal
Growth In Past Year
10% of Net Income
Engagement
Always Look
FollowDrifters Up
Most ValueOutreach
Agree
Outreach
Commitment
Leadership
Personal Growth
Poor spiritual health
Ineffective planning &
organisation

1. What are we really up against?
2. What should this mean for more effective ministry under God?
3. What real challenges do we face along the way?
LOGICAL RESPONSE UNDER GOD

10
.
1. Large numbers are attending irregularly (40%) for special services (71%)
2. Newcomers best engage through normal church (67%) and a congregation member (29%)
3. There is huge churn in the population (36% every 5 yrs); moves break ties...
4. 100% of net new growth is from the young
5. Wastage rates among the youth can be huge (82%)
SOME RESEARCH OBSERVATIONS...

THE SOUL OF BRITAIN
Source: Professor David Hay, Nottingham University, for the BBC series Soul of Britain
1987 2000
The percentage of people:
• Seeing a pattern of events such that ‘it was meant to be’ 29% 55%
• Having awareness of the presence of God 27% 38%
• Having awareness of answers to prayer 25% 37%
• Having awareness of sacred presence in nature 16%% 25%
• Having awareness of an evil presence 12% 25%
Cumulative total (at least one mentioned) 48% 76%

SURPRISING EXPOSURE
Source:ACS98 Why people don’t go to church? p67, p42, p8, p80; Build My Church p11* Special services on average 2.6X per annum
Speci
al C
hu...
Cin
em
a
Sport
ing E
...
Regula
r C
hu...
Bota
nic
Libra
ry
Zoo
Muse
um
Art
Galle
ry
Opera
/ M
us.
..
Theatr
e
Dance
Cla
ssic
al M
...0%
20%
40%
60%
80% 71%62%
44%40% 39% 38% 35%
28%22% 19% 17%
10% 8%
Percent of Australians Attending in the Last Year

Weekly > Monthly Churched Visitors
Non-Churched Visitors
< Monthly Special ServiceAt Least
Once
0
2
4
6
8
10
12
SURPRISING IMPLICATIONS
Sources: ABS, NCLS06, ACS98, based on nominal Anglicans at 19.5% of Sydney Adult population*Note: ~0.3X invited, Special Services on average 2.6 occasions. See back up on positive impact of Special Services
Multiples of WASA X Per Annum
0.8x0.4x
1.0x0.6x*
2.8x
6.1x
10.1x

IMMEDIATE UPSIDE POTENTIAL > 4.5x
4. Transition Ministry +0.5x
1. Discipling / Gospel Community
2. Greet / Meet / Integrate 3. Invitation Ministry
+ 1x
+ 1x
+ 2x

“One out of every four people at Willow Creek were stalled or dissatisfied with the church
many were considering leaving. When I first heard these results the pain of knowing was almost unbearable …”
Bill Hybels, 2007
WARNING: FALSE ACTIVITY
Source: Reveal 2004 (6,000), Follow Me (80,000)

1. What are we really up against?
2. What does this mean for more effective ministry under God?
3. What real challenges do we face along the way?
IMPLEMENTATION CHALLENGE

• We have made progress and we are going better than most
• Success might lead to theological compromise
• Unease over personal effort and the sovereignty of God
• Visible political pressure at the congregational level
• Ambivalent congregations
• Personal risk in a narrow career structure
• Perceived long run ability to survive diminished performance
CHOKE POINTEstablish the
Need Understand the
Problem
Develop a Credible
Response
Persuade for Change
• Disparate congregation histories and circumstances
• Short term ‘performance pressures’
• Lack of clear evidence based research and conviction
• Very different personal gifts and experiences
• Anecdotal authority
• Well meaning inclusive complexity
• Lack of planning confidence and experience
• Entrenched conservatism under pressure
• ‘Fragile’ unit, conflict and natural risk reluctance
• Lack of organisational know how and experience
• Overwhelming diary pressures
• Voluntary and part time delegation structures

RESULTING STRESS CAN BE HUGE
Source:NCLSLS96 Burn out in church leaders * Numbers include co-variance and add up to >100%
Not An Issue21%
Burnout Is An Issue19%
Extreme Burnout
4%
Major Stress Drivers
% of Variance Explained *
Personal Satisfaction
35%
Congregational Conflict
22%
Family Conflict 19%
Personal faith growth
18%
Setting Direction 18%
Confidence in the Goal
18%
Leadership Isolation
17%
Strains of the Role 16%
Planning and Vision 12%
Personal Finances 10%
BorderlineTo Burnout
56%

DIARIES ARE FULL
Source: Diary Analysis (14)
Average Hours Per Week0
10
20
30
40
50
60
70
Sermon Prep
Church Services
Admin
Pastoral Meet-ings
Small Groups
Hours
56 Hours +

SET PRIORITIES
4. Transition Ministry +0.5x
1. Discipling / Gospel Community
2. Greet / Meet / Integrate 3. Invitation Ministry
+ 1x
+ 1x
+ 2x

ORGANISE AND EMPOWER
Volunteer <8 hours, Part time 8-30, Full time 30+
Worship Gospel Community
Growing Leaders Invitation
Early Morning Mid Morning Evening Youth Scripture Teaching Plant 1 Plant 2
Engage Grow Train Reach Out
Volunteer
Part time
Full time

1. What are we really up against?
2. What should this mean for more effective ministry under God?
3. What real challenges do we face along the way?
CONCLUSIONS

23
A TIME FOR ACTION
“In the whole of world history there is always one really significant hour - the present…if you want to find eternity you must serve the times”
Dietrich Bonhoeffer
www.effectiveministry.org

BACK UP

Ordinary Service
Christmas/ Easter
SmallGroup
SocialFunction
OutreachActivity
Baptism /Wedding /Funeral
Other0%
20%
40%
60%
80%
100%
80%
3% 3% 1% 2% 5% 6%
67%
6% 4% 2% 2%11% 8%
All attenders
Newcomers
ORDINARY CHURCH, THE ENTRY POINT
Adjusted for non-participantsSource: Mission Under The Microscope
First Occasion at Church

Parents Spouse /OtherFamily
Work-mates
/ Friends
SundaySchool
Teachers
People- This
Church
People- OtherChurch
OtherPeople
No-one / Don'tKnow
0%
20%
40%
60%
41%
11%
4%9%
12% 11%7% 5%
23%
10% 9% 10%
29%
8%4%
7%
All attenders
Newcomers
FAMILY AND ORDINARY MEMBERS KEY
Adjusted for non-participantsSource: Mission Under The Microscope
Most Significant People in Finding Faith

POPULATION CHURN IS HIGH
Sources: Council Records, Winds of change p350, NCLS91
Council Area Examples
Fairfield Manly Simple average-40%
-20%
0%
20%
40%
60%
80%
7%
25%17%
5%16%
6%
-14%
-34%
-18%
27%
57%
36%
In from Aus-tralia
In from Overseas
Percent movement

RELOCATION A CHALLENGE AND AN OPPORTUNITY
Source: NCLS91 Winds of change p249-251, NCLS96 Build my church p 39, Anglicans and Protestant only.
Moved Married UnhappyWithStyle
UnhappyWith
Theology
NeedsChanged
Conflicts /Unhappy
With Leader
Other0%
20%
40%
60%
80%
53%
70% Switch-ers Trans-fers
Reasons Left Previous Congregation

INVITATION HAS REASONABLE ODDS
Source: ACLS98, see appendix slides 60,61
Yes Unsure No None of my fam-
ily /friends
go
0%
20%
40%
60%
16%
32%
44%
8%
Willingness to Accept an Invitation
VeryLikely
SomewhatLikely
Unsure SomewhatUn-
likely
VeryUn-
likely
0%
20%
40%
60%
3%
9%14%
22%
52%
Likelihood of Becoming Frequent

0-14 15-19 20-29 30-39 40-49 50-59 60-69 70-79 80+-400
-200
0
200
400
600
800
1000
New / New New / Returning
In-house Regulars
Drifters Deaths
YOUTH IS A VITAL PLATFORM
30Sources: NCLS profiles 2001,2006; Why people don’t go to church p23;DYB p144
Estimated Headcount Per Age Year
Transitional Loss
Home Grown
New Christians
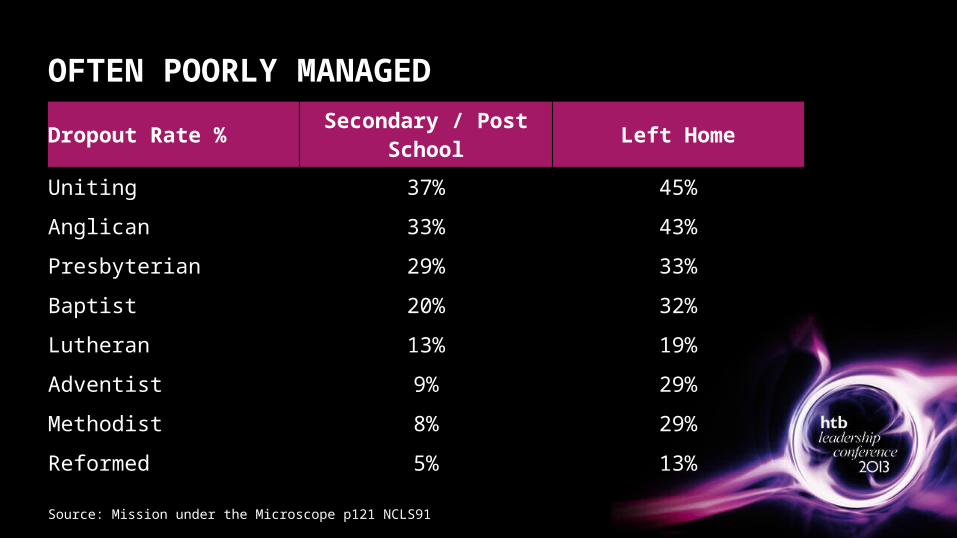
Dropout Rate % Secondary / Post School Left Home
Uniting 37% 45%
Anglican 33% 43%
Presbyterian 29% 33%
Baptist 20% 32%
Lutheran 13% 19%
Adventist 9% 29%
Methodist 8% 29%
Reformed 5% 13%
OFTEN POORLY MANAGED
Source: Mission under the Microscope p121 NCLS91

THE EFFECT OF ALPHA ON CHURCH ATTENDANCE
Non-Alpha 1-2yr Alpha 3yr+ Alpha0%
20%
40%
60%
80%Grew
Stayed The Same
Declined
% of Churches (1989 – 1998)

40% 60% 80%-40%
-20%
0%
20%
40%
DAILY DEVOTION
Source: NCLS91, NCLS96, NCLS06
10 Year Growth Step %
R2 90%
UnitingLutheran
Anglican
Churches Of Christ
Baptist
Pentecostal
Daily Bible Devotion %