chroma variations and perceived quality of color images … panels: lightness values l* as a...
TRANSCRIPT

Chroma Variations and PerceivedQuality of Color Imagesof Natural Scenes
Elena A. Fedorovskaya,1 Huib de Ridder,2*Frans J. J. Blommaert2
1Department of Psychophysiology, Moscow State University, Mokhovaya Street 8, 103009 Moscow, Russia
2 Institute for Perception Research (IPO), P.O. Box 513, 5600 MB Eindhoven, The Netherlands
Received 6 October 1995; accepted 7 July 1996
Abstract: Transformations of natural images in the per- ulated with respect to luminance and chromaticity in orderceptually uniform CIELUV color space have been investi- to improve the display of color. Usually, some implicitgated with respect to perceptual image quality. To this assumptions are made to limit the almost infinite numberend, digitized color images of four natural scenes were of possible manipulations. One of these assumptions isdescribed on the basis of their color point distributions that only global changes need to be considered. This stemsin the CIELUV color space. A new set of images was from the notion that images are coherent in the sense thatcreated by varying the chroma value of each pixel while different parts of the same image share luminance andthe lightness and hue angle were kept constant. The spectral properties due to the fact that they belong to thechroma was changed in two different ways: (1) through same object or are illuminated by the same light source.the addition or subtraction of the same amount of chroma This assumption underlies global reproduction techniquesto or from the chroma value of each pixel; (2) through in which the same color operation is applied to all pixels,multiplication of the chroma value of each pixel by a irrespective of the content of the image.1,2 Another as-constant. In three experiments, subjects judged the per- sumption is that the optimum image equals the originalceptual quality, colorfulness, and naturalness of the im-
(real-life) scene. Hence, all efforts should be directedages on a ten-point numerical category scale. The results
towards finding ways of approaching this equality asindicate that colorfulness is the main perceptual attributeclosely as possible.underlying image quality when chroma varies. Colorful-
In this article, a different constraint on color reproduc-ness itself was found to depend on both the averagetion is proposed, namely, the experienced naturalness ofchroma and its variability. In general, the subjects pre-an image. This choice is motivated by the argument thatferred slightly more colorful images to the original ones.constraints should be formulated not in the physical, butThe perceptual quality of the images was found to bein the psychological domain, the reason being that imageclosely related to the naturalness of the images. q 1997quality judgments are based on a comparison between theJohn Wiley & Sons, Inc. Col Res Appl, 22, 96–110, 1997output of the visual process and some internal referenceKey words: natural images; perceptual image quality;(memory representation).3 The basic assumption under-colorfulness; chroma; naturalness; numerical categorylying the naturalness constraint is that, in an appreciation-scalingoriented setting,4 images of high quality should at least
INTRODUCTION be perceived as ‘‘natural.’’ That is, such an image con-forms as much as possible to the ideas and expectationsOptimization of color reproduction is a complicated task:the observers have about the original scene at the timeper image, some quarter of a million pixels can be manip-the picture was taken. Accordingly, the observers haveto rely on earlier experiences with comparable situations,* Correspondence to: Huib de Ridder
q 1997 John Wiley & Sons, Inc. or, more generally, on their internalized knowledge of the
96 CCC 0361-2317/97/020096-15 COLOR research and application
1828c
/ 8A0D$$828C 02-26-97 12:21:27 crras W-Color Res
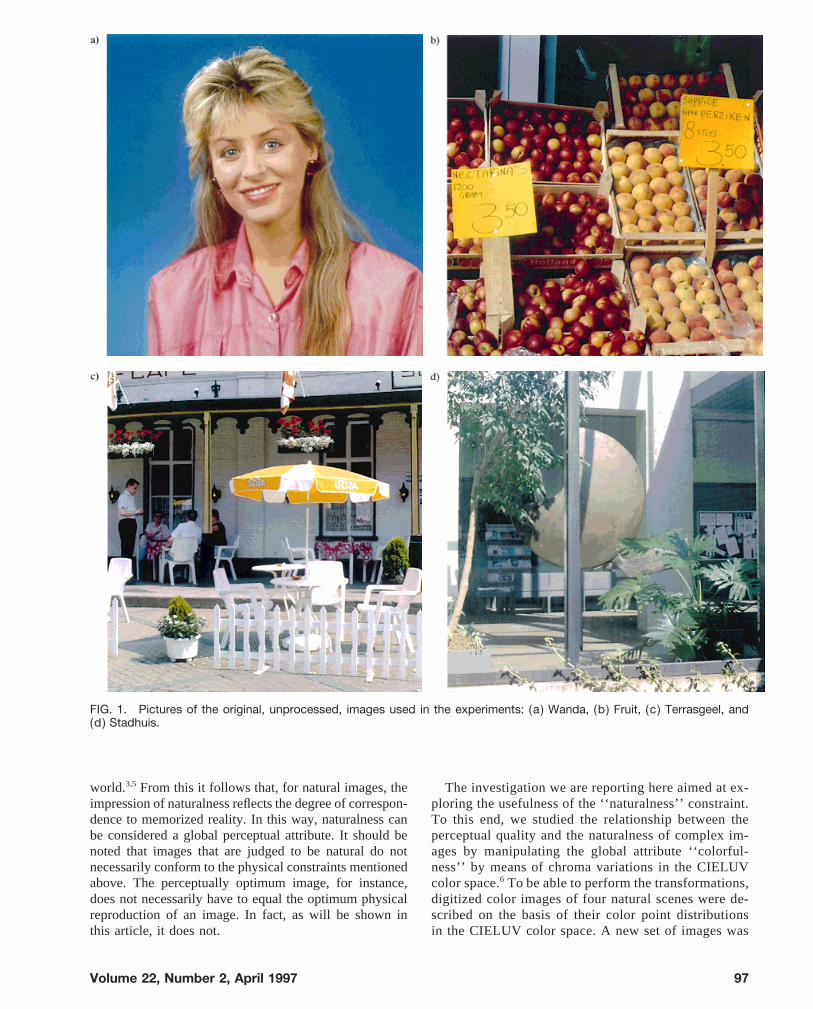
FIG. 1. Pictures of the original, unprocessed, images used in the experiments: (a) Wanda, (b) Fruit, (c) Terrasgeel, and(d) Stadhuis.
world.3,5 From this it follows that, for natural images, the The investigation we are reporting here aimed at ex-ploring the usefulness of the ‘‘naturalness’’ constraint.impression of naturalness reflects the degree of correspon-
dence to memorized reality. In this way, naturalness can To this end, we studied the relationship between theperceptual quality and the naturalness of complex im-be considered a global perceptual attribute. It should be
noted that images that are judged to be natural do not ages by manipulating the global attribute ‘‘colorful-ness’’ by means of chroma variations in the CIELUVnecessarily conform to the physical constraints mentioned
above. The perceptually optimum image, for instance, color space.6 To be able to perform the transformations,digitized color images of four natural scenes were de-does not necessarily have to equal the optimum physical
reproduction of an image. In fact, as will be shown in scribed on the basis of their color point distributionsin the CIELUV color space. A new set of images wasthis article, it does not.
97Volume 22, Number 2, April 1997
1828c
/ 8A0D$$828C 02-26-97 12:21:27 crras W-Color Res

FIG. 2. Left-hand panels: the color point distribution in the CIELUV color space for the images shown in Fig. 1 in the formof the projection on the u*£*-plane. Right-hand panels: lightness values L* as a function of chroma C*. Every 20th point hasbeen plotted for clarity of representation. Dotted lines denote the maximum gamut for real surface colors measured byPointer,14 after a correction for the appropriate white point (D65).
created by varying the chroma value of each pixel while numerical category scale. A high degree of correspondencebetween naturalness and perceptual quality was observed.the lightness and hue angle were kept constant. Conse-
quently, the relation between colorfulness and chroma In a third experiment, the subjects were asked toscale the colorfulness of the same images. The ratio-could be established.
In two experiments, subjects were asked to judge the per- nale of this experiment was to determine whether col-orfulness was the perceptual attribute underlying per-ceptual quality and naturalness of the images on a ten-point
98 COLOR research and application
1828c
/ 8A0D$$828C 02-26-97 12:21:27 crras W-Color Res
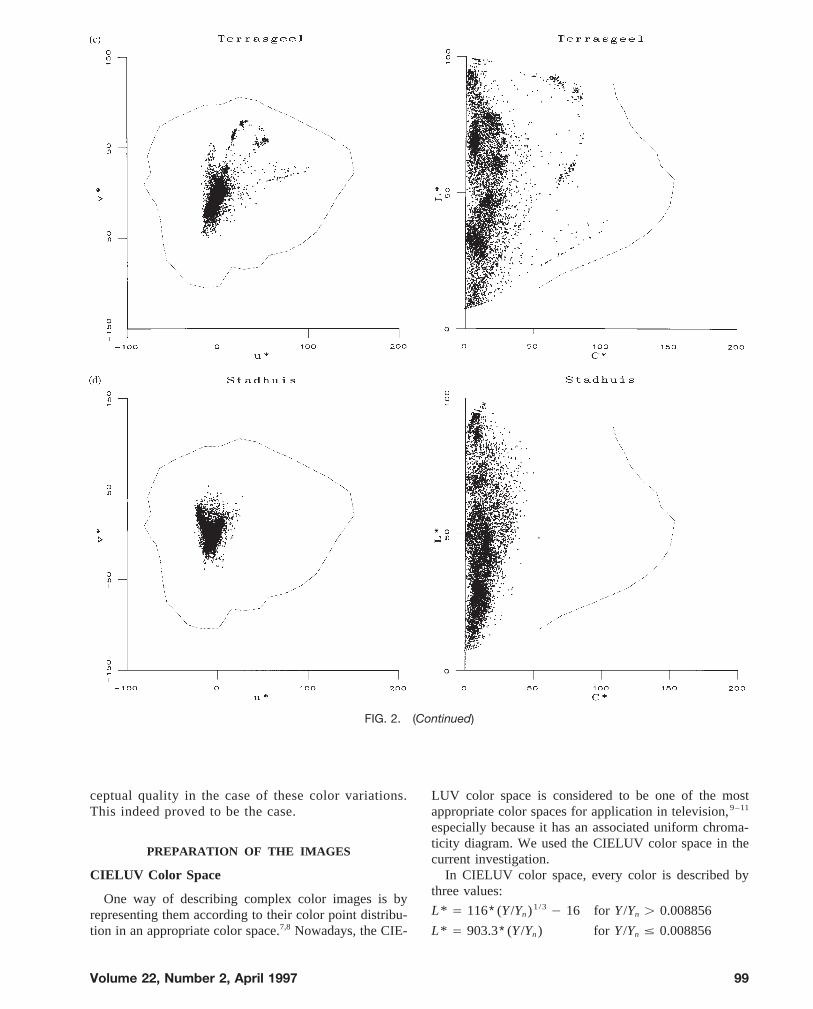
FIG. 2. (Continued)
ceptual quality in the case of these color variations. LUV color space is considered to be one of the mostappropriate color spaces for application in television,9–11This indeed proved to be the case.especially because it has an associated uniform chroma-ticity diagram. We used the CIELUV color space in the
PREPARATION OF THE IMAGEScurrent investigation.
In CIELUV color space, every color is described byCIELUV Color Spacethree values:
One way of describing complex color images is byL* Å 116∗(Y /Yn)1/3 0 16 for Y /Yn ú 0.008856representing them according to their color point distribu-
tion in an appropriate color space.7,8 Nowadays, the CIE- L* Å 903.3∗(Y /Yn) for Y /Yn ° 0.008856
99Volume 22, Number 2, April 1997
1828c
/ 8A0D$$828C 02-26-97 12:21:27 crras W-Color Res

FIG. 3. Averaged scaled quality estimations plotted vs. the average chroma of the images for four scenes: (a) Wanda, (b)Fruit, (c) Terrasgeel, and (d) Stadhuis. Vertical bars indicate twice the standard error of the mean in this and all subsequentfigures. Filled symbols: multiplication. Open symbols: translation. The arrow points to the quality judgment of the originalimage.
used to obtain u * and £ * from the tristimulus values X ,u* Å 13∗L*∗(u * 0 u *n )Y , and Z :
£* Å 13∗L*∗(£ * 0 £ *n ) ,
(1)
u * Å 4∗X / (X / 15∗Y / 3∗Z )(2)where L* is CIELUV Psychometric Lightness and the
quantities u*, £ *, u*n , and £ *n are color coordinates in the£ * Å 9∗Y / (X / 15∗Y / 3∗Z ) .
CIE 1976 uniform chromaticity scale diagram. u*n , £ *n ,and Yn are the values of u *, £ *, and Y for the appropriately The measure that correlates with hue, CIELUV Psycho-
metric Hue Angle, hu£ :chosen reference white. The following equations are
100 COLOR research and application
1828c
/ 8A0D$$828C 02-26-97 12:21:27 crras W-Color Res
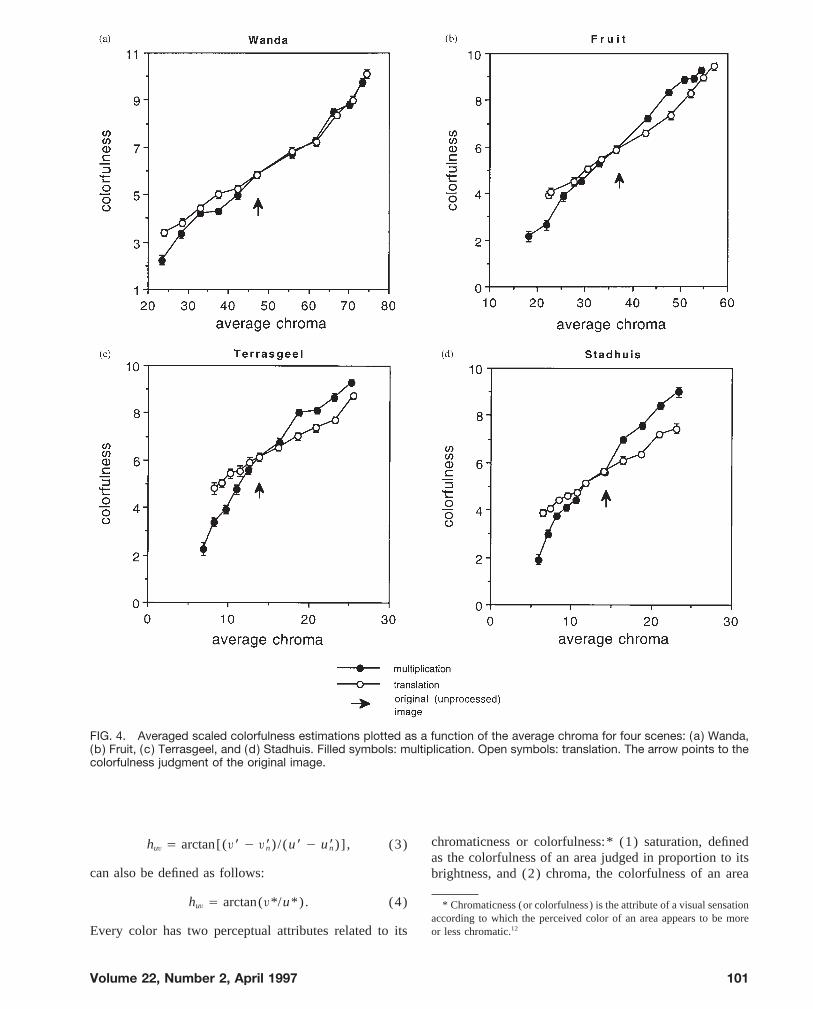
FIG. 4. Averaged scaled colorfulness estimations plotted as a function of the average chroma for four scenes: (a) Wanda,(b) Fruit, (c) Terrasgeel, and (d) Stadhuis. Filled symbols: multiplication. Open symbols: translation. The arrow points to thecolorfulness judgment of the original image.
chromaticness or colorfulness:* (1) saturation, definedhu£ Å arctan[(£ * 0 £ *n ) / (u * 0 u *n )] , (3)as the colorfulness of an area judged in proportion to its
can also be defined as follows: brightness, and (2) chroma, the colorfulness of an area
hu£ Å arctan(£*/u*). (4) * Chromaticness (or colorfulness) is the attribute of a visual sensationaccording to which the perceived color of an area appears to be moreor less chromatic.12Every color has two perceptual attributes related to its
101Volume 22, Number 2, April 1997
1828c
/ 8A0D$$828C 02-26-97 12:21:27 crras W-Color Res
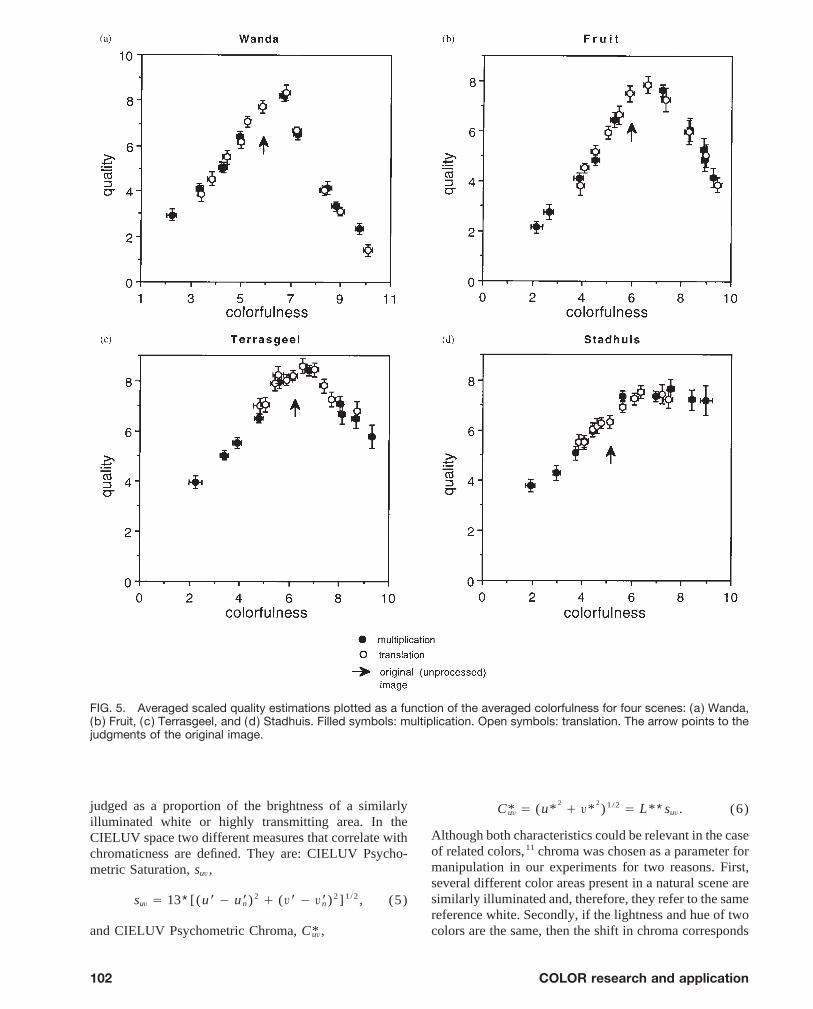
FIG. 5. Averaged scaled quality estimations plotted as a function of the averaged colorfulness for four scenes: (a) Wanda,(b) Fruit, (c) Terrasgeel, and (d) Stadhuis. Filled symbols: multiplication. Open symbols: translation. The arrow points to thejudgments of the original image.
judged as a proportion of the brightness of a similarly C*u£ Å (u*2 / £*
2)1/2 Å L*∗su£ . (6)
illuminated white or highly transmitting area. In theAlthough both characteristics could be relevant in the caseCIELUV space two different measures that correlate withof related colors, 11 chroma was chosen as a parameter forchromaticness are defined. They are: CIELUV Psycho-manipulation in our experiments for two reasons. First,metric Saturation, su£ ,several different color areas present in a natural scene aresimilarly illuminated and, therefore, they refer to the samesu£ Å 13∗[(u * 0 u *n )2 / (£ * 0 £ *n )2] 1/2 , (5)reference white. Secondly, if the lightness and hue of twocolors are the same, then the shift in chroma correspondsand CIELUV Psychometric Chroma, C*u£ ,
102 COLOR research and application
1828c
/ 8A0D$$828C 02-26-97 12:21:27 crras W-Color Res
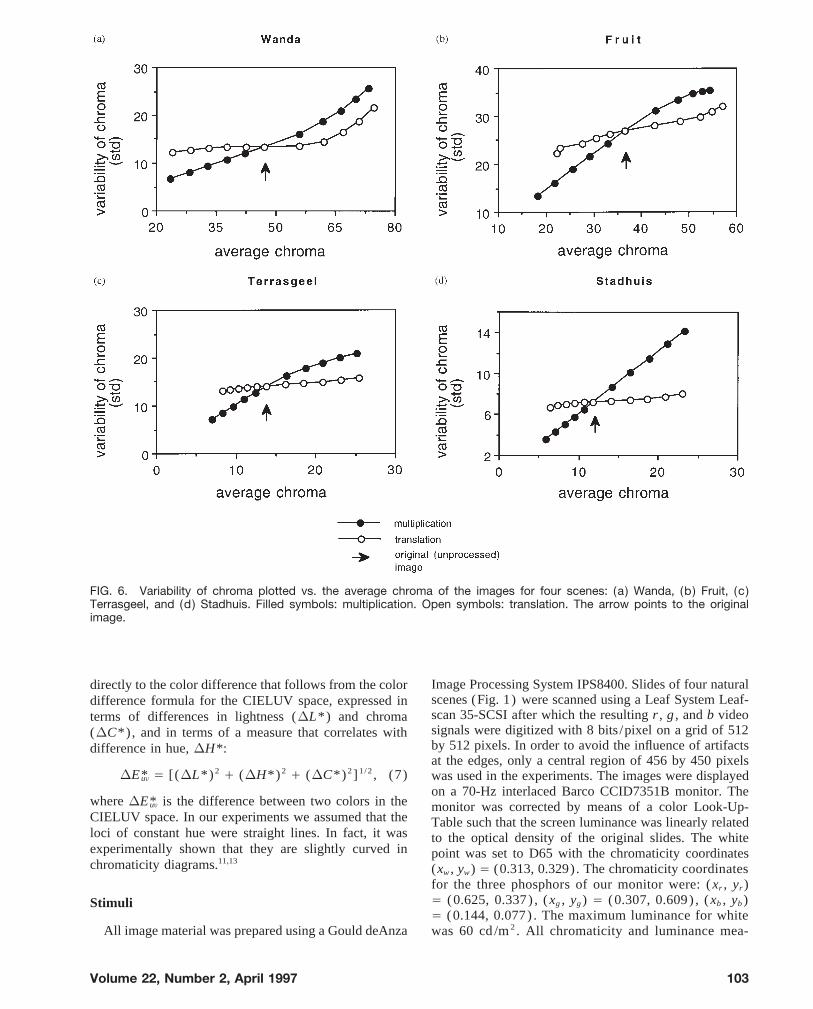
FIG. 6. Variability of chroma plotted vs. the average chroma of the images for four scenes: (a) Wanda, (b) Fruit, (c)Terrasgeel, and (d) Stadhuis. Filled symbols: multiplication. Open symbols: translation. The arrow points to the originalimage.
Image Processing System IPS8400. Slides of four naturaldirectly to the color difference that follows from the colorscenes (Fig. 1) were scanned using a Leaf System Leaf-difference formula for the CIELUV space, expressed inscan 35-SCSI after which the resulting r , g , and b videoterms of differences in lightness (DL*) and chromasignals were digitized with 8 bits /pixel on a grid of 512(DC*), and in terms of a measure that correlates withby 512 pixels. In order to avoid the influence of artifactsdifference in hue, DH*:at the edges, only a central region of 456 by 450 pixels
DE*u£ Å [(DL*)2 / (DH*)2 / (DC*)2]1/2 , (7) was used in the experiments. The images were displayedon a 70-Hz interlaced Barco CCID7351B monitor. The
where DE*u£ is the difference between two colors in the monitor was corrected by means of a color Look-Up-CIELUV space. In our experiments we assumed that the Table such that the screen luminance was linearly relatedloci of constant hue were straight lines. In fact, it was to the optical density of the original slides. The whiteexperimentally shown that they are slightly curved in point was set to D65 with the chromaticity coordinateschromaticity diagrams.11,13
(xw , yw) Å (0.313, 0.329). The chromaticity coordinatesfor the three phosphors of our monitor were: (xr , yr )Å (0.625, 0.337) , (xg , yg ) Å (0.307, 0.609) , (xb , yb )StimuliÅ (0.144, 0.077) . The maximum luminance for white
All image material was prepared using a Gould deAnza was 60 cd /m 2 . All chromaticity and luminance mea-
103Volume 22, Number 2, April 1997
1828c
/ 8A0D$$828C 02-26-97 12:21:27 crras W-Color Res

TABLE I. Results of linear regression analysis for col-orfulness estimations. F X
YZG Å F0.432 0.338 0.179
0.233 0.671 0.0960.026 0.092 0.971
GrF RGBG , (8)
WandaStandard error of
Adjusted squared multiple R: 0.984 estimate: 0.293 where the 3 1 3 matrix was calculated on the basis ofthe monitor measurements and calibration. Finally, withVariable Coefficient Std Error T P (2 Tail)the aid of the set of Eqs. (1) and (2), the CIELUV color
Constant 00.520 0.208 02.495 0.023 coordinates for each pixel were obtained.Chroma 0.105 0.008 13.279 0.000 The left-hand panels of Fig. 2 show the color pointStd chroma 0.100 0.028 3.586 0.002
distributions obtained in the form of the projection on theFruit u*£* plane for all four scenes. The right-hand panels
Standard error of present the distribution of L* values as a function ofAdjusted squared multiple R: 0.993 estimate: 0.187C*. For every original image, a set of new images was
Variable Coefficient Std error T P (2 Tail) computed by changing the chroma value for each pixelwhile the lightness and hue angle were kept constant.Constant 01.816 0.211 08.600 0.000The chroma was changed in two different ways: (1) theChroma 0.121 0.008 15.298 0.000
Std chroma 0.126 0.017 7.607 0.000 chroma value of each point was increased or decreasedby adding/subtracting the same number of chroma units
Terrasgeelto or from the chroma value of each pixel ( translation),Standard error of
Adjusted squared multiple R: 0.977 estimate: 0.283 and (2) the chroma value of each pixel was multipliedby a constant (multiplication). After that, the new r , g ,
Variable Coefficient Std Error T P (2 Tail)and b gray values were computed using the inverse of
Constant 00.205 0.286 00.717 0.483 the matrix in Eq. (8) . If, during the processing of theChroma 0.162 0.019 8.728 0.000 images, for some pixels the calculated values were outsideStd chroma 0.276 0.032 8.522 0.000
the color gamut of the monitor, the maximum possibleStadhuis value of chroma was used for those pixels (clipping).
Standard error of For each scene twenty images were prepared using tenAdjusted squared multiple: 0.981 estimate: 0.253
different constants of translation and ten of multiplication.Variable Coefficient Std error T P (2 Tail) The multiplication constants we used were 0.5, 0.6, 0.7,
Constant 0.423 0.178 2.372 0.029Chroma 0.204 0.016 13.172 0.000Std chroma 0.293 0.035 8.456 0.000
surements were made using a Spectroradiometer Spec-traScan PR-650 and an LMT L1003 Luminance meter,respectively.
In order to check how accurate the colors of the originalscene were reproduced on the screen, we analyzed thechromaticities of the patches of a Kodak color controlchart photographed at the original scene immediately afterthe original picture was taken. Comparing the chromatic-ity coordinates of the patches displayed on the screenwith those of the original patches, we found that, for thesaturated patches, the color points measured on the screenwere lying at or close to the boundaries of the color gamutof the monitor. The differences between reproduced andreal chromaticities were small enough to assume a faithfulreproduction of the real colors.
FIG. 7. Colorfulness calculated as the linear combinationTo obtain the CIELUV color coordinates from r , g ,of the average chroma and the variability of chroma in termsand b gray values for each pixel, the corresponding R ,of standard deviation plotted vs. the experimentally obtained
G , and B values were calculated and then the following colorfulness judgments, averaged over all the subjects, forlinear transformation was used to convert R , G , and B the images of all four scenes. Filled symbols: multiplication.
Open symbols: translation.into X , Y , and Z tristimulus values:
104 COLOR research and application
1828c
/ 8A0D$$828C 02-26-97 12:21:27 crras W-Color Res

FIG. 8. Averaged scaled naturalness estimations plotted as a function of the average chroma for four scenes: (a) Wanda,(b) Fruit, (c) Terrasgeel, and (d) Stadhuis. Filled symbols: multiplication. Open symbols: translation. The arrow points to thenaturalness judgment of the original image.
0.8, 0.9, 1.2, 1.4, 1.6, 1.8, and 2.0. As for translation, in and its variability (standard deviation of chroma) werecomputed for each image. The mean of the differencesorder to make the two methods comparable, we subtracted
the values of chroma that amounted to five tenth, four in lightness and hue angle between corresponding pixelsbefore and after transformation of an image was alwaystenth, three tenth of the average chroma of the original
image, and so on, or added two tenth, four tenth, etc., in less than 0.013 expressed in the appropriate units. Visualinspection of the prepared images confirmed the absenceaccordance with the constants used for multiplication.
Thus, the whole stimulus set including the original images of noticeable distortions due to deviations in hue andlightness.consisted of 84 different images. The average chroma
105Volume 22, Number 2, April 1997
1828c
/ 8A0D$$828C 02-26-97 12:21:27 crras W-Color Res

FIG. 9. Averaged scaled naturalness estimations plotted as a function of the colorfulness for the images of four scenes:(a) Wanda, (b) Fruit, (c) Terrasgeel, and (d) Stadhuis. Filled symbols: multiplication. Open symbols: translation. The arrowpoints to the judgments of the original image.
EXPERIMENTAL PROCEDURE ments, the subjects rated the perceptual quality, the color-fulness, and the naturalness of the images on a ten-pointnumerical category scale ranging from one (lowest attri-Five subjects participated in the experiments. They hadbute strength) to ten (highest attribute strength) . Thenormal or corrected-to-normal visual acuity. Their colorfollowing instructions were read to the subjects.vision was checked with the aid of the H-R-R Pseudoiso-
chromatic Plates.15 No color deficiencies were observed.Experiment 1: Perceptual Quality EstimationThe subjects viewed the monitor placed in a darkened
room at a distance of about 1.7 m. At this distance, the ‘‘You will be presented with a sequence of images.Every time, you will see one image. Your task is topixel size is about 1 min of arc. In three separate experi-
106 COLOR research and application
1828c
/ 8A0D$$828C 02-26-97 12:21:27 crras W-Color Res
judge the perceived quality of that image using an the picture was taken. Before starting the experiment,you will see a training series, which helps you to under-integer number from one to ten. One corresponds to
the lowest perceptual quality, ten to the highest per- stand the task and to get an idea about the range ofnaturalness for the images employed.’’ceptual quality, according to your opinion. Perceptual
image quality is defined as the degree of excellence Although the original images were included, it shouldbe emphasized that they were not explicitly identified toof the image. Before starting the experiment, you will
see a training series, which helps you to understand the subjects as such.All subjects first participated in Experiment 1. Thenthe task and to get an idea about the range of percep-
tual quality for the images employed.’’ three subjects took part in Experiment 2 followed byExperiment 3. The reverse holds for the other two sub-jects. Each experiment consisted of one session in
Experiment 2: Colorfulness Estimation which all 84 images were presented four times in arandom sequence. Within each experiment, this se-‘‘You will be presented with a sequence of images.quence was the same for every subject. However, theEvery time, you will see one image. Your task is to judgesequence varied between experiments. The imagesthe perceived colorfulness of that image using an integerwere displayed on the black screen for 5 s, while thenumber from one to ten. One corresponds to the lowestinterval between two image exposures was at least 3 s,degree of colorfulness, ten to the highest degree of color-during which a 4.6 cd /m 2 gray adaptation field withfulness, according to your opinion. Colorfulness is definedthe chromaticity coordinates of D65 appeared on theas presence and vividness of colors in the whole picture.screen. The images and adaptation field had the sameBefore starting the experiment, you will see a trainingsize. Before starting a session, the subjects judged aseries, which helps you to understand the task and to gettraining series of 30 images.an idea about the range of colorfulness for the images
employed.’’
RESULTSExperiment 3: Naturalness Estimation
Quality Estimation‘‘You will be presented with a sequence of images.
In the first experiment, we obtained four estimationsEvery time, you will see one image. Your task is toof the perceptual quality of each image for each subject. Injudge the perceived naturalness of that image using anorder to correct for possible nonlinearities in the responseinteger number from one to ten. One corresponds toscale, the data obtained for each subject were transformedthe lowest degree of naturalness, ten to the highest de-to a subjective interval scale on the basis of Thurstone’sgree of naturalness, according to your opinion. Natural-model of categorical judgment (for details, see Torger-ness is defined as the degree of correspondence betweenson16) . The computer program we used17 performed thethe image reproduced on the screen and reality, that is,transformation via a maximum likelihood estimation.the original scene as it is according to you at the timeAfter the transformation no systematic differences be-tween the subjects were observed. The quality estimationsof the four series of images, averaged over the subjects,are presented in Fig. 3, plotted as a function of theircomputed average chroma. Four main conclusions can bederived from these graphs. First, in every series of imagesthere is one image with a maximum quality value. Sec-ondly, this image has an average chroma that is slightlyhigher than that of the original (unprocessed) image.Thirdly, there is a difference between the scenes: thequality estimations for ‘‘Stadhuis’’ differ from those forthe other scenes in that the perceived quality of ‘‘Stad-huis’’ increased in almost all the steps in which thechroma was increased. This we tend to attribute to thelow value of chroma for all pixels of the original image.
The observed difference is in line with the results ob-tained by Stokes et al.18 showing that scene content sig-nificantly influences acceptability but not perceptibilitytolerances for chroma manipulations of pictorial images
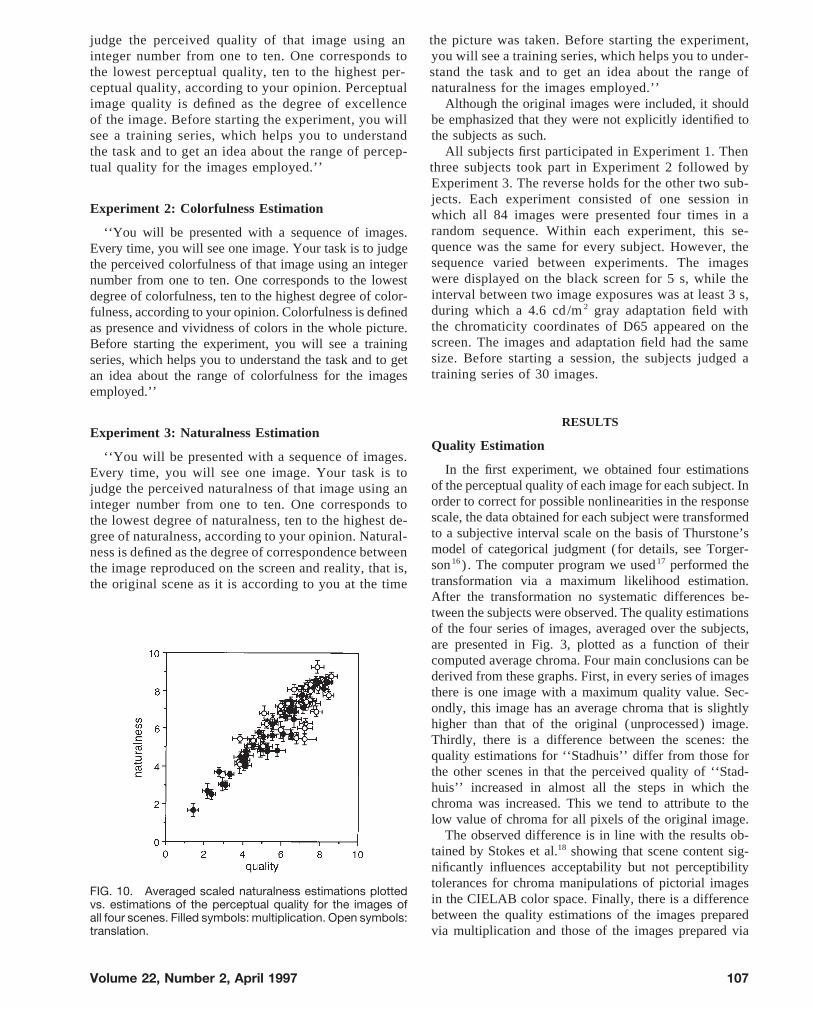
FIG. 10. Averaged scaled naturalness estimations plottedin the CIELAB color space. Finally, there is a differencevs. estimations of the perceptual quality for the images ofbetween the quality estimations of the images preparedall four scenes. Filled symbols: multiplication. Open symbols:
translation. via multiplication and those of the images prepared via
107Volume 22, Number 2, April 1997
1828c
/ 8A0D$$828C 02-26-97 12:21:27 crras W-Color Res

translation: the quality estimations of the latter images difference in quality between the original images andthe images of the highest perceptual quality is signifi-are almost always higher for the same average chroma.
This was particularly evident in the case of the scenes cant as shown by Student’s t-test ( t Å 3.267, p õ0.001) .‘‘Fruit’’ and ‘‘Terrasgeel,’’ and also in the case of all the
scenes in the part of the graph where the chroma was lessthan in the original image. The systematic difference in
What Determines Colorfulness?the results obtained for the two different methods impliesthat, in our experiment, the average chroma was not the One of the intriguing questions is how colorfulnessonly variable determining the perceptual image quality. depends on the distribution of the colors in color space.This other factor is not likely to be the result of the Intuitively, we propose that colorfulness depends on (1)clipping procedure. Although the color point distributions the distance of image colors from neutral gray, and (2)showed a similar amount of clipping when chroma is the distances between individual image colors. We modelincreased, translated images were in general judged to be the first factor as average chroma. The second factor isof higher quality than the ones transformed by multiplica- in first order incorporated as the standard deviation of thetion. Further, unlike the multiplication procedure, de- distribution of the chroma values of all individual imagecreasing chroma by means of translation leads to clipping colors.at zero value. Yet the quality ratings for the translated From Fig. 4, it is indeed evident that besides the aver-images are systematically higher for all four scenes. None age chroma there is another factor that systematicallyof the subjects reported local distortions due to clipping. influences subjective colorfulness: the colorfulness of the
To understand the observed discrepancy, we looked for images prepared via multiplication is lower than the color-a global perceptual attribute of the pictures underlying fulness of those prepared via translation when the averagethe quality estimations. Since we had changed the chroma chroma is less than in the unprocessed images. The oppo-of each pixel of the image, it was proposed that such an site relation is observed when the average chroma isattribute might be the colorfulness of the whole image. higher than in the original images. We suggest that thisThe next section describes the results of the second exper- other factor might be the average distance between indi-iment, in which the subjects judged the colorfulness of vidual image colors modeled as the variability of the aver-the same set of images. age chroma expressed in, for instance, the standard devia-
tion of chroma. The fact that these values differ in thecases of multiplication and translation follows from theColorfulness Estimationdefinition of these computations. In Fig. 6, the computed
In the second experiment, we obtained estimations of standard deviation of chroma is plotted vs. the averagecolorfulness, which we then transformed in the same way chroma. In an ideal situation, we would have two straightas in the previous experiment. Because of the great simi- lines for each scene: an oblique line for the images pre-larity of the data of the different subjects, we averaged pared via multiplication, where the slope corresponds tothe estimations over all the subjects for every scene. The the ratio of the standard deviation and the average of theaveraged subjective colorfulness estimations are pre- distribution of chroma values, and a horizontal line forsented as a function of the average chroma in Fig. 4. the images produced via translation. However, becauseSubsequently, we used the values of colorfulness as the of the restrictions of the monitor, the values of chromamagnitudes of the perceptual attribute that determines expected for some pixels could not be achieved when thethe quality estimations. The results of this substitution chroma was increased, or some pixels had zero value andare presented in Fig. 5. The discrepancy between the their chroma could not be decreased as for the other pix-two sets of images (obtained via multiplication and els. These limitations led to more complicated relationstranslation) , observed when chroma was used as the between the average chroma and its spread.independent variable determining the quality estima- If we compare Figs. 4 and 6, we observe a strongtions, has disappeared. The resulting coincidence of the dependency of the subjective value of colorfulness onquality judgments demonstrates that, in our experi- both the average chroma and its variability representedments, colorfulness was indeed the main perceptual at- by the standard deviation of the distribution of chromatribute determining the quality. There is an optimum values. This dependency of colorfulness on these twovalue of colorfulness (Fig. 5 ) that provokes a subjec- variables can be efficiently described by their linear com-tive preference in quality. When the colorfulness de- bination constituting the total value of the perceptual attri-creases, the perceptual quality decreases very rapidly. bute considered:The opposite was observed when the colorfulness in-
Colorfulness Å A∗(Average Chroma)creased. Only within the small region around the origi-nal images were the quality estimations high. The col- / B∗(Standard deviation of Chroma) / C . (9)orfulness of the images of the highest perceptual qualityis somewhat higher than that of the originals. The same, The results of the regression analysis are given in Table
I. Both variables, i.e., average chroma and its variability,systematic trend was observed for all four scenes. The
108 COLOR research and application
1828c
/ 8A0D$$828C 02-26-97 12:21:27 crras W-Color Res

significantly contribute to the impression of colorfulness CIELUV color space. Using two different types ofchroma variation, we were able to identify the variabilityin the case of all four scenes. Note, however, that the
relative contribution of the two variables differs between of chroma as the factor that, together with averagechroma, influences perceived colorfulness. Hence, boththe scenes with a high average chroma (Wanda, Fruit)
and those with a low average chroma (Stadhuis, Terras- factors should be considered when optimizing imagequality.geel) . We can rewrite the equation as follows:
The fact that the perceptual quality of the original im-Colorfulness Å A∗(Average Chroma age can be improved emphasizes the subjective preference
for more saturated, indeed, more colorful images. A simi-/ D∗Standard deviation of Chroma) / C , (10)lar effect has been reported by Hunt, 20 who found that
where A and C are constants depending on the scaling an observer may sometimes prefer a rendering of a sceneprocedure, and D , being B /A , reflects the relative contri- that looks different from the original, with ‘‘. . . skiesbution of the two variables. The fact that the value of the that are bluer, skin that is more saturated and sunsets thatadjusted squared multiple correlation coefficient exceeds are redder’’ (p. 48). The same preference for more highly0.977 in the case of all scenes supports the validity of the saturated colors was measured by Siple and Springer.21
model for these experiments. The close correspondence The consistency of subjective preference that was foundbetween the experimentally determined colorfulness and in our experiments supports the approach of systematicthe computed colorfulness is illustrated in Fig. 7. transformation of images on the basis of different attri-
butes of color perception for optimization of color repro-duction.Why the Quality Decreases
The strong link between image quality and naturalnessTo answer the question of why the perceptual quality that was found in the experiments suggests that natural-
of the images first increases and then decreases with in- ness is an important perceptual constraint in the colorcreasing colorfulness, we asked our subjects to judge the reproduction of images of natural scenes. Naturalness,naturalness of the images in the third experiment. The however, is not identical to image quality. This can beresults of that experiment are very similar to those ob- appreciated, if one compares the quality and naturalnesstained in the quality estimation experiment. As one can estimations in the case of the ‘‘Stadhuis’’ scene [Figs.see in Fig. 8, there is a difference between the values of 5(d) , 9(d)] . For this scene, the perceived quality re-naturalness plotted as a function of the average chroma mained high while naturalness decreased for the mostobtained for the images produced via multiplication and colorful images. This phenomenon is less pronouncedthose obtained for the images produced via translation. but still present in the case of the other scenes.19,22 ThisAt the same time, the arrangement of the naturalness difference between quality and naturalness indicates thatestimations based on the colorfulness of the images irre- subjects sometimes used different criteria to assess natu-spective of the transformation method applied demon- ralness and quality: the subjective preference in qualitystrates the key role of subjective colorfulness in determin- was biased towards more colorful images although theing the naturalness of the images (Fig. 9) . observers realized that these images looked somewhat
The correspondence between the quality and natural- unnatural. The strong relation between quality and natu-ness estimations obtained for all the images is presented ralness in the case of the woman’s portrait highlights thein Fig. 10. There appears to be a strong relation between great importance of the presence of familiar objects in athose attributes. In fact, the correlation coefficient be- scene, in this case, for example, the skin.23 As a result,tween the quality and naturalness estimations, averaged subjective uncertainty in estimating image quality andover the four scenes, amounts to 0.929. Such a significant naturalness was found to be minimal.coincidence implies that perceptual quality and natural- In our experiments, all images contained living andness lie very close to one another.19 This result stresses natural objects, e.g., a person, fruit, plants, which mightthe importance of naturalness as a decisive constituent of strengthen the naturalness constraint on quality judg-image quality. ments. Further research will determine whether natural-
ness criteria can also be applied to images lacking suchnatural objects.
DISCUSSION
The experimental results show that the perceptually uni-CONCLUSIONS
form CIELUV color space is well suited for manipulatingcolor images in a way that can be easily interpreted. This In the present study, the relation between perceptual im-
age quality and naturalness was investigated by varyingfollows from the fact that the transformation of the imagesin this space led to an increase in their quality. But most the colorfulness of color images of natural scenes. The
main conclusions are:importantly, such a global perceptual attribute as the col-orfulness of the whole picture could be expressed in termsof the statistics of the color point distribution in the 1. The colorfulness of an image is the main perceptual
109Volume 22, Number 2, April 1997
1828c
/ 8A0D$$828C 02-26-97 12:21:27 crras W-Color Res

7. S. Tominaga, Color classification of natural images. Color Res.attribute underlying image quality and naturalnessAppl. 17, 230–239 (1992).when chroma varies.
8. Y. Ohta, Knowledge-Based Interpretation of Outdoor Natural Color2. The colorfulness of an image can be modeled as a Scenes, Pitman Advanced Publishing Program, Boston, 1985, pp.
function of the averaged chroma and the variability of 136.9. W. De Corte, Finding appropriate colors for color displays. Colorchroma as derived from the color point distribution in
Res. Appl. 11, 56–61 (1986).the CIELUV color space.10. R. C. Carter and E. C. Carter, High-contrast sets of colors. Appl.3. Colorfulness enhancement enables higher perceptual
Opt. 21, 2936–2939 (1982).quality. The further increase in colorfulness, however, 11. R. W. G. Hunt, Measuring Colour, 2nd ed., Ellis Horwood, Chich-leads to a reduction in quality due to the resulting ester, 1992.
12. International Lighting Vocabulary, Publication CIE No. 17.4, Ge-decrease in naturalness.neva, 1987.4. The perceptual quality of appreciation-oriented images
13. G. Wyszecki and W. S. Stiles, Color Science: Concepts and Meth-is strongly related to naturalness, which demonstratesods, Quantitative Data and Formulae, 2nd ed., John Wiley and
the importance of naturalness as a decisive constituent Sons, New York, 1982.of image quality. 14. M. R. Pointer, The gamut of real surface colours. Color Res. Appl.
5, 145–155 (1980).15. L. H. Hardy, G. Rand, and M. C. Rittler, H-R-R-Pseudoisochro-
matic Plates for Detecting, Classifying, and Estimating the DegreeACKNOWLEDGMENTSof Defective Color Vision, American Optical Company, New York,1957.The authors wish to thank Prof. J. A. J. Roufs, Prof. E. N.
16. W. S. Torgerson, Theory and Methods of Scaling, Wiley, NewSokolov, and Dr. J. B. Martens for their useful adviceYork, 1958.
and help. The research of E. A. Fedorovskaya was made 17. M. C. Boschman, THURCATD: A program for processing resultspossible by a fellowship from the Eindhoven University of numerical category scaling: calculation of parameters in the
Thurstone model, condition D. IPO report 108, 1991.of Technology, the Netherlands.18. M. Stokes, M. D. Fairchild, and R. S. Berns, Colorimetrically quan-
tified visual tolerances for pictorial images, in Proceedings of the1. J. C. Dalton, Visually optimized color-image enhancement, in Per- TAGA & ISCC Conference on Comparison of Color Images Pre-
ceiving, Measuring, and Using Color, M. H. Brill, Ed., Proc. SPIE sented in Different Media, Williamsburg, Virginia, February 23–1250, 1990, pp. 177–189. 26, 1992, pp. 757–777.
2. J.-Y. Kim and Y.-H. Ha, Pseudo-linearly modified IHS color model 19. H. de Ridder, E. A. Fedorovskaya, and F. J. J. Blommaert, Natural-and its application to color image enhancement, in Proceedings ness and image quality: chroma variation in color images of naturalof the First IS&T/SID Color Imaging Conference: Transforms & scenes. IPO Annual Progress Report 28, 89–95 (1993).Transportability of Color, Scottsdale, Arizona, USA, 1993, pp. 23– 20. R. W. G. Hunt, Chromatic adaptation in image reproduction. Color27. Res. Appl. 7, 46–49 (1982).
3. R. W. G. Hunt, The Reproduction of Colour in Photography, Print- 21. P. Siple and R. M. Springer, Memory and preference for the colorsing & Television, Fountain Press, Tolworth, U.K., 1987, pp. 36–48. of objects. Percept. & Psychophys. 34, 363–370 (1983).
4. J. A. J. Roufs, Perceptual image quality: concept and measurement. 22. H. de Ridder, F. J. J. Blommaert, and E. A. Fedorovskaya, Natural-Philips J. Res. 47, 35–62 (1992). ness and image quality: chroma and hue variation in color images
5. M. A. Arbib and A. R. Hanson, Vision, brain, and cooperative of natural scenes, in Human Vision, Visual Processing, and Digitalcomputation: an overview, in Vision, Brain, and Cooperative Com- Display VI, B. E. Rogowitz and J. P. Allebach, Eds., Proc. SPIEputation, M. A. Arbib, A. R. Hanson, Eds., A Bradford Book, The 2411, 1995, pp. 51–61.MIT Press, Cambridge, MA, 1987, pp. 1–83. 23. Y. Miyake and H. Haneishi, The evolution of nonimpact print—
6. G. Derefeldt, Colour appearance systems, in Vision and Visual Dys- impact on image quality, in Proceedings of the First IS&T/SIDfunction: Vol. 6: The Perception of Colour, P. Gouras, Ed., Macmil- Color Imaging Conference: Transforms & Transportability of
Color, Scottsdale, Arizona, USA, 1993, pp. 222–227.lan Press, New York, 1991, pp. 218–261.
110 COLOR research and application
1828c
/ 8A0D$$828C 02-26-97 12:21:27 crras W-Color Res