christopher r parsons, ronald skeldon (university of ... · christopher r parsons, ronald skeldon...
TRANSCRIPT
Working Paper
T13
Quantifying the International Bilateral Movements of Migrants
CHRISTOPHER R PARSONS, RONALD SKELDON (University of Sussex), TERRIE L WALMSLEY (Purdue University)
and L ALAN WINTERS (World Bank)
September 2005
Issued by the Development Research Centre on Migration, Globalisation and Poverty
2
The UK Department of for International Development (DFID) supports policies, programmes and projects to promote international developmentpoverty reduction globally. DFID provided funds for this study as part of that objective goal but the views and opinions expressed are those of the author(s) alone. Development Research Centre on Migration, Globalisation and Poverty Arts C-226, University of Sussex Brighton BN1 9SJ Website: http://www.migrationdrc.org Email: [email protected] Tel: +44 (0)1273 873394 Fax: +44 (0)1273 873158 This paper may be reproduced free of charge in any format provided the source is acknowledged.

3
C O N T E N T S ABSTRACT 4 INTRODUCTION 5 WHO COUNTS AS A MIGRANT 6 SOURCES OF MIGRATION STOCK DATA 9 THE COMPARABILITY OF MIGRATION STATISTICS 11 COLLECTED DATA 13
Version 1 14 Version 2 16 Version 3 16 Version 4 19 Version 5a 19 Version 5b 21 Version 5c 23
DATA SUMMARY 25 ANNEX 1 31 ANNEX 2 38 REFERENCES 39 Primary Data Sources 40 Secondary Data Sources 46
4
ABSTRACT This paper presents five versions of an international bilateral migration stock database for 226 by 226 countries. The first four versions each consist of two matrices, the first containing migrants defined by country of birth i.e. the foreign born population, the second, by nationality i.e. the foreign population. Wherever possible, the information is collected from the latest round of censuses (generally 2000/01), though older data are included where this information was unavailable. The first version of the matrices contains as much data as could be collated at the time of writing but also contains gaps. The later versions progressively employ a variety of techniques to estimate the missing data. The final matrix, comprising only the foreign born, attempts to reconcile all of the available information to provide the researcher with a single and complete matrix of international bilateral migrant stocks. Although originally created to supplement the GMig model (Walmsley and Winters 2005) it is hoped that the data will be found useful in a wide range of applications both in economics and other disciplines. Key Words: migration data, bilateral stock data
5
INTRODUCTION The economics literature increasingly recognizes the importance of migration1 and its ties with many other aspects of development and policy. Examples include the role of international remittances (Harrison, Britton and Swanson 2003) or the immigrant-links underpinning the migration-trade nexus (Gould 1994). More recently, utilising their GMig model, Walmsley and Winters (2005) demonstrated that a small relaxation on the restrictions of the movement of natural persons would significantly increase global welfare, with the majority of benefits accruing to developing countries.
It is somewhat surprising, therefore, that few attempts have been made to collate detailed and comparable bilateral migration data. Where attempts have been made, no distinction is typically made between the foreign population, measured by country of birth, and those recorded by their nationality, despite the large disparities that often exist between these series. Previous endeavours display a number of failings which impede further research at the global level, e.g. with data collection often falling short of transparent procedures, or undue focus on particular regions. Only the United Nations adopts a truly global view when summarizing international migrant movements, but its work provides only total migrant stocks for each country. This paper attempts to rectify these shortcomings in the literature and initially presents four versions of two matrices for 226 by 226 countries, the first of which records foreign population by country of birth and the second by nationality, which, for the purposes of this paper, is treated analogous to citizenship2. Though countries employ many different methods for collecting and presenting data, we attempt to reconcile these methods to create as full and comparable a dataset as is currently possible. It is recognized that alternative versions of the data will be of different value depending upon the user. The data are therefore presented in a transparent fashion so that readers may choose which version best suits them. The first version, for example, simply contains the raw data with some minor adjustments and will be of more use to a demographer. The later versions contain far more bilateral entries, and despite individual entries being less accurate, and other entries being crude approximations, will prove more useful to the applied economist. Version 1 The term migration and immigration and migrant and immigrant are used interchangeably throughout. 2 UN (1980) defines a person’s citizenship as their legal nationality. Following from this, here no distinction is made between citizenship and nationality, and thus no notion of belonging or of political or legal participation is employed.
6
5, although covering only the foreign born, represents as full a picture of bilateral international migrant stocks as the data permits. By presenting the data in this way it is hoped this paper will provide a rich resource for future research. The following section describes who qualifies as a migrant under both of the definitions utilised in this paper. This will provide the unfamiliar reader with the background to interpret the statistics contained herein. Section 3 investigates the sources of migration statistics, and while it is not the aim of this paper to elucidate all of the nuances in the techniques used to collect migration data, this section should give the reader a sense of the heterogeneity that exists among the available statistics3. Section 4 outlines the different versions of the matrices that can be found in the statistical annex, while the final section provides some summary statistics of the results obtained. WHO COUNTS AS A MIGRANT? For the uninitiated it can be confusing as to who actually qualifies as a migrant, not least because of the broad range of classifications used to define them. Migrants may be recorded in terms of their residence (including their country of previous residence), their citizenship, the duration of time spent abroad4, the purpose of their stay (i.e. visa type) and their birth place (Bilsborrow et al 1997), and additionally, other definitions on occasion such as migrants’ ethnicity. The UN (1998) defines a migrant as ‘any person who changes his or her country of usual residence’, though residence may refer to both a change of residence or residential status. Tourists and business travellers, among others, are not included in migration statistics, as these movements do not involve changing one’s usual place of residence. Tourists are recorded in separate statistics and business visitors contribute to the non-migrant population. Statistically, the migrant population can be equated directly with the number of foreigners; either those recorded by country of birth, the foreign born, or that fraction of the population with foreign
3 For a full treatise on this subject readers are referred to Bilsborrow et al (1997). 4 Though it is increasingly recognized that distinguishing between shorter and longer term migrants is useful for policy making etc. this division is ignored here since generally censuses fail to make this distinction. Indeed seldom do countries accurately distinguish these alternative series.
7
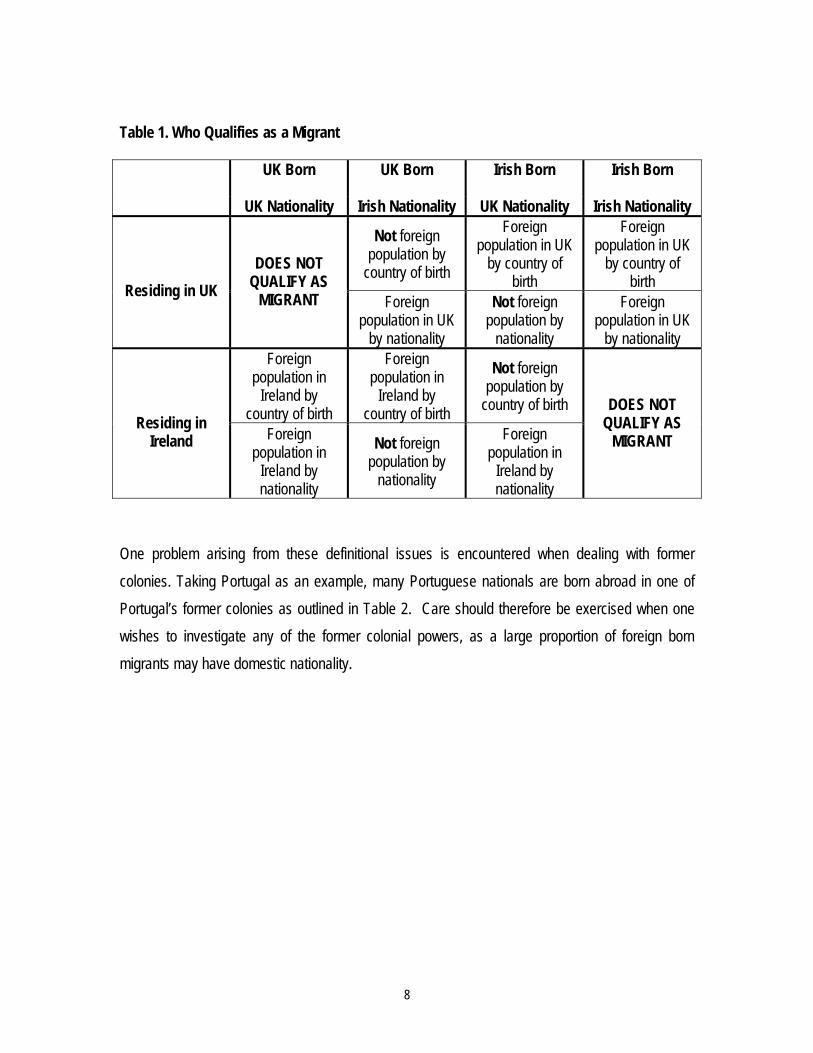
nationality, the foreign population. The confusion over migrants is exacerbated by the fact that a migrant’s nationality need not be the same as their country of birth. Thus one may be born domestically but qualify as a foreign national, or conversely, may be born a national but still be characterised as foreign born. Table 1 conveniently summarizes the various possibilities as to who constitutes part of the foreign population under each definition, i.e. who is considered a migrant when only two countries are considered, Ireland and the UK. Only domestic nationals residing in their home country of birth do not qualify as immigrants under one or other of the definitions. The foreign born comprise both national and foreign citizens, and represent first generation migrants. The foreign population may include subsequent generations of migrants along with those born domestically with foreign nationality. To reiterate, children at birth typically hold the citizenship of their parents and thus when born in a country other than that of their parents’ country of nationality, they may be classified as migrants without having ever moved!5 For example the child of an Indian migrant born in England will most likely have Indian nationality6. While their parents will, until they become naturalised, be recorded as migrants under both definitions, their child may only be a migrant as defined by nationality. However, while a migrant’s citizenship may change, their place of birth is fixed over their lifetime. Therefore, defined strictly by country of birth, a migrant must have at some point in their life moved to be classified as an international migrant. From a strictly theoretical perspective the foreign born definition may be viewed as a superior measurement since movement is the very essence of migration. However, it is the nationality definition that is commonly used in other social sciences since nationality data give a better indication of when the migration took place.
5 This is not always the case and depends on individual country’s’ immigration and naturalisation policy. 6 Since the British Nationality Act 1981, birth in the UK does not guarantee British citizenship, which may be obtained through birth, descent, registration or naturalisation (see http://www.uniset.ca/naty/BNA1981revd.htm)
8
Table 1. Who Qualifies as a Migrant
UK Born
UK Born Irish Born Irish Born
UK Nationality Irish Nationality UK Nationality Irish Nationality
Not foreign population by
country of birth
Foreign population in UK
by country of birth
Foreign population in UK
by country of birth
Residing in UK DOES NOT
QUALIFY AS MIGRANT Foreign
population in UK by nationality
Not foreign population by
nationality
Foreign population in UK
by nationality Foreign
population in Ireland by
country of birth
Foreign population in
Ireland by country of birth
Not foreign population by
country of birth Residing in
Ireland Foreign population in
Ireland by nationality
Not foreign population by
nationality
Foreign population in
Ireland by nationality
DOES NOT QUALIFY AS
MIGRANT
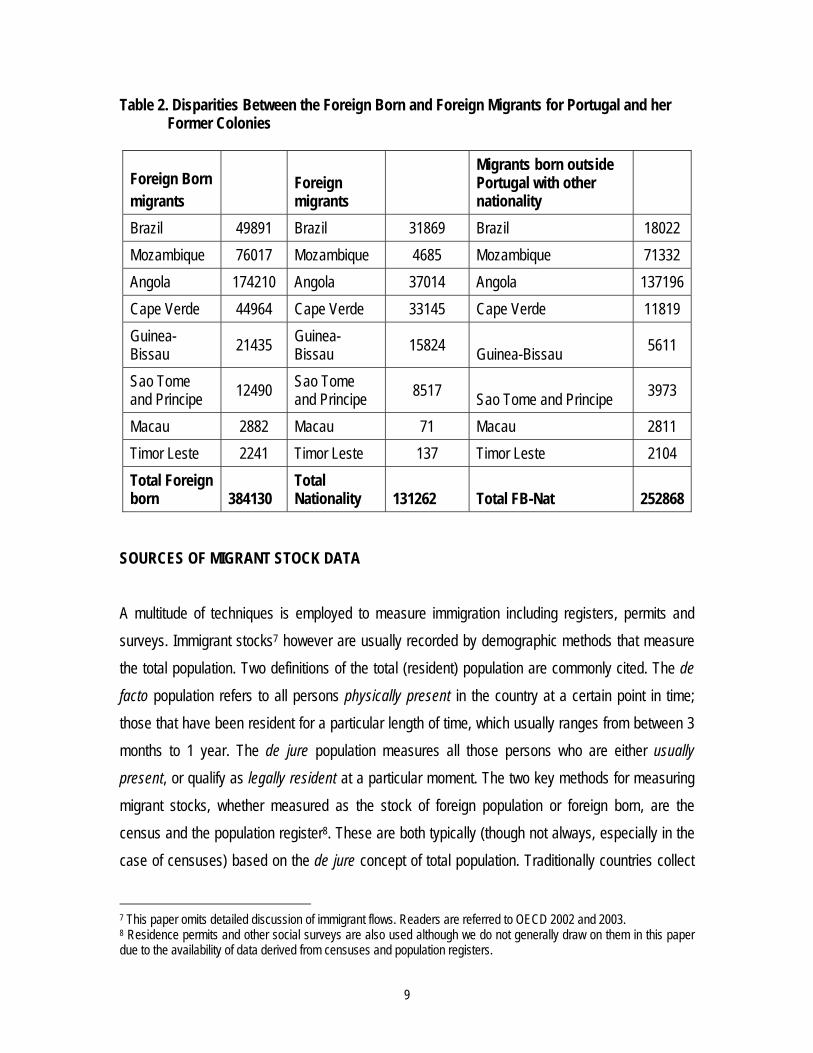
One problem arising from these definitional issues is encountered when dealing with former colonies. Taking Portugal as an example, many Portuguese nationals are born abroad in one of Portugal’s former colonies as outlined in Table 2. Care should therefore be exercised when one wishes to investigate any of the former colonial powers, as a large proportion of foreign born migrants may have domestic nationality.
9
Table 2. Disparities Between the Foreign Born and Foreign Migrants for Portugal and her Former Colonies
Foreign Born migrants
Foreign migrants
Migrants born outside Portugal with other nationality
Brazil 49891 Brazil 31869 Brazil 18022 Mozambique 76017 Mozambique 4685 Mozambique 71332 Angola 174210 Angola 37014 Angola 137196 Cape Verde 44964 Cape Verde 33145 Cape Verde 11819 Guinea-Bissau 21435 Guinea-
Bissau 15824 Guinea-Bissau 5611
Sao Tome and Principe 12490 Sao Tome
and Principe 8517 Sao Tome and Principe 3973
Macau 2882 Macau 71 Macau 2811 Timor Leste 2241 Timor Leste 137 Timor Leste 2104 Total Foreign born 384130
Total Nationality 131262 Total FB-Nat 252868
SOURCES OF MIGRANT STOCK DATA
A multitude of techniques is employed to measure immigration including registers, permits and surveys. Immigrant stocks7 however are usually recorded by demographic methods that measure the total population. Two definitions of the total (resident) population are commonly cited. The de
facto population refers to all persons physically present in the country at a certain point in time; those that have been resident for a particular length of time, which usually ranges from between 3 months to 1 year. The de jure population measures all those persons who are either usually
present, or qualify as legally resident at a particular moment. The two key methods for measuring migrant stocks, whether measured as the stock of foreign population or foreign born, are the census and the population register8. These are both typically (though not always, especially in the case of censuses) based on the de jure concept of total population. Traditionally countries collect
7 This paper omits detailed discussion of immigrant flows. Readers are referred to OECD 2002 and 2003. 8 Residence permits and other social surveys are also used although we do not generally draw on them in this paper due to the availability of data derived from censuses and population registers.
10
data on either the foreign born or the foreign population though in recent years there has been growing recognition of the value of obtaining both series. The census, a retrospective system for surveying the entire population at a single point in time, is generally considered the most comprehensive record of the total population. Although primarily a tool for compiling stock data, flows may be indirectly inferred from the inclusion of questions asking where people used to live in the past. They are usually carried out decennially and therefore produce sparse time series, although it is not uncommon for countries to carry out micro censuses based on a smaller sample (e.g. 5 percent) in non-census years. Perhaps the greatest strength of censuses when measuring the migrant population, besides their universal coverage, is their limited scope in the questions asked, which facilitates comparability across countries. Although virtually every country in the world conducts censuses, invariably they are carried out on different dates within census ‘rounds’ that usually span a decade. The latest (2000) round of censuses that includes nearly all countries9 started in 1995 and was due to be completed by 2004. Population registers are continuous reporting systems for recording populations, both domestic and foreign, and where they are implemented there is a legal obligation for all persons to register themselves with the appropriate local authority. Whilst providing information with much greater frequency than censuses, they are additionally useful in that they can be used to measure both stocks and flows (though typically in order to calculate stocks, data from registers must be combined with reliable census data which provides the stock for the base year). They have also proved cost effective as demonstrated by the 2000 Singapore census where information from the registers was combined with a sample census. Few countries maintain population registers though they have seen somewhat of a revival of late, and are most commonly found in North-Western Europe (specifically Scandinavia) and East Asia.
9 Those not partaking include: Afghanistan, Columbia, Peru, North Korea, Myanmar, Bhutan, Taiwan, Uzbekistan, Tajikistan, Moldova, Bosnia and Herzegovina, Western Sahara, Guinea-Bissau, Liberia, Togo, Nigeria, Chad, Cameroon, Gabon, Sudan, Ethiopia, Eritrea, Somalia, Angola, Democratic Republic of Congo, and Madagascar. (Source: UN, http://unstats.un.org/unsd/demographic/sources/census).

11
THE COMPARABILITY OF MIGRANT STATISTICS
Generally immigrant stock statistics are easier to interpret than data on migrant flows,10 although even they are plagued by a high degree of heterogeneity. The UN recommendations (1998) are, in the main, not adhered to. Until significant progress in standardizing international practices is made, the disparities between various countries’ methods will hamper any comparison of the statistics. That is not to say that no interpretation of the data can be made; just that there are unavoidable inaccuracies associated with both individual countries’ data collecting practices, the tools used to record migrants, and with the actual statistics themselves. Variations exist between different data sources, across countries and even on occasion between data recorded in the same source over time (Bilsborrow et al 1997). An extreme example would be the most recent census of China, which records only around 29,000 migrants since the Chinese definition of migration differs substantially from standard practice. For all these reasons a certain margin of error is inevitable. Problems exist with both de jure and de facto concepts of the total population. De jure measures depend upon the legal system in the recording country, and the definition used to classify residents. These obviously vary significantly across countries. Indeed if countries automatically grant legal residence to a person born within their borders, a person may be recorded twice under this definition if their place of usual residence lies outside their country of birth. Moreover those included sometimes differ between countries -- some nations, for example, include short-term workers while others omit them (UN 1994). De facto measures are conceptually less problematic but are complicated by the fact that the cut-off point, the threshold after which a nation defines a person as a migrant, differs widely across countries. Disparities in collection practices include surveying on different dates or omitting different categories of people11. Problems associated with the tools used to record the statistics include population registers recording different kinds of migrants, a lack of standardization between the questions asked during the census, and alternative country coding used to record the responses. Across Central Asia and Eastern Europe, questions relating to the foreign population often refer to
10 For a succinct and detailed discussion the reader is referred to OECD 2003. 11The UN notes for example, that developed countries generally include refugees in their censuses whilst these are largely omitted from developing countries’ surveys.
12
ethnic nationality; and frequently countries respect different legal boundaries. The UN (1980) recommends that migrants should be enumerated according to the borders in existence at the time of survey. Over time however, borders are redefined, and new countries created. Those interviewed may simply not be aware of the changes. Indeed a foreign-born migrant, resident for many years, may classify themselves as native even when they should in fact be otherwise classified, thus biasing results. In other instances the non-response level of migrants may be very significant, and as census takers are often poorly trained, mistakes will likely go undetected. During the 1969 Kenyan census, for example, 78,756 individuals did not respond to the place of birth question, high relative to the 158,692 that stated they were foreign born (Bilsborrow et al 1997). The problem of illegal immigration is no doubt large. This is difficult to measure and will distort any official migration figures. A pertinent example is Russia, a ‘migration magnet’ in recent years and the country with the longest border with approximately 450 official border posts. Feasible calculations estimating the number of illegal migrants residing in the Russian Federation range from 3.5 to 6 million persons (Heleniak 2002), though there is no real way of ever accurately knowing. In the United States (which arguably conducts the most comprehensive census), the number of illegal immigrants is simply estimated using assumption based models. Numerous migrants will therefore remain unrecorded, not least because it is not in their interest for the authorities to know they are residing illegally. However, a small proportion of illegal residents who have, at some point, been registered or otherwise recorded, will be picked up by future registers once their visas or permits to stay expire. The rate of naturalisation also negatively impinges upon the quality of migration statistics. This varies significantly between countries, and differences in a country’s propensity to offer citizenship impacts potentially very seriously upon migration statistics as recorded by nationality. Naturalisations in South-East and Eastern Asia, for example, are rare, so much so that in many cases foreign nationality data can be directly equated to the foreign born. In these countries first generation migrants and, additionally, immigrant births, contribute almost solely to the foreign population. Indeed, in the specific case of Japan, migrants of even older generations still need to apply for citizenship, a lengthy and arduous process. Largely due to increased marriages between Japanese and foreigners, the number of naturalisations has increased steadily though the figure is
13
still comparatively very low. Conversely, in countries such as Belgium where naturalisations are far more common, additional migrants and immigrant births are likely to contribute significantly to the domestic population as foreign citizens become naturalised. For our purposes the disparity between two immigration systems will impact upon the proportion of the foreign relative to the national population. Finally it should be noted that the way in which immigration statistics are measured has caused several discontinuities in the data. Examples of events which have created these structural breaks include the disintegration of the former U.S.S.R, Yugoslavia, and Czechoslovakia and the British handing back of Hong Kong to the Chinese. All these events produced millions of additional international migrants overnight as new boundaries were drawn and new nationalities created. COLLECTED DATA
In light of the preceding discussion, without further international co-operation and compliance to a fully accepted and standardized set of conventions, any comparison of migrant stocks will be less than perfect. There is little choice but to collect the data that individual countries themselves compile in its rawest form, despite the heterogeneity that exists, and record it. As well as those issues already discussed, this includes having to treat de jure and de facto censuses as equivalent, to accept the alternative aggregations that countries use, when recording dependencies, for example12, and to initially acknowledge alternate country coding. By drawing up a hierarchy of preferred dates, sources, and definitions to be strictly adhered to, the data can then be revised in a number of ways creating an assortment of different versions suitable for different users. The aim of this study was to include as many of the worlds’ migrants as possible, to assign them all to specific countries with the highest degree of accuracy and to produce as full and comparable a bilateral database of international migration stocks as is possible under current data dissemination. In its current form the data should be easy to interpret, suitable for a wide range of academic uses and easy to update should further material become available. In most cases data were recorded from their original source. Data from the latest census round were preferred, as these are
12 For example the number of Puerto Ricans in the United States will not be recorded as they count as Americans.
14
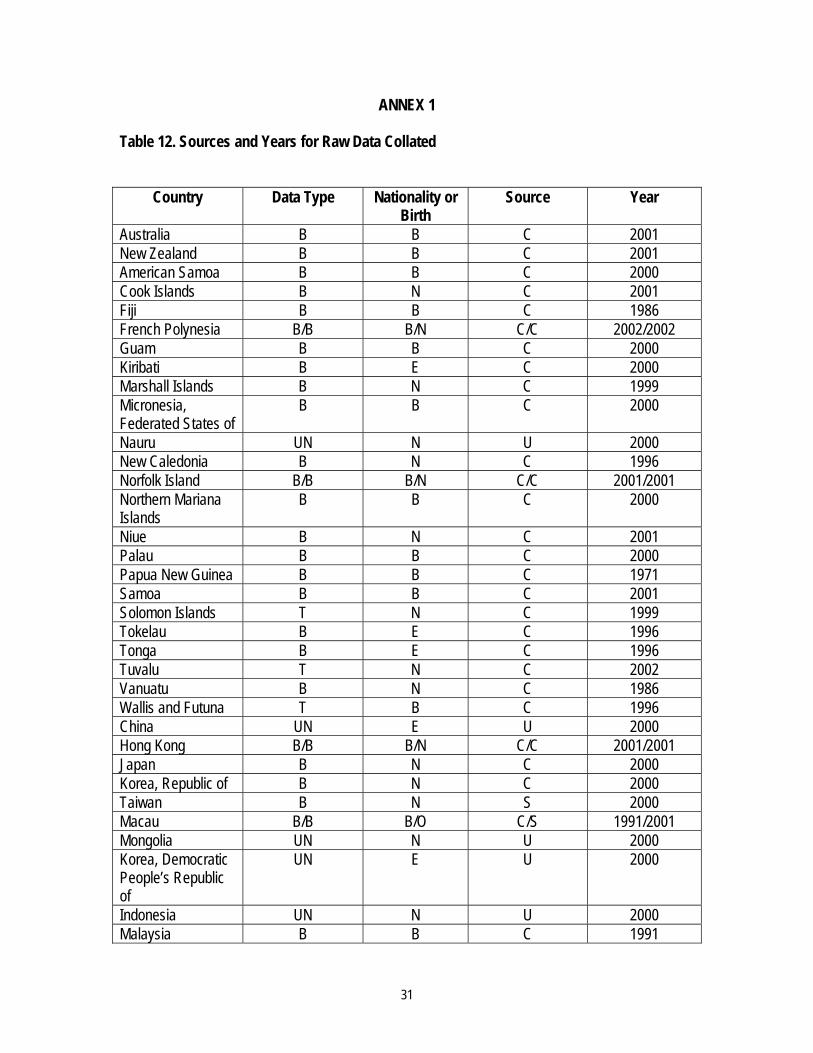
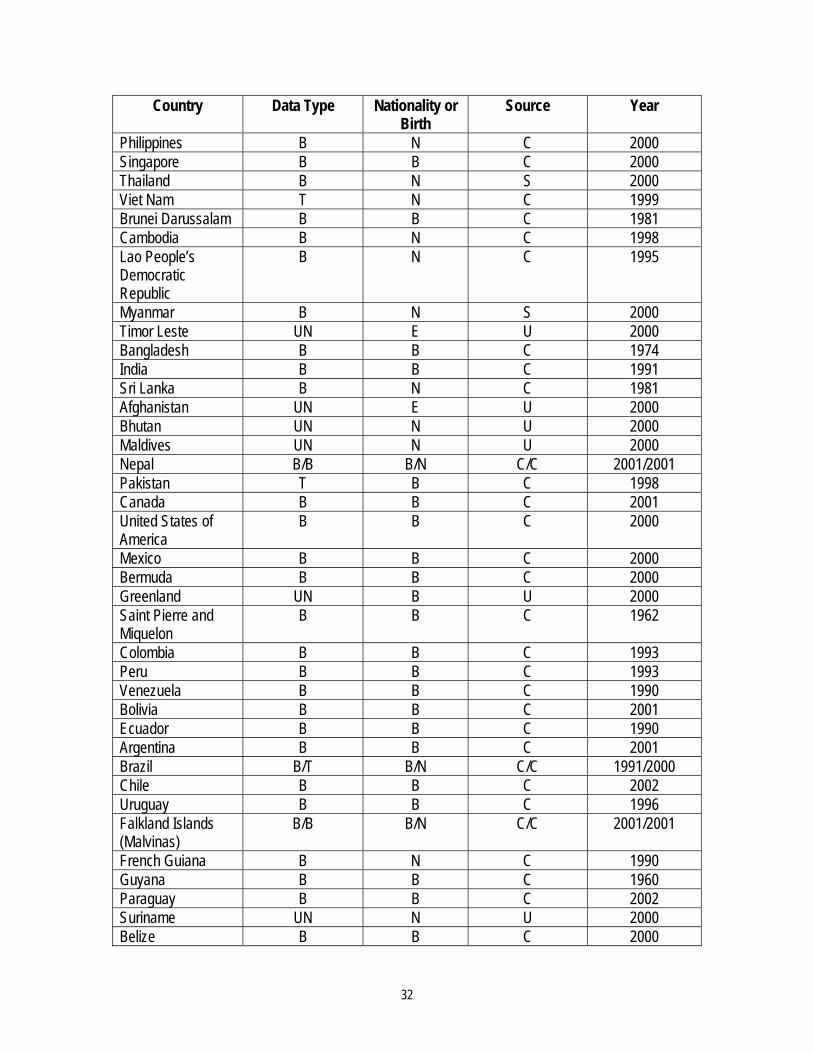
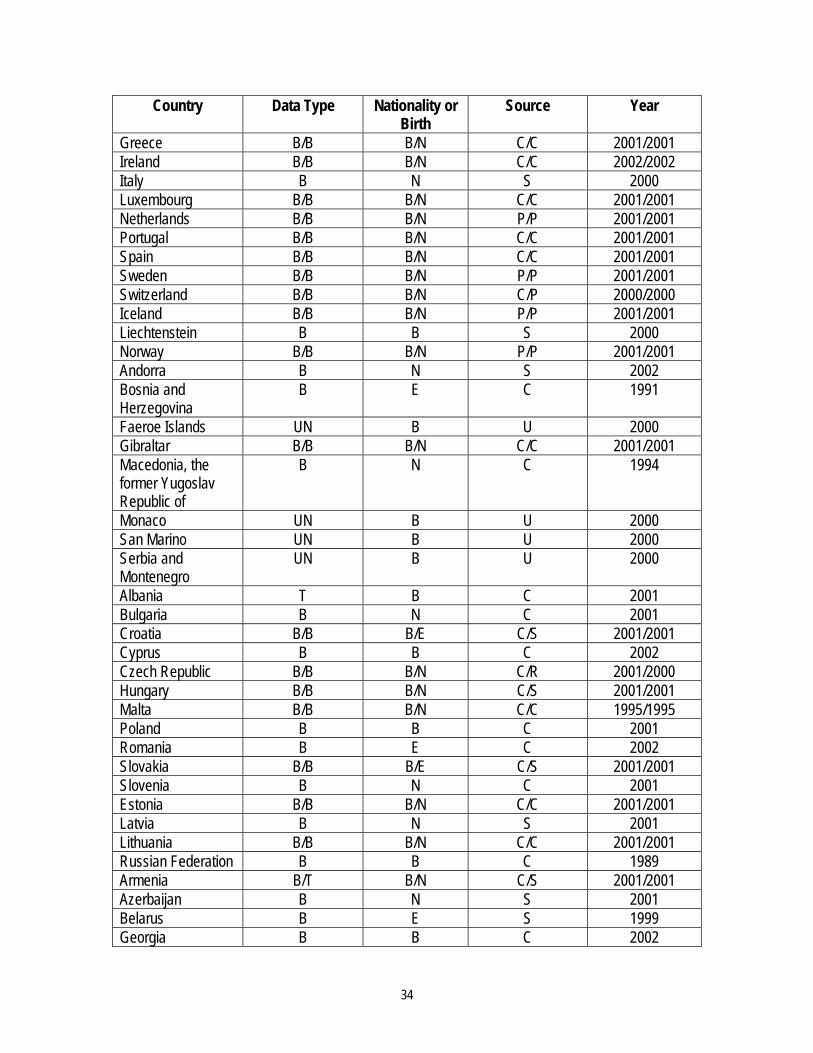
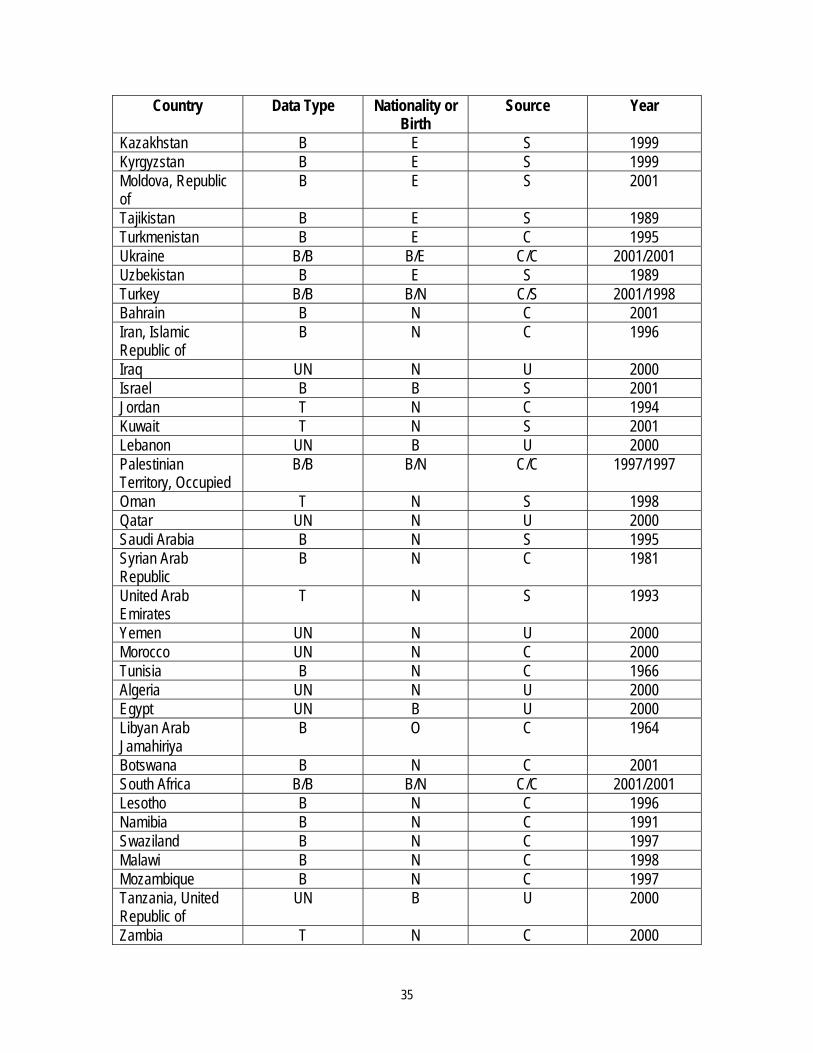
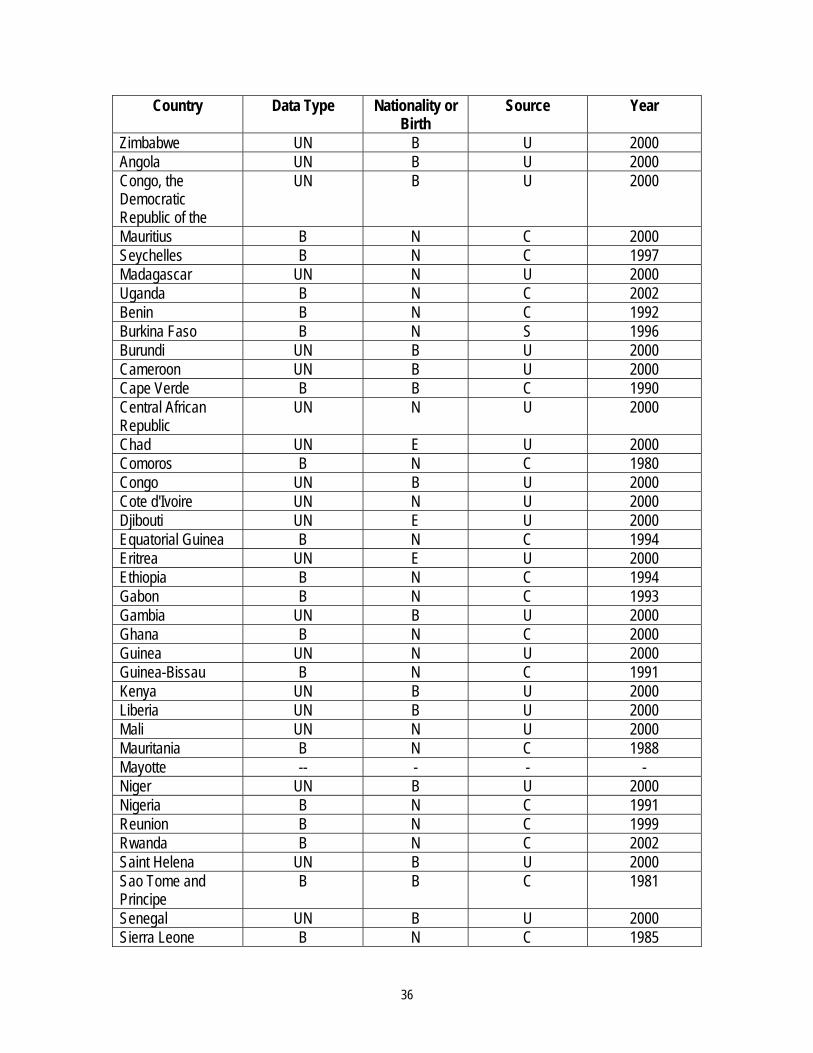
considered most comparable at the global level, although they were not always available due to the significant lags that often exist between the timing of censuses and their publication. Data on both foreign born and foreign nationals were collected where feasible13. Population registers were then drawn upon where censuses were unavailable for the years 2000/200114. In some cases where neither source was available, data were obtained from reliable secondary sources that cite the original15. Some regions of the world provide significantly better data than others, and some simply do not exist. While the data for Europe, the Americas and much of Oceania is of a fair standard, the data for parts of Asia and much of Africa are of more dubious quality; due to political sensitivities and low census budgets. Table 12 in Annex 1 provides a summary of the raw data collected, whether the data are bilateral and the corresponding sources and years. Each version of the database contains two matrices covering 226 by 226 countries16, one recording the foreign born, the other the foreign population, with the exception of the final version, which only covers the foreign born. Incrementally the versions encompass information derived from the original data to supplement the matrices with additional coefficients of interest. Version 1
This contains all of the raw data collected with a few adjustments. In the sources drawn upon in this paper it is common for migrants that cannot be assigned to a specific country of birth/nationality to be recorded in remainder categories that typically have the prefix ‘Other’. In Version 1 as there is no basis on which to assign these migrants, the ‘Other’ categories, which often contribute significantly to the overall total, are simply reported below the matrix in the relevant (host nation) column. Moreover, in a few other cases large ‘unknown’ categories were recorded in the original source (for example, the German data collected from the OECD). These ‘unknowns’ were completely removed from the matrices since it is unclear whether they actually constitute migrants,
13 As the two series are presented separately the diagonals of each matrix will represent those domestically born residing at home or alternatively those of domestic nationality residing at home and will therefore not be counted as migrants. 14 2000/01 was decided upon since the vast majority of censuses from the latest round refer to these dates. 15 These include the Organisation for Economic Development, the Migration Policy Institute, the Economic Commission for Latin America and the Caribbean, the Department for International Development, the International Labour Organisation, and the United Nations, together with various national statistics bureaus. 16 In addition to the 226*226 matrices, data aggregated up into the 87 GTAP regions, which corresponds to the GTAP database version 6, may be obtained from the authors. This aggregation will likely smooth over some of the inaccuracies contained in our more heavily interpolated matrices.
15
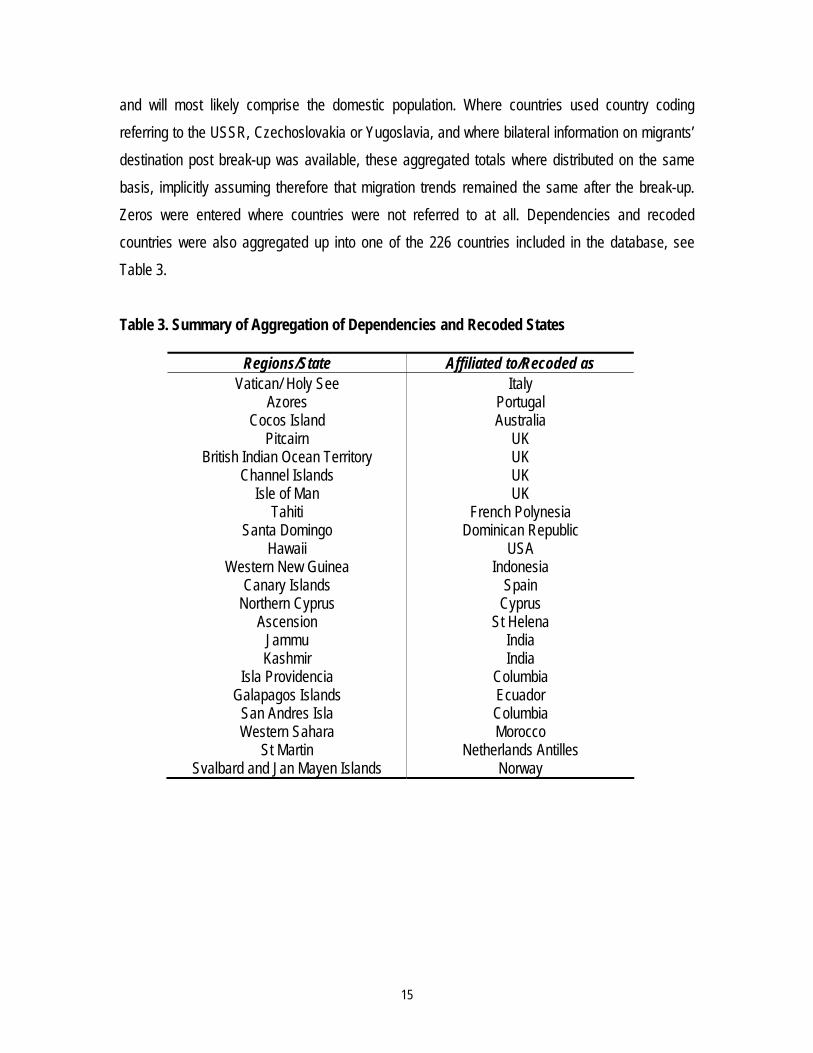
and will most likely comprise the domestic population. Where countries used country coding referring to the USSR, Czechoslovakia or Yugoslavia, and where bilateral information on migrants’ destination post break-up was available, these aggregated totals where distributed on the same basis, implicitly assuming therefore that migration trends remained the same after the break-up. Zeros were entered where countries were not referred to at all. Dependencies and recoded countries were also aggregated up into one of the 226 countries included in the database, see Table 3. Table 3. Summary of Aggregation of Dependencies and Recoded States
Regions/State Affiliated to/Recoded as Vatican/ Holy See Italy
Azores Portugal Cocos Island Australia
Pitcairn UK British Indian Ocean Territory UK
Channel Islands UK Isle of Man UK
Tahiti French Polynesia Santa Domingo Dominican Republic
Hawaii USA Western New Guinea Indonesia
Canary Islands Spain Northern Cyprus Cyprus
Ascension St Helena Jammu India Kashmir India
Isla Providencia Columbia Galapagos Islands Ecuador
San Andres Isla Columbia Western Sahara Morocco
St Martin Netherlands Antilles Svalbard and Jan Mayen Islands Norway
16
Version 2
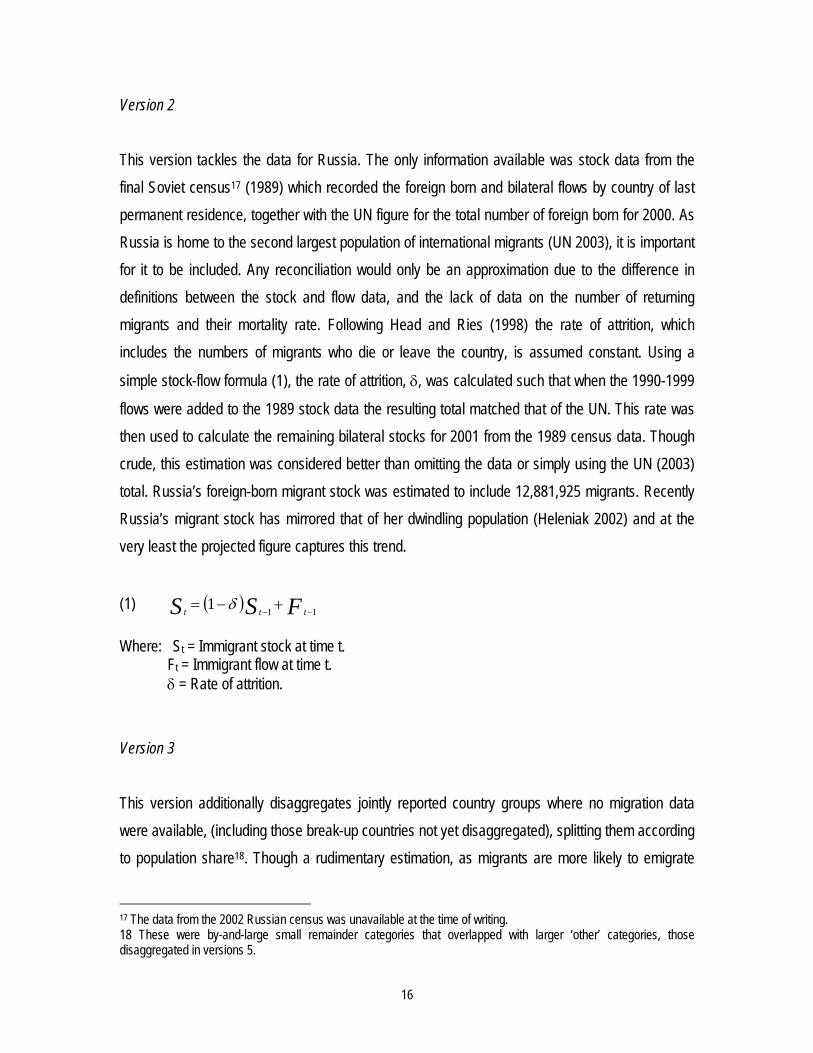
This version tackles the data for Russia. The only information available was stock data from the final Soviet census17 (1989) which recorded the foreign born and bilateral flows by country of last permanent residence, together with the UN figure for the total number of foreign born for 2000. As Russia is home to the second largest population of international migrants (UN 2003), it is important for it to be included. Any reconciliation would only be an approximation due to the difference in definitions between the stock and flow data, and the lack of data on the number of returning migrants and their mortality rate. Following Head and Ries (1998) the rate of attrition, which includes the numbers of migrants who die or leave the country, is assumed constant. Using a
simple stock-flow formula (1), the rate of attrition, δ, was calculated such that when the 1990-1999
flows were added to the 1989 stock data the resulting total matched that of the UN. This rate was then used to calculate the remaining bilateral stocks for 2001 from the 1989 census data. Though crude, this estimation was considered better than omitting the data or simply using the UN (2003) total. Russia’s foreign-born migrant stock was estimated to include 12,881,925 migrants. Recently Russia’s migrant stock has mirrored that of her dwindling population (Heleniak 2002) and at the very least the projected figure captures this trend.
(1) ( ) FSS ttt 111
−−+−= δ
Where: St = Immigrant stock at time t. Ft = Immigrant flow at time t. δ = Rate of attrition. Version 3
This version additionally disaggregates jointly reported country groups where no migration data were available, (including those break-up countries not yet disaggregated), splitting them according to population share18. Though a rudimentary estimation, as migrants are more likely to emigrate
17 The data from the 2002 Russian census was unavailable at the time of writing. 18 These were by-and-large small remainder categories that overlapped with larger ‘other’ categories, those disaggregated in versions 5.
17
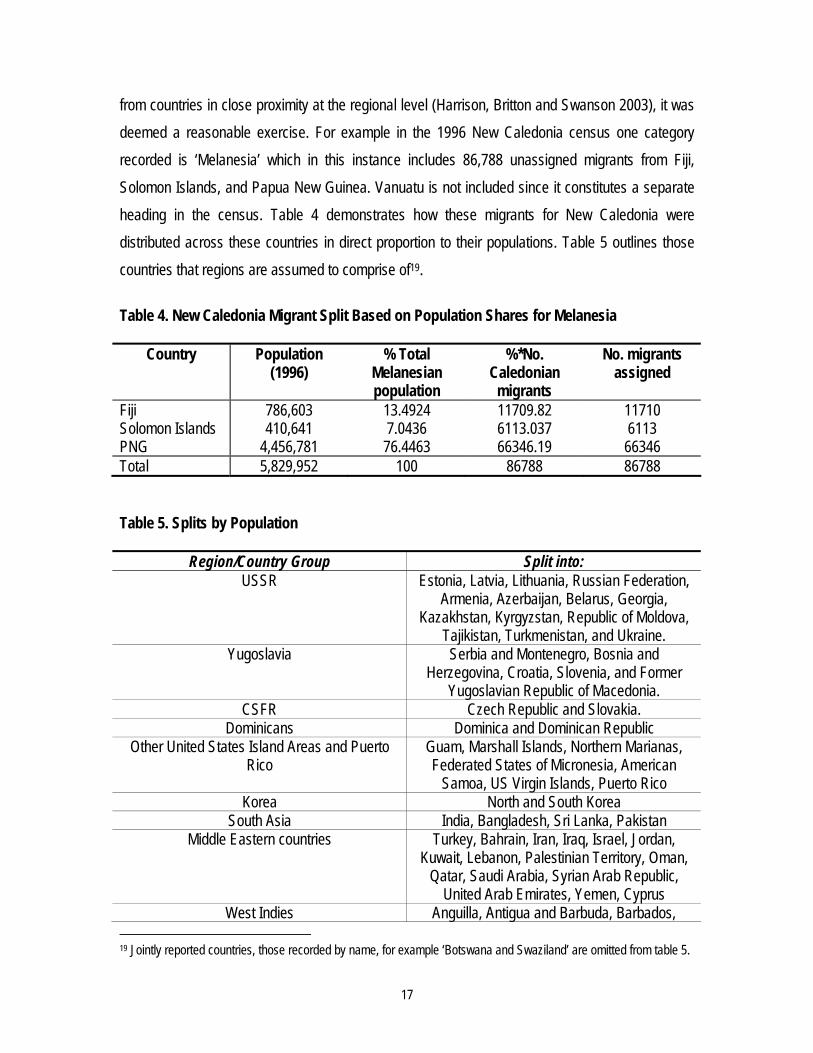
from countries in close proximity at the regional level (Harrison, Britton and Swanson 2003), it was deemed a reasonable exercise. For example in the 1996 New Caledonia census one category recorded is ‘Melanesia’ which in this instance includes 86,788 unassigned migrants from Fiji, Solomon Islands, and Papua New Guinea. Vanuatu is not included since it constitutes a separate heading in the census. Table 4 demonstrates how these migrants for New Caledonia were distributed across these countries in direct proportion to their populations. Table 5 outlines those countries that regions are assumed to comprise of19. Table 4. New Caledonia Migrant Split Based on Population Shares for Melanesia
Country Population (1996)
% Total Melanesian population
%*No. Caledonian
migrants
No. migrants assigned
Fiji 786,603 13.4924 11709.82 11710 Solomon Islands 410,641 7.0436 6113.037 6113 PNG 4,456,781 76.4463 66346.19 66346 Total 5,829,952 100 86788 86788 Table 5. Splits by Population
Region/Country Group Split into: USSR Estonia, Latvia, Lithuania, Russian Federation,
Armenia, Azerbaijan, Belarus, Georgia, Kazakhstan, Kyrgyzstan, Republic of Moldova,
Tajikistan, Turkmenistan, and Ukraine. Yugoslavia Serbia and Montenegro, Bosnia and
Herzegovina, Croatia, Slovenia, and Former Yugoslavian Republic of Macedonia.
CSFR Czech Republic and Slovakia. Dominicans Dominica and Dominican Republic
Other United States Island Areas and Puerto Rico
Guam, Marshall Islands, Northern Marianas, Federated States of Micronesia, American
Samoa, US Virgin Islands, Puerto Rico Korea North and South Korea
South Asia India, Bangladesh, Sri Lanka, Pakistan Middle Eastern countries Turkey, Bahrain, Iran, Iraq, Israel, Jordan,
Kuwait, Lebanon, Palestinian Territory, Oman, Qatar, Saudi Arabia, Syrian Arab Republic,
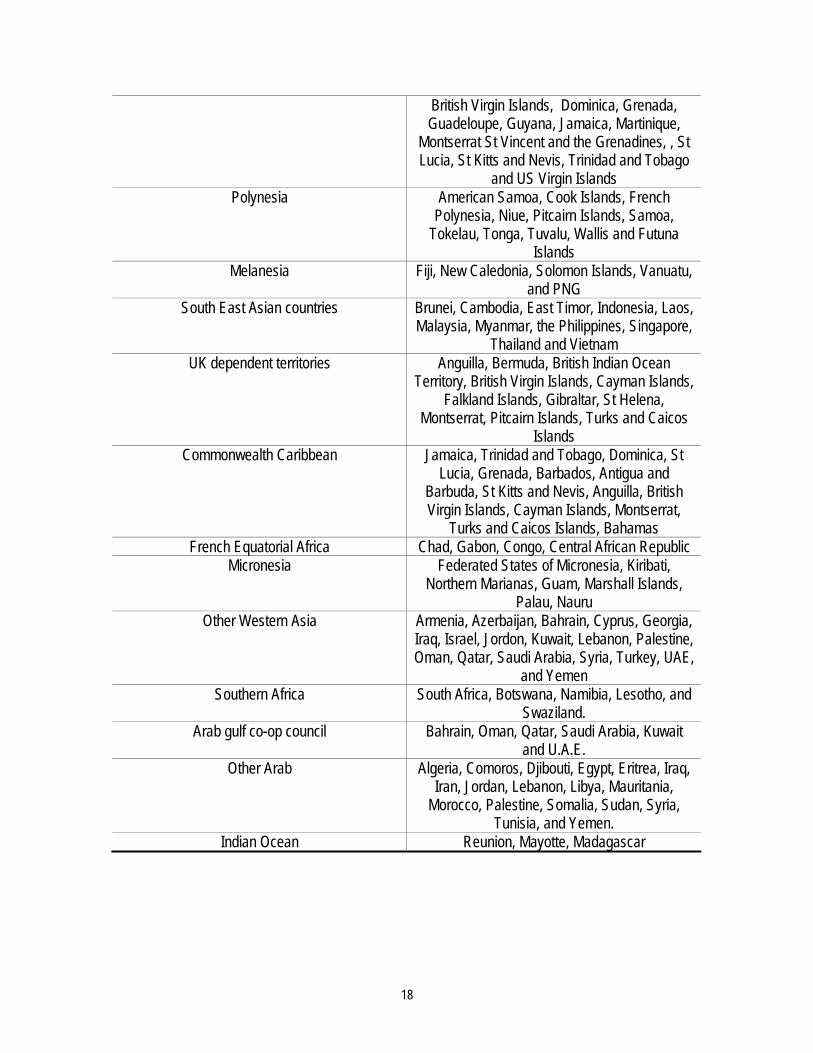
United Arab Emirates, Yemen, Cyprus West Indies Anguilla, Antigua and Barbuda, Barbados,
19 Jointly reported countries, those recorded by name, for example ‘Botswana and Swaziland’ are omitted from table 5.
18
British Virgin Islands, Dominica, Grenada, Guadeloupe, Guyana, Jamaica, Martinique,
Montserrat St Vincent and the Grenadines, , St Lucia, St Kitts and Nevis, Trinidad and Tobago
and US Virgin Islands Polynesia American Samoa, Cook Islands, French
Polynesia, Niue, Pitcairn Islands, Samoa, Tokelau, Tonga, Tuvalu, Wallis and Futuna
Islands Melanesia Fiji, New Caledonia, Solomon Islands, Vanuatu,
and PNG South East Asian countries Brunei, Cambodia, East Timor, Indonesia, Laos,
Malaysia, Myanmar, the Philippines, Singapore, Thailand and Vietnam
UK dependent territories Anguilla, Bermuda, British Indian Ocean Territory, British Virgin Islands, Cayman Islands,
Falkland Islands, Gibraltar, St Helena, Montserrat, Pitcairn Islands, Turks and Caicos
Islands Commonwealth Caribbean Jamaica, Trinidad and Tobago, Dominica, St
Lucia, Grenada, Barbados, Antigua and Barbuda, St Kitts and Nevis, Anguilla, British Virgin Islands, Cayman Islands, Montserrat,
Turks and Caicos Islands, Bahamas French Equatorial Africa Chad, Gabon, Congo, Central African Republic
Micronesia Federated States of Micronesia, Kiribati, Northern Marianas, Guam, Marshall Islands,
Palau, Nauru Other Western Asia Armenia, Azerbaijan, Bahrain, Cyprus, Georgia,
Iraq, Israel, Jordon, Kuwait, Lebanon, Palestine, Oman, Qatar, Saudi Arabia, Syria, Turkey, UAE,
and Yemen Southern Africa South Africa, Botswana, Namibia, Lesotho, and
Swaziland. Arab gulf co-op council Bahrain, Oman, Qatar, Saudi Arabia, Kuwait
and U.A.E. Other Arab Algeria, Comoros, Djibouti, Egypt, Eritrea, Iraq,
Iran, Jordan, Lebanon, Libya, Mauritania, Morocco, Palestine, Somalia, Sudan, Syria,
Tunisia, and Yemen. Indian Ocean Reunion, Mayotte, Madagascar
19
Version 4 This version removes nationality headings which implement ethnic background to distinguish migrants, for example ‘Crimean Tatars’. These categories proved difficult to assign geographically, and as they most likely refer to the domestic population, were removed entirely from the dataset, and their numbers subtracted from the country totals. These had previously been included to facilitate research on ethnicity. Other headings referring to totals largely incorporating nationals were likewise removed. This included those persons who possess dual nationality and ambiguous ‘ignored’ totals. Additionally Srivastava (2003) was drawn upon to supplement the database with information on the estimated number of migrants from India in the Middle East. Version 5, the fullest, though arguably the least accurate set of data, supplements the foreign born matrix with further coefficients derived from the additional information content in the nationality matrix, augments the foreign born matrix with the UN (2003) totals where no other data were available, and reconciles all of the remainder categories -- all before scaling all the older data, that were recorded before 2000 to UN (2003). As each of these steps represents a large adjustment Version 5 is split up (5a-5c). Taking the decision to produce a single matrix utilising the foreign-born definition was based on the fact that a greater number of countries report data by place of birth, and additionally because this definition is theoretically superior in terms of assessing actual movements of migrants. Version 5a
The UN (2003) data set, covering migrant stocks for the year 2000, is generally considered the most comparable source on international migrant stocks, despite some of the data being extrapolated from older sources. Indeed it is still held in high esteem even though, where no foreign born data are available, numbers are interpolated from data based on nationality and ethnicity concepts. However the data presented here should on the whole be more up-to-date since a greater proportion of the latest round of censuses is drawn upon. Where no other data were available it was deemed sensible to use the UN data for country totals.
20
A high degree of correlation has been previously understood to exist between the foreign born and the foreign population as measured by nationality ((Harrison, Britton and Swanson 2003). If this is indeed the case then it would be feasible to use the additional information content of the nationality matrix to supplement that of the foreign born. First it was important to check this association existed in relation to the data collected. This was done by examining those 3520 countries where data were available for both the foreign born and the foreign population. A technique, based on the entropy measure devised by Walmsley and McDougal (2004), was used to compare the foreign born and nationality shares to ensure this association existed in our data (see Annex 2). This methodology calculates the differences in the shares between the foreign-born matrix and the nationality matrix as the equally weighted average of the simple share from a particular coefficient in the foreign-born matrix multiplied by the natural log of the ratio of that share, to the equivalent share in nationality matrix. The two major advantages of this technique are, firstly, that it is possible to compare shares between two tables whilst ignoring any zero entries; and that secondly, the differences between two large shares are given less weight than the same absolute difference in two relatively smaller shares. On average, the entropy difference between shares for the 35 countries for which data were available for both the foreign-born and of foreign nationality was negligible. Having found that the series were indeed highly correlated, the shares from the nationality matrix were multiplied by the UN totals in the foreign-born matrix for those countries where no bilateral information was available. South East and East Asian21 countries with detailed bilateral data were not subjected to this treatment, as naturalisations are so rare that it is fair to assume that these data may be directly equated to the foreign-born population. We calculated the magnitude of the margin of error of treating foreign nationals as equivalent to the foreign born22 to be approximately 1.22 percent for Japan, and 0.15 percent for South Korea. The foreign-born coefficients for those 58 countries, which until now had only nationality data (there are lots of cases where FB data is
20 In fact there are 36 countries for which both nationality and country of birth data was collected but Hong Kong was dropped for the purpose of this calculation. This was due to the fact that under the foreign born definition there are over 2 million Chinese migrants resident in Hong Kong but zero under the nationality concept since the passing over of Hong Kong to China from the UK. 21 Namely Japan, Korea, Macau, the Philippines, Thailand and Myanmar. 22 These were calculated as the number of naturalisations divided by the total number of foreign nationals.

21
missing; the distinction between these and the others is that these have nationality data), were therefore filled. Version 5b
Residual categories, those labelled with the prefix ‘Other’, are common in the reported data. First we distinguish between two types of ‘other’ categories23: ‘other regions’, where ‘other’ is applied to a subset of countries such as other South America and other West Africa; and ‘All other’, which includes all other countries. As the study aims to assign every migrant to a specific country systematically, these migrants that numbered approximately 12 million and 9 million respectively under nationality and foreign-born definitions were distributed according to a countries’ propensity to send their nationals abroad (2).
(2) ∑∈
=
otherss
rr M
MP
Where: Pr = Country r’s propensity to send residents abroad.
Mr = The number of migrants abroad from country r. Ms = The number of migrants abroad from countries in s.
This propensity represents a share, and all the propensity shares sum to one. The remainder categories were therefore disaggregated by multiplying these propensity shares, for those countries contained within an umbrella remainder heading, by the total number of migrants to be redistributed. An illustrative case is that of Portugal. All migrants in the 2001 Portuguese census had been designated to specific countries with the exception of those 6 migrants falling under the heading ‘Other Oceania’. The remaining 6 migrants simply had to be shared out between the countries of Oceania. Following (2) the propensity to send migrants anywhere abroad was calculated for each of these countries. Table 6 contains these propensity shares and how many immigrants were 23 In the database we also distinguish between ’other’ and ‘other zeros’. In the case of ‘other’ we allocate data to all of the countries in the region. In ‘other zeros’ the data are only allocated to those countries in the region with zeros. For example data for ‘Other SAF’ would be allocated across Botswana, Lesotho, Namibia, South Africa and Swaziland, while data for ‘other zero SAF’ would be allocated only to these 5 countries if data were initially zero, i.e. unavailable elsewhere.

22
distributed based on these numbers for each country. This was assumed the most pragmatic method for distributing the remainder categories though three weaknesses are evident. Firstly, migrants are not distributed as integers and thus rounding is required. Secondly, the propensity to send migrants abroad is based on the sum of the relevant row (the total number of migrants abroad from any particular country). If it so happens that a specific country sends many people to a country for which no data were collected, that share would be under-estimated. Lastly, GemPackTM is only accurate to 7 significant figures, and thus very small errors are inevitable with any imputations. Table 6. Propensity Shares for ‘Other Oceania’ Split for Portugal
Country Propensity Share Share*No. Migrants to be
assigned (rounded)
Australia 0.259 2 New Zealand 0.362 2 American Samoa 0.028 0 Cook Islands 0.016 0 Fiji 0.100 1 French Polynesia 0.001 0 Guam 0.058 0 Kiribati 0.002 0 Marshall Islands 0.006 0 Federated States of Micronesia 0.013 0 Nauru 0.001 0 New Caledonia 0.001 0 Norfolk Island 0.000 0 Northern Marianas 0.005 0 Niue 0.005 0 Palau 0.004 0 Papua New Guinea 0.022 0 Samoa 0.075 1 Solomon Islands 0.002 0 Tokelau 0.002 0 Tonga 0.036 0 Tuvalu 0.001 0 Vanuatu 0.002 0 Wallis and Fortuna 0.002 0 Total 1 6
23
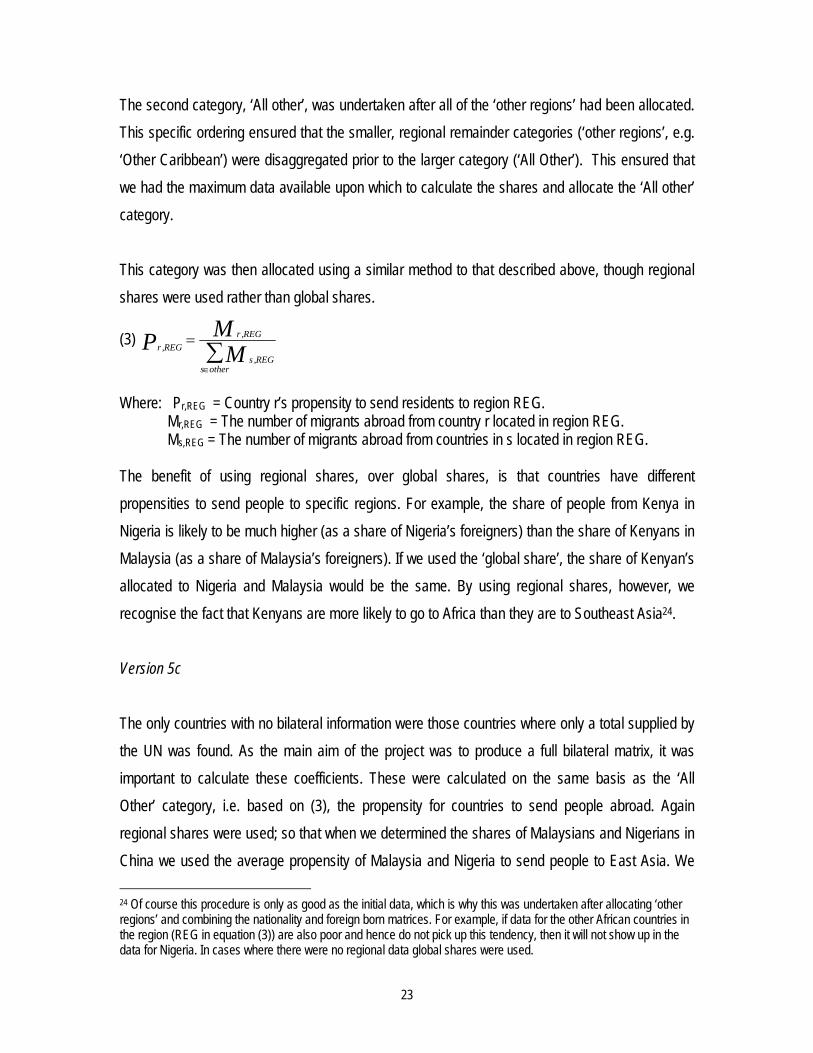
The second category, ‘All other’, was undertaken after all of the ‘other regions’ had been allocated. This specific ordering ensured that the smaller, regional remainder categories (‘other regions’, e.g. ‘Other Caribbean’) were disaggregated prior to the larger category (‘All Other’). This ensured that we had the maximum data available upon which to calculate the shares and allocate the ‘All other’ category. This category was then allocated using a similar method to that described above, though regional shares were used rather than global shares.
(3) ∑∈
=
othersREG,s
REG,rREG,r M
MP
Where: Pr,REG = Country r’s propensity to send residents to region REG.
Mr,REG = The number of migrants abroad from country r located in region REG. Ms,REG = The number of migrants abroad from countries in s located in region REG.
The benefit of using regional shares, over global shares, is that countries have different propensities to send people to specific regions. For example, the share of people from Kenya in Nigeria is likely to be much higher (as a share of Nigeria’s foreigners) than the share of Kenyans in Malaysia (as a share of Malaysia’s foreigners). If we used the ‘global share’, the share of Kenyan’s allocated to Nigeria and Malaysia would be the same. By using regional shares, however, we recognise the fact that Kenyans are more likely to go to Africa than they are to Southeast Asia24. Version 5c
The only countries with no bilateral information were those countries where only a total supplied by the UN was found. As the main aim of the project was to produce a full bilateral matrix, it was important to calculate these coefficients. These were calculated on the same basis as the ‘All Other’ category, i.e. based on (3), the propensity for countries to send people abroad. Again regional shares were used; so that when we determined the shares of Malaysians and Nigerians in China we used the average propensity of Malaysia and Nigeria to send people to East Asia. We 24 Of course this procedure is only as good as the initial data, which is why this was undertaken after allocating ‘other regions’ and combining the nationality and foreign born matrices. For example, if data for the other African countries in the region (REG in equation (3)) are also poor and hence do not pick up this tendency, then it will not show up in the data for Nigeria. In cases where there were no regional data global shares were used.
24
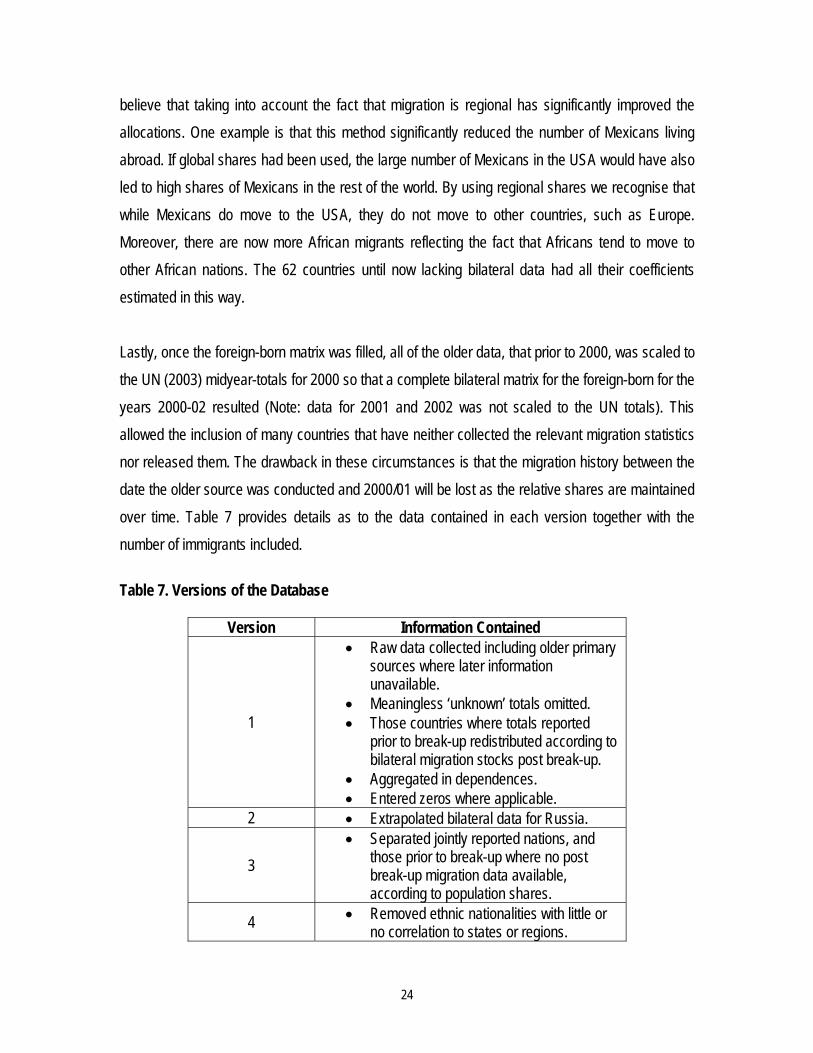
believe that taking into account the fact that migration is regional has significantly improved the allocations. One example is that this method significantly reduced the number of Mexicans living abroad. If global shares had been used, the large number of Mexicans in the USA would have also led to high shares of Mexicans in the rest of the world. By using regional shares we recognise that while Mexicans do move to the USA, they do not move to other countries, such as Europe. Moreover, there are now more African migrants reflecting the fact that Africans tend to move to other African nations. The 62 countries until now lacking bilateral data had all their coefficients estimated in this way. Lastly, once the foreign-born matrix was filled, all of the older data, that prior to 2000, was scaled to the UN (2003) midyear-totals for 2000 so that a complete bilateral matrix for the foreign-born for the years 2000-02 resulted (Note: data for 2001 and 2002 was not scaled to the UN totals). This allowed the inclusion of many countries that have neither collected the relevant migration statistics nor released them. The drawback in these circumstances is that the migration history between the date the older source was conducted and 2000/01 will be lost as the relative shares are maintained over time. Table 7 provides details as to the data contained in each version together with the number of immigrants included. Table 7. Versions of the Database
Version Information Contained
1
• Raw data collected including older primary sources where later information unavailable.
• Meaningless ‘unknown’ totals omitted. • Those countries where totals reported
prior to break-up redistributed according to bilateral migration stocks post break-up.
• Aggregated in dependences. • Entered zeros where applicable.
2 • Extrapolated bilateral data for Russia.
3 • Separated jointly reported nations, and
those prior to break-up where no post break-up migration data available, according to population shares.
4 • Removed ethnic nationalities with little or no correlation to states or regions.
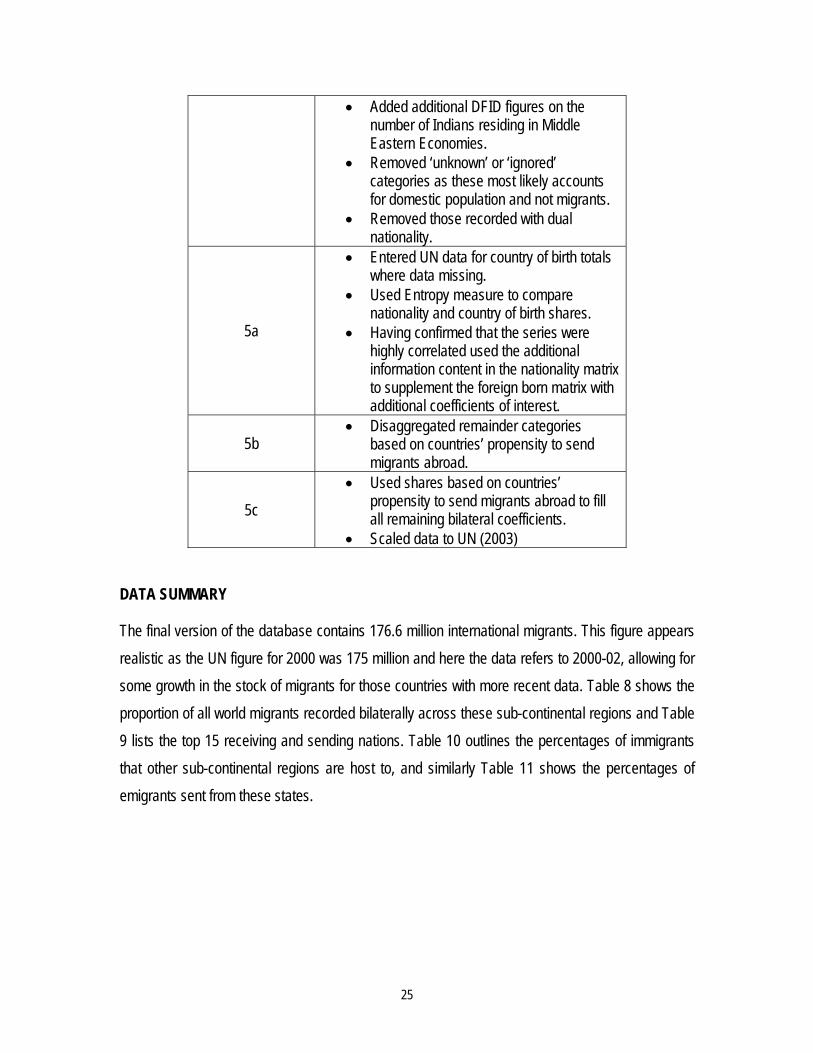
25
• Added additional DFID figures on the number of Indians residing in Middle Eastern Economies.
• Removed ‘unknown’ or ‘ignored’ categories as these most likely accounts for domestic population and not migrants.
• Removed those recorded with dual nationality.
5a
• Entered UN data for country of birth totals where data missing.
• Used Entropy measure to compare nationality and country of birth shares.
• Having confirmed that the series were highly correlated used the additional information content in the nationality matrix to supplement the foreign born matrix with additional coefficients of interest.
5b • Disaggregated remainder categories
based on countries’ propensity to send migrants abroad.
5c • Used shares based on countries’
propensity to send migrants abroad to fill all remaining bilateral coefficients.
• Scaled data to UN (2003)
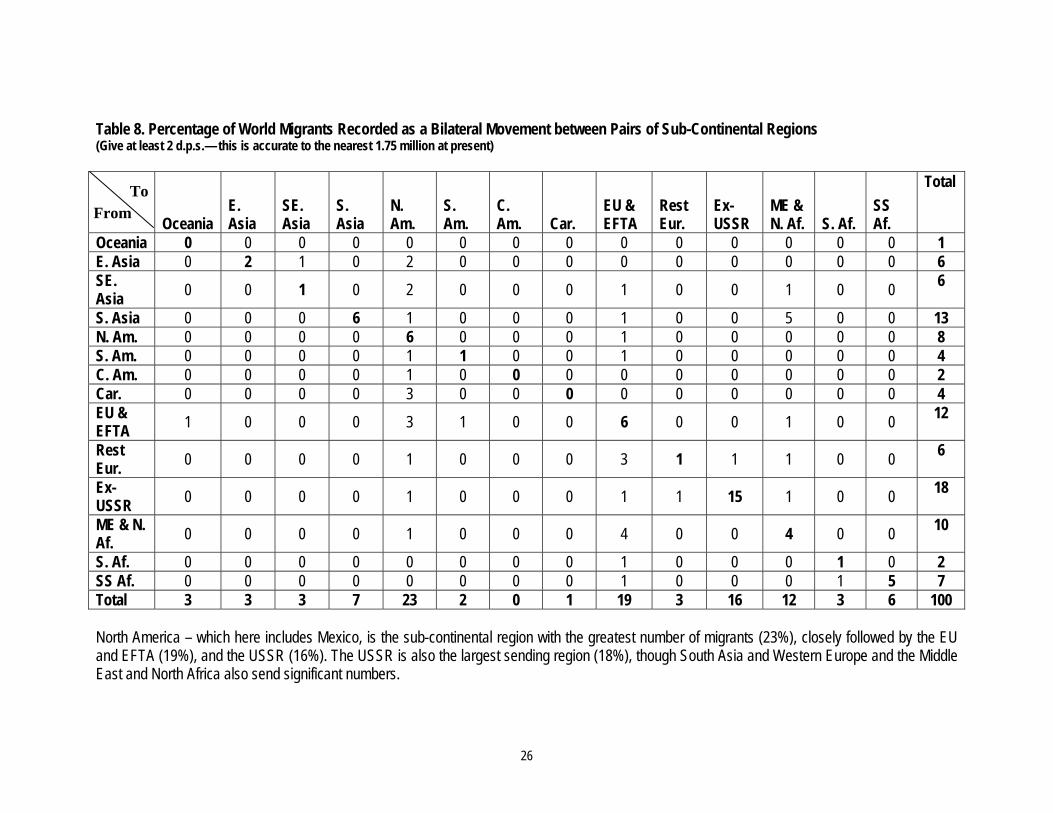
DATA SUMMARY The final version of the database contains 176.6 million international migrants. This figure appears realistic as the UN figure for 2000 was 175 million and here the data refers to 2000-02, allowing for some growth in the stock of migrants for those countries with more recent data. Table 8 shows the proportion of all world migrants recorded bilaterally across these sub-continental regions and Table 9 lists the top 15 receiving and sending nations. Table 10 outlines the percentages of immigrants that other sub-continental regions are host to, and similarly Table 11 shows the percentages of emigrants sent from these states.
26
Table 8. Percentage of World Migrants Recorded as a Bilateral Movement between Pairs of Sub-Continental Regions (Give at least 2 d.p.s.— this is accurate to the nearest 1.75 million at present)
Oceania
E. Asia
SE. Asia
S. Asia
N. Am.
S. Am.
C. Am. Car.
EU & EFTA
Rest Eur.
Ex-USSR
ME & N. Af. S. Af.
SS Af.
Total
Oceania 0 0 0 0 0 0 0 0 0 0 0 0 0 0 1 E. Asia 0 2 1 0 2 0 0 0 0 0 0 0 0 0 6 SE. Asia 0 0 1 0 2 0 0 0 1 0 0 1 0 0 6
S. Asia 0 0 0 6 1 0 0 0 1 0 0 5 0 0 13 N. Am. 0 0 0 0 6 0 0 0 1 0 0 0 0 0 8 S. Am. 0 0 0 0 1 1 0 0 1 0 0 0 0 0 4 C. Am. 0 0 0 0 1 0 0 0 0 0 0 0 0 0 2 Car. 0 0 0 0 3 0 0 0 0 0 0 0 0 0 4 EU & EFTA 1 0 0 0 3 1 0 0 6 0 0 1 0 0 12
Rest Eur. 0 0 0 0 1 0 0 0 3 1 1 1 0 0 6
Ex-USSR 0 0 0 0 1 0 0 0 1 1 15 1 0 0 18
ME & N. Af. 0 0 0 0 1 0 0 0 4 0 0 4 0 0 10
S. Af. 0 0 0 0 0 0 0 0 1 0 0 0 1 0 2 SS Af. 0 0 0 0 0 0 0 0 1 0 0 0 1 5 7 Total 3 3 3 7 23 2 0 1 19 3 16 12 3 6 100 North America – which here includes Mexico, is the sub-continental region with the greatest number of migrants (23%), closely followed by the EU and EFTA (19%), and the USSR (16%). The USSR is also the largest sending region (18%), though South Asia and Western Europe and the Middle East and North Africa also send significant numbers.
From To
27
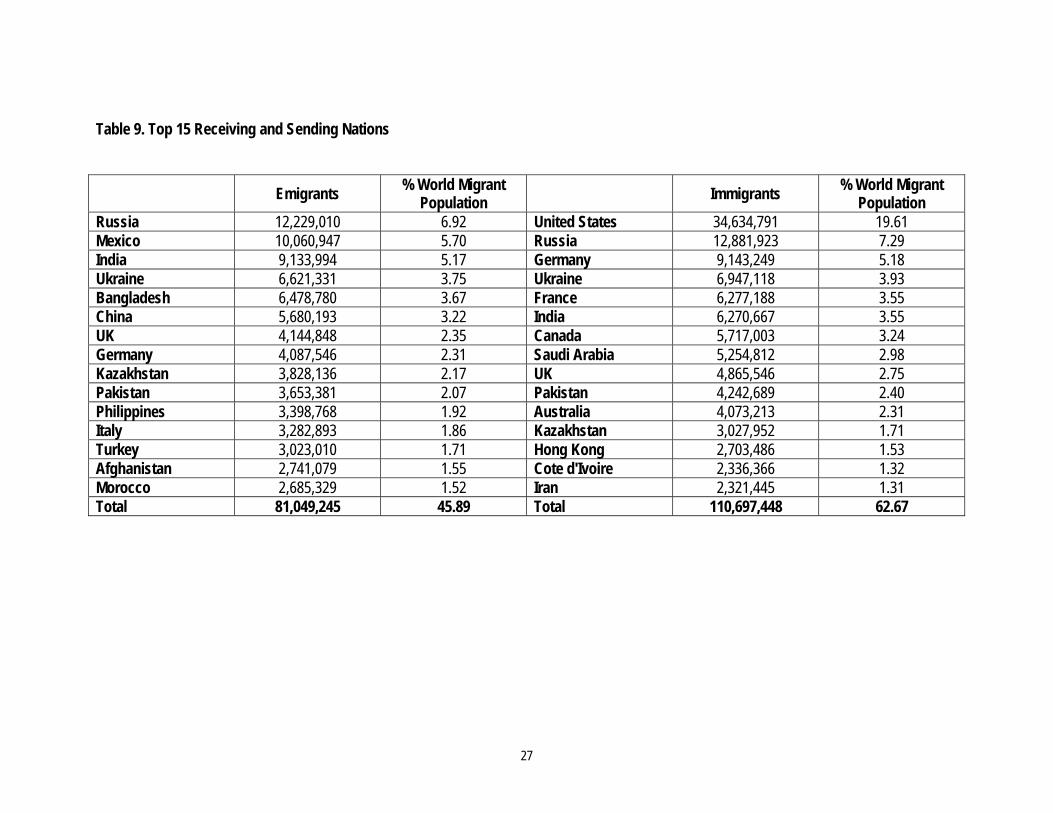
Table 9. Top 15 Receiving and Sending Nations
Emigrants % World Migrant Population Immigrants % World Migrant
Population Russia 12,229,010 6.92 United States 34,634,791 19.61 Mexico 10,060,947 5.70 Russia 12,881,923 7.29 India 9,133,994 5.17 Germany 9,143,249 5.18 Ukraine 6,621,331 3.75 Ukraine 6,947,118 3.93 Bangladesh 6,478,780 3.67 France 6,277,188 3.55 China 5,680,193 3.22 India 6,270,667 3.55 UK 4,144,848 2.35 Canada 5,717,003 3.24 Germany 4,087,546 2.31 Saudi Arabia 5,254,812 2.98 Kazakhstan 3,828,136 2.17 UK 4,865,546 2.75 Pakistan 3,653,381 2.07 Pakistan 4,242,689 2.40 Philippines 3,398,768 1.92 Australia 4,073,213 2.31 Italy 3,282,893 1.86 Kazakhstan 3,027,952 1.71 Turkey 3,023,010 1.71 Hong Kong 2,703,486 1.53 Afghanistan 2,741,079 1.55 Cote d'Ivoire 2,336,366 1.32 Morocco 2,685,329 1.52 Iran 2,321,445 1.31 Total 81,049,245 45.89 Total 110,697,448 62.67
28
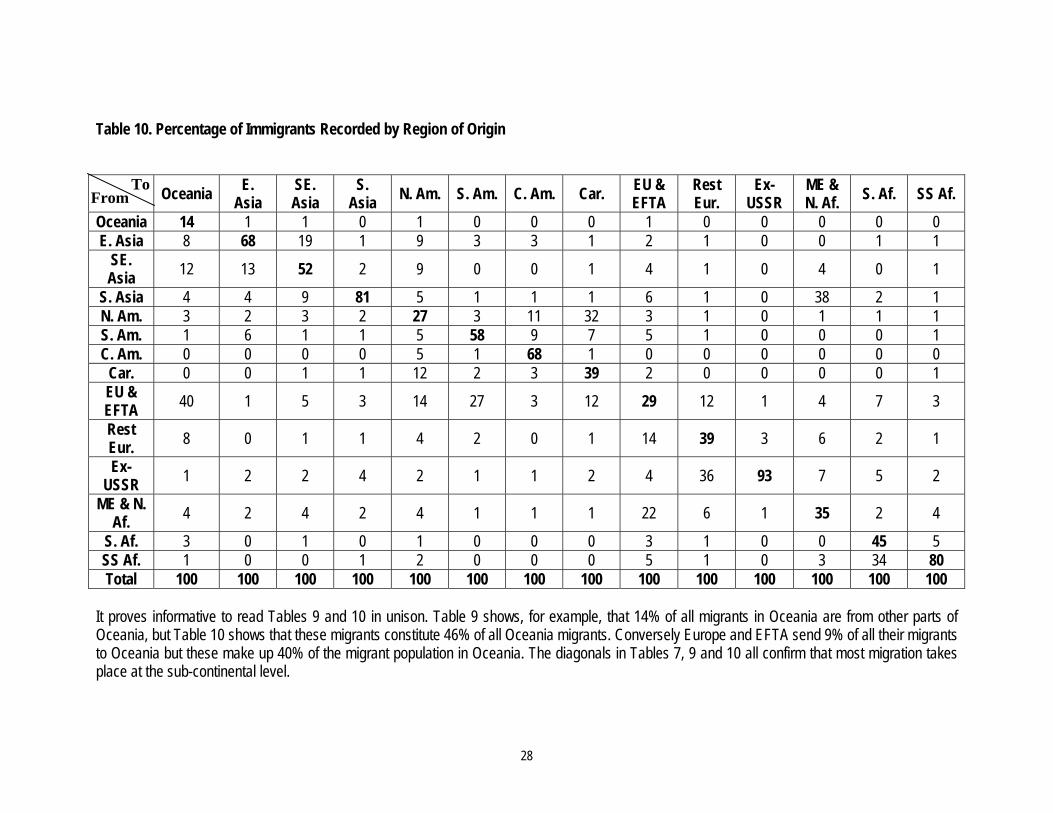
Table 10. Percentage of Immigrants Recorded by Region of Origin Oceania E.
Asia SE. Asia
S. Asia N. Am. S. Am. C. Am. Car. EU &
EFTA Rest Eur.
Ex-USSR
ME & N. Af. S. Af. SS Af.
Oceania 14 1 1 0 1 0 0 0 1 0 0 0 0 0 E. Asia 8 68 19 1 9 3 3 1 2 1 0 0 1 1
SE. Asia 12 13 52 2 9 0 0 1 4 1 0 4 0 1
S. Asia 4 4 9 81 5 1 1 1 6 1 0 38 2 1 N. Am. 3 2 3 2 27 3 11 32 3 1 0 1 1 1 S. Am. 1 6 1 1 5 58 9 7 5 1 0 0 0 1 C. Am. 0 0 0 0 5 1 68 1 0 0 0 0 0 0
Car. 0 0 1 1 12 2 3 39 2 0 0 0 0 1 EU & EFTA 40 1 5 3 14 27 3 12 29 12 1 4 7 3
Rest Eur. 8 0 1 1 4 2 0 1 14 39 3 6 2 1
Ex-USSR 1 2 2 4 2 1 1 2 4 36 93 7 5 2
ME & N. Af. 4 2 4 2 4 1 1 1 22 6 1 35 2 4
S. Af. 3 0 1 0 1 0 0 0 3 1 0 0 45 5 SS Af. 1 0 0 1 2 0 0 0 5 1 0 3 34 80 Total 100 100 100 100 100 100 100 100 100 100 100 100 100 100
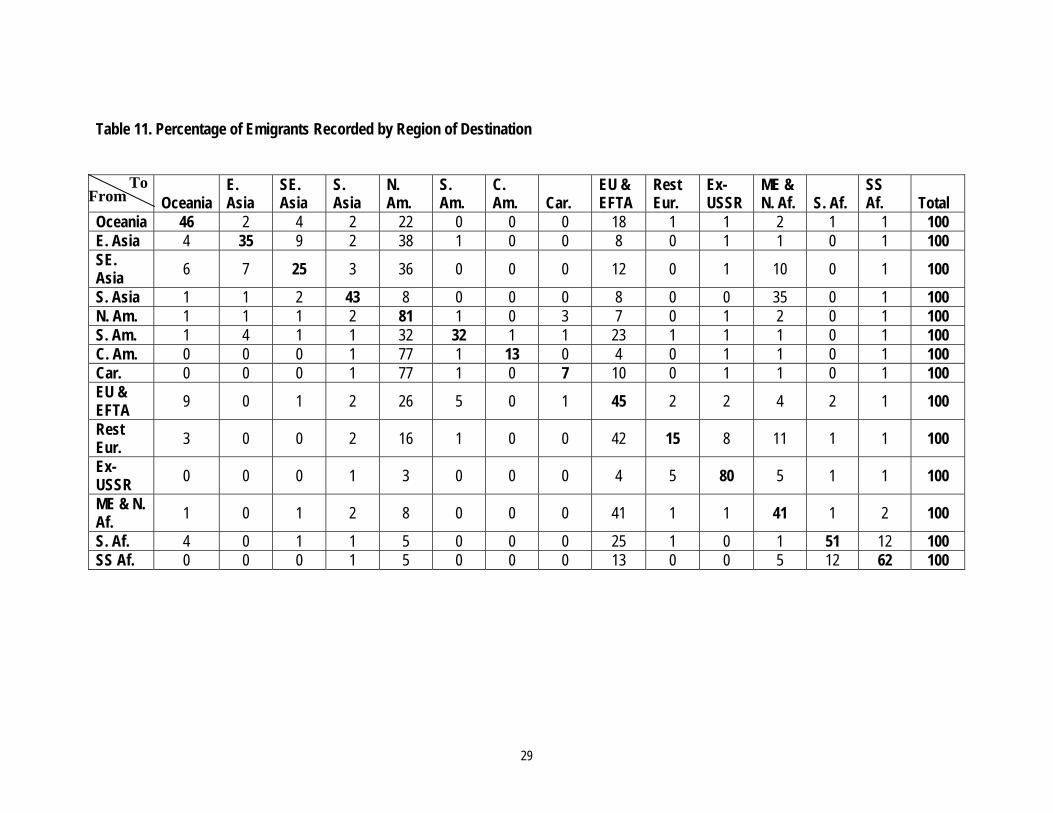
It proves informative to read Tables 9 and 10 in unison. Table 9 shows, for example, that 14% of all migrants in Oceania are from other parts of Oceania, but Table 10 shows that these migrants constitute 46% of all Oceania migrants. Conversely Europe and EFTA send 9% of all their migrants to Oceania but these make up 40% of the migrant population in Oceania. The diagonals in Tables 7, 9 and 10 all confirm that most migration takes place at the sub-continental level.
To From
29
Table 11. Percentage of Emigrants Recorded by Region of Destination
Oceania E. Asia
SE. Asia
S. Asia
N. Am.
S. Am.
C. Am. Car.
EU & EFTA
Rest Eur.
Ex-USSR
ME & N. Af. S. Af.
SS Af. Total
Oceania 46 2 4 2 22 0 0 0 18 1 1 2 1 1 100 E. Asia 4 35 9 2 38 1 0 0 8 0 1 1 0 1 100 SE. Asia 6 7 25 3 36 0 0 0 12 0 1 10 0 1 100 S. Asia 1 1 2 43 8 0 0 0 8 0 0 35 0 1 100 N. Am. 1 1 1 2 81 1 0 3 7 0 1 2 0 1 100 S. Am. 1 4 1 1 32 32 1 1 23 1 1 1 0 1 100 C. Am. 0 0 0 1 77 1 13 0 4 0 1 1 0 1 100 Car. 0 0 0 1 77 1 0 7 10 0 1 1 0 1 100 EU & EFTA 9 0 1 2 26 5 0 1 45 2 2 4 2 1 100 Rest Eur. 3 0 0 2 16 1 0 0 42 15 8 11 1 1 100 Ex-USSR 0 0 0 1 3 0 0 0 4 5 80 5 1 1 100 ME & N. Af. 1 0 1 2 8 0 0 0 41 1 1 41 1 2 100 S. Af. 4 0 1 1 5 0 0 0 25 1 0 1 51 12 100 SS Af. 0 0 0 1 5 0 0 0 13 0 0 5 12 62 100
To From
30
To even undertake an exercise such as was attempted in this paper could be considered foolhardy by experts from many disciplines outside economics. Indeed such an exercise epitomises the silent debate that rages between economists and other social scientists concerning the very methods of economics itself -- between the simplification of the real world, and a pragmatic stance in an attempt to quantify it on the one hand, and the accuracy and the need for qualitative evidence on the other. In spite of the inherent errors due to a lack of bilateral data for some countries, the assumptions made and the methodologies used, the database should provide a realistic overview of current migration trends in terms of the overall magnitude of migrant stocks and regional migration patterns. Under current data dissemination, and considering the heterogeneity that exists between the available sources, any undertaking on the subject will inevitably be incomplete. Having highlighted the problems encountered, researchers should be able to build upon the data as they see fit and thus the database should provide a solid platform for future work. One key area of concern is the distribution of migrants based on the propensity to send migrants abroad. A gravity-type equation would be superior for this disaggregation but ideally requires additional data on visa requirements and policy, which were unavailable at the time of writing. Despite these shortcomings the data provided here, though not entirely accurate, should prove valuable in a wide range of applications throughout the social sciences. International migration increasingly represents an important issue on the agendas of both developed and developing nations alike, and the information supplied here should facilitate both the superior modelling of global migration trends and a more informed policy debate.
31
ANNEX 1
Table 12. Sources and Years for Raw Data Collated
Country Data Type Nationality or Birth
Source Year
Australia B B C 2001 New Zealand B B C 2001 American Samoa B B C 2000 Cook Islands B N C 2001 Fiji B B C 1986 French Polynesia B/B B/N C/C 2002/2002 Guam B B C 2000 Kiribati B E C 2000 Marshall Islands B N C 1999 Micronesia, Federated States of
B B C 2000
Nauru UN N U 2000 New Caledonia B N C 1996 Norfolk Island B/B B/N C/C 2001/2001 Northern Mariana Islands
B B C 2000
Niue B N C 2001 Palau B B C 2000 Papua New Guinea B B C 1971 Samoa B B C 2001 Solomon Islands T N C 1999 Tokelau B E C 1996 Tonga B E C 1996 Tuvalu T N C 2002 Vanuatu B N C 1986 Wallis and Futuna T B C 1996 China UN E U 2000 Hong Kong B/B B/N C/C 2001/2001 Japan B N C 2000 Korea, Republic of B N C 2000 Taiwan B N S 2000 Macau B/B B/O C/S 1991/2001 Mongolia UN N U 2000 Korea, Democratic People’s Republic of
UN E U 2000
Indonesia UN N U 2000 Malaysia B B C 1991
32
Country Data Type Nationality or Birth
Source Year
Philippines B N C 2000 Singapore B B C 2000 Thailand B N S 2000 Viet Nam T N C 1999 Brunei Darussalam B B C 1981 Cambodia B N C 1998 Lao People’s Democratic Republic
B N C 1995
Myanmar B N S 2000 Timor Leste UN E U 2000 Bangladesh B B C 1974 India B B C 1991 Sri Lanka B N C 1981 Afghanistan UN E U 2000 Bhutan UN N U 2000 Maldives UN N U 2000 Nepal B/B B/N C/C 2001/2001 Pakistan T B C 1998 Canada B B C 2001 United States of America
B B C 2000
Mexico B B C 2000 Bermuda B B C 2000 Greenland UN B U 2000 Saint Pierre and Miquelon
B B C 1962
Colombia B B C 1993 Peru B B C 1993 Venezuela B B C 1990 Bolivia B B C 2001 Ecuador B B C 1990 Argentina B B C 2001 Brazil B/T B/N C/C 1991/2000 Chile B B C 2002 Uruguay B B C 1996 Falkland Islands (Malvinas)
B/B B/N C/C 2001/2001
French Guiana B N C 1990 Guyana B B C 1960 Paraguay B B C 2002 Suriname UN N U 2000 Belize B B C 2000

33
Country Data Type Nationality or Birth
Source Year
Costa Rica B/B B/N C/C 2002/2002 El Salvador B B C 1990 Guatemala B B C 1994 Honduras B B C 2001 Nicaragua B B C 1995 Panama B O C 2000 Antigua & Barbuda UN B U 2000 Bahamas UN B U 2000 Barbados B B C 1980-81 Dominica B B C 1981 Dominican Republic
B B C 2002
Grenada UN B U 2000 Haiti B B C 1971 Jamaica B B C 1960 Puerto Rico T B C 2000 Saint Kitts and Nevis
UN B U 2000
Saint Lucia B B C 1980 Saint Vincent and the Grenadines
B B C 1991
Trinidad and Tobago
B B C 2000
Virgin Islands, U.S. B B C 2000 Anguilla B N C 2001 Aruba B N C 2000 Cayman Islands T N S 1997 Cuba B B C 1970 Guadeloupe B N C 1990 Martinique B N C 1990 Montserrat UN B U 2000 Netherlands Antilles
B/B B/N C/C 2001/2001
Turks and Caicos B B C 1990 Virgin Islands, British
B B C 1980-81
Austria B/B B/N C/C 2001/2001 Belgium B/B B/N O/S 2001/2000 Denmark B/B B/N P/S 2001/2001 Finland B/B B/N P/P 2001/2002 France B/B B/N C/C 1999/1999 Germany B/B B/N C/S 2001/2001 United Kingdom B B C 2001
34
Country Data Type Nationality or Birth
Source Year
Greece B/B B/N C/C 2001/2001 Ireland B/B B/N C/C 2002/2002 Italy B N S 2000 Luxembourg B/B B/N C/C 2001/2001 Netherlands B/B B/N P/P 2001/2001 Portugal B/B B/N C/C 2001/2001 Spain B/B B/N C/C 2001/2001 Sweden B/B B/N P/P 2001/2001 Switzerland B/B B/N C/P 2000/2000 Iceland B/B B/N P/P 2001/2001 Liechtenstein B B S 2000 Norway B/B B/N P/P 2001/2001 Andorra B N S 2002 Bosnia and Herzegovina
B E C 1991
Faeroe Islands UN B U 2000 Gibraltar B/B B/N C/C 2001/2001 Macedonia, the former Yugoslav Republic of
B N C 1994
Monaco UN B U 2000 San Marino UN B U 2000 Serbia and Montenegro
UN B U 2000
Albania T B C 2001 Bulgaria B N C 2001 Croatia B/B B/E C/S 2001/2001 Cyprus B B C 2002 Czech Republic B/B B/N C/R 2001/2000 Hungary B/B B/N C/S 2001/2001 Malta B/B B/N C/C 1995/1995 Poland B B C 2001 Romania B E C 2002 Slovakia B/B B/E C/S 2001/2001 Slovenia B N C 2001 Estonia B/B B/N C/C 2001/2001 Latvia B N S 2001 Lithuania B/B B/N C/C 2001/2001 Russian Federation B B C 1989 Armenia B/T B/N C/S 2001/2001 Azerbaijan B N S 2001 Belarus B E S 1999 Georgia B B C 2002
35
Country Data Type Nationality or Birth
Source Year
Kazakhstan B E S 1999 Kyrgyzstan B E S 1999 Moldova, Republic of
B E S 2001
Tajikistan B E S 1989 Turkmenistan B E C 1995 Ukraine B/B B/E C/C 2001/2001 Uzbekistan B E S 1989 Turkey B/B B/N C/S 2001/1998 Bahrain B N C 2001 Iran, Islamic Republic of
B N C 1996
Iraq UN N U 2000 Israel B B S 2001 Jordan T N C 1994 Kuwait T N S 2001 Lebanon UN B U 2000 Palestinian Territory, Occupied
B/B B/N C/C 1997/1997
Oman T N S 1998 Qatar UN N U 2000 Saudi Arabia B N S 1995 Syrian Arab Republic
B N C 1981
United Arab Emirates
T N S 1993
Yemen UN N U 2000 Morocco UN N C 2000 Tunisia B N C 1966 Algeria UN N U 2000 Egypt UN B U 2000 Libyan Arab Jamahiriya
B O C 1964
Botswana B N C 2001 South Africa B/B B/N C/C 2001/2001 Lesotho B N C 1996 Namibia B N C 1991 Swaziland B N C 1997 Malawi B N C 1998 Mozambique B N C 1997 Tanzania, United Republic of
UN B U 2000
Zambia T N C 2000
36
Country Data Type Nationality or Birth
Source Year
Zimbabwe UN B U 2000 Angola UN B U 2000 Congo, the Democratic Republic of the
UN B U 2000
Mauritius B N C 2000 Seychelles B N C 1997 Madagascar UN N U 2000 Uganda B N C 2002 Benin B N C 1992 Burkina Faso B N S 1996 Burundi UN B U 2000 Cameroon UN B U 2000 Cape Verde B B C 1990 Central African Republic
UN N U 2000
Chad UN E U 2000 Comoros B N C 1980 Congo UN B U 2000 Cote d'Ivoire UN N U 2000 Djibouti UN E U 2000 Equatorial Guinea B N C 1994 Eritrea UN E U 2000 Ethiopia B N C 1994 Gabon B N C 1993 Gambia UN B U 2000 Ghana B N C 2000 Guinea UN N U 2000 Guinea-Bissau B N C 1991 Kenya UN B U 2000 Liberia UN B U 2000 Mali UN N U 2000 Mauritania B N C 1988 Mayotte -- - - - Niger UN B U 2000 Nigeria B N C 1991 Reunion B N C 1999 Rwanda B N C 2002 Saint Helena UN B U 2000 Sao Tome and Principe
B B C 1981
Senegal UN B U 2000 Sierra Leone B N C 1985
37
Country Data Type Nationality or Birth
Source Year
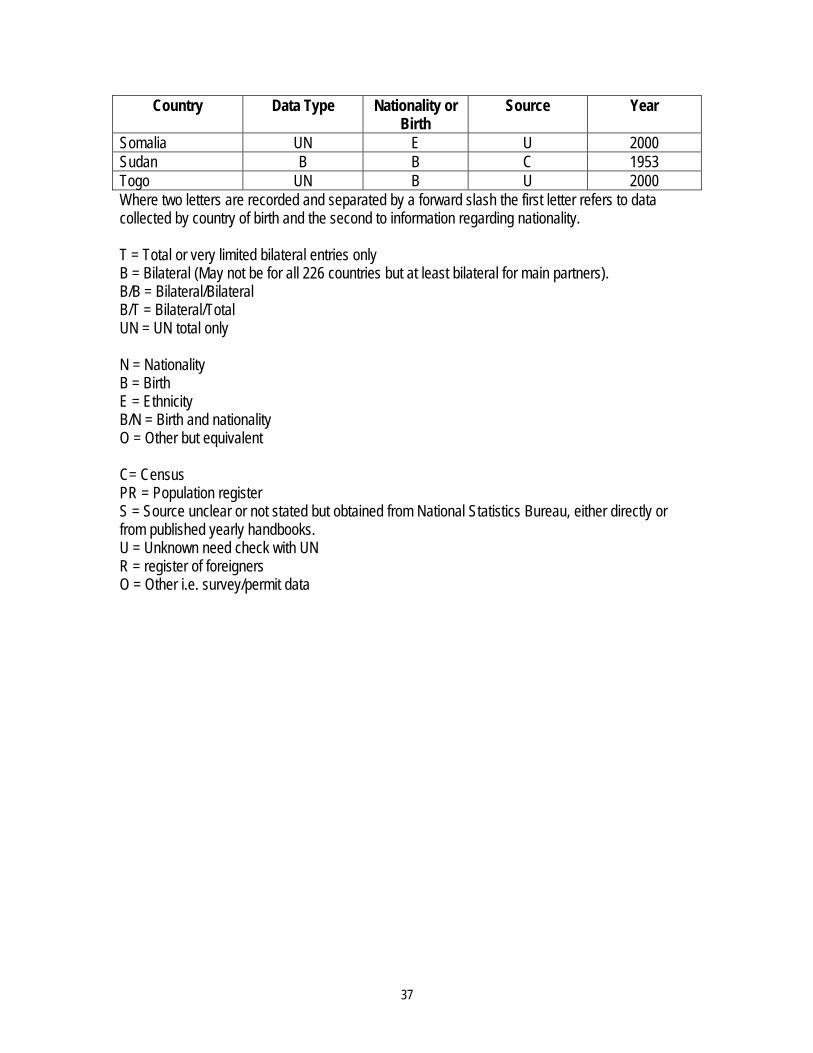
Somalia UN E U 2000 Sudan B B C 1953 Togo UN B U 2000 Where two letters are recorded and separated by a forward slash the first letter refers to data collected by country of birth and the second to information regarding nationality. T = Total or very limited bilateral entries only B = Bilateral (May not be for all 226 countries but at least bilateral for main partners). B/B = Bilateral/Bilateral B/T = Bilateral/Total UN = UN total only N = Nationality B = Birth E = Ethnicity B/N = Birth and nationality O = Other but equivalent C= Census PR = Population register S = Source unclear or not stated but obtained from National Statistics Bureau, either directly or from published yearly handbooks. U = Unknown need check with UN R = register of foreigners O = Other i.e. survey/permit data
38
ANNEX 2
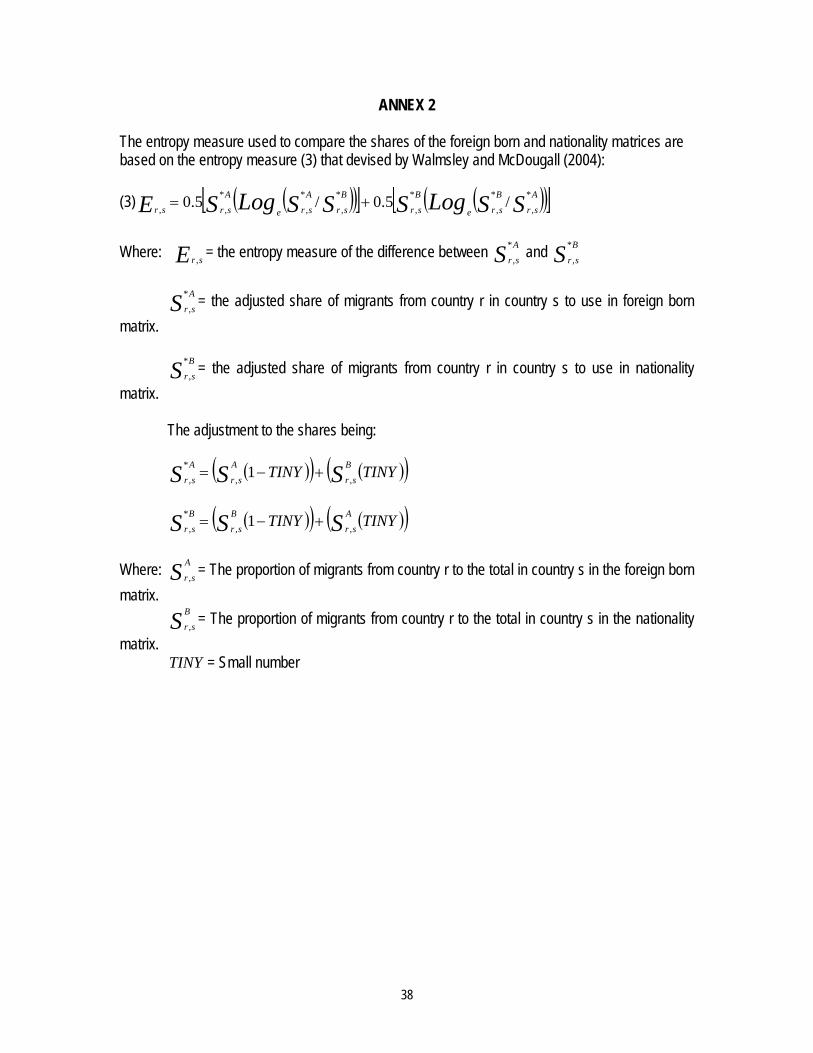
The entropy measure used to compare the shares of the foreign born and nationality matrices are based on the entropy measure (3) that devised by Walmsley and McDougall (2004):
(3) ( )( )[ ] ( )( )[ ]SSLogSSSLogSE A
sr
B
sre
B
sr
B
sr
A
sre
A
srsr
*
,
*
,
*
,
*
,
*
,
*
,, /5.0/5.0 += Where: E sr , = the entropy measure of the difference between S A
sr
*
, and S B
sr
*
, S A
sr
*
, = the adjusted share of migrants from country r in country s to use in foreign born matrix. S B
sr
*
, = the adjusted share of migrants from country r in country s to use in nationality matrix. The adjustment to the shares being: ( )( ) ( )( )TINYTINY SSS B
sr
A
sr
A
sr ,,
*
, 1 +−=
( )( ) ( )( )TINYTINY SSS A
sr
B
sr
B
sr ,,
*
, 1 +−= Where: S A
sr , = The proportion of migrants from country r to the total in country s in the foreign born matrix.
SB
sr , = The proportion of migrants from country r to the total in country s in the nationality matrix.
TINY = Small number
39
REFERENCES Bilsborrow, R.E., Hugo, G. Oberai, A. S. and Zlotnik H. (1997) ‘International Migration Statistics,
Guidelines for Improving Data Collection Systems’. Geneva: ILO. Gould, D. (1994) ‘Immigrant Links to Home Country: Empirical Implications for US Bi-lateral Trade
Flows’, Review of Economics and Statistics, 76: 302-316. Harrison, A. Britton, T and Swanson A. (2003) Working Abroad – The Benefits from Nationals
Working in Other Economies, OECD. Head, K. and Ries, J. (1998) ‘Immigration and Trade Creation: Econometric Evidence from
Canada’, Canadian Journal of Economics, pp. 47-62. Heleniak, T. (2001) ‘Migration and Restructuring in Post-Soviet Russia,’ Demokratizatsiya, pp. 531-
549. OECD (2002) Trends in International Migration. SOPEMI. OECD (2002) Migration and the Labour Market in Asia. OECD (2003) Another Look at the Comparability of Migration Statistics UN (1980) National Migration Surveys II. The Core Questionnaire. Comparative Study on
Migration, Urbanization and Development in the ECSCAP Region. UN (1994) ‘Definition of Total Population: National Practices and Implications for Population Counts
or Estimates and Projections’. Paper presented to the ACC Subcommittee on Demographic Estimates and Projections, Eight Session, 28-30 June (ACC/SCDEP/1994/TP/3).
UN (2002) International Migration Report. Department of Economic and Social Affairs,
ST/ESA/SER.A/220, 2002. Walmsley, T. L and McDougall, R. (2004) ‘Using Entropy to Compare IO Tables’. Center for Global
Trade Analysis Documentation, Purdue University. Walmsley, T. and Winters, L. A. (2005) ‘Relaxing the Restrictions on the Temporary Movements of
Natural Persons: A Simulation Analysis’. Purdue University (Center for Global Trade Analysis) and World Bank (Development Economics Research Group).

40
Primary Data Sources Oceania Cook Islands, 2001 Census of Population. Federated States of Micronesia, 2001 Census of Population (http://www.pacificweb.org). Fiji, 1996 Census of Population. Fiji, 1986 Census of Population. French Polynesia, 2002 Census of Population (http://www.ispf.pf). Kiribati, 2000 Census of Population (http://www.spc.int/prism/country/KI/Stats/Social/popn%20data.htm). New Caledonia, 1996 Census of Population (http://www.isee.nc). New Zealand, 2001 Census of Population (http://www2.stats.govt.nz). Niue, 2001 Census of Population (http://www.niuegov.com). Norfolk Island, 2001 Census of Population (http://www.norfolkisland.gov.nf). Marshall Islands, 1999 Census of Population (http://www.rmiembassyus.org). Palau, 2000 Census of Population (http://www.palaugov.net/stats/PalauStats). Papua New Guinea, 1971, Census of Population. Samoa, 2001 Census of Population (http://www.spc.int/prism/Country/WS/stats). Solomon Islands, 1999 Census of Population (http://members.lycos.nl/nidi/pdf/prj60001.pdf). Tokelau, 2001 Census of Population (http://www.spc.int/prism/country/tk/stats/Social/Demographic/Popn.xls). Tokelau, 1996, Census of Population. Tonga, 1996 Census of Population (http://www.spc.int/prism/Country/TO/stats/OtherStatistics/Census/census.htm). Tuvalu, 2002 Census of Population, (http://www.spc.int/prism/country/TV/Stats/Census02!A1). Vanuatu, 1986, Census of Population. Wallis and Fortuna, 1996 Census of Population.
41
Southern and Eastern Asia Bangladesh, 1974, Census of Population. Brunei Darussalam, 1981, Census of Population. Cambodia, 1998 Census of Population. Hong Kong, 2001 Census of Population. India, 1991, Census of Population. Laos, 1995, Census of Population. Macau, 1993, Census of Population. Macau Statistical Yearbook 2002 (http://www.dsec.gov.mo). Malaysia, 1991, Census of Population. Myanmar, Statistical Yearbook 2001. Nepal, 2001 Census of Population (http://www.cbs.gov.np). Philippines, 2000 Census of Population. Singapore, 2001 Census of Population (http://www.singstat.gov.sg). Sri Lanka, 1981, Census of Population. Thailand, Statistical Yearbook 2002. North America Bermuda, Census of Population 1991. Canada 2001, Census of Population (http://www12.statcan.ca). US, March 2000 Current Population Survey (includes Guam, Northern Marianas, Puerto Rico, and US Virgin Islands), US Bureau of Census. St. Pierre et Miquelon, Census of Population 1962.

42
South America Argentina, 2001 Census of Population (http://www.indec.mecon.ar). Bolivia, Census of Population (http://www.ine.gov.bo). Brazil, 2000, Census of Population. Chile, 2001 Census of Population (http://www.ine.cl). Columbia, 1993 Census of Population. Ecuador, 1993 Census of Population. Falkland Islands, 2001 Census of Population (http://www.mercopress.com). French Guyana, 1999 Census of Population (http://www.recensement.insee.fr). Guyana, 1960, Census of Population. Paraguay, 2001 Census of Population (http://www.dgeec.gov.py). Peru, 1993 Census of Population. Venezuela, 1990 Census of Population. Central America Belize, 2001, Census of Population (http://censos.ccp.ucr.ac.cr). Costa Rica, 2001 Census of Population (http://www.inec.go.cr). El Salvador, 1990 Census of Population. Guatemala, 1994 Census of Population. Honduras, 2001 Census of Population (http://www.ine-hn.org). Nicaragua, 1995 Census of Population (http://censos.ccp.ucr.ac.cr). Panama, 1990 Census of Population. Panama, 2000 Census of Population (http://censos.ccp.ucr.ac.cr).
43
Caribbean Anguilla, 2001 Census of Population (http://www.gov.ai/statistics). Aruba, 2000, Census of Population. Barbados, 1980-81, Census of the Commonwealth Caribbean 1980-81. British Virgin Islands, 1980-81, Census of the Commonwealth Caribbean 1980-81. Cayman Islands Compendium of statistics, 1997 Cuba, 1981 Census of Population. Dominican Republic, 1993 Census of Population. Dominican Republic, 2002, Census of Population (http://stnt01.eclac.cl/cgibin/RpWebEngine.exe/PortalAction?&MODE=MAIN&BASE=DOMGROUP&MAIN=WebServerMain.inl). Guadeloupe, 1999 Census of Population (http://www.recensement.insee.fr). Haiti, 1982 Census of Population. Jamaica, 1960, Census of Population. Martinique, 1999 Census of Population (http://www.recensement.insee.fr). Netherlands Antilles, 2001 Census of Population (http://central-bureau-of-statistics.an). St Vincent and the Grenadines, 1991 Census of Population. Trinidad and Tobago, 2000 Census of Population (http://www.cso.gov.tt/census2000). Turks and Caicos, 1990 Census of Population. Western Europe Andorra in Figures 2003 (http://estudis-estadistica.finances.ad/indexdee.htm). Belgium Demographic Statistics 2000. France, 1999 Census of Population (http://www.recensement.insee.fr).
44
Gibraltar, 2001 Census of Population (http://www.gibraltar.gov.gi/gov_depts/Statistics/ Census_of_Gibraltar_2001.pdf) Luxembourg Annual Statistics 2001. Liechtenstein Statistical Handbook 2001. Liechtenstein Statistical Handbook 2003. Malta, 1996 Census of Population (http://www.nso.gov.mt). Eastern Europe, Central Asia and Middle East Albania, 2001 Census of Population. Armenia, 2001, Census of Population (http://docs.armstat.am/census/pdfs/63.pdf). Statistical Yearbook of Belarus, 2003. Bosnia and Heretzogovina, 1991, Census of Population. Bulgaria, 2001 Census of Population (http://www.nsi.bg/Census_e/Census_e.htm). Croatia, 2001 Census of Population (http://www.dzs.hr). Croatia, Statistical Handbook 2003. Estonia, Census of Population 2000. Georgia, 2002 Census of Population (http://www.statistics.ge). Demographic Yearbook of Hungry 2004. Statistical Abstract of Israel, 2002. Statistical Abstract of Israel, 2004. Demographic Yearbook of Latvia 2001. Demographic Yearbook of Latvia 2003. Lithuania, 2001 Census of Population (http://www.std.lt/web/main.php?parent=755). Statistical Yearbook of Lithuania, 2002. Macedonia, 1994, Census of Population (http://faq.macedonia.org/information/ethnic.makeup.html).
45
Moldova Handbook of Statistics 2001. Palestine, 1997 Census of Population (http://www.pcbs.org). Romania, 2002 Census of Population (http://www.insse.ro/indexe.htm). Slovak Statistical Handbook 2003. Statistical Yearbook of Slovenia, 2002. Syria, 1981, Census of Population. Statistical Handbook of Turkey, 1999. Turkmenistan, 1995, Census of Population. Ukraine, 2001 Census of Population (http://www.ukrcensus.gov.ua). Africa Botswana, 2001 Census of Population (http://www.cso.gov.bw). Cape Verde, 1990, Census of Population. Comoros, 1980, Census of Population. Equitorial Guinea, 1994, Census of Population Ethiopia, 1994, Census of Population. Gabon, 1993, Census of Population. Ghana, 2000, Census of Population. Guinea Bassau, 1991, Census of Population. Lesotho, 1996 Census of Population. Libya, 1964, Census of Population. Malawi, 1998 Census of Population (http://www.nso.malawi.net/). Mauritania, 1988, Census of Population. Mauritius, 2000 Census of Population (http://ncb.intnet.mu/cso.htm).
46
Mozambique, 1997 Census of Population (http://www.ine.gov.mz). Namibia, 1991 Census of Population. Nigeria, 1990 Census of Population. Reunion, 1999 Census of Population (http://www.recensement.insee.fr). Rwanda, 2002 Census of Population (http://www.minecofin.gov.rw). Seychelles, 2001 Census of Population (http://www.misd.gov.sc/sdas). Sierra Leone, 1985, Census of Population, (http://www.statistics-sierra-leone.org/population_and_housing_censuses.htm). Soa Tome e Principe, 1981, Census of Population. South Africa, 2001 Census of Population (http://www.statssa.gov.za). Sudan, 1953, Census of Population. Swaziland, 1997, Census of Population. Tunisia, 1966, Census of Population. Uganda, 2002 Census of Population. Zambia, 2000 Census of Population.
Secondary Data Sources
UN (2003, 2004) Trends in Total Migrant Stock 1960-2000, 2003 Revision, Department of Economic and Social Affairs, POP/DB/MIG/Rev.2003, 2004. ECLAC (Economic Commission for Latin America and the Caribbean) International Migration in Latin America, Demographic Bulletin No 65 Eurostat, Chronos Database: http://epp.eurostat.cec.eu.int/portal/page?_pageid=1533,1,1533_1712452&_dad=portal&_schema=PORTAL OECD database on foreign born and expatriates 2005: http://www.oecd.org/document/16/0,2340,en_2649_33931_33865936_1_1_1_1,00.html Migration Policy Institute Database: http://www.migrationinformation.org

47
International Labour Organisation, International Labour Migration Database: http://www.ilo.org/public/english/protection/migrant/ilmdb/ilmdb.htm Middle East Central Asia Databook, Europa Publications. March 2004. Statistical Abstract of Latin America (2002), Vol. 38, Wilkie, James W. (ed.).