christopher nichols, fia -...
TRANSCRIPT

October 2014
Christopher Nichols, FIA
Global Absolute Return Strategies
This presentation is intended for investment professionals and must not be relied on by anyone else

Standard Life Investments: introduction
Standard Life PLC
• A FTSE 100 Financial Services company, established in 1825
• €11.2bn market cap, rated A1 by Moody’s
Standard Life Investments
• A wholly owned independent company since 1998, offices in
Edinburgh, London, Dublin, Paris, Boston, Montreal, Hong Kong,
Beijing and Seoul
• One of the fastest growing asset managers in the world
• Over €243.7bn of AuM (over 50% from external clients)
Absolute Return
• A 49 strong Multi-Asset Investing Team with over €86.5bn AuM
• Macro Strategists, Global Economics, Macro Management and Risk
& Structuring
• Range of return-targeted risk-minimisation capabilities
2
An exchange rate of £1:€1.2488 as at 30 June 2014 has been used
Source: Standard Life Investments, 30 June 2014

Genesis of Absolute Return Capabilities The Standard Life DB Pension Fund
Liabilities plus approach avoided the volatility in funding position
* The average UK Institutional Pension Portfolio
Source: Standard Life Investments and Towers Watson Statistics, 31 March 2014
-0.20
0.00
0.20
0.40
0.60
0.80
1.00
1.20
1.40
1.60
Q4 0
5
Q1 0
6
Q2 0
6
Q3 0
6
Q4 0
6
Q1 0
7
Q2 0
7
Q3 0
7
Q4 0
7
Q1 0
8
Q2 0
8
Q3 0
8
Q4 0
8
Q1 0
9
Q2 0
9
Q3 0
9
Q4 0
9
Q1 1
0
Q2 1
0
Q3 1
0
Q4 1
0
Q1 1
1
Q2 1
1
Q3 1
1
Q4 1
1
Q1 1
2
Q2 1
2
Q3 1
2
Q4 1
2
Q1 1
3
Q2 1
3
Q3 1
3
Q4 1
3
Q1 1
4
CAPS median
Liability Benchmark
GARS + Overlay
Background
• 80% funded DB plan in 2005
• Deficit reduction plan
• Drive to reduce risk and burden on sponsor
Genesis of GARS
• Examination of risk drivers
• Elimination of unrewarded risk
Client requirements
• Deliver the return target with least risk
• Transparent positioning
• Liquid instruments
• Safety-first approach
Counterparty selection and diversification
Daily collateralisation
Cash / G7 gov’t securities only
• Daily priced and dealt without notice
3

4
The Global Absolute Return Strategies Fund
Fund objective:
• Cash +5% per year, gross performance target, (rolling 3 years basis)
• 1/3 to 1/2 the risk of equity markets (expect volatility of 4% to 8%)
Key components:
Breadth: Investment opportunities, irrespective of the environment
Balance: Risk-based portfolio construction; ensures genuine diversity
Time frame: 3 year investment outlook; exploits established inefficiencies
A proven track record in delivering the Fund objectives
GARS
Time
Asset
Value
Equity
approach

GARS € performance
5 Delivering positive lower risk performance in challenging markets
* Source: Standard Life Investments converted € performance of £, institutional pooled pension portfolio to the 26/01/2011. GARS SICAV portfolio performance from
the 27/01/2011 to the 31/08/2014. ** Source: Thomson Datastream, 6 month Euribor. A conversion rate of £1:€1.260817 as at 31/08/2014 has been used
Standard Life Investments claims compliance with the Global Investment Performance Standards (GIPS®). The fund specific data presented above is supplementary
information to the Euro GARS GIPS® composite report, which is enclosed in the Appendix for your reference
• €7.7bn SICAV portfolio size (as at 31/08/2014)
• 7.8% gross annualised return (from inception to 31/08/2014)
• 5.5% volatility (Annualised figure, using monthly returns, from 01/07/2006 to
31/08/2014)
90
100
110
120
130
140
150
160
170
180
190
Price (
indexed t
o 1
00 a
t in
ception)
Cash (Euribor)** Target Return € GARS (gross)*

• Volatility:
GARS 5.5%
Global Equities 13.1% (annualised, using monthly data from 01/07/2006 to 31/08/2014)
• Maximum Drawdown:
GARS -14.3%
Global Equities -52.9% (using daily data to 31/08/2014)
• VaR (95%, weekly):
GARS -1.3%
Global Equities -3.7% (using weekly data to 31/08/2014)
Risk comparison
6
* Source: Standard Life Investments converted net € performance of £ Fund to the 26/01/2011. GARS SICAV Fund performance from the 27/01/2011 to 31/08/2014
** Source: FactSet, MSCI World €. Source: Standard Life Investments, net performance from 12/06/2006 to 31/08/2014
Delivering returns with less risk
55
65
75
85
95
105
115
125
135
145
155
165
175
185
Price (
indexed t
o 1
00 a
t in
ception)
Global Equities** € GARS (net)*
GARS vs Global Equities
Up months 70/98 vs 64/98
Upside capture 38.8%
Downside capture 3.8%

Uncorrelated return in down markets
7
* Source: Thomson Datastream, 6 month Euribor. ** Source: FactSet, MSCI World (€). Source: Standard Life Investments, gross performance, from
01/07/2006 to 30/06/2014. Portfolio performance is based on € converted performance of the £, institutional pooled pension portfolio from 12/06/2006 to
26/01/2011. SICAV GARS portfolio performance from the 27/01/2011 to 30/06/2014
3.5 3.3 1.7
1.8 2.3 1.3
-4.0
0.6
-4.4
3.3
0.7
5.5
11.3
1.5
4.6
2.3
4.8
-0.6
0.2
-1.3
1.6
3.7
5.5
-1.9
3.3
1.3
3.8
-0.4
0.2
3.7
0.6 1.3 0.9 0.9 1.0 1.1 1.2 1.2 1.1 1.3 1.3 1.1 0.5 0.4 0.3 0.3 0.2 0.2 0.3 0.3
0.3 0.4 0.5 0.4 0.3 0.3 0.2 0.1 0.1 0.1 0.1 0.1 0.1 0.1
5.6
4.2
1.6
5.2
-2.7
-5.0
-16.0
-0.9
-4.8
-20.8
-7.6
14.6
12.8
6.1
9.6
-3.3
2.2
11.0
-0.8 -1.5
-9.8
11.3
8.9
-0.2
5.4
0.1
10.8
-0.4
4.0
6.2
1.4
5.8
-25.0
-20.0
-15.0
-10.0
-5.0
0.0
5.0
10.0
15.0
20.0
%
GARS (gross) Cash (Euribor)* Global Equities**

GARS investment approach
8
A broad range of return opportunities
Enduring diversity – through a wider opportunity set
Market
• Dynamic Allocation
• Long term risk premia such
as Equities, Credit, Listed
Real Estate
• Used only when we expect
to be rewarded on a 3 year
view
Security Selection
• Active security selection
• Conventional benchmarks
• Bottom-up, Focus on Change
process
Relative Value
• Seek pairs of related markets or
segments
• Our view is performance will differ over
3 years
• Profit from the difference in performance
irrespective of market direction
Directional
• Specific directional investment
ideas
• In markets with little or no long term
risk premium
• With significant return potential on a
3 year view
T
R
A
D
I
T
I
O
N
A
L
A
D
V
A
N
C
E
D

Multi-Asset Investing Team
9
* Based in North America
GARS Portfolio Constructors
Real Returns and Rates teams provide macro research and views that influence, but do not directly drive, the GARS portfolio hence these teams are not counted
in the number of investment professionals for the product and are greyed out.
Source: Standard Life Investments, 22 September 2014
Critical combination of skills and experience
MAI Team Members: Staff Area Average years
in industry
Average years at
Standard Life Investments
Economic Framework 11 Global Strategy 17 7
Risk Investigation 7 Multi-Asset Risk & Structuring 12 8
Idea Development and Implementation 23 Multi-Asset Management & Implementation 16 9
Development / Communication 8 Multi-Asset Investment Specialists 21 8
Tenure Size Strength
Head of Multi-Asset and Macro Investing
Jason Hepner CFA
Dr Anne Friel PRM
Multi-Asset Risk and Structuring
Dr Brian Fleming CFA PRM
Dr Robert de Roeck
Dr Jens Kroeske PRM FRM
Guy Stern CFA
Multi-Asset / Macro Portfolio Management
Malin Nairn
James Esland CFA
Multi-Asset Business Management
Rates
Philip Laing
Real Returns
Jonathan Gibbs
Roger Sadewsky
Colette Conboy
Scott Smith CFA
Sebastian Mackay
Murray Forbes
Multi-Asset
Adam Rudd CFA
David Sol Owen McCrossan FIA
Richard Martin FIA
Global Strategy
Andrew Milligan
Frances Hudson
Craig Hoyda
Neil Matheson CFA*
Alex Grassino*
Govinda Finn
Harry Smith
Jeremy Lawson
Alex Wolf
James McCann Neil Richardson
Naglis Vysniauskas
Katy Forbes CFA
Adam Skerry
Tom Walker
Jack Kelly
Liam O’Donnell CFA
Ross Hutchison
Norest Zvavamwe CFA Sean Flanagan CFA
Christopher Nichols FIA
Mark Foster FFA
Malcolm Jones FFA
David Bint
Tam McVie*
Stuart Peskin CFA*
Andrew Spooner*
Rahul Khasgiwale CFA*
Multi-Asset Investment Specialists
David Kirkpatrick
Multi-Asset Implementation
Audrey Simpson Julia Mikhniak Alex Berry
Jennifer Catlow CFA Stephen Kerr Kevin Hogg
Harry Barnes Kenny MacMaster
Chris Faulkner - MacDonagh

10
Process
Integrated with full skill set across Standard Life Investments
Idea Generation
Selection
Implementation
Investment
Governance &
Oversight
• Independent Risk
Analysis
• Counterparty Risk
Management
• Investment
governance
Fundamental
economic
analysis
Asset class
team views
and strategies
Quantitative
modelling
Valuation
modelling
Multi Asset Risk and Structuring
Pre-trade risk Diversification measurement Scenario Analysis
Strategic Investment Group
• Review
• Debate
• Ratify / Reject
Conviction
Diversity
Liquidity
Multi Asset Management
Strategy implementation Final position sizing Execution

Cash & Derivatives,
37.85%
European Equity, 9.99% UK Equity,
7.86%
Global Equity, 7.22%
Mexican Government Bonds
vs Euro, 4.95%
Global REITs, 4.94%
European Investment Grade
Credit, 4.91%
UK Investment Grade Credit, 4.91%
High Yield Credit, 3.16%
US Equity, 3.15%
Brazilian Government Bonds,
3.04%
Global Miners vs Swiss Equity, 2.88%
Global Equity Oil Majors, 2.84%
Chinese Equity, 2.30%
Diverse pool of return-seeking positions
11 Source: Standard Life Investments GARS SICAV portfolio, 30 June 2014
A more
informative view
Share of physical
allocation Share of market
risk exposure
European Equity
Global Equity
Global REITs
Global Equity Oil Majors
US Equity
UK Equity
High Yield Credit
Chinese Equity European Investment
Grade Credit UK Investment Grade
Credit Liquid Instruments
Long US Dollar vs Canadian Dollar
Long US Dollar vs Euro
Long Mexican Peso vs Australian Dollar
Long Equity Variance
Australian Short-term Interest Rates
Mexican Government Bonds vs Euro
Long US Dollar vs Japanese Yen
Short UK Real Yields
Brazilian Government Bonds
Suppressed European Interest Rate Volatility
European Long-End Curve Steepener
FX Hedging
US Equity Technology Sector vs US Equity
Small Cap
Japanese vs Korean Equity
German vs French Equity
Global Miners vs Swiss Equity
European vs US and Japanese Duration
Asian Basket vs US Variance
China Equity vs UK Equity Volatility
Security Selection

Risk profile
• The portfolio is exposed to multiple & diverse market risks
• Total stand-alone investment risk that is deployed to seek returns is 14.9%
• Equivalent equity volatility is 13.7%
• Independent risk analysis shows the benefits of investment diversification
12 Source: Standard Life Investments GARS SICAV portfolio, 30 June 2014
To
tal
sta
nd
-alo
ne
ris
k
10.91%
3.94%
0%
2%
4%
6%
8%
10%
12%
14%
Diversification benefits
Expected
Directional
Market returns
Relative value
Security selection

Historical scenario analysis
13
* MSCI World Returns prior to 2000 denoted in European Currency Units, except for 1987 which is denoted in German Marks
Source: GARS SICAV, RiskMetrics, 30/06/2014
-28 -26 -24 -22 -20 -18 -16 -14 -12 -10 -8 -6 -4 -2 0 2 4 6 8 10 12 14 16 18
Black Monday 1987
Gulf War 1990
Rate Rise 1994
Mexican Crisis 1995
Asian Crisis 1997
Russian/LTCM
Tech Wreck (April 07 - 14, 2000)
Sept 11th
Equity Sell-Off (August 23 - October 09, 2002)
Equity Rally (October 10 - November 27, 2002)
Gulf War 2 (March 01 - 23, 2003)
Bond Rally (May 01 - June 13, 2003)
Bond Sell-Off (June 14 - July 31, 2003)
Emerging Market Sell-Off 2006 (May 01 - June 08, 2006)
Subprime Debacle 2007 (July 15 - August 15, 2007)
Bank Meltdown 2008 (September 12 - October 15, 2008)
Euro Crisis (July 22 - August 23, 2011)
QE jitters (May 22 - June 24, 2013)
% Move

Portfolio outlook / themes
Multi-Speed Global Growth
European vs US and Japanese Duration
German vs French Equity
Short UK Real Yield
Central Bank Policy
Australian Short Term Duration
Japanese vs Korean Equity
US Dollar vs Japanese Yen
14
Source: Standard Life Investments UK GARS portfolio, 31 August 2014
Maximising our insight on global investment markets
Resources and Demand
Global Equity Oil Majors
Global Miners vs Swiss Equity
Mexican Peso vs Australian Dollar
Earnings Potential
US Equity Tech vs Small Cap
European Equity
Global REITS

15
Key benefits of GARS
Longer term outlook Exploits established inefficiencies
Low turnover / costs
Durably diverse Broad range of return-seeking strategies
Work well together in many scenarios
Transparent Full risk & return attribution
Regulated / onshore
Accessible / Liquid Daily access
No notice, lockup or gate
Fits existing portfolios Low correlation
Low flat fee structure – a core solution
Exceptional rewards for modest risk levels

Appendices

Strategic Investment Group: Regular attendees
• Key attributes:
Foremost strategic thinkers
Diversity of backgrounds
Regular meetings to discuss portfolio
Assess new ideas from across the asset class desks
Forum to examine, test and approve multi-asset strategies
17
Source: Standard Life Investments, 04 September 2014
An experienced and proven team
Name Position Relevant experience (years)
Guy Stern (Chair) Head of Multi-Asset and Macro Investing 32
Andrew Milligan Head of Global Strategy 36
Stan Pearson Head of European Equities 30
Richard House Head of Emerging Market Debt 21
Craig MacDonald Head of Credit 19
Neil Matheson Senior Vice-President, Investment Strategy 33
Dr Brian Fleming Head of Multi-Asset Risk and Structuring 12
Roger Sadewsky Investment Director, Multi-Asset Investing 30
Frances Hudson Global Thematic Strategist 29
Neil Richardson Investment Director, Multi-Asset Investing 30
Philip Laing Investment Director, Fixed Income 25
Ken Dickson Investment Director, Money Markets & Foreign
Exchange 28
Jason Hepner Investment Director, Multi-Asset Investing 17
Jeremy Lawson Chief Economist, Global Strategy 15
Adam Rudd Investment Director, Multi-Asset Investing 9
Sebastian MacKay Investment Director, Multi-Asset Investing 15
Jack Kelly Investment Director, Fixed Income 21
Scott Smith Investment Director, Multi-Asset Investing 9
David Sol Investment Director, Multi-Asset Investing 12
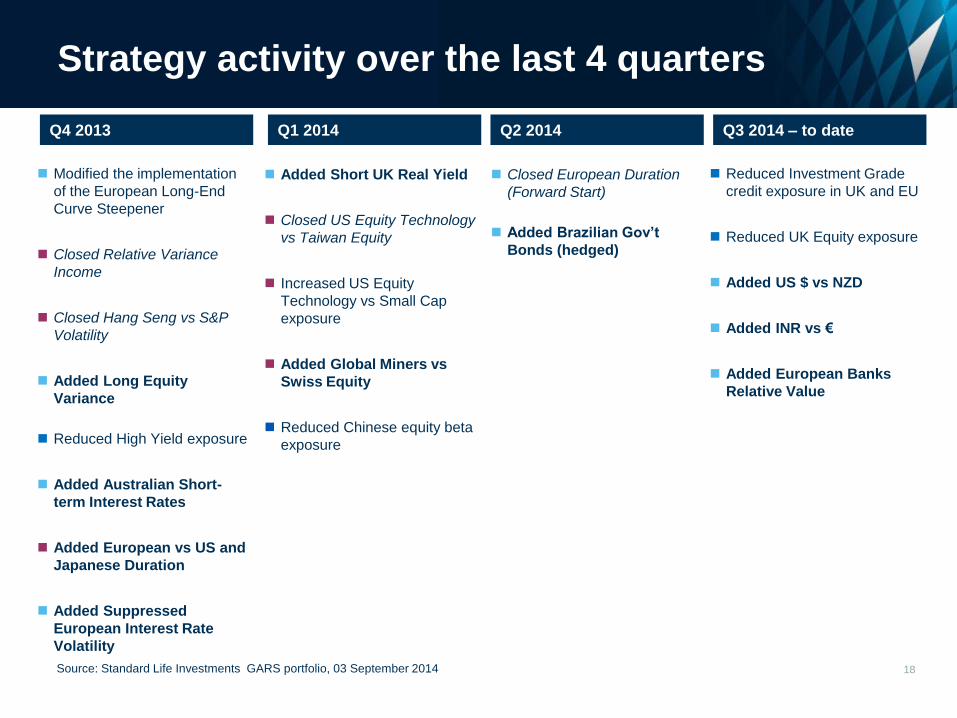
Strategy activity over the last 4 quarters
18 Source: Standard Life Investments GARS portfolio, 03 September 2014
Q2 2014
Closed European Duration
(Forward Start)
Added Brazilian Gov’t
Bonds (hedged)
Reduced Investment Grade
credit exposure in UK and EU
Reduced UK Equity exposure
Added US $ vs NZD
Added INR vs €
Added European Banks
Relative Value
Modified the implementation
of the European Long-End
Curve Steepener
Closed Relative Variance
Income
Closed Hang Seng vs S&P
Volatility
Added Long Equity
Variance
Reduced High Yield exposure
Added Australian Short-
term Interest Rates
Added European vs US and
Japanese Duration
Added Suppressed
European Interest Rate
Volatility
Q3 2014 – to date Q4 2013 Q1 2014
Added Short UK Real Yield
Closed US Equity Technology
vs Taiwan Equity
Increased US Equity
Technology vs Small Cap
exposure
Added Global Miners vs
Swiss Equity
Reduced Chinese equity beta
exposure
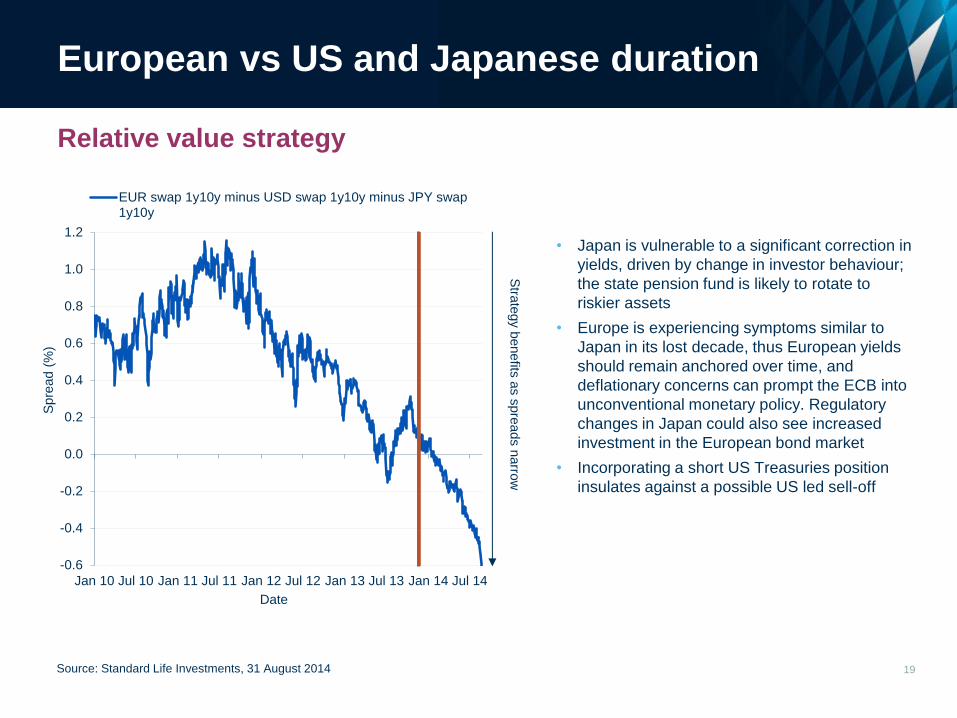
-0.6
-0.4
-0.2
0.0
0.2
0.4
0.6
0.8
1.0
1.2
Jan 10 Jul 10 Jan 11 Jul 11 Jan 12 Jul 12 Jan 13 Jul 13 Jan 14 Jul 14
Spre
ad (
%)
Date
EUR swap 1y10y minus USD swap 1y10y minus JPY swap1y10y
European vs US and Japanese duration
• Japan is vulnerable to a significant correction in
yields, driven by change in investor behaviour;
the state pension fund is likely to rotate to
riskier assets
• Europe is experiencing symptoms similar to
Japan in its lost decade, thus European yields
should remain anchored over time, and
deflationary concerns can prompt the ECB into
unconventional monetary policy. Regulatory
changes in Japan could also see increased
investment in the European bond market
• Incorporating a short US Treasuries position
insulates against a possible US led sell-off
19
Relative value strategy
Source: Standard Life Investments, 31 August 2014
Stra
tegy b
enefits
as s
pre
ads n
arro
w
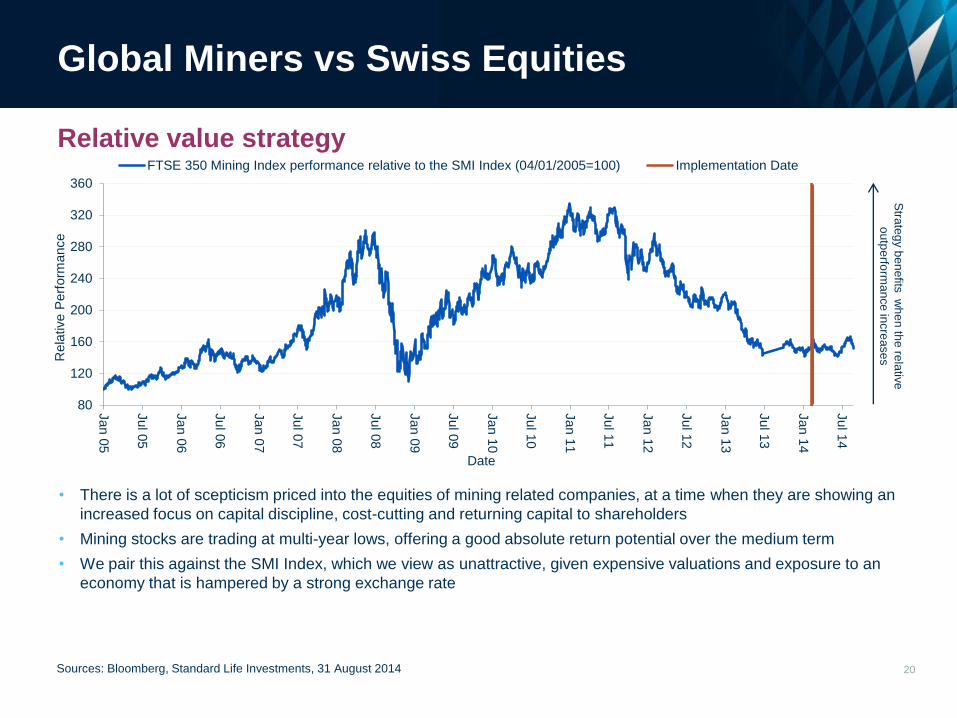
80
120
160
200
240
280
320
360
Jan 0
5
Jul 0
5
Jan 0
6
Jul 0
6
Jan 0
7
Jul 0
7
Jan 0
8
Jul 0
8
Jan 0
9
Jul 0
9
Jan 1
0
Jul 1
0
Jan 1
1
Jul 1
1
Jan 1
2
Jul 1
2
Jan 1
3
Jul 1
3
Jan 1
4
Jul 1
4
Rela
tive P
erf
orm
ance
Date
FTSE 350 Mining Index performance relative to the SMI Index (04/01/2005=100) Implementation Date
Global Miners vs Swiss Equities
• There is a lot of scepticism priced into the equities of mining related companies, at a time when they are showing an
increased focus on capital discipline, cost-cutting and returning capital to shareholders
• Mining stocks are trading at multi-year lows, offering a good absolute return potential over the medium term
• We pair this against the SMI Index, which we view as unattractive, given expensive valuations and exposure to an
economy that is hampered by a strong exchange rate
20 Sources: Bloomberg, Standard Life Investments, 31 August 2014
Relative value strategy
Stra
teg
y b
en
efits
wh
en
the
rela
tive
ou
tpe
rform
an
ce
incre
ase
s

7
8
9
10
11
12
13
14
Jan 10 Jul 10 Jan 11 Jul 11 Jan 12 Jul 12 Jan 13 Jul 13 Jan 14 Jul 14
Yie
ld (
%)
Date
Bank of America Merrill Lynch Brazilian Government bond indexyield
Brazilian Government Bonds
• The Brazilian central bank has raised interest
rates sharply to combat inflation and defend
the Real; the result is that Brazil has one of
the highest levels of real interest rates in the
world
• The economic slowdown gives an opportunity
for the central bank to begin to cut rates: retail
sales, credit growth and industrial production
are all weak
21
Directional strategy
Source: Bloomberg, 31 August 2014
Stra
tegy b
enefits
when th
e y
ield
tighte
ns

1.0
1.2
1.4
1.6
1.8
2.0
2.2
2.4
2.6
Jan
00
Jan
01
Jan
02
Jan
03
Jan
04
Jan
05
Jan
06
Jan
07
Jan
08
Jan
09
Jan
10
Jan
11
Jan
12
Jan
13
Jan
14
NZ
D/U
SD
Date
US Dollar-New Zealand Dollar Exchange Rate
US Dollar vs New Zealand Dollar
• The continued withdrawal of quantitative easing
in the US will cause money supply growth to
slow, and stronger economic growth can be a
driver of US dollar strength
• The NZD is one of the most overvalued
currencies in the world as measured by a range
of metrics; safe haven flows and high carry are
principle reasons for the overvaluation
• The overheating New Zealand housing market
is cooling down, which makes it unlikely that the
central bank will aggressively raise interest
rates
22
Directional strategy
Source: Bloomberg, 31 August 2014
Stra
tegy b
enefits
when th
e U
S D
olla
r appre
cia
tes

Indian Rupee vs Euro
23 Source: Bloomberg, 31 August 2014
• This pairing benefits from the Indian Rupee's
appeal as a carry currency and the need in
Europe for the Euro to depreciate. The Indian
central bank and government have gained
credibility by reducing the current account
deficit and by introducing an inflation target;
further reforms and an increase in FX reserves
make the currency less vulnerable to rate rises
in the US.
• ECB actions in the form of the TLTRO and
potential QE later this year should have the
effect of dampening the currency. Recent bank
deleveraging in time for the AQR looks to be
almost complete, hence a support of Euro
strength is in the process of being removed
Directional strategy
Stra
tegy b
enefits
when th
e E
UR
depre
cia
tes
30
40
50
60
70
80
90
100
Jan 0
0
Jan 0
1
Jan 0
2
Jan 0
3
Jan 0
4
Jan 0
5
Jan 0
6
Jan 0
7
Jan 0
8
Jan 0
9
Jan 1
0
Jan 1
1
Jan 1
2
Jan 1
3
Jan 1
4
INR
/EU
R
Date
EUR-INR Exchange Rate

European Equity Banks
24 Source: Bloomberg, 31 August 2014
Relative value strategy
• An improvement in European economic
conditions should entail lower loan provisions
and an increase in lending, which in turn
should improve profitability measure such as
Return on Equity and support valuations
• Movement towards a banking union within
Europe can support the sector over the
medium term which should boost sentiments
around earnings and valuations; the banks
index is still trading cheaply on a Price-to-Book
metric compared to its history
• Lower peripheral spreads and core
government bond yields have reduced the cost
of equity for banks
Stra
teg
y b
en
efits
wh
en
the
rela
tive
ou
tpe
rform
an
ce
of
Eu
rop
ea
n b
an
ks in
cre
ase
s
100
110
120
130
140
150
160
170
180
190
200
210
220
230
240
250
Jan 10 Jul 10 Jan 11 Jul 11 Jan 12 Jul 12 Jan 13 Jul 13 Jan 14 Jul 14
Rela
tive
pe
rfo
rma
nce
Date
EuroStoxx Banks index performance relative to EuroStoxx index(Rebased at 100 as of January 2003)
Implementation date
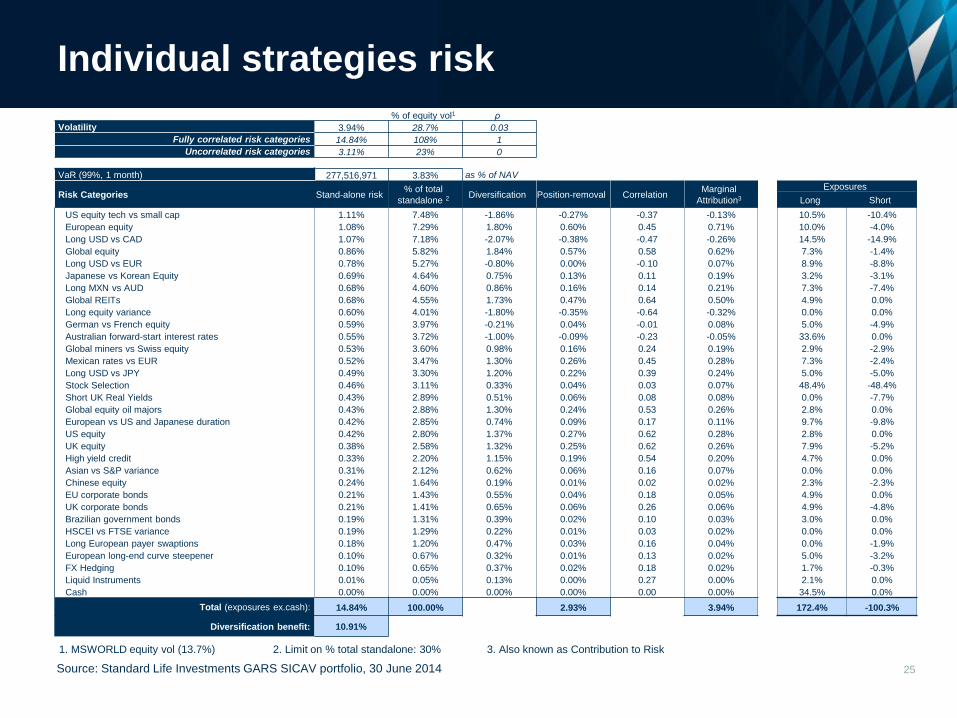
Individual strategies risk
25
1. MSWORLD equity vol (13.7%) 2. Limit on % total standalone: 30% 3. Also known as Contribution to Risk
% of equity vol1 ρ
Volatility 3.94% 28.7% 0.03
Fully correlated risk categories 14.84% 108% 1
Uncorrelated risk categories 3.11% 23% 0
VaR (99%, 1 month) 277,516,971 3.83% as % of NAV
Risk Categories Stand-alone risk % of total
standalone 2 Diversification Position-removal Correlation Marginal
Attribution3
Exposures
Long Short
US equity tech vs small cap 1.11% 7.48% -1.86% -0.27% -0.37 -0.13% 10.5% -10.4%
European equity 1.08% 7.29% 1.80% 0.60% 0.45 0.71% 10.0% -4.0%
Long USD vs CAD 1.07% 7.18% -2.07% -0.38% -0.47 -0.26% 14.5% -14.9%
Global equity 0.86% 5.82% 1.84% 0.57% 0.58 0.62% 7.3% -1.4%
Long USD vs EUR 0.78% 5.27% -0.80% 0.00% -0.10 0.07% 8.9% -8.8%
Japanese vs Korean Equity 0.69% 4.64% 0.75% 0.13% 0.11 0.19% 3.2% -3.1%
Long MXN vs AUD 0.68% 4.60% 0.86% 0.16% 0.14 0.21% 7.3% -7.4%
Global REITs 0.68% 4.55% 1.73% 0.47% 0.64 0.50% 4.9% 0.0%
Long equity variance 0.60% 4.01% -1.80% -0.35% -0.64 -0.32% 0.0% 0.0%
German vs French equity 0.59% 3.97% -0.21% 0.04% -0.01 0.08% 5.0% -4.9%
Australian forward-start interest rates 0.55% 3.72% -1.00% -0.09% -0.23 -0.05% 33.6% 0.0%
Global miners vs Swiss equity 0.53% 3.60% 0.98% 0.16% 0.24 0.19% 2.9% -2.9%
Mexican rates vs EUR 0.52% 3.47% 1.30% 0.26% 0.45 0.28% 7.3% -2.4%
Long USD vs JPY 0.49% 3.30% 1.20% 0.22% 0.39 0.24% 5.0% -5.0%
Stock Selection 0.46% 3.11% 0.33% 0.04% 0.03 0.07% 48.4% -48.4%
Short UK Real Yields 0.43% 2.89% 0.51% 0.06% 0.08 0.08% 0.0% -7.7%
Global equity oil majors 0.43% 2.88% 1.30% 0.24% 0.53 0.26% 2.8% 0.0%
European vs US and Japanese duration 0.42% 2.85% 0.74% 0.09% 0.17 0.11% 9.7% -9.8%
US equity 0.42% 2.80% 1.37% 0.27% 0.62 0.28% 2.8% 0.0%
UK equity 0.38% 2.58% 1.32% 0.25% 0.62 0.26% 7.9% -5.2%
High yield credit 0.33% 2.20% 1.15% 0.19% 0.54 0.20% 4.7% 0.0%
Asian vs S&P variance 0.31% 2.12% 0.62% 0.06% 0.16 0.07% 0.0% 0.0%
Chinese equity 0.24% 1.64% 0.19% 0.01% 0.02 0.02% 2.3% -2.3%
EU corporate bonds 0.21% 1.43% 0.55% 0.04% 0.18 0.05% 4.9% 0.0%
UK corporate bonds 0.21% 1.41% 0.65% 0.06% 0.26 0.06% 4.9% -4.8%
Brazilian government bonds 0.19% 1.31% 0.39% 0.02% 0.10 0.03% 3.0% 0.0%
HSCEI vs FTSE variance 0.19% 1.29% 0.22% 0.01% 0.03 0.02% 0.0% 0.0%
Long European payer swaptions 0.18% 1.20% 0.47% 0.03% 0.16 0.04% 0.0% -1.9%
European long-end curve steepener 0.10% 0.67% 0.32% 0.01% 0.13 0.02% 5.0% -3.2%
FX Hedging 0.10% 0.65% 0.37% 0.02% 0.18 0.02% 1.7% -0.3%
Liquid Instruments 0.01% 0.05% 0.13% 0.00% 0.27 0.00% 2.1% 0.0%
Cash 0.00% 0.00% 0.00% 0.00% 0.00 0.00% 34.5% 0.0%
Total (exposures ex.cash): 14.84% 100.00% 2.93% 3.94% 172.4% -100.3%
Diversification benefit: 10.91%
Source: Standard Life Investments GARS SICAV portfolio, 30 June 2014
0%
1%
2%
3%
4%
5%
6%
7%
8%
9%
10%
Eq
uitie
s
FX
Dura
tio
n
Pro
pert
y
Vo
latilit
y
Cre
dit
Sto
ck S
ele
ction
Cash
Div
ers
ific
atio
n
Fu
nd V
ola
tilit
y
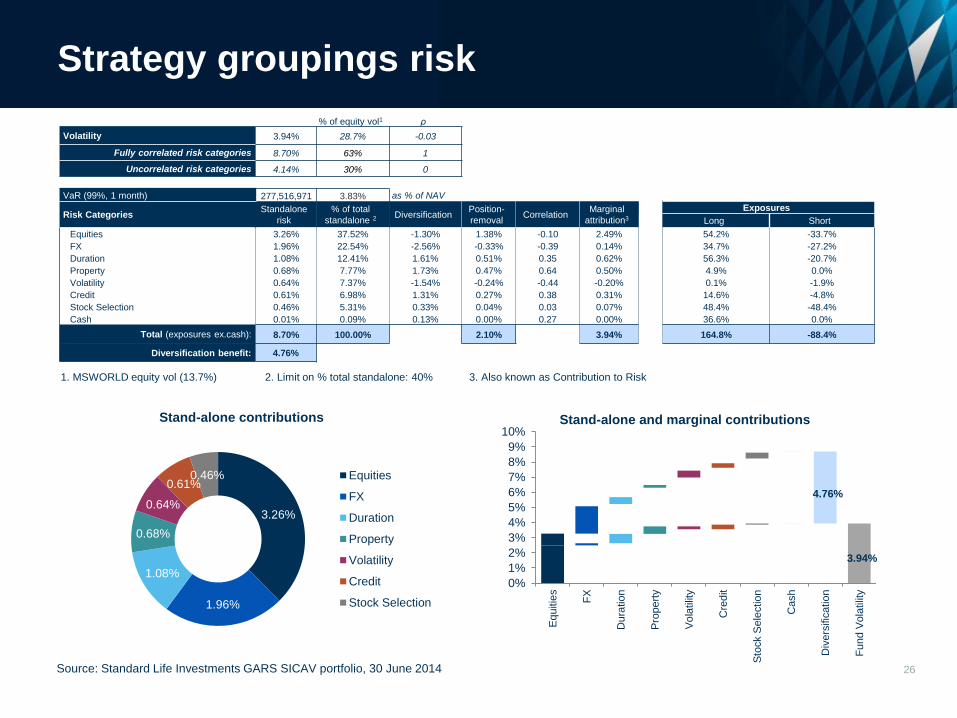
Strategy groupings risk
26
% of equity vol1 ρ
Volatility 3.94% 28.7% -0.03
Fully correlated risk categories 8.70% 63% 1
Uncorrelated risk categories 4.14% 30% 0
VaR (99%, 1 month) 277,516,971 3.83% as % of NAV
Risk Categories Standalone
risk
% of total
standalone 2 Diversification Position-
removal Correlation
Marginal
attribution3
Exposures
Long Short
Equities 3.26% 37.52% -1.30% 1.38% -0.10 2.49% 54.2% -33.7%
FX 1.96% 22.54% -2.56% -0.33% -0.39 0.14% 34.7% -27.2%
Duration 1.08% 12.41% 1.61% 0.51% 0.35 0.62% 56.3% -20.7%
Property 0.68% 7.77% 1.73% 0.47% 0.64 0.50% 4.9% 0.0%
Volatility 0.64% 7.37% -1.54% -0.24% -0.44 -0.20% 0.1% -1.9%
Credit 0.61% 6.98% 1.31% 0.27% 0.38 0.31% 14.6% -4.8%
Stock Selection 0.46% 5.31% 0.33% 0.04% 0.03 0.07% 48.4% -48.4%
Cash 0.01% 0.09% 0.13% 0.00% 0.27 0.00% 36.6% 0.0%
Total (exposures ex.cash): 8.70% 100.00% 2.10% 3.94% 164.8% -88.4%
Diversification benefit: 4.76%
1. MSWORLD equity vol (13.7%) 2. Limit on % total standalone: 40% 3. Also known as Contribution to Risk
Stand-alone contributions Stand-alone and marginal contributions
4.76%
3.94%
Source: Standard Life Investments GARS SICAV portfolio, 30 June 2014
3.26%
1.96%
1.08%
0.68%
0.64%
0.61% 0.46% Equities
FX
Duration
Property
Volatility
Credit
Stock Selection

Forward-looking scenarios
World Economic Forum 2013
• Economic / Political
• Environmental
• Societal / Technological
Current scenarios of interest
• QE: Continuation & Abrupt End
• EU moves apart
• Commodity shock
• China crisis
• Trade war
• Russia West Standoff
• Inflation Shock
• Liquidity Drought
27 Shaded regions represent the origin of one or more scenarios

28
Expert views inform portfolio outcomes
China Crisis
Description:
• Rebalancing causes growth to slow significantly
• Compounded by rising inflation / wages
• Demographics limits future development
• Debt-fuelled investment boom / misallocation of resources - debt quality / defaults rise
• Productivity growth remains low or falls further
Sources: Standard Life Investments & Bloomberg, June 2014
Combining quantitative expertise with subjective judgement
Key Factor Shock
CNY Volatility 4.8%
Australian
Dollar
-15%
MSCI EM -75%
Copper -60%
China Crisis

29
Expert views inform portfolio outcomes
Russia West Standoff
Description:
• Russia restores sphere of influence over former-soviets to distract from weak economy
• Energy supply disruption impacts European growth, especially in Germany / Eastern
Europe
• Sanctions strengthened in response to military intervention
• Banking exposures in France, Italy Sweden and Austria impacted
Sources: Standard Life Investments & Bloomberg, June 2014
Combining quantitative expertise with subjective judgement
Key Factor Shock
Oil Price +20%
S&P 500 -5%
DAX -14%
CAC -10%
10yr Bund
yield
-0.5%
Russia West Standoff
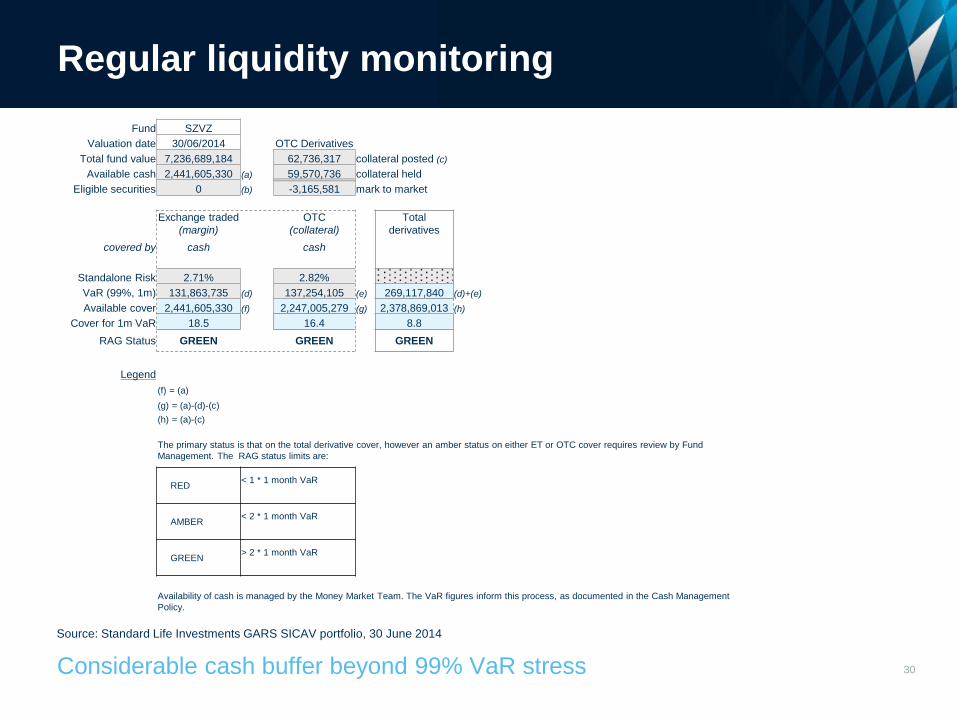
Regular liquidity monitoring
30
Source: Standard Life Investments GARS SICAV portfolio, 30 June 2014
Considerable cash buffer beyond 99% VaR stress
Fund SZVZ
Valuation date 30/06/2014 OTC Derivatives
Total fund value 7,236,689,184 62,736,317 collateral posted (c)
Available cash 2,441,605,330 (a) 59,570,736 collateral held
Eligible securities 0 (b) -3,165,581 mark to market
Exchange traded
(margin)
OTC
(collateral)
Total
derivatives
covered by cash cash
Standalone Risk 2.71% 2.82%
VaR (99%, 1m) 131,863,735 (d) 137,254,105 (e) 269,117,840 (d)+(e)
Available cover 2,441,605,330 (f) 2,247,005,279 (g) 2,378,869,013 (h)
Cover for 1m VaR 18.5 16.4 8.8
RAG Status GREEN GREEN GREEN
Legend
(f) = (a)
(g) = (a)-(d)-(c)
(h) = (a)-(c)
The primary status is that on the total derivative cover, however an amber status on either ET or OTC cover requires review by Fund
Management. The RAG status limits are:
RED < 1 * 1 month VaR
AMBER < 2 * 1 month VaR
GREEN > 2 * 1 month VaR
Availability of cash is managed by the Money Market Team. The VaR figures inform this process, as documented in the Cash Management
Policy.

Ex-post risk analysis
• Expect volatility range of 4 –
8%
• We track realised volatility
relative to expectation and to
risk model estimates
• Many different bases can be
used:
Monthly, weekly, daily data
Various window sizes and
weightings
• Measuring relative to equities
is a useful way to normalise
• We expect to be 1/3 to 1/2 of
equity volatility
31 Source: Standard Life Investments UK GARS portfolio; Datastream MSWRLD$(RI)~£. 30 June 2014

Financial turbulence – measuring the unusual
• An extension to the v-mask methodology
• Monitors unusual moves in
strategy returns (like V-masks)
correlation/covariance (not necessarily corresponding to big
moves)
• It evaluates the level of unusualness of today's moves and
records an ‘event’ if it is statistically significant (relative to a
95% historical confidence)
32 Source: Standard Life Investments UK GARS portfolio, 18 September 2014
+0.5%
+0.5%
-0.5%
-0.5%
S&P 500 FTSE 100
Usual
Unusual
S&P 500 FTSE 100
0
50
100
150
200
250
0
50
100
150
200
250
Sep 04 Feb 06 Jun 07 Oct 08 Mar 10 Jul 11 Dec 12 Apr 14
Glo
bal equity
index
Unusualn
ess index
GARS strategies unusualness
Global Equity (rhs) Unusualness index (lhs) limit

V-Masks for individual positions and overall
33
Short-term v-masks
(zero return, exponentially weighted, half-life = 3m, 99% confidence),
1 year of daily data
Source: Standard Life Investments, June 2014

34 34 Study rejects hypothesis of ‘random walk’ over 2-8 year view
Philosophical foundation: Hard evidence for asset allocation opportunity horizon
• Picking short-term market
peaks and troughs is
notoriously difficult
• Research indicates
opportunities for mean
reversion do exist on a 2-5
year investment horizon
• Investment decisions to
exploit these opportunities
are based on in-depth
qualitative analysis
Non-Outlier Max Non-Outlier Min
75%
25%
Median
Box Plot: 1-Year Equivalent Volatility of UK Equity Market
Total Real Return Data: 1900 - 2002, Source BZW Equity Gilt Study
Comparison with 40 random shuffled BZW data surrogates
Non-overlapping return runs of length n
1 Y
ea
r Eq
uiv
ale
nt V
ola
tility
y_1
0.06
0.10
0.14
0.18
0.22
0.26
0.30
0.34
bzw sur
y_2
bzw sur
y_4
bzw sur
y_8
bzw sur
y_16
bzw sur

1 year cumulative performance attribution
35 Source: Standard Life Investments GARS SICAV portfolio, 30 June 2014
Quarter Q3 13 Q4 13 Q1 14 Q2 14
Year to Date
Cumulative
contribution over
1 year Number of contributors 31 31 31 31
Security Selection 0.0% 0.4% -0.1% -0.2% -0.3% 0.1%
UK Equity 0.2% 0.2% 0.0% 0.1% 0.0% 0.4%
Global Equity 0.2% 0.4% 0.0% 0.2% 0.2% 0.8%
European Equity -0.1% 0.3% 0.2% 0.1% 0.3% 0.5%
US Equity 0.1% 0.2% 0.0% 0.1% 0.1% 0.4%
Russian Equity 0.0% 0.0% 0.0%
Global Equity Oil Majors 0.0% 0.3% 0.0% 0.3% 0.2% 0.6%
Chinese Equity 0.3% 0.1% -0.3% 0.0% -0.3% 0.1%
Investment Grade Corporate Bonds 0.1% 0.2% 0.1% 0.2% 0.3% 0.6%
High Yield Credit 0.3% 0.3% 0.1% 0.1% 0.2% 0.8%
Global REITs 0.0% 0.1% 0.1% 0.3% 0.5% 0.6%
Cash 0.1% 0.1% 0.1% 0.1% 0.1% 0.2%
Short UK Real Yield -0.1% 0.0% -0.1% -0.1%
Australian Short-term Interest Rates 0.0% 0.1% 0.4% 0.5% 0.5%
European Long-End Curve Steepener 0.0% 0.1% 0.1% 0.0% 0.1% 0.2%
European Duration (Forward Start) 0.1% 0.1% 0.1% 0.0% 0.2% 0.3%
US steepener 0.2% 0.0% 0.2%
Mexican Government Bonds vs Euro -0.1% -0.1% 0.2% 0.3% 0.4% 0.2%
Brazilian Government Bonds -0.1% -0.1% -0.1%
Long Equity Variance -0.3% -0.2% -0.4% -0.5% -0.8%
Suppressed European Interest Rate Volatility 0.0% 0.0% -0.1% -0.1% -0.1%
Long US Dollar vs Japanese Yen 0.1% 0.3% 0.0% 0.0% 0.0% 0.4%
Long US Dollar vs Euro -0.4% -0.2% 0.0% 0.1% 0.0% -0.5%
Long US Dollar vs Canadian Dollar -0.4% 0.4% 0.5% -0.6% -0.1% 0.0%
Long Mexican Peso vs Australian Dollar -0.2% 0.4% -0.2% -0.1% -0.3% -0.2%
Long Indian Rupee vs Singapore Dollar -0.3% 0.0% -0.3%
Other FX -0.1% -0.1% 0.0% 0.0% 0.0% -0.2%
Global Miners vs Swiss Equity -0.2% 0.0% -0.2% -0.2%
US Large vs US Small Cap Equity -0.2% 0.0% -0.2%
US Equity Technology Sector vs US Equity Small
Cap 0.0% 0.1% -0.3% 0.4% 0.2% 0.3%
US Equity Technology vs Taiwan 0.1% 0.2% 0.0% 0.0% 0.3%
German vs French Equity -0.1% 0.4% -0.1% 0.0% -0.1% 0.1%
Japanese vs Korean Equity -0.2% 0.3% -0.2% 0.1% -0.1% 0.0%
European v US and Japanese Duration 0.0% 0.2% 0.2% 0.4% 0.4%
China Equity vs UK Equity Volatility 0.0% 0.0% 0.0% 0.0% 0.0% 0.0%
Relative Variance Income 0.0% 0.0% 0.0% 0.0%
Hang Seng vs S&P volatility 0.0% 0.0% 0.0% 0.0%
Asian Basket vs US Variance 0.0% 0.0% 0.0% 0.0% 0.0% 0.0%
Residual 0.5% -0.52% 0.4% 0.0% 0.3% 0.3%
GARS total 0.2% 3.7% 0.6% 1.3% 1.9% 5.8%
-1.0% 0.0% 1.0%

Cumulative performance attribution
36 Source: Standard Life Investments UK GARS portfolio, 30 June 2014
Quarter Q3 06 Q4 06 Q1 07 Q2 07 Q3 07 Q4 07 Q1 08 Q2 08 Q3 08 Q4 08 Q1 09 Q2 09 Q3 09 Q4 09 Q1 10 Q2 10 Q3 10 Q4 10 Q1 11 Q2 11 Q3 11 Q4 11 Q1 12 Q2 12 Q3 12 Q4 12 Q1 13 Q2 13 Q3 13 Q4 13 Q1 14 Q2 14
Number of strategies 13 14 14 15 16 18 22 23 30 34 37 36 35 30 31 35 33 32 34 28 30 29 31 30 31 34 35 34 31 31 31 31
Security Selection -0.2% 1.4% 1.2% 0.7% -0.3% -0.6% 0.0% 0.8% -0.9% -0.5% 1.4% -1.2% -1.0% -0.1% -0.3% -0.6% 0.2% 0.3% -0.5% -0.4% -0.7% 0.3% 0.4% 0.2% 0.1% 0.1% 0.2% 0.2% 0.1% 0.3% -0.1% -0.2%
UK Equity 0.6% 0.7% 0.2% 0.6% -0.1% 0.1% -1.0% -0.3% -0.5% 0.1% -0.4% 0.8% 0.9% 0.2% 0.2% -0.3% 0.6% 0.3% 0.2% 0.1% -0.4% 0.0% 0.0% 0.0% 0.0% 0.0% 0.3% 0.0% 0.2% 0.1% 0.0% 0.1%
Global Equity 0.5% 0.7% 0.2% 0.7% 0.0% -0.4% -1.3% 0.0% -0.8% -1.1% -0.9% 1.4% 1.1% 0.3% 0.4% -0.8% 0.7% 0.8% 0.4% -0.2% -0.5% 0.3% 0.6% -0.4% 0.2% -0.2% 0.6% 0.2% 0.3% 0.3% 0.0% 0.2%
European Equity 0.5% 0.3% 0.7% 1.0% -0.1% -0.2% -1.4% -0.4% -1.1% -1.4% -0.8% 1.2% 1.0% 0.1% 0.1% 0.0% 0.4% 0.4% 0.2% 0.0% -0.6% 0.1% 0.4% -0.2% 0.3% 0.2% 0.2% 0.0% 0.0% 0.3% 0.2% 0.1%
US Equity -0.7% -1.1% -0.9% 1.0% 0.8% 0.3% 0.2% -0.2% 0.3% 0.3% 0.2% 0.0% -0.4% 0.4% 0.3% -0.2% 0.1% -0.1% 0.4% 0.1% 0.1% 0.2% 0.0% 0.1%
Russian Equity -0.2% -0.7% 0.1% 0.4% -0.4% 0.2% 0.2% 0.1% -0.3% 0.1%
Global Equity Oil Majors 0.0% 0.3% 0.0% 0.3%
Korean Equity 0.0% -0.5% 0.2% 0.0% -0.1%
Chinese Equity -0.1% -0.3% 0.4% 0.1% -0.3% 0.0%
Investment Grade Corporate Bonds 0.3% 0.3% 0.1% -0.2% 0.3% 0.2% -0.1% -0.1% -0.4% -0.3% -0.7% 3.0% 2.6% 0.4% 1.1% 0.2% 0.9% -0.4% 0.2% 0.2% -0.3% 0.4% 0.9% 0.1% 0.8% 0.5% 0.1% -0.1% 0.2% 0.1% 0.2% 0.2%
Financial Sector Credit 0.8% 0.4% -0.3% 0.3% -0.9% 0.8% 1.1% -0.1%
High Yield Credit -0.3% 0.2% 0.2% 0.1% 0.0% -0.8% 0.6% 0.6% 0.0% 0.6% 0.3% 0.4% -0.1% 0.3% 0.3% 0.1% 0.1%
Global Inflation-Linked Bonds 0.4% -0.1% 0.1% -0.1% 0.4% 0.4% 0.4% 0.1% 0.0% -0.3% 0.1% 0.2% 0.3% 0.2% 0.1% 0.2% 0.3% -0.1% 0.1% 0.3% 0.3% 0.4% 0.2% -0.2% 0.3% 0.4% 0.3% -0.4%
European Real Estate -0.2% -0.1% -0.7% -0.4%
Japanese Real Estate -0.1% -0.7% -0.3% -0.3% -0.1% -0.2%
Global REITs 0.1% 0.3% 0.0% 0.1% 0.1% 0.1% 0.4%
Cash 0.3% 0.2% 0.3% 0.5% 0.3% 0.3% 0.4% 0.4% 0.4% 0.3% 0.2% 0.1% 0.1% 0.1% 0.0% 0.0% 0.1% 0.0% 0.1% 0.0% 0.1% 0.1% 0.1% 0.1% 0.1% 0.0% 0.0% 0.1% 0.0% 0.1% 0.0% 0.0%
Short UK Inflation 0.2% -0.2% 0.0% -0.3% 0.4% -0.4% 1.2% -0.1% -0.4% -0.1%
UK Inflation Real Yield 0.1% -0.1% 0.0%
Short UK Real Yields -0.1% -0.1%
UK Short-term Interest Rates -0.5% 0.8% 0.4% 0.1% 0.3% 0.8% 0.1% -0.6% 0.2% 0.1% 0.7% 0.4%
European Short-term Interest Rates -0.1% 0.1% -1.1% 0.6% 1.8% 1.0% -0.7% 0.2% 0.0% 0.2% 0.0%
Australian Short-term Interest Rates 0.0% -0.4% 0.1% 0.2% 0.0% 0.3% 0.0% 0.1% 0.0% 0.1% 0.0% 0.1% 0.4%
Swedish Short-term Interest Rates 0.1% 0.0% -0.1% 0.2% 0.4%
Medium-term UK Interest Rates 0.2% -0.3% -0.1%
Medium-term European Interest Rates 2.4% 0.9% -0.1% 0.8%
Medium-term Australian Interest Rates -0.4% 1.1% 0.0%
Long-term European Interest Rates 0.3% -0.3% -0.3% -0.6% 0.1% 0.0% 0.0% -0.7% 0.7% 2.7% -0.9% -0.5% 0.5% -0.2% 0.5% 0.8% 0.3%
Long-term US Interest Rates 0.2% -0.2% -0.6% 0.5% -0.8% 0.1%
Long-term Japanese Interest Rates 1.0% 0.8% 0.3% -0.2% 1.0% 0.5% 0.5% 0.6% 0.9% -0.5% 0.3% 0.4% 0.2%
Japanese Interest Rates -0.2% -0.1%
Australian interest rate flattener 0.0% 0.0%
Credit Curve Steepener 0.0% 0.1% 0.0%
UK Curve Steepener 0.4% 0.3%
European Bond Yield Steepener 0.0% 0.0% 0.0% 0.0% 0.1% 0.1% 0.0% 0.1% 0.1% 0.0% 0.1%
European Long-End Curve Steepener 0.0% -0.2% 0.0% 0.1% 0.1% 0.0%
European Duration (Forward Start) 0.0% 0.1% 0.1% 0.1% 0.0%
US Long Bond Yields (Forward-Start) 0.3% -1.1% -0.1% 0.0% 2.3% 0.2% 0.0% 0.0% 0.1% 0.1%
US steepener 0.0% 0.3% -0.2% 0.1%
Mexican Government Bonds vs Euro -0.2% 0.2% 0.5% 0.3% 0.4% -0.1% 0.6% -0.2% -0.1% -0.1% 0.2% 0.3%
Brazilian Government Bonds 0.0%
UK Inflation Linked Asset Swap 0.5% 0.1%
FTSE 100 Dividends 0.0% -0.3% -0.1% 0.1% 0.1% 0.0% 0.0% 0.0% 0.0% 0.0% 0.0% 0.0% 0.0% 0.0%
Nikkei Dividends -0.1% 0.0% 0.2% 0.1% 0.1%
UK Equity Volatility 0.3% 0.2% 0.1% 0.2% 0.4% 0.1%
Long Equity Variance -0.1% -0.2% 1.9% -0.1% -0.3% -0.1% -0.3%
Long Equity Volatility 0.1% -0.2% -0.1% -0.1% -0.2%
Suppressed European Interest Rate Volatility 0.0% 0.0% -0.1%
Long Sterling vs Euro 0.1% -3.1% 1.0% 1.3% -0.6% 0.2% 0.2% 0.4% -0.2% -0.1%
Long Sterling vs South African Rand 0.0% -0.1% 0.0% 0.0% 0.0%
Long US Dollar vs Sterling 0.1% -0.2% 0.0% -0.2% -0.1% 0.5% 0.0% 0.0% 0.5%
Long US Dollar vs Japanese Yen -0.2% 0.2% 0.0% -0.8% 0.5% -0.1% -0.3% 0.3% 0.1% -0.2% -0.2% -0.1% 0.1% -0.1% -0.2% 0.1% 0.4% -0.2% -0.1% 0.5% 0.4% 0.2% 0.1% 0.3% 0.0% 0.0%
Long US Dollar vs Euro 0.3% 0.8% 0.8% -0.4% -0.3% 0.2% 0.6% 0.7% -1.0% 0.5% -0.9% -0.3% 0.5% 0.5% -0.3% 0.6% -0.3% -0.3% 0.3% -0.1% -0.4% -0.2% 0.0% 0.1%
Long US Dollar vs South African Rand -0.2%
Long US Dollar vs Canadian Dollar -0.1% -0.1% 0.2% -0.6% 0.1% 0.3% 0.4% -0.3% 0.4% 0.5% -0.5%
Long Swedish Krona vs Euro -0.2% 0.5% 0.0% 0.5% 0.0%
Long Brazilian Real vs Japanese Yen -0.4% 1.0% -0.9% -1.3% 0.5% 0.9% 0.3%
Long Brazilian Real vs Chilean Peso 0.2% -0.1% 0.1% 0.2% -0.2% -0.1%
Long Brazilian Real vs Czech Koruna -0.4% 0.0%
Long Brazilian Real vs Australian Dollar -0.4% 0.0%
Long Turkish Lira vs Sterling 0.2% 0.0%
Long Turkish Lira vs Canadian Dollar -0.2% 0.1% -0.1%
Long Turkish Lira vs South Aftrican Rand -0.6% 0.3%
Long Polish Zloty vs Czech Koruna -0.3% 0.4% 0.2% -0.2% 0.0% 0.2% -0.2% 0.0% -0.2%
Long Norwegian Krone vs Euro -0.3% 0.1% 0.1%
Long Norwegian Krone vs Swiss Franc 0.8%
Long Mexican Peso vs Australian Dollar 0.0% 0.0% 0.2% 0.3% -0.1% 0.3% -0.3% -0.1%
Long Indian Rupee vs Singapore Dollar -0.1% 0.2% -0.2% -0.3%
Other FX 0.1% 0.0% 0.1% 0.0% 0.1% 0.0% 0.2% 0.0% 0.0% -0.5% -0.2% -0.2% 0.1% 0.0% 0.1% 0.1% 0.1% 0.1% 0.0% 0.0% 0.0% 0.0% 0.0% 0.0% 0.0% 0.0% 0.1% -0.1% -0.1% -0.1% 0.0% 0.0%
UK Large v Mid Cap UK equity -0.4% -0.9% -0.3% 0.6% 0.3% 0.3% -0.5% 0.5% 0.2% 0.5% -0.9% -0.6%
Swiss Equity vs German Equity 0.0% -0.3% 0.2% -0.1% 0.2% 0.0% 0.1% -0.3% -0.1% -0.1% 0.1% -0.6% -0.1% -0.8% -0.3%
Korean Equity vs Japanese Equity 0.0% 0.1%
Korean Equity vs European Equity 0.3% -0.1% 0.0% 0.0% 0.1% -0.5%
US Large vs US Small Cap Equity 0.1% -0.2% 0.0% -0.7% -0.1% 0.1% 0.7% -0.3% -0.1% 0.1% 0.0% -0.2% -0.3% 0.0% -0.3%
US Equity Technology vs US Equity Small Cap 0.1% -0.4% 0.7% -0.3% 0.1% -0.3% -0.2% 0.0% 0.0% 0.1% -0.1% 0.4%
US Equity Technology vs Taiwan -0.1% 0.2% 0.1% 0.1% 0.2% 0.1%
German vs French Equity 0.0% -0.2% 0.4% -0.2% 0.0%
Japanese vs Korean Equity -0.2% 0.3% -0.2% 0.1%
Global Miners vs Swiss Equity -0.1% -0.1%
Financial Sector vs Broad Credit -0.6% -0.4% 1.0% 0.3% 0.2% 0.3% 0.0% 0.2% -1.1% 0.7% -0.2% -0.8% 0.0% 1.0% -0.7%
Broad vs Financial Sector Equity 0.1% 0.3% 0.6% 0.3% 0.0% 0.9%
European Financials Capital Structure 0.1% 0.1% 0.1% -0.4% 0.0%
High Yield vs Equity -0.3% -0.6% 1.2% 0.0% -0.1% -0.3%
European vs Japanese Medium Term Interest Rates -0.4% 0.9% 0.4%
US vs Japanese Medium Term Interest Rates 0.6% 0.9%
Australian vs Japanese Medium Term Interest Rates 0.1% -0.6% 0.2% 0.2% 0.1%
Japanese vs European Forward-Start Interest Rates 0.5% -0.1%
European vs US and Japanese Duration 0.0% 0.2% 0.2%
US Short-term Swap Spread 0.9%
UK vs German Short-rates 0.1% 0.5% 0.2%
Australian vs German Short-rates 0.1% 0.1%
Australian vs US Short-rates -0.2% -0.1% 0.1% 0.0% 0.4% 0.2%
Swedish vs German Short-rates 0.0% 0.0% 0.1% -0.2% 0.0%
Swedish vs US Short-rates -0.2% -0.2%
UK vs European Forward-Start Duration 0.1% 0.0% 0.0% 0.0%
German vs French Interest rates 0.0% -0.1% 0.0% -0.1%
US Inflation vs UK Inflation -0.5% -1.5% 0.0% 0.3%
UK vs European Inflation -0.1%
UK Inflation vs Long Gilts 0.2%
USD vs GBP Volatility Spread 0.1% 0.0% 0.1%
European Equity Volatility 0.2% 0.0% 0.0% -0.1% 0.0%
S&P Call Calendar Spread 0.1%
German Equity vs UK Equity Relative Volatility -0.2% 2.0% -0.1% -0.1% 0.1%
China Equity vs UK Equity Volatility 0.0% 0.1% -0.5% 0.2% 0.0% 0.0% 0.0% 0.1% 0.1% -0.1% 0.0% 0.0% 0.0% 0.0% 0.0% 0.0% 0.0% 0.0% 0.0%
Relative Variance Income -0.2% 1.2% 0.0% 0.2% 0.1% 0.4% -0.3% -0.7% 0.1% 0.5% 0.4% -0.2% -1.0% 0.3% 0.3% -0.3% 0.2% 0.3% 0.2% 0.0% 0.0% 0.0%
Hang Seng vs S&P volatility -0.2% 0.0% -0.1% -0.1% 0.0% 0.0% 0.0%
Chinese vs. Japanese currency volatility 0.0% 0.0% -0.2% 0.0%
Asian Basket vs US Variance 0.0% 0.0% 0.0% 0.0% 0.0% 0.0%
Residual 0.0% 0.6% -0.5% -0.1% 0.2% 0.4% 0.0% 0.1% 0.0% 0.0% -0.2% -0.2% 0.2% 0.2% 0.0% 0.0% 0.2% 0.0% -0.1% -0.1% 0.2% -0.2% -0.1% -0.1% 0.0% 0.0% 0.0% 0.0% -0.2% -0.1% 0.0% -0.1%
GARS total 3.7% 3.7% 2.0% 2.3% 2.7% 1.7% -3.7% 0.9% -4.2% 3.4% 0.8% 5.5% 11.3% 1.5% 4.6% 2.2% 4.8% -0.7% 0.2% -1.3% 1.2% 3.7% 5.5% -1.7% 3.0% 1.4% 4.0% -0.6% 0.4% 3.6% 0.4% 1.4%
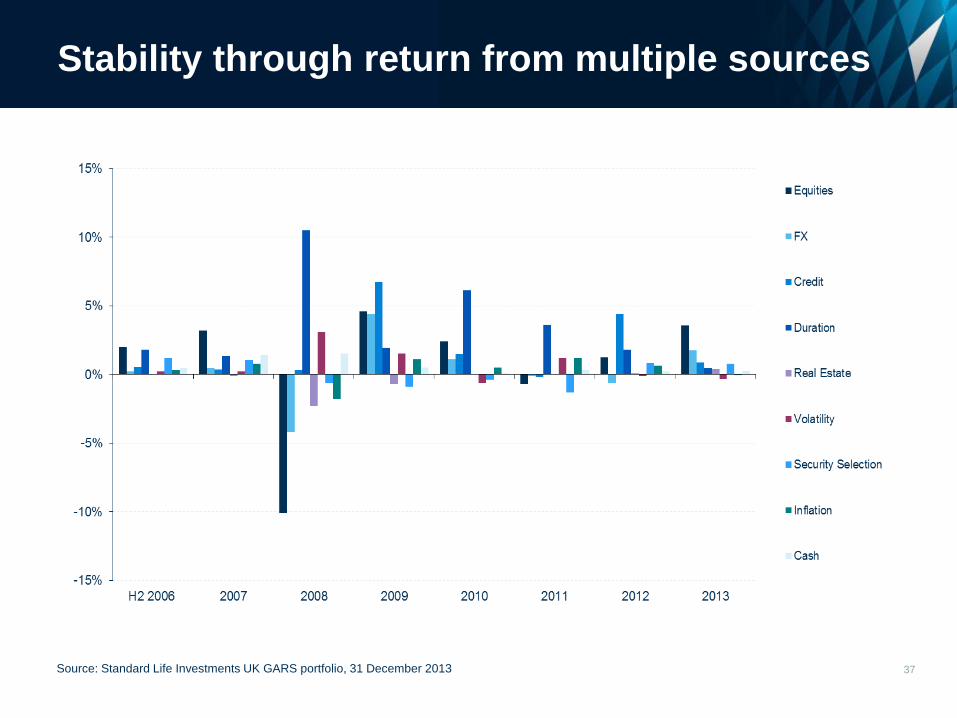
Stability through return from multiple sources
37 Source: Standard Life Investments UK GARS portfolio, 31 December 2013

Monthly GARS SICAV performance
38
Converted € performance of £, institutional pooled pension portfolio to the 26/01/2011. GARS SICAV portfolio performance from the 27/01/2011
Source: Standard Life Investments, 31/08/2014
GROSS Portfolio 6m Euribor Relative NET Portfolio 6m Euribor Relative GROSS Portfolio MCSI World (€) Relative
Sep-13 0.39 0.03 0.36 Sep-13 0.32 0.03 0.29 Sep-13 0.39 2.32 -1.88
Oct-13 1.48 0.03 1.45 Oct-13 1.41 0.03 1.38 Oct-13 1.48 3.49 -1.94
Nov-13 1.46 0.03 1.44 Nov-13 1.39 0.03 1.36 Nov-13 1.46 1.67 -0.21
Dec-13 0.72 0.03 0.69 Dec-13 0.65 0.03 0.62 Dec-13 0.72 2.15 -1.40
Jan-14 0.55 0.03 0.51 Jan-14 0.48 0.03 0.44 Jan-14 0.55 -1.58 2.16
Feb-14 0.39 0.03 0.36 Feb-14 0.33 0.03 0.30 Feb-14 0.39 2.58 -2.13
Mar-14 -0.36 0.03 -0.39 Mar-14 -0.43 0.03 -0.46 Mar-14 -0.36 0.41 -0.76
Apr-14 -0.06 0.04 -0.10 Apr-14 -0.13 0.04 -0.17 Apr-14 -0.06 0.47 -0.53
May-14 1.17 0.03 1.13 May-14 1.09 0.03 1.06 May-14 1.17 3.71 -2.45
Jun-14 0.18 0.03 0.15 Jun-14 0.11 0.03 0.08 Jun-14 0.18 1.49 -1.28
Jul-14 1.83 0.02 1.81 Jul-14 1.76 0.02 1.74 Jul-14 1.83 0.72 1.11
Aug-14 0.19 0.02 0.17 Aug-14 0.12 0.02 0.10 Aug-14 0.19 3.86 -3.53
YTD 3.94 0.25 3.69 YTD 3.36 0.25 3.11 YTD 3.94 12.14 -7.31
1 Year (%) 8.21 0.36 7.82 1 Year (%) 7.30 0.36 6.91 1 Year (%) 8.21 21.86 -11.21
2 Years (% p.a.) 6.57 0.36 6.19 2 Years (% p.a.) 5.67 0.36 5.29 2 Years (% p.a.) 6.57 17.40 -9.23
3 Years (% p.a.) 8.35 0.67 7.63 3 Years (% p.a.) 7.44 0.67 6.72 3 Years (% p.a.) 8.35 19.64 -9.43
4 Years (% p.a.) 5.77 0.88 4.85 4 Years (% p.a.) 4.88 0.88 3.96 4 Years (% p.a.) 5.77 14.84 -7.90
5 Years (% p.a.) 7.89 0.91 6.92 5 Years (% p.a.) 6.98 0.91 6.02 5 Years (% p.a.) 7.89 14.92 -6.12
Q2 07 1.85 1.06 0.78 Q2 07 1.63 1.06 0.57 Q2 07 1.85 5.18 -3.16
Q3 07 2.27 1.16 1.10 Q3 07 2.06 1.16 0.89 Q3 07 2.27 -2.70 5.11
Q4 07 1.29 1.24 0.05 Q4 07 1.07 1.24 -0.16 Q4 07 1.29 -4.99 6.60
Q1 08 -3.99 1.14 -5.07 Q1 08 -4.19 1.14 -5.27 Q1 08 -3.99 -15.99 14.28
Q2 08 0.63 1.25 -0.61 Q2 08 0.42 1.25 -0.82 Q2 08 0.63 -0.86 1.51
Q3 08 -4.37 1.33 -5.62 Q3 08 -4.57 1.33 -5.82 Q3 08 -4.37 -4.83 0.48
Q4 08 3.32 1.10 2.19 Q4 08 3.10 1.10 1.97 Q4 08 3.32 -20.84 30.51
Q1 09 0.74 0.54 0.20 Q1 09 0.53 0.54 -0.01 Q1 09 0.74 -7.64 9.07
Q2 09 5.48 0.38 5.08 Q2 09 5.26 0.38 4.85 Q2 09 5.48 14.58 -7.94
Q3 09 11.30 0.29 10.98 Q3 09 11.06 0.29 10.74 Q3 09 11.30 12.81 -1.34
Q4 09 1.52 0.26 1.26 Q4 09 1.31 0.26 1.05 Q4 09 1.52 6.14 -4.35
Q1 10 4.56 0.24 4.30 Q1 10 4.33 0.24 4.08 Q1 10 4.56 9.58 -4.59
Q2 10 2.30 0.25 2.04 Q2 10 2.08 0.25 1.83 Q2 10 2.30 -3.33 5.82
Q3 10 4.76 0.29 4.46 Q3 10 4.54 0.29 4.24 Q3 10 4.76 2.19 2.52
Q4 10 -0.64 0.32 -0.95 Q4 10 -0.85 0.32 -1.16 Q4 10 -0.64 10.98 -10.47
Q1 11 0.24 0.34 -0.10 Q1 11 0.03 0.34 -0.31 Q1 11 0.24 -0.82 1.07
Q2 11 -1.29 0.43 -1.71 Q2 11 -1.50 0.43 -1.92 Q2 11 -1.29 -1.46 0.17
Q3 11 1.60 0.45 1.15 Q3 11 1.39 0.45 0.93 Q3 11 1.60 -9.79 12.63
Q4 11 3.65 0.44 3.20 Q4 11 3.43 0.44 2.99 Q4 11 3.65 11.34 -6.90
Q1 12 5.52 0.34 5.16 Q1 12 5.30 0.34 4.94 Q1 12 5.52 8.90 -3.10
Q2 12 -1.90 0.25 -2.14 Q2 12 -2.10 0.25 -2.35 Q2 12 -1.90 -0.16 -1.74
Q3 12 3.31 0.16 3.15 Q3 12 3.09 0.16 2.93 Q3 12 3.31 5.39 -1.97
Q4 12 1.34 0.10 1.24 Q4 12 1.12 0.10 1.02 Q4 12 1.34 0.14 1.19
Q1 13 3.78 0.08 3.69 Q1 13 3.56 0.08 3.48 Q1 13 3.78 10.75 -6.30
Q2 13 -0.37 0.08 -0.45 Q2 13 -0.58 0.08 -0.66 Q2 13 -0.37 -0.38 0.00
Q3 13 0.21 0.09 0.12 Q3 13 -0.01 0.09 -0.10 Q3 13 0.21 3.99 -3.64
Q4 13 3.70 0.09 3.60 Q4 13 3.48 0.09 3.38 Q4 13 3.70 6.21 -2.96
Q1 14 0.58 0.10 0.48 Q1 14 0.37 0.10 0.28 Q1 14 0.58 1.37 -0.78
Q2 14 1.28 0.10 1.18 Q2 14 1.07 0.10 0.97 Q2 14 1.28 5.75 -4.23
12/06/06 - 31/08/14 (% p.a.) 7.85 2.07 5.66 12/06/06 - 31/08/14 (% p.a.) 6.94 2.07 4.77 12/06/06 - 31/08/14 (% p.a.) 7.85 6.09 1.66
2007 7.31 4.53 2.66 2007 6.41 4.53 1.80 2007 7.31 -1.18 8.60
2008 -4.53 4.92 -9.01 2008 -5.34 4.92 -9.77 2008 -4.53 -37.24 52.13
2009 20.07 1.47 18.32 2009 19.05 1.47 17.33 2009 20.07 26.72 -5.25
2010 11.33 1.10 10.12 2010 10.40 1.10 9.19 2010 11.33 20.14 -7.33
2011 4.21 1.67 2.50 2011 3.33 1.67 1.64 2011 4.21 -1.84 6.17
2012 8.38 0.85 7.47 2012 7.46 0.85 6.56 2012 8.38 14.75 -5.54
2013 7.44 0.34 7.07 2013 6.53 0.34 6.17 2013 7.44 21.86 -11.84
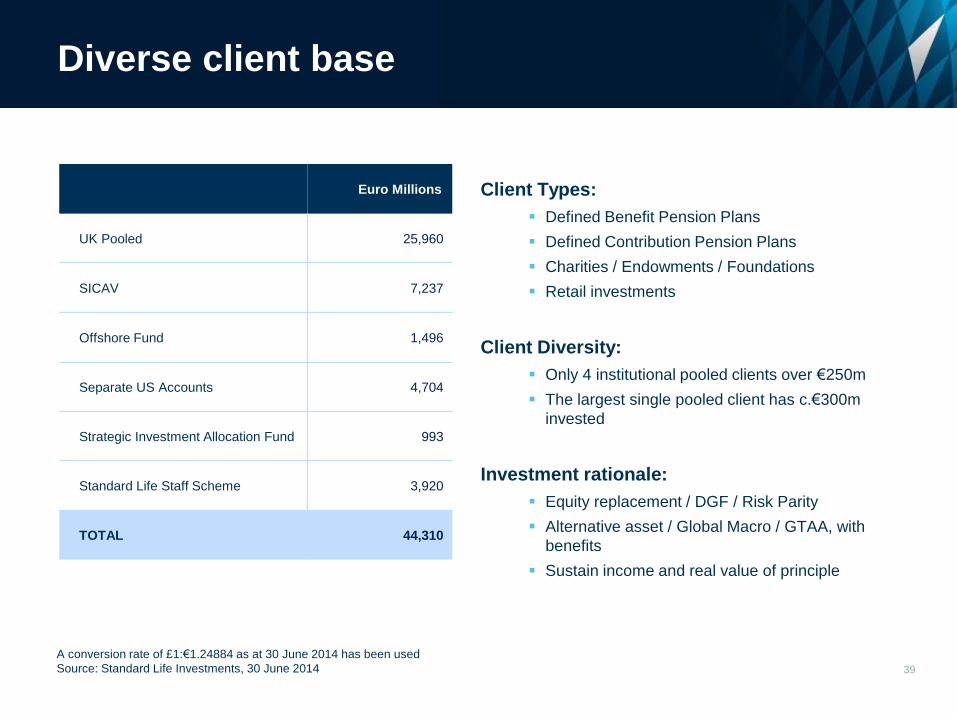
Diverse client base
39
A conversion rate of £1:€1.24884 as at 30 June 2014 has been used
Source: Standard Life Investments, 30 June 2014
Client Types:
Defined Benefit Pension Plans
Defined Contribution Pension Plans
Charities / Endowments / Foundations
Retail investments
Client Diversity:
Only 4 institutional pooled clients over €250m
The largest single pooled client has c.€300m
invested
Investment rationale:
Equity replacement / DGF / Risk Parity
Alternative asset / Global Macro / GTAA, with
benefits
Sustain income and real value of principle
Euro Millions
UK Pooled 25,960
SICAV 7,237
Offshore Fund 1,496
Separate US Accounts 4,704
Strategic Investment Allocation Fund 993
Standard Life Staff Scheme 3,920
TOTAL 44,310

40
Global Absolute Return Strategies Fund SICAV
Launch Date
Benchmark
Performance target
Robust risk control
Charges
ISIN Codes
Bloomberg
• 26th January 2011
• 6 month Euribor
• 6 month Euribor + 5 % (Gross of fees) over a 3 year rolling basis
• Expected volatility range: 4% to 8%
• Sophisticated portfolio
• Retail (Share Class A) 1.60% AMC, Expected TER 1.70%
• Institutional (Share Class D) 0.85% AMC, Expected TER 0.90%
• Retail (Share Class A)
Acc LU0548153104
Dist LU0548153443
• Institutional (Share Class D)
Acc LU0548153799
Dist LU0548153955
• Retail (Share Class A)
Acc SLGLARA LX
Dist SLGLARI LX
• Institutional (Share Class D)
Acc SLGLDIA LX
Dist SLGLDII LX

Euro GARS
Firm Disclosures
A complete list and description of all of the firm's composites are available from Standard Life Investments. There are no minimum asset levels set below which portfolios are not included in a composite. All
performance calculations and returns have been calculated gross of management fees. All returns are presented on an all-inclusive basis and as such all capital gains interest income and withholding taxes
have been taken into account in market valuations and returns. All indices are on a gross of tax basis apart from FTSE UK indices which are net of Withholding Tax. There are no Non-Fee-Paying portfolios
included in any composite. The Daily True Time Weighted Rate of Return methodology has been used from 2001 apart from unitised Cash Property GARS and MyFolio products where NAV performance is
used. Prior to this NAV performance was used for all products.
Additional information regarding policies for calculating and reporting returns is available upon request. Dispersion is calculated using high/low difference. Standard Life Investments 'The Firm' consists of all
fee-paying funds managed by Standard Life Investments and its Subsidiaries which include Standard Life Investments (Mutual Funds) Limited SLTM Limited Standard Life Investments (Corporate Funds)
Limited Standard Life Investments (USA) Limited and Standard Life Investments (Asia) Limited. Past performance results from Standard Life Investments Limited UK Firm and Standard Life Investments
Limited Irish Firm have been linked to form the performance record of the new firm Standard Life Investments. The new firm was created on 01/01/2008. Standard Life Investments claims compliance with the
Global Investment Performance Standards (GIPS®) and has prepared and presented this report in compliance with the GIPS standards. Standard Life Investments has been independently verified by
PricewaterhouseCoopers LLP for the periods 1996 to 2013. The verification report is available upon request. Verification assesses whether (1) the firm has complied with all the composite construction
requirements of the GIPS standards on a firm-wide basis and (2) the firm’s policies and procedures are designed to calculate and present performance in compliance with the GIPS standards. Verification
does not ensure the accuracy of any specific composite presentation
Composite Disclosures
Derivatives may be used to vary exposure to markets and express views on the direction of currencies, interest rates, sectors and securities to enhance capital return, limit downside volatility and preserve
capital
Includes part period return for 2006 from 01/07
The composite includes funds that invest in a highly diversified strategy including equities, bonds, property and cash with a derivative overlay in options, futures, swaps and currency forwards to deliver a
positive absolute return. The fund is benchmarked against 6 month Euribor
This composite includes GBP denominated funds that are converted into EUR using 3 month EUR Libor and 3 month GBP Libor rates
The standard annual fee applicable to the composite is 0.85%, but individual fees are negotiated on an account basis
41
Composite Name Euro GARS
Creation Date 01-07-2006
Firm Standard Life Investments
Currency EUR
Report End Date 31-12-2013
Composite Group Converted GARS
Benchmark 6 Month Euribor
Anlzd Return
(Composite)
Anlzd Return
(Benchmark)
3 Year Anzld StdDev
(Composite)
3 Year Anzld StdDev
(Benchmark) Dispersion Market Value Total Firm Assets
% of Firm
Assets
Number of
Portfolios
Dec 2006 6.88 1.82 NA NA NA 46,559,943 189,614,161,508 0.02 1
Dec 2007 7.31 4.53 NA NA NA 328,936,430 186,833,049,375 0.18 1
Dec 2008 -4.79 4.92 NA NA NA 858,822,210 122,024,692,127 0.70 1
Dec 2009 19.90 1.47 7.13 0.45 NA 2,424,300,230 142,954,997,814 1.70 1
Dec 2010 11.25 1.10 7.25 0.50 NA 8,013,954,428 153,735,850,524 5.21 1
Dec 2011 4.03 1.67 5.73 0.11 NA 1,421,412,636 147,648,287,247 0.96 1
Dec 2012 8.38 0.85 4.75 0.12 NA 3,310,696,559 165,118,070,004 2.01 1
Dec 2013 7.44 0.34 4.67 0.17 NA 6,166,575,083 180,260,162,963 3.42 1
42
The information shown relates to the past. Past performance is not a guide to the future. The value of investment can go down as well as up. Any data contained herein which is attributed to a third party ("Third Party Data") is the property of (a) third party supplier(s) (the “Owner”) and is licensed for use by Standard Life**. Third Party Data may not be copied or distributed. Third Party Data is provided “as is” and is not warranted to be accurate, complete or timely. To the extent permitted by applicable law, none of the Owner, Standard Life** or any other third party (including any third party involved in providing and/or compiling Third Party Data) shall have any liability for Third Party Data or for any use made of Third Party Data. Past performance is no guarantee of future results. Neither the Owner nor any other third party sponsors, endorses or promotes the fund or product to which Third Party Data relates. ** Standard Life means the relevant member of the Standard Life group, being Standard Life plc together with its subsidiaries, subsidiary undertakings and associated companies (whether direct or indirect) from time to time." Standard Life Investments Limited is registered in Scotland (SC123321) at 1 George Street, Edinburgh EH2 2LL. Standard Life Investments Limited is authorised and regulated by the Financial Conduct Authority. Calls may be monitored and/or recorded to protect both you and us and help with our training. www.standardlifeinvestments.com © 2014 Standard Life, images reproduced under licence